Abstract
Subcellular location of a protein is one of the key functional characters as proteins must be localized correctly at the subcellular level to have normal biological function. In this paper, a novel method named LOCSVMPSI has been introduced, which is based on the support vector machine (SVM) and the position-specific scoring matrix generated from profiles of PSI-BLAST. With a jackknife test on the RH2427 data set, LOCSVMPSI achieved a high overall prediction accuracy of 90.2%, which is higher than the prediction results by SubLoc and ESLpred on this data set. In addition, prediction performance of LOCSVMPSI was evaluated with 5-fold cross validation test on the PK7579 data set and the prediction results were consistently better than the previous method based on several SVMs using composition of both amino acids and amino acid pairs. Further test on the SWISSPROT new-unique data set showed that LOCSVMPSI also performed better than some widely used prediction methods, such as PSORTII, TargetP and LOCnet. All these results indicate that LOCSVMPSI is a powerful tool for the prediction of eukaryotic protein subcellular localization. An online web server (current version is 1.3) based on this method has been developed and is freely available to both academic and commercial users, which can be accessed by at http://Bioinformatics.ustc.edu.cn/LOCSVMPSI/LOCSVMPSI.php.
INTRODUCTION
With the development of genome projects, the amount of sequence data increases in an astonishing speed, and a lot of data have been accumulated. To narrow the huge gap between the enormous amount of raw sequence data and the experimental characterization of the corresponding proteins, people therefore have to find computational ways to efficiently analyze these data. Subcellular location of a protein is one of the key functional characters as proteins must be localized correctly at the subcellular level to have normal biological function. Compared with experimental methods, computational prediction methods that can provide fast, automatic and accurate assignment of protein subcellular location is very desirable, especially for high-through analysis of large-scale genome sequences. Many computational methods have been developed for the prediction of the subcellular location of proteins, and most of them are working as online web servers which can be accessed from Internet. Currently, some available web servers for subcellular localization are NNPSL (1), PSORTII (2), iPSORT (3), PSORTB (4), TargetP (5), SubLoc (6), SignalP (7) SecretomeP (8), CELLO (9), LOCnet (10), Proteome Analyst Server (11) and ESLPred (12). We have developed a web server named LOCSVMPSI, based on a novel prediction method, which uses the evolutionary information of a protein sequence to improve prediction performance. In this method, the position-specific scoring matrix (PSSM) of the protein sequence data is extracted from the profile generated by PSI-BLAST (13), and then be transformed into a 400-dimension input vector. Moreover, the four-part amino acid composition in a protein sequence is also used as part of the feature vector. Thus, the final input feature vector in LOCSVMPSI has the length of 480. As for the classifier, multiclass support vector machines (SVMs) with probability estimates by pairwise coupling were used to give prediction result and the probability of the sequence belonging to each class. By all these efforts, significant improvement in prediction quality can be achieved, which enables the LOCSVMPSI another competitive method in subcellular location prediction.
METHODS AND DATA SETS
Data sets
Two data sets are used in the web server of LOCSVMPSI, which users can freely choose as the training model for prediction. The first one was generated by Reinhardt and Hubbard (1), which contained 2427 eukaryotic protein sequences belonging to four location categories: nuclear, cytoplasmic, mitochondrial and extracellular (1097 nuclear, 684 cytoplasmic, 321 mitochondrial and 325 extracellular proteins). These sequences were extracted from SWISSPROT release 33.0 and included only those sequences that appeared complete and had reliable experimental annotations for localization. In this data set, no two sequences have >90% identity. This data set was also used in the development of SubLoc, NNPSL and ESLpred. The second was generated by Park and Kanehisa (14), which contained 7579 eukaryotic protein sequences belonging to 12 location categories: 671 chloroplast, 1241 cytoplasmic, 40 cytoskeleton, 114 endoplasmic reticulum, 861 extracellular, 47 Golgi apparatus, 93 lysosomal, 727 mitochondrial, 1932 nuclear, 125 peroxisomal, 1674 plasma membrane and 54 vacuolar. These sequences were extracted from the SWISSPROT database release 39.0 and all the proteins were annotated for only one position. For convenience, these two data sets are referred to as the RH2427 and PK7579 data sets.
Sequence profiles generated by PSI-BLAST
The idea of adopting PSSM extracted from sequence profiles generated by PSI-BLAST as input information was first proposed by Jones (15). Now it has been widely used in protein secondary structure prediction and residue solvent accessibility prediction. Here, we introduce the LOCSVMPSI method as the first use of PSSM in subcellular localization. First, we adopted the same nonredundant (NR) protein database used by the PROFKing method for protein secondary structure prediction (16). This database included all known databases: GenBank translations, PDB, SWISSPROT, PIR and PRF database, and had ∼430 000 protein sequences. Then, all transmembrane region, coiled coil segments and low complexity regions in this database were filtered using a program named pfilt (15). After that, every protein sequence in our data sets was searched against this filtered NR database. The parameters we used for PSI-BLAST was the same as those used in the paper of Jones, i.e. three iterations with a cutoff E-value of 0.001.
Prediction procedure
We used PSSM and four-part amino acid compositions as the input vector. The PSSM of a protein sequence extracted from the profile of PSI-BLAST was used to generate a 400-dimensional input vector by summing up all rows in the PSSM corresponding to the same amino acid in the primary sequence. After that, every element in this input vector was divided by the length of the sequence and then scaled to the range of 0–1 by using the standard sigmoid function:
| 1 |
In addition, the four-part amino acid compositions were also used to code the protein sequence. The sequence was equally divided into four parts, then, the occurrence frequency of each amino acid in each part was calculated and added to the former input vector. So the length of the final input vector was 480.
Measurements for performance
We used four measurements separately to measure the prediction performance of LOCSVMPSI. The percentage accuracy of each kind of subcellular locations is defined as:
| 2 |
where TPi and FNi are the true positive and false negative number for subcellular location i. The Matthew's correlation coefficient (MCC) is also used as a measure of the prediction performance for each location:
| 3 |
where TNi and FPi are the true negative and false positive number for subcellular location i. The overall accuracy is given by:
| 4 |
where N is the total number of sequences in the data set. In addition, the mathematical average of accuracies for all subcellular locations is defined as:
| 5 |
where k is the number of subcellular locations in the data set.
RESULTS AND DISCUSSION
Comparison with other prediction methods
First, we compared LOCSVMPSI with other existing prediction methods on the RH2427 data set with a jackknife test; all prediction results are listed in Table 1. In every prediction results, our method consistently outperformed the method based on the Markov model (17) and the fuzzy k-NN method (18). Especially, for the overall prediction accuracy, which can be regarded as the most important measurement for prediction performance, LOCSVMPSI achieved a quite high overall accuracy of 90.2%. As for the SubLoc method, which uses amino acid composition and SVM, the overall prediction accuracy of LOCSVMPSI was ∼10% higher, and the accuracy for each location was also better than SubLoc. These results prove that even using similar machine learning technology, prediction performance can be significantly improved with the usage of the PSI-BLAST profiles that offers important evolutionary information about protein subcellular locations. Compared with the method used in ESLpred, which is developed by adopting PSI-BLAST and SVM, LOCSVMPSI achieved better prediction performance although the results of ESLpred for nuclear proteins were slightly better. Next, we evaluated the performance of LOCSVMPSI by using the PK7579 data set with 5-fold cross validation, shown in Table 2. In every prediction result, our method outperformed the previous method based on several SVMs using composition of both amino acids and amino acid pairs as input (14), especially for those locations that contribute relatively small parts of the data set, such as Golgi apparatus, peroxisomal and vacuolar. The overall accuracy of LOCSVMPSI is more than 5% higher, and the mathematical averaged accuracy is ∼10% higher. These results also show that the profile of PSI-BLAST contains more information about subcellular location than composition of both amino acids and amino acid pairs. Finally, we used the whole RH2427 and PK7579 data sets as the training set separately and evaluated the prediction performance of our method on the SWISSPROT new-unique data set (19). All prediction results were compared with some existing methods and shown in Table 3. LOCSVMPSI performed best in mitochondrial, nuclear and cytoplasmic protein detection although the prediction result for extracellular proteins was relatively low. The overall accuracy using the PK7579 reached 79.9%, which was 15.7% higher than the best existing LOCnet method on this data set. At the same time, LOCSVMPSI also outperformed much better than SubLoc in this test, which is consistent with the prediction results on jackknife test on the RH2427 data set. To illustrate the performance of LOCSVMSPI more effectively, we calculated confusion matrices for all above prediction analyses as the supplemental information, which can be used to make further comparisons with other prediction methods.
Table 1.
Comparison of prediction performance for different methods on the RH2427 data set with a jackknife test
| Location | Markov model | SubLoc | Fuzzy k-NN | ESLpred* | LOCSV | MPSI | ||||
|---|---|---|---|---|---|---|---|---|---|---|
| Acc | Mcc | Acc | Mcc | Acc | Mcc | Acc | Mcc | Acc | Mcc | |
| Cytoplasmic | 78.1 | 0.60 | 76.9 | 0.64 | 86.7 | 0.76 | 85.2 | 0.79 | 86.6 | 0.83 |
| Extracellular | 62.2 | 0.63 | 80.0 | 0.78 | 83.7 | 0.87 | 88.9 | 0.91 | 92.6 | 0.93 |
| Mitochondrial | 69.2 | 0.53 | 56.7 | 0.58 | 60.4 | 0.63 | 68.2 | 0.69 | 80.4 | 0.81 |
| Nuclear | 74.1 | 0.68 | 87.4 | 0.75 | 92.0 | 0.83 | 95.3 | 0.87 | 94.5 | 0.86 |
| Overall (%) | 73.0 | – | 79.4 | – | 85.2 | – | 88.0 | – | 90.2 | – |
Prediction results of ESLpred were obtained by a 5-fold cross validation test.
Table 2.
Comparison of LOCSVMPSI with the previous method on the PK7579 data set with 5-fold cross validation
| Location | Previous method | LOCSVMPSI |
|---|---|---|
| Accuracy (%) | Accuracy (%) | |
| Chloroplast | 72.3 | 76.5 |
| Cytoplasmica | 72.2 | 76.4 |
| Cytoskeleton | 58.5 | 60.0 |
| ER | 46.5 | 61.4 |
| Extracellular | 78.0 | 89.7 |
| Golgi apparatus | 14.6 | 46.8 |
| Lysosomal | 61.8 | 62.4 |
| Mitochondrial | 57.4 | 68.2 |
| Nuclear | 89.6 | 91.5 |
| Peroxisomal | 25.2 | 41.6 |
| Plasma membrane | 92.2 | 94.7 |
| Vacuolar | 25.0 | 40.7 |
| Overall (%) | 78.2 | 83.5 |
| LA (%) | 57.9 | 67.5 |
LA, the mathematical average of accuracies for all subcellular locations.
Table 3.
Performance comparison for different prediction methods on test set of the SWISSPROT new-unique
| Method | Overall (%) | Accuracy (%) | |||
|---|---|---|---|---|---|
| Extracellular | Cytoplasmic | Nuclear | Mitochondrial | ||
| NNPSL | 51.5 | 62 | 40 | 58 | 68 |
| SubLoc | 57.4 | 52 | 57 | 71 | 63 |
| PSORTII | 53.2 | 32 | 51 | 74 | 62 |
| TargetP | – | 77 | – | – | 78 |
| NetSeq | 56.2 | 70 | 55 | 68 | 28 |
| LOCnet | 64.2 | 86 | 56 | 73 | 53 |
| LOC3DnetPHD | 43.4 | 59 | 58 | 33 | 35 |
| LOCSVMPSI | 73.2 | 64 | 69 | 79 | 85 |
| LOCSVMPSI* | 79.9 | 77 | 74 | 84 | 88 |
LOCSVMPSI, prediction using the RH2427 data set for training and modeling.
LOCSVMPSI*, prediction using the PK7579 data set for training and modeling.
All other prediction results for comparison were obtained from (19).
Reliability index to the prediction
The reliability of prediction is an important factor that can give users more information about the quality of prediction. We adopted reliability index (RI) to indicate the level of certainty in the prediction of a submitted sequence. The multiclass SVM with probability estimates by pairwise coupling used in LOCSVMPSI can produce classification probability of belonging to each location for a submitted sequence. Hence, the RI can be defined according to the difference between the highest and the second highest classification probabilities:
| 6 |
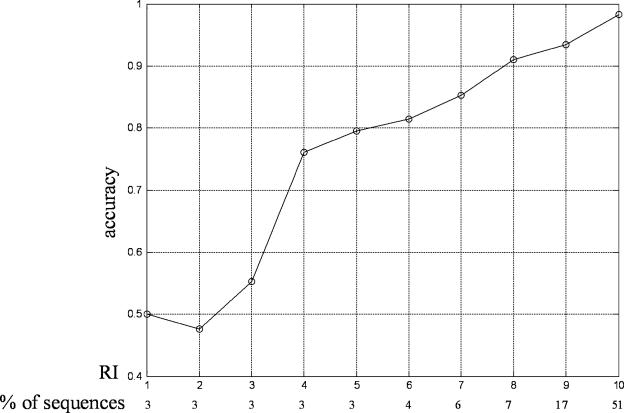
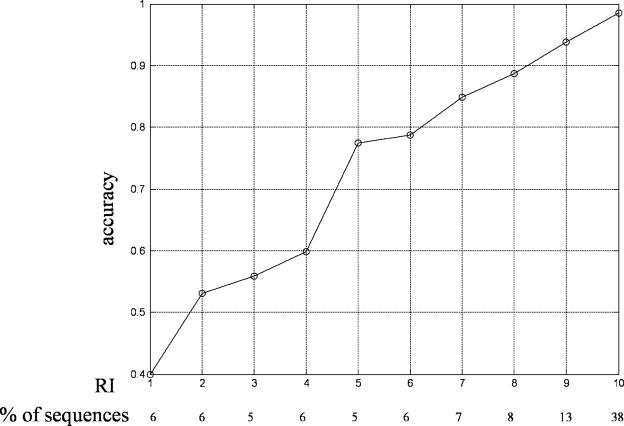
Figures 1 and 2 show the prediction accuracies with different RI on the RH2427 data set with a jackknife test and on the PK7579 data set with 5-fold cross-validation, respectively. As shown in both figures, the higher the RI is, the higher reliability the prediction gain. When RI is >8, prediction accuracy on both two data sets is >90%. At the same time, the fraction of protein sequences also becomes larger with the increase of RI, especially for RI is 9 and 10, which also suggest that RI is a good indicator of prediction reliability.
Figure 1.
The expected prediction accuracy and the fraction of sequences in the RH2427 data set with each RI.
Figure 2.
The expected prediction accuracy and the fraction of sequences in the PK7579 data set with each RI.
DESCRIPTION OF THE WEB SERVER
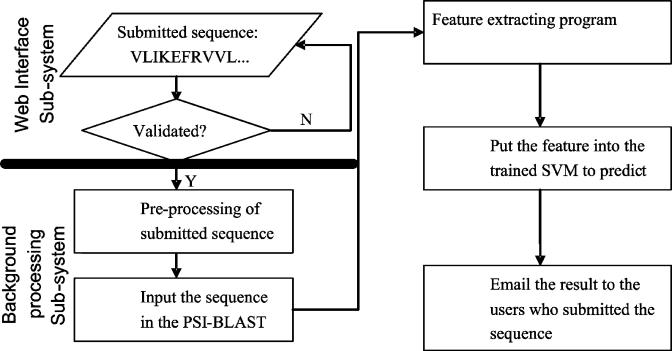
We developed a web server named LOCSVMPSI, which is available by accessing http://Bioinformatics.ustc.edu.cn/LOCSVMPSI/LOCSVMPSI.php. It can be basically divided into two subsystems: (i) the web interface system, which is written with PHP and HTML language and (ii) the background process system, which is written with C and python language (shown in Figure 3). The web interface subsystem mainly deals with the works of receiving information from the user and checking the validity of the submitted data. The background processing subsystem does all the computation of prediction works: extracting features from the sequences, predicting with SVM and emailing the results to the users. We used LIBSVM as the toolkit for the implementation of LOCSVMPSI, which can be freely downloaded from http://www.csie.ntu.edu.tw/~cjlin/libsvm.
Figure 3.
The brief flow chart of the prediction procedure using the web server of LOCSVMPSI.
INPUT, OUTPUT AND OPTIONS
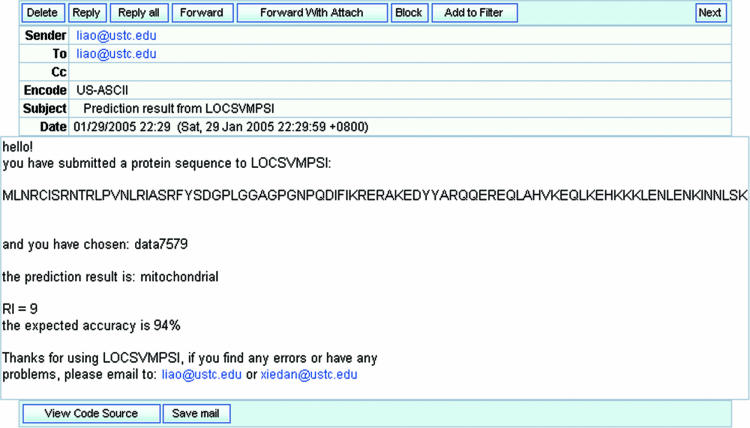
LOCSVMPSI is a very friendly and easy-to-use web server. Users can both submit sequences of plain format and FASTA format. Users can choose to type or paste the sequence in the box or upload multiple sequences (FASTA format) in a file for batch prediction. As the prediction result will email to the users, the users should input their email addresses. Currently, two training models are available that are trained with the RH2427 and PK7579 data set. Because the prediction result is assigned to the location with the highest confidence that belongs to one particular subcellular location in the training data set, using models of RH2427 and PK7579 can give prediction for 4 and 12 different locations, respectively. Figure 4 shows a sample email received by the user.
Figure 4.
One sample email with prediction results and other information sent to the user by LOCSVMPSI.
CONCLUSION
In this work, we have presented a new SVM-based prediction method and an online web server for subcellular localization of eukaryotic proteins. Comprehensive comparisons of various measurements for prediction performance on three data sets show that the important evolutionary information contained in PSSM can be very helpful for the prediction of the location of a query protein. Further analysis suggests that the LOCSVMPSI method is not only a good complement for some existing methods, such as TargetP and PSORT II, but also a reasonable alternative for some prediction methods from a machine-learning approach. As for the speed of the web server of LOCSVMPSI, we estimated with the RH2427 data set as test data set and the model trained with RK7579 data set. It took 55 128 s (∼22.7 s per sequence) for our web server to give prediction for total 2427 protein sequences, because a submitted sequence is first searched against a NR database before prediction. It also should be pointed out that the speed of prediction procedure is heavily dependent on the hardware environment and a powerful server computer will be very helpful to make the web server more efficient. Another way of improving speed is to build a precomputed database, in which the subcellular locations of protein sequences are predicted in advance and users can browse or search in this database. In fact, there are already some precomputed subcellular localization databases that are available online now, such as PSORTdb (20), LOCtarget (10), etc. In addition, according to the biological experiment, some proteins can be found in more than one subcellular location. Prediction of subcellular localization by considering this multilocation feature has been recently discussed in budding yeast (21). In this paper, the nearest-neighbor method and assessment of prediction performance for multilocation proteins have been introduced. Moreover, the CELLO prediction system has been developed recently for gram-negative proteins, which can also handle multiple locations (9). This system also uses SVM for prediction, so the training and prediction procedure of CELLO can be adopted by LOCSVMPSI in the case of multilocation. Our further work will be focused on this aspect and a new version of LOCSVMPSI will be able to give prediction for multilocation proteins.
SUPPLEMENTARY MATERIAL
Supplementary Material is available at NAR Online.
Supplementary Material
Acknowledgments
Funding to pay the Open Access publication charges for this article was provided by Department of Science and Technology of China (2004 AA235110) and Key Research Project of USTC.
Conflict of interest statement. None declared.
REFERENCES
- 1.Reinhardt A., Hubbard T. Using neural networks for prediction of the subcellular location of proteins. Nucleic Acids Res. 1998;26:2230–2236. doi: 10.1093/nar/26.9.2230. [DOI] [PMC free article] [PubMed] [Google Scholar]
- 2.Horton P., Nakai K. Better prediction of protein cellular localization sites with the k nearest neighbors classifier. Proc. Int. Conf. Intell. Syst. Mol. Biol. 1997;5:147–152. [PubMed] [Google Scholar]
- 3.Bannai H., Tamada Y., Maruyama O., Nakai K., Miyano S. Extensive feature detection of N-terminal protein sorting signals. Bioinformatics. 2002;18:298–305. doi: 10.1093/bioinformatics/18.2.298. [DOI] [PubMed] [Google Scholar]
- 4.Gardy J.L., Spencer C., Wang K., Ester M., Tusnady G.E., Simon I., Hua S., deFays K., Lambert C., Nakai K., Brinkman F.S. PSORTB: improving protein subcellular localization prediction for Gram-negative bacteria. Nucleic Acids Res. 2003;31:3613–3617. doi: 10.1093/nar/gkg602. [DOI] [PMC free article] [PubMed] [Google Scholar]
- 5.Emanuelsson O., Nielsen H., Brunak S., von Heijne G. Predicting subcellular localization of proteins based on their N-terminal amino acid sequence. J. Mol. Biol. 2000;300:1005–1016. doi: 10.1006/jmbi.2000.3903. [DOI] [PubMed] [Google Scholar]
- 6.Hua S., Sun Z. Support vector machine approach for protein subcellular localization prediction. Bioinformatics. 2001;17:721–728. doi: 10.1093/bioinformatics/17.8.721. [DOI] [PubMed] [Google Scholar]
- 7.Bendtsen J.D., Nielsen H., von Heijne G., Brunak S. Improved prediction of signal peptides: SignalP 3.0. J. Mol. Biol. 2004;340:783–795. doi: 10.1016/j.jmb.2004.05.028. [DOI] [PubMed] [Google Scholar]
- 8.Bendtsen J.D., Jensen L.J., Blom N., Von Heijne G., Brunak S. Feature-based prediction of non-classical and leaderless protein secretion. Protein Eng. Des. Sel. 2004;17:349–356. doi: 10.1093/protein/gzh037. [DOI] [PubMed] [Google Scholar]
- 9.Yu C.S., Lin C.J., Hwang J.K. Predicting subcellular localization of proteins for Gram-negative bacteria by support vector machines based on n-peptide compositions. Protein Sci. 2004;13:1402–1406. doi: 10.1110/ps.03479604. [DOI] [PMC free article] [PubMed] [Google Scholar]
- 10.Nair R., Rost B. LOCnet and LOCtarget: subcellular localization for structural genomics targets. Nucleic Acids Res. 2004;32:W517–W521. doi: 10.1093/nar/gkh441. [DOI] [PMC free article] [PubMed] [Google Scholar]
- 11.Lu Z., Szafron D., Greiner R., Lu P., Wishart D.S., Poulin B., Anvik J., Macdonell C., Eisner R. Predicting subcellular localization of proteins using machine-learned classifiers. Bioinformatics. 2004;20:547–556. doi: 10.1093/bioinformatics/btg447. [DOI] [PubMed] [Google Scholar]
- 12.Bhasin M., Raghava G.P. ESLpred: SVM-based method for subcellular localization of eukaryotic proteins using dipeptide composition and PSI-BLAST. Nucleic Acids Res. 2004;32:W414–W419. doi: 10.1093/nar/gkh350. [DOI] [PMC free article] [PubMed] [Google Scholar]
- 13.Altschul S.F., Madden T.L., Schaffer A.A., Zhang Z., Miller W., Lipman D.J. Gapped BLAST and PSI-BLAST: a new generation of protein database search programs. Nucleic Acids Res. 1997;25:3389–3402. doi: 10.1093/nar/25.17.3389. [DOI] [PMC free article] [PubMed] [Google Scholar]
- 14.Park K.J., Kanehisa M. Prediction of protein subcellular locations by support vector machines using compositions of amino acids and amino acid pairs. Bioinformatics. 2003;19:1656–1663. doi: 10.1093/bioinformatics/btg222. [DOI] [PubMed] [Google Scholar]
- 15.Jones D.T. Protein secondary structure prediction based on position-specific scoring matrices. J. Mol. Biol. 1999;292:195–202. doi: 10.1006/jmbi.1999.3091. [DOI] [PubMed] [Google Scholar]
- 16.Ouali M., King R.D. Cascaded multiple classifiers for secondary structure prediction. Protein Sci. 2000;9:1162–1176. doi: 10.1110/ps.9.6.1162. [DOI] [PMC free article] [PubMed] [Google Scholar]
- 17.Yuan Z. Prediction of protein subcellular locations using Markov chain models. FEBS Lett. 1999;451:23–26. doi: 10.1016/s0014-5793(99)00506-2. [DOI] [PubMed] [Google Scholar]
- 18.Huang Y., Li Y. Prediction of protein subcellular locations using fuzzy kNN method. Bioinformatics. 2004;20:21–28. doi: 10.1093/bioinformatics/btg366. [DOI] [PubMed] [Google Scholar]
- 19.Nair R., Rost B. Better prediction of subcellular localization by combing evolutionary and structural information. Proteins. 2003;53:917–930. doi: 10.1002/prot.10507. [DOI] [PubMed] [Google Scholar]
- 20.Gardy J.L., Laird M.R., Chen F., Rey S., Walsh C.J., Ester M., Brinkman F.S.L. PSORTb v.2.0: expanded prediction of bacterial protein subcellular localization and insights gained from comparative proteome analysis. Bioinformatics. 2005;21:617–623. doi: 10.1093/bioinformatics/bti057. [DOI] [PubMed] [Google Scholar]
- 21.Cai Y.D., Chou K.C. Predicting 22 protein localizations in budding yeast. Biochem. Biophys. Res. Commun. 2004;323:425–428. doi: 10.1016/j.bbrc.2004.08.113. [DOI] [PubMed] [Google Scholar]
Associated Data
This section collects any data citations, data availability statements, or supplementary materials included in this article.


