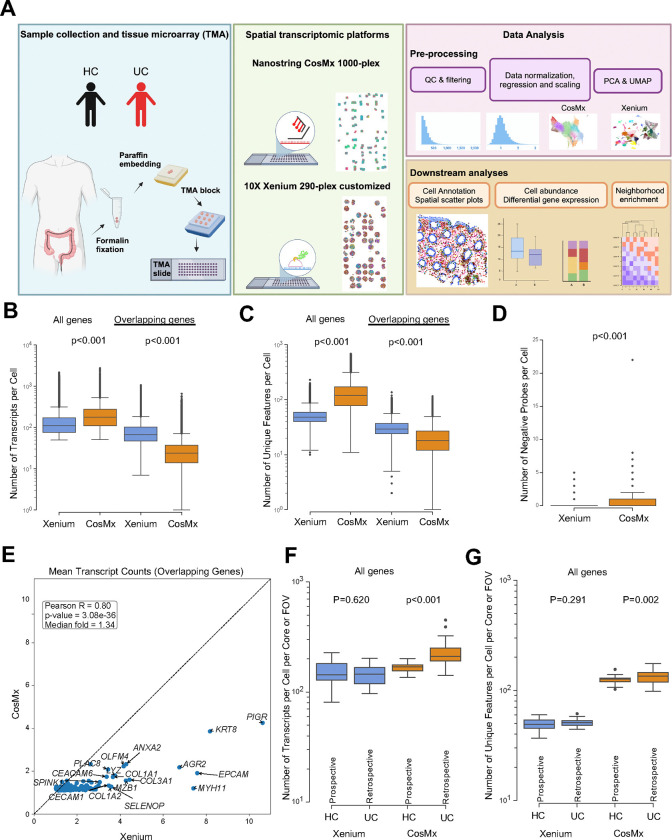
Fig. 1|. Schematic of study design and technical performance comparison between Xenium and CosMx platforms.
(A) Schematic of study design. Created with BioRender.com (B,C) Number of (B) transcripts and (C) unique features detected per cell within the Xenium and CosMx datasets, calculated using the complete gene panel for each platform (Xenium, 290 genes; CosMx, 1,000 genes; left) and limited to the 159 overlapping genes across both panels (right). (D) Number of negative probes detected per cell within the Xenium and CosMx (Xenium mean=0.03 and CosMx mean=0.37). (E) Correlation between average transcript counts in Xenium and CosMx for the 159 overlapping genes. (F,G) Number of (F) transcripts and (G) unique features detected per cell per core or FOV within the Xenium and CosMx datasets split by prospectively collected HC and retrospectively collected UC. For panels B, C, D, F and G box and whisker plots, the band indicates the median, the box indicates the first and third quartiles, and the whiskers indicate minimum and maximum value within the upper/lower fence (upper fence=Q3+1.5xIQR and lower fence= Q1–1.5xIQR), only outlier points are shown. Mann-Whitney, two-tailed tests, p-values are indicated.

