Abstract
Nonsynonymous single nucleotide polymorphisms (nsSNPs) are prevalent in genomes and are closely associated with inherited diseases. To facilitate identifying disease-associated nsSNPs from a large number of neutral nsSNPs, it is important to develop computational tools to predict the nsSNP's phenotypic effect (disease-associated versus neutral). nsSNPAnalyzer, a web-based software developed for this purpose, extracts structural and evolutionary information from a query nsSNP and uses a machine learning method called Random Forest to predict the nsSNP's phenotypic effect. nsSNPAnalyzer server is available at http://snpanalyzer.utmem.edu/.
INTRODUCTION
Assessing susceptibility to diseases based on an individual's genotype has long been a central theme of genetics studies. Among inherited gene variations in humans, nonsynonymous single nucleotide polymorphisms (nsSNPs) that lead to an amino acid change in the protein product are most relevant to human inherited diseases (1). nsSNPs can be classified into two categories according to their phenotypic effects: those that cause deleterious effects on protein functions and are hence disease-associated and those that are functionally neutral. Given the huge number of nsSNPs already discovered (2,3), a major challenge is to predict which of them are potentially disease associated. Computational tools have been developed to predict the nsSNP's phenotypic effect, e.g. the SIFT server (4) and the PolyPhen server (5). Recently, studies have shown that combining information obtained from multiple sequence alignment and three-dimensional protein structure can increase the prediction accuracy (6). nsSNPAnalyzer server integrates multiple sequences alignment and protein structure analysis to identify disease-associated nsSNPs. nsSNPAnalyzer takes a protein sequence and the accompanying nsSNP as inputs and reports whether the nsSNP is likely to be disease-associated or functionally neutral. nsSNPAnalyzer also provides additional useful information about the nsSNP to facilitate the biological interpretation of results, e.g. structural environment class and multiple sequence alignment.
PROGRAM DESCRIPTION
Algorithm and implementation
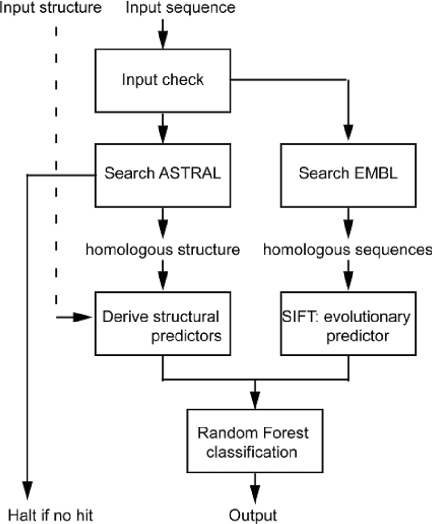
nsSNPAnalyzer is a web server implementing machine learning methods for nsSNP classification. The program design and data flow are illustrated in Figure 1. Briefly, on receiving the input sequence, nsSNPAnalyzer searches the ASTRAL database (7) for homologous protein structures. This step is skipped if the users provide the protein structure themselves. nsSNPAnalyzer calculates three types of information from user's input: (i) the structural environment of the SNP, including the solvent accessibility, environmental polarity and secondary structure (8); (ii) the normalized probability of the substitution in the multiple sequence alignment (9); and (iii) the similarity and dissimilarity between the original amino acid and mutated amino acid. nsSNPAnalyzer then uses a machine learning method called Random Forest (10) to classify the nsSNPs. Random Forest is a classifier consisting of an ensemble of tree-structured classifiers. The Random Forest classifier was trained to optimally combine the heterogeneous sources of predictors using a curated training dataset prepared from the SwissProt database (11). Several recent studies have demonstrated the better performance of Random Forest over other machine learning approaches (12–14). For the nsSNP phenotypic effect prediction, we also found that Random Forest gave the best results on this training dataset. In a cross-validation test, the false positive rate is 38% and the false negative rate is 21% (15). The nsSNPAnalyzer web server is implemented on a Linux Redhat 8.0 platform with the Common Gateway Interface scripts written in PHP.
Figure 1.
The program design and data flow of nsSNPAnalyzer.
Input
Two inputs are mandatory: protein sequence in FASTA format and the nsSNP identities to be analyzed. An nsSNP is denoted as X#Y, where X is the original amino acid in one letter, # is the position of the substitution (starting from 1), and Y is the mutated amino acid in one letter. Multiple nsSNPs in a protein should be separated by new-line characters. Users may provide the inputs by copy-paste or file uploading. In addition to the two mandatory inputs, users may also upload an accompanying protein structure file in PDB format if they want their own structure to be used. Finally, because the calculation usually takes a while, users may provide their email addresses to avoid waiting online. The results are sent to the email address when the calculations are finished. Users can use the sample data to learn the input format and perform a demo run.
Output
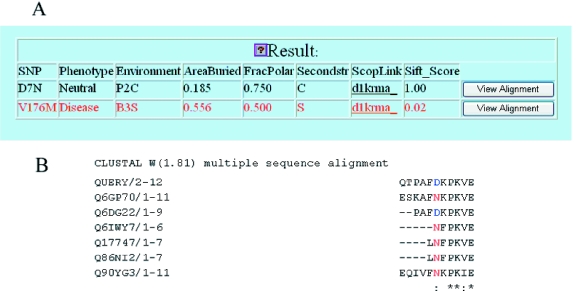
The results of nsSNPAnalyzer are displayed on a web page and stored on the server for a week. A link to the results page can also be sent to the user via email. A sample output is shown in Figure 2. The output includes several calculated features of the nsSNP: (i) predicted phenotypic class (disease-associated versus neutral); (ii) a hyperlink to the homologous structure with a SCOP identifier (7); (iii) the normalized probability of the substitution calculated by the SIFT program (4); (iv) area buried score, a measure of the solvent accessibility; (v) fraction polar score, a measure of environmental polarity related to hydrogen bond formation; (vi) secondary structure (helix, sheet and coil); and (vii) the structural environment class, a discrete environment class definition by combining features (iv)–(vi) (8). The area buried score and fraction polar score are calculated by the ENVIRONMENT program (8), and the secondary structure is calculated by the STRIDE program (16). The user can click the ‘View Alignment’ button to see the local sequence alignment spanning the substitution sites and get a direct sight on the mutability of the substitution. The original amino acid is highlighted in blue, and the mutated amino acid is highlighted in red.
Figure 2.
The output of nsSNPAnalyzer. (A) The main output page of nsSNPAnalyzer. The user can click the icon to see the interpretation of each field. (B) An example of local sequence alignment spanning the nsSNP (D7N). The original amino acid (D) is highlighted in blue, and the mutated amino acid (N) is highlighted in red.
FUTURE PLANS
Considering the remarkable CPU cost of calculation, we are planning to provide precalculated results for all human nsSNPs in the dbSNP (17) with homologous structures available. We will also test the applicability of extracting structural predictors from predicted structures to eliminate the requirement of having experimentally determined structures available.
Acknowledgments
We thank Drs James Bowie, Roland Luethy and David Eisenberg for providing the computer program for calculating the structural environments. We thank Drs Pauline Ng and Steven Henikoff for providing access to the SIFT program. We thank Drs Leo Breiman, Andy Liaw and Matthew Wiener for providing access to the Random Forest package. We thank the anonymous reviewers for their helpful suggestions. This work was partly supported by a Phrma Foundation grant to Y.C. Funding to pay the Open Access publication charges for this article was provided by the faculty startup grant from UTHSC.
Conflict of interest statement. None declared.
REFERENCES
- 1.Stenson P.D., Ball E.V., Mort M., Phillips A.D., Shiel J.A, Thomas N.S., Abeysinghe S., Krawczak M., Cooper D.N. Human Gene Mutation Database (HGMD): 2003 update. Hum. Mutat. 2003;21:577–581. doi: 10.1002/humu.10212. [DOI] [PubMed] [Google Scholar]
- 2.Fredman D., Siegfried M., Yuan Y.P., Bork P., Lehvaslaiho H., Brookes A.J. HGVbase: a human sequence variation database emphasizing data quality and a broad spectrum of data sources. Nucleic Acids Res. 2002;30:387–391. doi: 10.1093/nar/30.1.387. [DOI] [PMC free article] [PubMed] [Google Scholar]
- 3.Irizarry K., Kustanovich V., Li C., Brown N., Nelson S., Wong W., Lee C.J. Comprehensive EST analysis of single nucleotide polymorphism across coding regions of the human genome. Nature Genet. 2000;26:233–236. doi: 10.1038/79981. [DOI] [PubMed] [Google Scholar]
- 4.Ng P.C., Henikoff S. SIFT: predicting amino acid changes that affect protein function. Nucleic Acids Res. 2003;31:3812–3814. doi: 10.1093/nar/gkg509. [DOI] [PMC free article] [PubMed] [Google Scholar]
- 5.Ramensky V., Bork P., Sunyaev S. Human non-synonymous SNPs: server and survey. Nucleic Acids Res. 2002;30:3894–3900. doi: 10.1093/nar/gkf493. [DOI] [PMC free article] [PubMed] [Google Scholar]
- 6.Saunders C.T., Baker D. Evaluation of structural and evolutionary contributions to deleterious mutation prediction. J. Mol. Biol. 2002;322:891–901. doi: 10.1016/s0022-2836(02)00813-6. [DOI] [PubMed] [Google Scholar]
- 7.Chandonia J.M., Hon G., Walker N.S., Lo Conte L., Koehl P., Levitt M., Brenner S.E. The ASTRAL compendium in 2004. Nucleic Acids Res. 2004;32:D189–D192. doi: 10.1093/nar/gkh034. [DOI] [PMC free article] [PubMed] [Google Scholar]
- 8.Bowie J.U., Luthy R., Eisenberg D. A method to identify protein sequences that fold into a known three-dimensional structure. Science. 1991;253:164–170. doi: 10.1126/science.1853201. [DOI] [PubMed] [Google Scholar]
- 9.Ng P.C., Henikoff S. Predicting deleterious amino acid substitutions. Genome Res. 2001;11:863–874. doi: 10.1101/gr.176601. [DOI] [PMC free article] [PubMed] [Google Scholar]
- 10.Breiman L. 2001. Random Forest. Technical Report, Stat. Dept. UCB.
- 11.Yip Y.L., Scheib H., Diemand A.V., Gattiker A., Famiglietti L.M., Gasteiger E., Bairoch A. The Swiss-Prot variant page and the ModSNP database: a resource for sequence and structure information on human protein variants. Hum. Mutat. 2003;23:464–470. doi: 10.1002/humu.20021. [DOI] [PubMed] [Google Scholar]
- 12.Svetnik V., Liaw A., Tong C., Culberson J.C., Sheridan R.P., Feuston B.P. Random Forest: a classification and regression tool for compound classification and QSAR modeling. J. Chem. Inf. Comput. Sci. 2003;43:1947–1958. doi: 10.1021/ci034160g. [DOI] [PubMed] [Google Scholar]
- 13.Wu B., Abbott T., Fishman D., McMurray W., Mor G., Stone K., Ward D., Williams K., Zhao H. Comparison of statistical methods for classification of ovarian cancer using mass spectrometry data. Bioinformatics. 2003;19:1636–1643. doi: 10.1093/bioinformatics/btg210. [DOI] [PubMed] [Google Scholar]
- 14.Gunther E.C., Stone D.J., Gerwien R.W., Bento P., Heyes M.P. Prediction of clinical drug efficacy by classification of drug-induced genomic expression profiles in vitro. Proc. Natl Acad. Sci. USA. 2003;100:9608–9613. doi: 10.1073/pnas.1632587100. [DOI] [PMC free article] [PubMed] [Google Scholar]
- 15.Bao L., Cui Y. Prediction of the phenotypic effects of nonsynonymous single nucleotide polymorphisms using structural and evolutionary information. Bioinformatics. 2005 doi: 10.1093/bioinformatics/bti365. doi:10.1093/bioinformatics/bti365. [DOI] [PubMed] [Google Scholar]
- 16.Frishman D., Argos P. Knowledge-based protein secondary structure assignment. Proteins. 1995;23:566–579. doi: 10.1002/prot.340230412. [DOI] [PubMed] [Google Scholar]
- 17.Sherry S.T., Ward M.H., Kholodov M., Baker J., Phan L., Smigielski E.M., Sirotkin K. dbSNP: the NCBI database of genetic variation. Nucleic Acids Res. 2001;29:308–311. doi: 10.1093/nar/29.1.308. [DOI] [PMC free article] [PubMed] [Google Scholar]


