Abstract
The growing amount of information resulting from the increasing number of publicly available genomes and experimental results thereof necessitates the development of comprehensive systems for data processing and analysis. In this paper, we describe the current state and latest developments of our BRIGEP bioinformatics software system consisting of three web-based applications: GenDB, EMMA and ProDB. These applications facilitate the processing and analysis of bacterial genome, transcriptome and proteome data and are actively used by numerous international groups. We are currently in the process of extensively interconnecting these applications. BRIGEP was developed in the Bioinformatics Resource Facility of the Center for Biotechnology at Bielefeld University and is freely available. A demo project with sample data and access to all three tools is available at https://www.cebitec.uni-bielefeld.de/groups/brf/software/brigep/. Code bundles for these and other tools developed in our group are accessible on our FTP server at ftp.cebitec.uni-bielefeld.de/pub/software/.
INTRODUCTION
In the last few years, advances in high-throughput sequencing techniques have dramatically decreased time and costs needed for obtaining the DNA sequence of an organism. Currently, more than 1300 finished or ongoing genome projects are listed in the GOLD (1) database. For most organisms under investigation more and more experimental data are collected, e.g. by transcriptomics, proteomics and metabolomics experiments.
To process and analyze these large amounts of datasets, software packages for each of these areas have been developed in recent years [e.g. ARTEMIS (2) and ERGO (3) for genome annotation or BASE (4) and GECKO (5) for gene expression data analysis]. Approaches to link and integrate data originating from these different areas have also been found to be a useful means for collecting new knowledge in an easy and more intuitive way [e.g. PRIME (6) and HaloLex (www.halolex.mpg.de)]. In the Bioinformatics Resource Facility of the Center for Biotechnology, we have developed the following three applications: GenDB (7) for genome annotation, EMMA (8) for transcriptome analyses and ProDB (9) for proteome analyses. Each system exhibits a full-featured analysis software for the respective area, ranging from raw data processing to diverse and advanced functions for analyzing the processed data.
In this report, we briefly describe the newly developed web frontends available for each of these applications as well as first examples of their ongoing integration enabled by the BRIDGE integration layer (10). Using the resulting new web-based system BRIGEP, our collaborators from all over the world are able to process and analyze their data, as well as sharing it with other members of the community. As we have included a project management component into our software, a user or a community can also decide whether and when their data are made available to the public.
In the following, we illustrate the functionality of the three web interfaces and show examples of the ongoing integration of the data.
DESIGN AND IMPLEMENTATION
The BRIGEP system currently provides access to the three applications GenDB, EMMA and ProDB. The underlying data are stored in SQL databases. Each system has a three-tiered architecture based on an object-relational mapping provided by the in-house developed O2DBI (11) tool. The storage back-end can be accessed via an application programmer's interface (API). Standard methods for retrieving, manipulating and deleting objects in a persistent manner are automatically generated, while additional methods for more complex tasks are added manually as extensions to each class.
To be able to restrict data access to authorized users, data are organized in projects, e.g. a GenDB project is usually set up for the annotation of a single genome or a ProDB project for maintaining proteome data of a single organism. Projects and their members are managed using the General Project Management System, for which we have developed a web interface as well (not described here). The BRIDGE layer is used to interconnect data objects from different projects.
Based on the described API and the BRIDGE layer, which is provided in Perl, the web functionality is established using Perl CGI scripts. Via these scripts, authorized users (members of a project) can handle data input, manipulation, processing and retrieval. Complex analyses like the automated annotation of a whole genome or the analyses of a large bundle of mass spectra (MS) can also be initiated and subsequently visualized via the web interface. Documentation for users as well as for programmers is provided in the form of a WIKI (http://moinmoin.wikiwikiweb.de/).
Details on the applications
In the following, we describe the three web applications in greater detail.
GenDB is an open source genome annotation system for prokaryotic genomes that has been in development for more than five years. Given a genome sequence, the system integrates numerous tools to perform a gene prediction and a functional annotation of the genome.
For the prediction of coding sequences (CDSs) we rely on an approach combining Glimmer (12) and Critica (13) [Reganor (14)]. For each CDS we perform an automatic function prediction (Metanor) using a combination of standard tools like BLAST (15), HMMer (16) and InterPro (17) as a basis for assigning a gene name, gene product, description, functional category, GO (18) numbers and other attributes. These automatic annotations can be curated and enriched manually via the web interface. In order to keep track of all automatic and manual annotations, GenDB stores a history of all annotations in the form of a list.
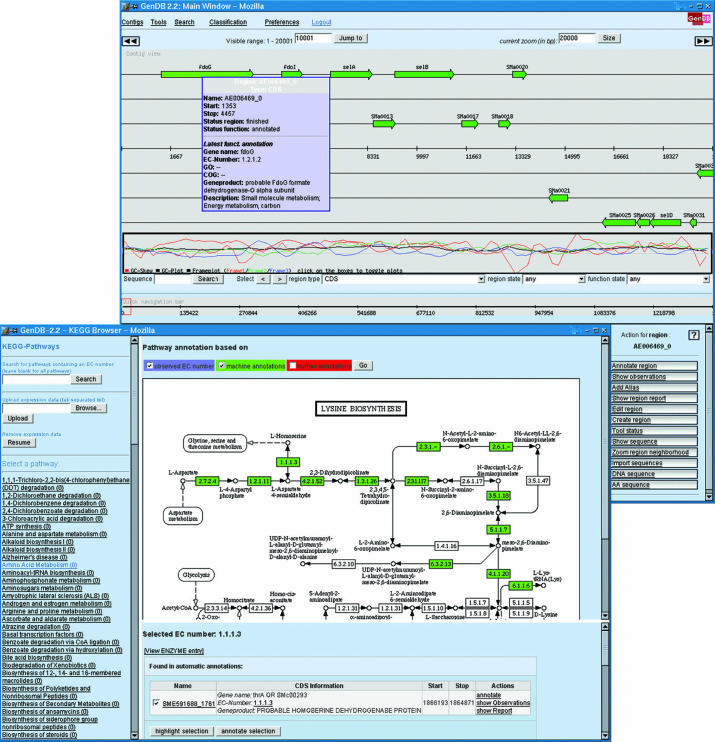
Among other views, the web interface provides a contig view (Figure 1) for easy navigation, a report on each CDS, a region editor for changing gene starts, a region creator for manually creating new genes and a virtual 2D gel. For navigating all genes according to their functional classification the system provides a KEGG (19) (Figure 1), COG (20) and GO browser. Import and export can be done for FASTA, EMBL and GenBank files. Currently, more than 25 genomes are being analyzed in various national and international cooperations using this web interface.
Figure 1.
The newly implemented GenDB web interface provides a multitude of views for browsing a genome and for manipulating a genome annotation. The up-most screenshot shows the GenDB contig view that can be used for navigating from a region in the genome to a specific gene or region on a contig. An informal reconstruction of metabolic pathways can be visualized using the KEGG browser shown in the lower part of the screenshot: here, automatically annotated enzymes are highlighted in green.
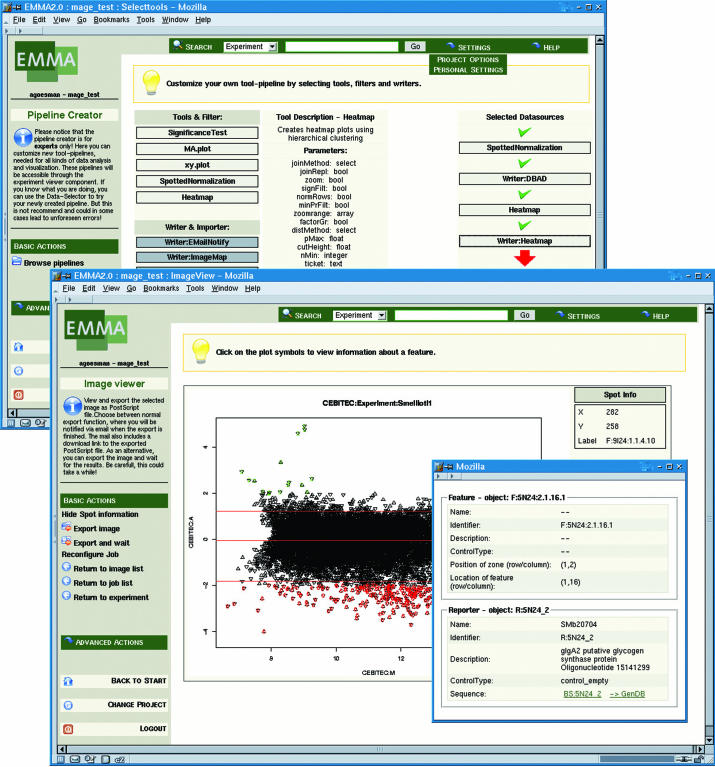
EMMA is a MAGE (21) compliant software platform for transcriptome data analysis including a LIMS component (ArrayLIMS). Data can be uploaded in standard formats and linked to the GenDB data. The system provides customizable pipelines for data processing and has a modular architecture that can easily be extended. Several visualization methods like scatter-plots or heat maps (Figure 2) are also available. EMMA features detailed reports about spots, genes and their corresponding measurements.
Figure 2.
Two examples of the user interface of the EMMA software. The up-most window displays the tool configuration wizard, which serves to define customized analysis pipelines. The building blocks of pipelines are functions or external programs known as plug-ins. The second screenshot depicts a scatterplot of the normalized log-expression versus the log-intensity where each gene is linked to its corresponding annotation.
Data import and export are provided in a variety of formats. The complete MAGE-ML language is supported for array layouts, datasets and experimental descriptions. Datasets can be exported as tab-separated tables and in the binary format HDF5, which is also used for reliable storage of large quantification tables. EMMA supports the Array Description Format and MAGE-ML for defining array layouts. After creating the array layouts the contained sequences can be linked to GenDB automatically.
Fine grained access control is provided for every experiment, array and dataset on a user and group level. Upload and storage of experimental setups, RNA-extraction, hybridization conditions, scanned images and quantification data are handled by the included ArrayLIMS system.
ProDB is software for large-scale analysis of proteome data, including a LIMS component. ProDB stores experimental data, such as images of 2D gels or MS and allows automated data analysis and annotation of MS.
The system handles data from different mass spectrometer software (e.g. processed data from Bruker or Thermofinnigan) and will support the mzData standard from the PSI (22). Since ProDB stores MS together with numerous details about the experimental setup, the annotation is automatically linked to the corresponding spots on a gel.
The web interface provides data input and management of all experimental steps leading up to the MS data. We have implemented a common interface to different search engines like Mascot (23) or emowse (24) [contained in the EMBOSS package (25)]. In this interface, the user can define search sets consisting not only of one specific parameter for a MS search (e.g. peptide mass tolerance of 100 p.p.m.) but an interval for each parameter (e.g. peptide mass tolerance from 50 to 100 p.p.m. with steps of 25 p.p.m.). These sets of search parameters are used to analyze all selected MS. The results are then presented to the user for the annotation of the spectra.
Integrating the systems
Each of the described applications can be used stand-alone, but they can also be linked via the BRIDGE integration layer. Using this layer, data objects from different projects can be linked so that, for example, information originating from a GenDB project can be shown in the EMMA or ProDB web interface. We are in the process of tightly integrating the different applications to provide the user with the benefit of having all useful information present at each step of the analyses.
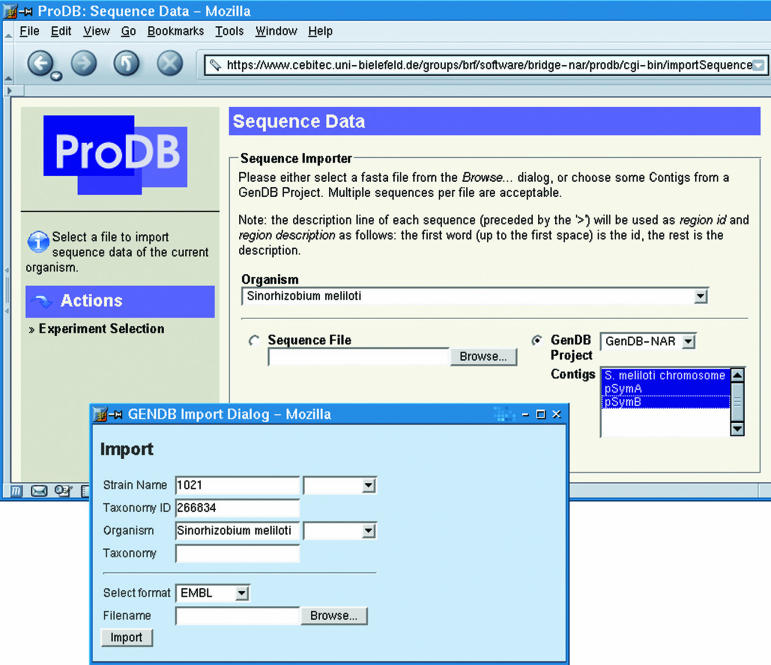
In this manner, we have linked the sequences spotted on an array to the corresponding GenDB genes. Thus, the user can jump directly from a spot in EMMA to the corresponding GenDB contig view, report or annotation dialog. Sequence data from GenDB can also be used to create the database for MS analyses. The results of the analyses can be linked to the corresponding sequence object stored within GenDB (Figure 3). Some examples of the ongoing integration can be found in the supplementary material.
Figure 3.
Data import in GenDB and ProDB. In the GenDB Import Dialog the import for the S.meliloti sequence and annotations using an EMBL file is shown. The imported contigs can then be used for creating a protein database for the MS analyses in a ProDB project as shown in the upper screenshot.
To demonstrate the benefit of the integration a sample application is described as follows.
A sample application: enriching gene annotations with experimental evidence from 2D gel analyses
For this sample application we have imported the EMBL files of all replicons of the Sinorhizobium meliloti (26) genome into a GenDB project. Afterwards, we computed a new automatic functional annotation using the standard GenDB pipeline. The amino acid sequences of all CDSs and their updated gene annotations were then imported directly from GenDB into the ProDB demo project and installed as a searchable database for emowse.
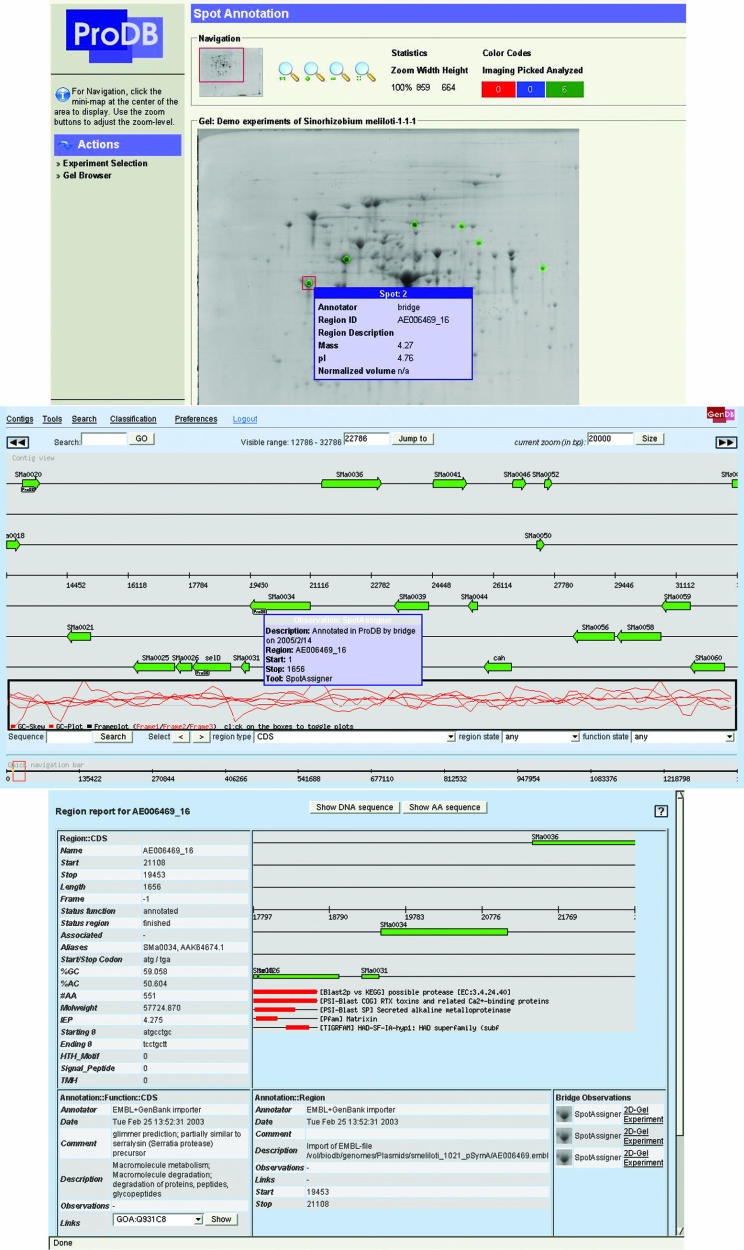
Sample data from 2D gel analyses were imported into ProDB and several spots on a gel were identified from their peptide mass fingerprints. These spots were annotated within the ProDB system and by assigning the corresponding GenDB region the spot objects were linked directly to the GenDB CDS objects. At the same time, an observation was created within the GenDB system referring to the ProDB spot object, and these observations are listed in the GenDB region report showing a small image of the corresponding spot on a gel (Figure 4). Furthermore, the user can jump directly from the GenDB report to the ProDB 2D gel and experiment. Conversely, one can also navigate from an annotated spot to the GenDB contig view. Directly linking experimental data from 2D gel analyses is used in this example for creating enriched gene annotations with increased quality and reliability provided by experimental evidence.
Figure 4.
Example for the ongoing integration of the BRIGEP applications. Spots in a 2D gel in ProDB are linked to CDS objects in GenDB. The spot marked with a red square in the up-most screenshot is highlighted in the GenDB contig view in the middle. The GenDB report for a selected region is enriched by images of corresponding proteins picked from a 2D gel in ProDB.
SUPPLEMENTARY MATERIAL
Supplementary Material is available at NAR Online.
Supplementary Material
Acknowledgments
We thank the users for their hints and suggestions to improve and extend the functionality and usability of our software. We are grateful to our student programmers Stefan Albaum, Thomas Bekel, Johannes T. Griebel, Sebastian Jünnemann, Tim Kahlke, Alexander Lenhardt, Daniel Paarmann, Oliver Rupp and Felix Tille. The work of A.G. and D.B. is funded by the ‘Bundesministerium für Bildung und Forschung’ (BMBF 0313105), B.L. and A.W. are funded by the ‘Deutsche Forschungsgemeinschaft’ (DFG PU28/25-3). M.D. acknowledges financial support by the ‘International NRW Graduate School in Bioinformatics and Genome Research’, L.K. and S.O. are supported by the ‘DFG Graduiertenkolleg 635 Bioinformatik’. H.N. and T.P. are funded by the EU (GOCE-CT-2004-505403). Funding to pay the Open Access publication charges for this article was provided by Bielefeld University.
Conflict of interest statement. None declared.
REFERENCES
- 1.Bernal A., Ear U., Kyrpides N. Genomes OnLine Database (GOLD): a monitor of genome projects world-wide. Nucleic Acids Res. 2001;29:126–127. doi: 10.1093/nar/29.1.126. [DOI] [PMC free article] [PubMed] [Google Scholar]
- 2.Rutherford K., Parkhill J., Crook J., Horsnell T., Rice P., Rajandream M.-A., Barrell B. Artemis: sequence visualisation and annotation. Bioinformatics. 2000;16:945–994. doi: 10.1093/bioinformatics/16.10.944. [DOI] [PubMed] [Google Scholar]
- 3.Overbeek R., Larsen N., Walunas T., D Souza M., Pusch G., Selkov E.J., Liolios K., Joukov V., Kaznadzey D., Anderson I., et al. The ERGO genome analysis and discovery system. Nucleic Acids Res. 2003;31:164–171. doi: 10.1093/nar/gkg148. [DOI] [PMC free article] [PubMed] [Google Scholar]
- 4.Saal L.H., Troein C., Vallon-Christersson J., Gruvberger S., Saal L.H., Troein C., Vallon-Christersson J., Gruvberger S., Borg A., Peterson C. BioArray Software Environment (BASE): a platform for comprehensive management and analysis of microarray data. Genome Biol. 2002;3 doi: 10.1186/gb-2002-3-8-software0003. software 0003–1 0003.6. [DOI] [PMC free article] [PubMed] [Google Scholar]
- 5.Theilhaber J., Ulyanov A., Malanthara A., Cole J., Xu D., Nahf R., Heuer M., Brockel C., Bushnell S. GECKO: a complete large-scale gene expression analysis platform. BMC Bioinformatics. 2004;5:195. doi: 10.1186/1471-2105-5-195. [DOI] [PMC free article] [PubMed] [Google Scholar]
- 6.Dondrup D., Goesmann A., Bartels D., Kalinowski J., Krause L., Linke B., Rupp O., Sczyrba A., Pühler A., Meyer F. EMMA: a platform for consistent storage and efficient analysis of microarray data. J. Biotechnol. 2003;106:135–146. doi: 10.1016/j.jbiotec.2003.08.010. [DOI] [PubMed] [Google Scholar]
- 7.Wilke A., Rückert C., Bartels D., Dondrup M., Goesmann A., Hüser A., Kespohl A., Linke B., Mahne M., McHardy A.C., et al. Bioinformatics support for high-throughput proteomics. J. Biotechnol. 2003;106:147–156. doi: 10.1016/j.jbiotec.2003.08.009. [DOI] [PubMed] [Google Scholar]
- 8.Facius A., Englbrecht C., Birzele F., Groscurth A., Schmid B., Wanka S., Mewes W. PRIME: a graphical interface for integrating genomic/proteomic databases. Proteomics. 2005;5:76–80. doi: 10.1002/pmic.200400862. [DOI] [PubMed] [Google Scholar]
- 9.Meyer F., Goesmann A., McHardy A.C., Bartels D., Bekel T., Clausen C., Kalinowski J., Linke B., Rupp O., Giegerich R., Pühler A. GenDB—an open source genome annotation system for prokaryote genomes. Nucleic Acids Res. 2003;31:2187–2195. doi: 10.1093/nar/gkg312. [DOI] [PMC free article] [PubMed] [Google Scholar]
- 10.Goesmann A., Linke B., Rupp O., Krause L., Bartels D., Dondrup D., McHardy A.C., Wilke A., Pühler A., Meyer F. Building a BRIDGE for the integration of heterogeneous data from functional genomics into a platform for systems biology. J. Biotechnol. 2003;106:157–167. doi: 10.1016/j.jbiotec.2003.08.007. [DOI] [PubMed] [Google Scholar]
- 11.Linke B. Bielefeld, Germany: Bielefeld University; 2002. O2DBI II: ein Persistenzlayer für Perl-Objekte. Master's Thesis. [Google Scholar]
- 12.Delcher A.L., Harmon D., Kasif S., White O., Salzberg S.L. Improved microbial gene identification with GLIMMER. Nucleic Acids Res. 1999;27:4636–4641. doi: 10.1093/nar/27.23.4636. [DOI] [PMC free article] [PubMed] [Google Scholar]
- 13.Badger H., Olsen G.J. CRITICA: coding region identification tool invoking comparative analysis. Mol. Biol. Evol. 1999;16:512–524. doi: 10.1093/oxfordjournals.molbev.a026133. [DOI] [PubMed] [Google Scholar]
- 14.McHardy A.C., Goesmann A., Pühler A., Meyer F. Development of joint application strategies for two microbial gene finders. Bioinformatics. 2004;20:1622–1631. doi: 10.1093/bioinformatics/bth137. [DOI] [PubMed] [Google Scholar]
- 15.Altschul S.F., Madden T.L., Schaffer A.A., Zhang J., Zhang Z., Miller W., Lipman D.J. Gapped BLAST and PSI-BLAST: a new generation of protein database search programs. Nucleic Acids Res. 1997;25:3389–3402. doi: 10.1093/nar/25.17.3389. [DOI] [PMC free article] [PubMed] [Google Scholar]
- 16.Eddy S.R. Profile hidden Markov models. Bioinformatics. 1998;14:755–763. doi: 10.1093/bioinformatics/14.9.755. [DOI] [PubMed] [Google Scholar]
- 17.Apweiler R., Attwood T., Bairoch A., Bateman A., Birney E., Biswas M., Bucher P., Cerutti L., Corpet F., Croning M., et al. The InterPro database, an integrated documentation resource for protein families, domains and functional sites. Nucleic Acids Res. 2001;29:37–40. doi: 10.1093/nar/29.1.37. [DOI] [PMC free article] [PubMed] [Google Scholar]
- 18.The Gene Ontology Consortium. Gene ontology: tool for the unification of biology. Nature Genet. 2000;25:25–29. doi: 10.1038/75556. [DOI] [PMC free article] [PubMed] [Google Scholar]
- 19.Kanehisa M., Goto S. KEGG: Kyoto encyclopedia of genes and genomes. Nucleic Acids Res. 2000;28:27–30. doi: 10.1093/nar/28.1.27. [DOI] [PMC free article] [PubMed] [Google Scholar]
- 20.Tatusov R.L., Natale D.A., Garkavtsev I.V., Tatusova T.A., Shankavaram U.T., Rao B.S., Kiryutin B., Galperin M.Y., Fedorova N.D., Koonin E.V. The COG database: new developments in phylogenetic classification of proteins from complete genomes. Nucleic Acids Res. 2001;29:22–28. doi: 10.1093/nar/29.1.22. [DOI] [PMC free article] [PubMed] [Google Scholar]
- 21.Spellman P.T., Miller M., Stewart J., Troup C., Sarkans U., Chervitz S., Bernhart D., Sherlock G., Ball C., Lepage M., et al. Design and implementation of microarray gene expression markup language (MAGE-ML) Genome Biol. 2002;3:research 0046.1–0046.9. doi: 10.1186/gb-2002-3-9-research0046. [DOI] [PMC free article] [PubMed] [Google Scholar]
- 22.Orchard S., Hermjakob H., Apweiler R. The proteomics standard initiative. Proteomics. 2003;3:1374–1376. doi: 10.1002/pmic.200300496. [DOI] [PubMed] [Google Scholar]
- 23.Perkins D.N., Pappin D.J., Creasy D.M., Cottrell J.S. Probability-based protein identification by searching sequence databases using mass spectrometry data. Electrophoresis. 1999;20:3551–3567. doi: 10.1002/(SICI)1522-2683(19991201)20:18<3551::AID-ELPS3551>3.0.CO;2-2. [DOI] [PubMed] [Google Scholar]
- 24.Eng J.K., McCormack A.L., Yates J.R., III An approach to correlate tandem mass spectral data of peptides with amino acid sequences in a protein database. J. Am. Soc. Mass Spectrom. 1994;5:976–989. doi: 10.1016/1044-0305(94)80016-2. [DOI] [PubMed] [Google Scholar]
- 25.Rice P., Longden I., Bleasby A. EMBOSS: the European Molecular Biology Open Software Suite. Trends Genet. 2000;16:276–277. doi: 10.1016/s0168-9525(00)02024-2. [DOI] [PubMed] [Google Scholar]
- 26.Galibert F., Finan T., Long S., Pühler A., Abola P., Ampe F., Barloy-Hubler F., Barnett M., Becker A., Boistard P., et al. The composite genome of the legume symbiont Sinorhizobium meliloti. Science. 2001;29:668–672. doi: 10.1126/science.1060966. [DOI] [PubMed] [Google Scholar]
Associated Data
This section collects any data citations, data availability statements, or supplementary materials included in this article.


