Abstract
The standard workflow in gene expression profile analysis to identify gene function is the clustering by various metrics and techniques, and the following analyses, such as sequence analyses of upstream regions. A further challenging analysis is the inference of a gene regulatory network, and some computational methods have been intensively developed to deduce the gene regulatory network. Here, we describe our web server for inferring a framework of regulatory networks from a large number of gene expression profiles, based on graphical Gaussian modeling (GGM) in combination with hierarchical clustering (http://eureka.ims.u-tokyo.ac.jp/asian). GGM is based on a simple mathematical structure, which is the calculation of the inverse of the correlation coefficient matrix between variables, and therefore, our server can analyze a wide variety of data within a reasonable computational time. The server allows users to input the expression profiles, and it outputs the dendrogram of genes by several hierarchical clustering techniques, the cluster number estimated by a stopping rule for hierarchical clustering and the network between the clusters by GGM, with the respective graphical presentations. Thus, the ASIAN (Automatic System for Inferring A Network) web server provides an initial basis for inferring regulatory relationships, in that the clustering serves as the first step toward identifying the gene function.
INTRODUCTION
Monitoring of the expression of many genes under different conditions is one of the usual approaches for investigating gene relationships on a genomic scale. After preprocessing the monitored profiles of gene expression, the genes are classified into some groups by various computational methods, as the first step toward identifying the gene function (1). Based on their classifications of genes, for example, the genes are allocated into functional categories, and searches for regulatory sequences are performed in the upstream regions among the genes belonging to each cluster. Thus, classification methods, such as clustering, have been established as a prerequisite for the identification of gene function from gene expression profiles, and several web servers have been developed to perform the clustering of profiles integrated from different resources (2).
As a further challenging investigation, the network of regulatory relationships is inferred by various approaches directly from the profiles. For example, the Boolean and Bayesian networks have been successfully applied to infer the regulatory network from the expression profiles (3,4). Indeed, since those pioneer efforts, some improvements and modifications have been reported in the application of Boolean and Bayesian networks to the inference of regulatory networks. However, since the two approaches require specific techniques and large amounts of computational time, it would be difficult to develop a web server based on the two approaches to analyze large numbers of gene expression profiles.
Recently, we have developed an approach to infer a regulatory network, which is based on graphical Gaussian modeling (GGM) (5,6). GGM is one of the graphical models that include the Boolean and Bayesian models (7). Among the graphical models, GGM is the simplest structure in a mathematical sense; only the inverse of the correlation coefficient between the variables is needed. GGM infers only the undirected graph, instead of the directed graph showing the causality in the Boolean and Bayesian models; therefore, GGM can be easily applied to a wide variety of data. Since straightforward applications of statistical theory to practical data fail in some cases, GGM frequently fails when applied to gene expression profiles. This is because the profiles frequently share similar expression patterns, which indicate that the correlation coefficient matrix between the genes is not regular. Thus, we have devised a procedure, named ASIAN (Automatic System for Inferring A Network), to apply GGM to gene expression profiles, by a combination of hierarchical clustering (5,6,8). First, the large number of profiles is classified into groups, according to the usual analysis of profiles. To avoid the generation of a non-regular correlation coefficient matrix from the expression profiles, we adopted a stopping rule for hierarchical clustering. Then, the relationship between the clusters is inferred by GGM. Thus, our method provides a framework of gene regulatory relationships by inferring the relationship between the clusters (6,9) and provides clues toward estimating the global relationships between genes on a genomic scale.
In this paper, we describe our server for implementing the ASIAN system. The previous version of the ASIAN web server (10) has been improved to facilitate its utilization. The new version provides a quick analysis by ASIAN, a step-by-step analysis by ASIAN, and graphical presentations of the clustering and the cluster boundary estimation.
ASIAN OVERVIEW
The ASIAN system is composed of four parts: (i) the calculation of a correlation coefficient matrix for the raw data, (ii) the hierarchical clustering, (iii) the estimation of cluster boundaries and (iv) the application of GGM to the clusters. In the GGM, the network is inferred by the calculation of a partial correlation coefficient matrix from the correlation coefficient matrix, and the partial correlation coefficient matrix can only be obtained if the correlation coefficient matrix is regular. Since the gene expression profiles on a genomic scale often include many profiles sharing similar expression patterns, the correlation coefficient matrix is not always regular. Therefore, the first three parts [(i)–(iii)] are prerequisite for analyzing the redundant data, including many similar patterns of expression profiles, by the last part (iv), the network inference by GGM.
Our server allows users to analyze expression profiles by high-throughput network inference and by statistical calculations in ASIAN. On the front page, users can select either a high-throughput analysis or a partial analysis. In the partial analysis, the user can independently perform the four parts of ASIAN. Thus, the present ASIAN web site is able to perform network inferences and various statistical analyses in the user's interests.
ASIAN USAGE
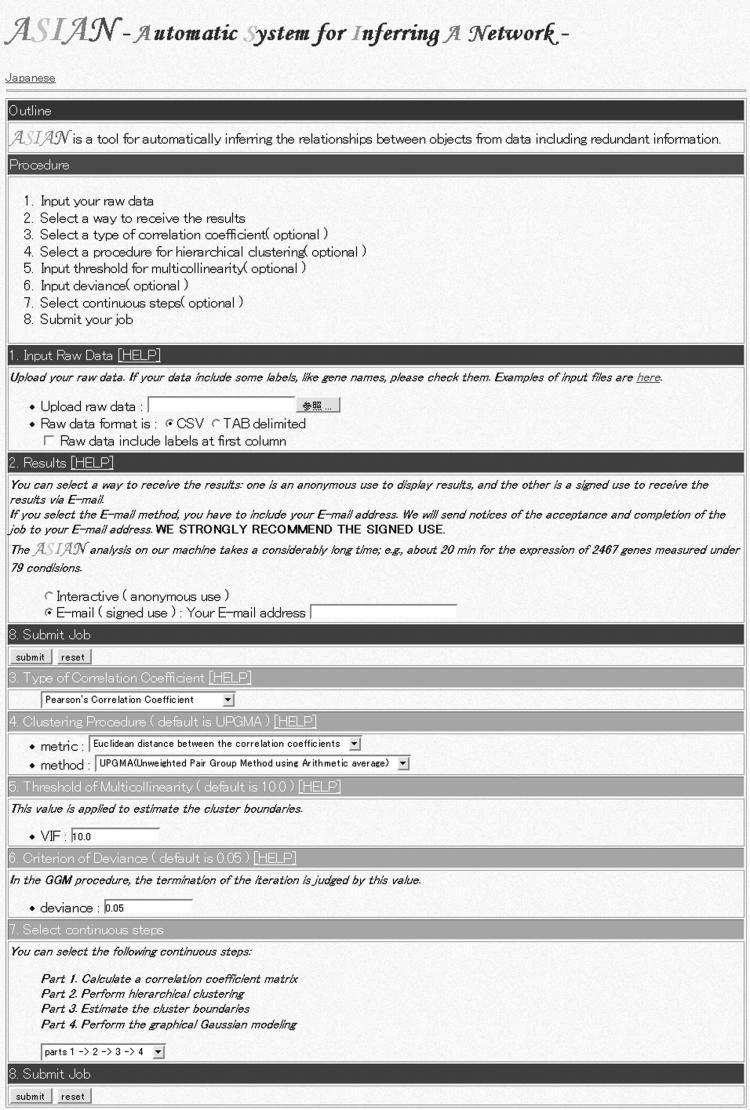
The clickable button ‘ASIAN’ opens the analysis page (Figure 1). Our server can analyze the uploaded data in two ways: one is a batch process that can successively perform the aforementioned four parts with the default parameters, and the other is a process that can allow users to input the parameter values in each analysis.
Figure 1.
ASIAN web interface, through which expression profiles can be uploaded for hierarchical clustering with estimations of cluster number and network inference between clusters.
In the batch process, only two steps are needed. First, the program runs by uploading the gene expression data to be analyzed, and then the user selects one of two ways to receive the results; one is an anonymous use to display the results simultaneously with the processing, and the other is a signed use to receive the results after finishing all of the processes, through a web site that can be accessed by inputting the user's email address. The format of the expression data is assumed as csv or tab-delimited text files. Immediately after receiving the user's data and selecting the method for receiving the results, the server successively performs the four calculation parts with the default values.
The server also allows users to select some parameters for the network inference. In this case, after the above two steps, the user inputs some parameters for each step. Furthermore, apart from the high-throughput inference of the network, the server can provide a step-by-step approach to ASIAN. The user can select several continuous steps, such as parts (i) and (ii), so that users can submit the expression data as input and receive the correlation coefficient matrix and the clustering results as output. The user can select one of the four types of continuous steps in the box, and then the server performs the checked steps. The default of the step is set to the four continuous parts. In the following, the details of each part will be described.
For the calculation of the correlation coefficient matrix, the user can select one type of correlation coefficient from three different types: (i) the Pearson's correlation coefficient (the default type), which is a representative correlation coefficient for a continuous variable, (ii) the Kendall's rank correlation coefficient, which is a representative one for a categorical variable and (iii) the Eisen's correlation coefficient for the gene expression profile data (11). In general, the Pearson's correlation coefficient is suitable for data obtained from a bivariate population according to the normal distribution, while the Kendall's rank correlation coefficient is for data that are far from normal. The Eisen's correlation coefficient is devised to consider the experimental conditions by setting the reference state as a term that corresponds to the average of the Pearson's correlation coefficient (11).
The user can select a pair of metric and clustering techniques in the hierarchical clustering. Since the metrics and the techniques in the clustering depend on the user's data and interests (12), the server allows users to select one metric and technique pair from three metrics and seven techniques. Three metrics, the Euclidian distance between a pair of objects, the Euclidian distance between correlation coefficients and Eisen's distance, especially for gene expression analyses (11), are available in the present version of ASIAN. Based on one of the metrics, the profiles are subjected to a hierarchical clustering analysis by one of the seven techniques: Single Linkage (nearest neighbor), Complete Linkage (furthest neighbor), Unweighted Pair Group Method using Arithmetic average (UPGMA), Unweighted Pair Group Method using Centroid average (UPGMC), weighted pair group method using arithmetic average (WPGMA), Weighted Pair Group Method using Centroid average (WPGMC) and Ward's method. The default metric and technique pair is the Euclidian distance between correlation coefficients and the UPGMA.
One of the remarkable features of our server is that it can allow users to estimate the cluster number by a stopping rule for the hierarchical clustering (5). In the cluster number estimation, the variance inflation factor (VIF) is utilized as a measure for the degree of separation between the clusters. Empirically, 10.0 is used as a cut-off value of VIF in various statistical analyses (13), and the cluster numbers estimated by the empirical value have been quite consistent with the previous numbers, as assessed by visual inspection and consideration of the biological function in the expression profile analyses (6,9). Although the default value of VIF is set at 10.0, the user can set any VIF value in this system.
In the network inference, the average correlation coefficient matrix is calculated from the average profiles calculated within the members of each cluster. Then, the average correlation coefficient matrix between the clusters is subjected to the GGM (8). In the GGM, the covariance selection (14) is adopted, and the server allows users to set the significance probability for the deviance in the modeling. The default significance probability is set to 0.05.
ASIAN OUTPUTS
The results analyzed can be presented on the display immediately after finishing each process, if the user selected the anonymous use setting. If the user inputs their email address, then an email notice with the ID number and the URL is sent to the user, when the analyses are completed. In the latter case, the user can view the results analyzed on the user's web site, with security by the ID number and the email address. The analyzed results are composed of the correlation coefficient matrix, the dendrogram of hierarchical clustering with the cluster boundary in both text and graphic forms, the average correlation coefficient matrix and the network between clusters in text and graphic forms. All of the above results are kept in the user's web site for 30 days after the analysis is completed. If the user wishes the analyzed results to be deleted or to be kept for >30 days, then a request by email (asian@hgc.jp) is acceptable.
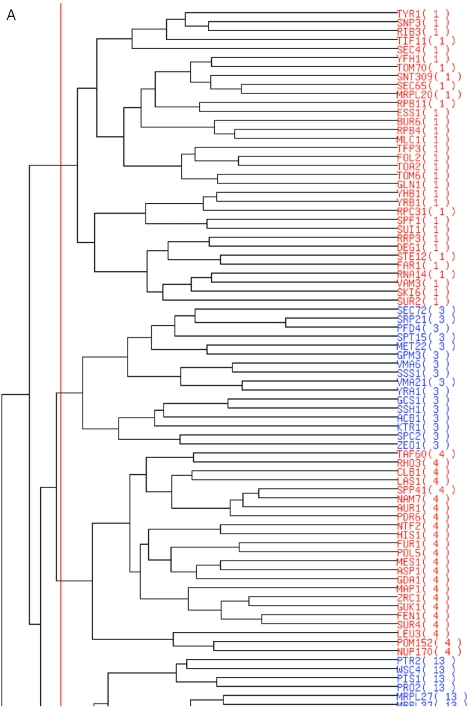
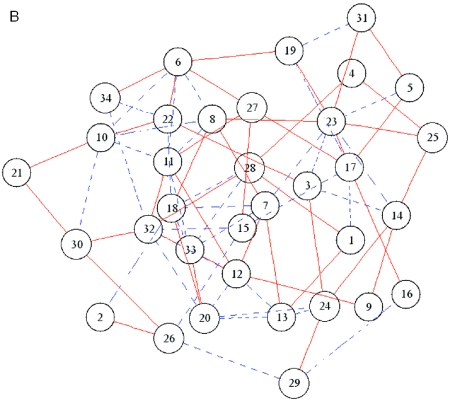
Figure 2 shows the graphical presentation of the clustering results with a cluster boundary and the network between the clusters. Figure 2A shows an example of a dendrogram with the cluster boundary estimated by the default value of VIF. The cluster boundary is indicated by a red line on the dendrogram, and the members in the neighboring clusters are discriminated by gene names colored in blue and red. Figure 2B shows an example of the network inferred by the present ASIAN web. In the default graph, the nodes that indicate the clusters are connected at the edges, if the partial correlation coefficient between the corresponding clusters is estimated as non-zero by GGM. In the network graph, the positive and negative partial correlation coefficients are discriminated by the solid red and broken blue lines in the graph, respectively. Furthermore, the user can set the threshold of the partial correlation coefficient for visualizing the edges. When the partial correlation coefficient between the clusters is greater than the threshold defined by the user, the nodes are connected by the edges between the corresponding clusters. This option facilitates the interpretation of the network, especially that of a complex network with many edges and nodes.
Figure 2.
Sample output using a set of yeast gene expression profiles as query data. The profile data are cited from (11). (A) Part of the hierarchical clustering with an estimation of the cluster boundary (red line). (B) Network graph between 34 clusters estimated by our server.
COMPUTATIONAL PERFORMANCE
The server analyzed the expression data of 2467 genes measured under 79 conditions (11), in 20 min and 6 s, by a machine comprising four CPUs with 900 MHz UltraSPARC III Cu and a memory of 16 GB, under the Solaris8 operating system. In addition, the server can automatically allocate the machine memory for calculations in the present system; the largest amount of data successfully analyzed in the preset machine was composed of the profiles of 36 825 human genes measured under 178 conditions (15). Thus, the performance of our server is promising for inferring the network framework from a large amount of data, within a reasonable amount of computational time.
CONCLUSIONS
Our web server is one of the feasible servers for inferring the framework of gene regulatory relationships from a large number of gene expression profiles, in addition to the clustering concomitant with the estimation of cluster number. In particular, the visual presentation of the results provides an intuitive means for understanding the putative relationships between the regulators of the genes.
Acknowledgments
One of the authors (K.H.) was partly supported by a Grant-in-Aid for Scientific Research on Priority Areas ‘Genome Information Science’ (grant 16014208) and for Scientific Research (B) (grant 15310134), from the Ministry of Education, Culture, Sports, Science and Technology of Japan. Funding to pay the Open Access publication charges for this article was provided by a Grant-in-Aid for Scientific Research on Priority Areas ‘Genome Information Science’ (grant 17017015), from the Ministry of Education, Culture, Sports, Science and Technology of Japan.
Conflict of interest statement. None declared.
REFERENCES
- 1.Quackenbush J. Computational analysis of microarray data. Nature Rev. Genet. 2001;2:418–427. doi: 10.1038/35076576. [DOI] [PubMed] [Google Scholar]
- 2.Kapushesky M., Kemmeren P., Culhane A.C., Durinck S., Ihmels J., Körner C., Kull M., Torrente A., Sarkans U., Vilo J., Brazma A. Expression Profiler: next generation—an online platform for analysis of microarray data. Nucleic Acids Res. 2004;32:W465–W470. doi: 10.1093/nar/gkh470. [DOI] [PMC free article] [PubMed] [Google Scholar]
- 3.Akutsu T., Miyano S., Kuhara S. Algorithms for inferring qualitative models of biological networks. Pac. Symp. Biocomput. 2000:290–301. doi: 10.1142/9789814447331_0028. [DOI] [PubMed] [Google Scholar]
- 4.Friedman N., Linial M., Nachman I., Pe'er D. Using Bayesian networks to analyze expression data. J. Comput. Biol. 2000;7:601–620. doi: 10.1089/106652700750050961. [DOI] [PubMed] [Google Scholar]
- 5.Horimoto K., Toh H. Statistical estimation of cluster boundaries in gene expression profile data. Bioinformatics. 2001;17:1143–1151. doi: 10.1093/bioinformatics/17.12.1143. [DOI] [PubMed] [Google Scholar]
- 6.Toh H., Horimoto K. Inference of a genetic network by a combined approach of cluster analysis and graphical Gaussian modeling. Bioinformatics. 2002;18:287–297. doi: 10.1093/bioinformatics/18.2.287. [DOI] [PubMed] [Google Scholar]
- 7.Whittaker J. Graphical Models in Applied Multivariate Statistics. NY: John Wiley; 1990. [Google Scholar]
- 8.Toh H., Horimoto K. System for automatically inferring a genetic network from expression profiles. J. Biol. Phys. 2002;28:449–464. doi: 10.1023/A:1020337311471. [DOI] [PMC free article] [PubMed] [Google Scholar]
- 9.Aburatani S., Kuhara S., Toh H., Horimoto K. Deduction of a gene regulatory relationship framework from gene expression data by the application of graphical Gaussian modeling. Signal Processing. 2003;83:777–788. [Google Scholar]
- 10.Aburatani S., Goto K., Saito S., Fumoto M., Imaizumi A., Sugaya N., Murakami H., Sato M., Toh H., Horimoto K. ASIAN: a web site for network inference. Bioinformatics. 2004;20:2853–2856. doi: 10.1093/bioinformatics/bth296. [DOI] [PubMed] [Google Scholar]
- 11.Eisen M.B., Spellman P.T., Brown P.O., Botstein D. Cluster analysis and display of genome-wide expression patterns. Proc. Natl Acad. Sci. USA. 1998;95:14863–14868. doi: 10.1073/pnas.95.25.14863. [DOI] [PMC free article] [PubMed] [Google Scholar]
- 12.Gordon A.D. Classification. London: Chapman and Hall; 1981. [Google Scholar]
- 13.Freund R.J., Wilson W.J. Regression Analysis. San Diego: Academic Press; 1998. [Google Scholar]
- 14.Dempster A.P. Covariance selection. Biometrics. 1972;28:157–175. [Google Scholar]
- 15.Murray J.I., Whitfield M.L., Trinklein N.D., Myers R.M., Brown P.O., Botstein D. Diverse and specific gene expression responses to stresses in cultured human cells. Mol. Biol. Cell. 2004;15:2361–2374. doi: 10.1091/mbc.E03-11-0799. [DOI] [PMC free article] [PubMed] [Google Scholar]


