Abstract
PAT, for Protein Analysis Toolkit, is an integrated biocomputing server. The main goal of its design was to facilitate the combination of different processing tools for complex protein analyses and to simplify the automation of repetitive tasks. The PAT server provides a standardized web interface to a wide range of protein analysis tools. It is designed as a streamlined analysis environment that implements many features which strongly simplify studies dealing with protein sequences and structures and improve productivity. PAT is able to read and write data in many bioinformatics formats and to create any desired pipeline by seamlessly sending the output of a tool to the input of another tool. PAT can retrieve protein entries from identifier-based queries by using pre-computed database indexes. Users can easily formulate complex queries combining different analysis tools with few mouse clicks, or via a dedicated macro language, and a web session manager provides direct access to any temporary file generated during the user session. PAT is freely accessible on the Internet at http://pat.cbs.cnrs.fr.
INTRODUCTION
New bioinformatics tools and servers are created with increasingly high rate (1,2). Facing this explosion of bioinformatics tools dedicated to very specific tasks, there is a growing need of more versatile servers able to let independent tools communicate together and achieve more elaborate and higher level tasks. Such meta-servers already exist but either (i) they provide access to a collection of independent analysis tools (3,4), or (ii) the communication between tools is limited to a few of them (5,6), or (iii) the tool interaction requires explicit data translation procedures (7) or (iv) the tool collection is limited to a very specific topic and the tool combination is predefined for a specific goal (8). Other attempts at standardizing the communication protocols between bioinformatics services and distributing the processing over independent web servers are currently under development, but the implemented prototypes did not yield versatile platforms integrating many tools yet (9,10).
Indeed, the use of different file formats by each analysis tool is a major bottleneck for interconnections. As a result, performing complex analyses which involve different bioinformatics tools often requires a manual extraction of relevant information from one tool, its translation for compatibility with the next tool format and the filling of a new web form with a different interface. Clearly, this tedious data manipulation heavily slows down the user productivity and prevents biologists lacking biocomputing experience to perform higher level analyses of their experimental data.
For this reason, we describe here a new bioinformatics architecture aimed at providing an integrated working environment dedicated to protein analysis. The general goal of its design is to simplify as far as possible the communication between different tools and databases and to hide all the processing complexity behind simple web forms. To this end, the PAT server was implemented with the following characteristics:
Protein entries from several databases (SWISSPROT, TREMBL, PDB and PFAM) are automatically retrieved by using specific identifier or accession number indexes.
Many processing tools dedicated to 1D, 2D and 3D protein analysis can be launched and interconnected using specific forms displayed through a uniform web interface.
Biological data can be read and written in many bioinformatics formats using specific parsers and dumpers (e.g. fasta, msf, selex, pir, pdb, xml, …).
A dedicated session manager provides direct access to any temporary file generated by the successive analyses performed during the session.
The output of one processing step can be redirected to the input of other tools or formatting options using a seamless data format translation via appropriate parser-dumper pairs and compatibility rules.
Complex analyses that combine different processing tools are easily performed using checkboxes and popup menus, or using a dedicated macro language.
The two latter features (i.e. the redirection facility and the macro language) constitute the main novelty and provide PAT its specific strength when compared with most other web meta-servers.
PROTEIN ANALYSIS TOOLS AND DATA FORMATS
PAT provides a streamlined interface to a wide range of protein analysis tools. Currently, more than 50 different tools can be launched from the web server, covering many topics from the primary sequence analysis to the evaluation of protein 3D models. Available tools and databases and the corresponding references or websites are shown in Supplementary Table 1. It is worth noting that the modular architecture of the server permits an easy integration of new tools. Therefore, more analysis tools are planned to be installed on a regular basis, particularly in relation to protein structure modeling. New modules can also be quickly integrated on user demand.
The PAT server is able to read and write or display data in more than 10 bioinformatics formats, but most importantly, automated format recognition, keyword-based database search, parser-based information extraction and data reformatting according to the selected tools are executed seamlessly without any user intervention. The input data can be formatted as either
A protein sequence, structure or family identifier list. PAT maintains indexes for automated retrieval of entries from the SWISSPROT, TREMBL, PDB and PFAM databases and includes appropriate parsers for extracting sequences and other data from corresponding entries. Protein chains from the PDB can be specified by concatenating both protein and chain identifiers (e.g. 1reiA). Protein segments can be delineated by specifying the first and last positions by appending ‘/begin-end’ to the protein name (e.g. EGF_HUMAN/15-42 or 1ha9A/8-33).
FASTA or PIR formatted protein sequences.
MSF or SELEX formatted protein sequence alignments.
Protein atomic coordinates in PDB format.
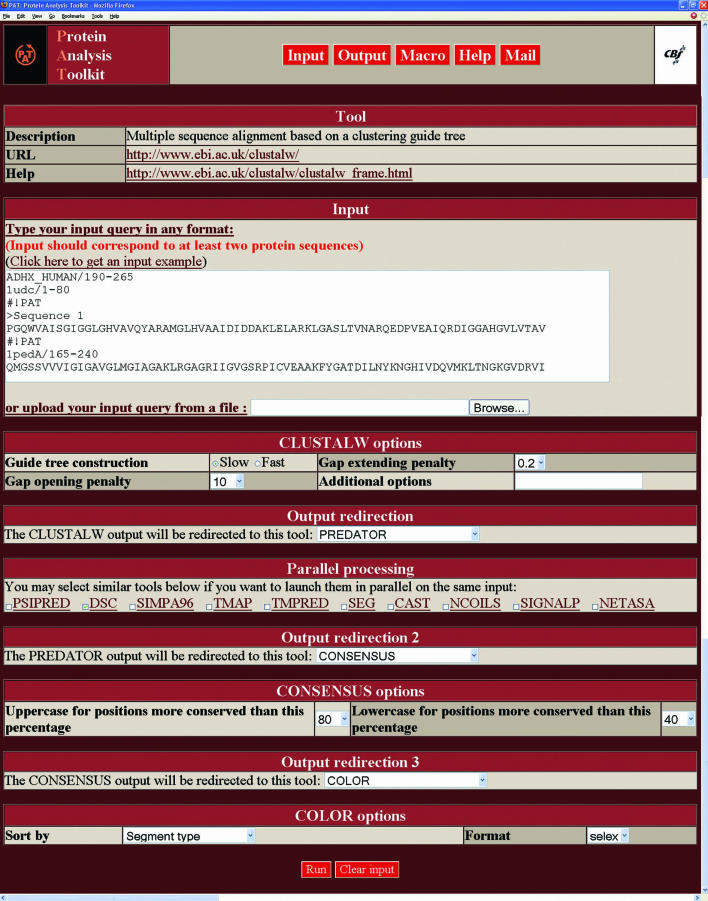
It is worth noting that different input types can be mixed together in a single query (#!PAT lines are used as separation markers). In the CLUSTALW query shown in Figure 1, protein identifiers from SWISSPROT and PDB are mixed with protein sequences in FASTA and SELEX formats. Also note the segment selection via the ‘/begin-end’ syntax. As indicated above, the output of many tools can be used as input data for subsequent processing. In the example of Figure 1, the CLUSTALW output has been redirected to the PREDATOR and DSC secondary structure prediction tools, then to the CONSENSUS tool, and finally to the COLOR tool for display. Supplementary Table 1 indicates the tools whose output can be parsed by PAT and therefore used for further processing or display.
Figure 1.
PAT interface to CLUSTALW. This example highlights several PAT features: The ‘Input’ area shows how several input data formats can be mixed together in a single query and automatically recognized and reformatted by PAT for processing. Several successive redirections of the CLUSTALW output can be seen, first to PREDATOR and DSC, then to CONSENSUS, and finally to the COLOR HTML display shown in Figure 3.
SERVER IMPLEMENTATION
The server internal engine is composed of a CGI script translating all form-based queries into textual commands which are then executed by a server-side Perl program. This core program uses a script library, which includes one object-oriented module for each analysis tool. This modular organization makes the addition of new tools very easy. Each module is composed of few concise methods which describe different features of the tool usage: help information, option description, input format dumper, output parser, command wrapper and compatibility rules.
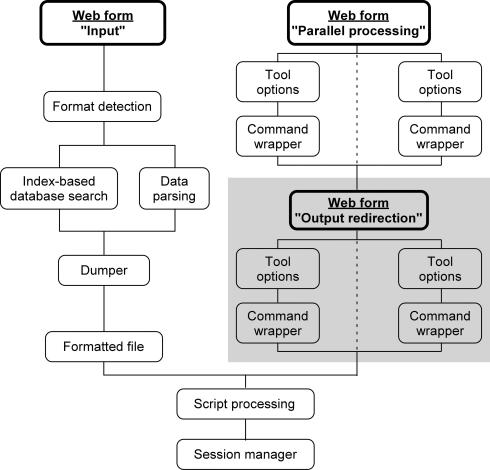
The overall processing flowchart corresponding to each web query is summarized in Figure 2. First, the format of the input data collected from the web form is automatically guessed by matching appropriate regular expressions. Then, depending on the presence or absence of amino acid sequence or atomic coordinates within the data, either an identifier-based search will be performed in indexed databases to retrieve the corresponding protein entries or data will be parsed according to the detected input format. The information extracted by either method from the input data will be first checked for compatibility with the tool(s) to be launched, and then formatted according to the format required by the tool(s). The resulting formatted data file will be used as input in the executable commands built by specific wrappers from the tool options collected in the web form. The results of each elementary processing are then stored and maintained by a session manager, which interfaces the working files created by the server with the user's web browser.
Figure 2.
Overall processing flowchart corresponding to one web query. The main web forms in the ‘Tool’ page are shown with bold letters. The redirections displayed on a gray background are optional and could be repeated using different tools if the user wishes to create a longer pipeline.
WEB INTERFACE AND SESSION MANAGER ALLOW PIPELINES AND COMPLEX QUERIES
The main server menu is accessible from the top bar present in all HTML pages generated by PAT (Figures 1 and 4) and provides five clickable buttons. ‘Input’—to select the first tool to be launched; ‘Output’—to get the results of queries; ‘Macro’—to create or retrieve complex queries and pipelines using the macro language; ‘Help’—to retrieve the help file; ‘Mail’—to send bugs and suggestions to the authors.
Figure 4.
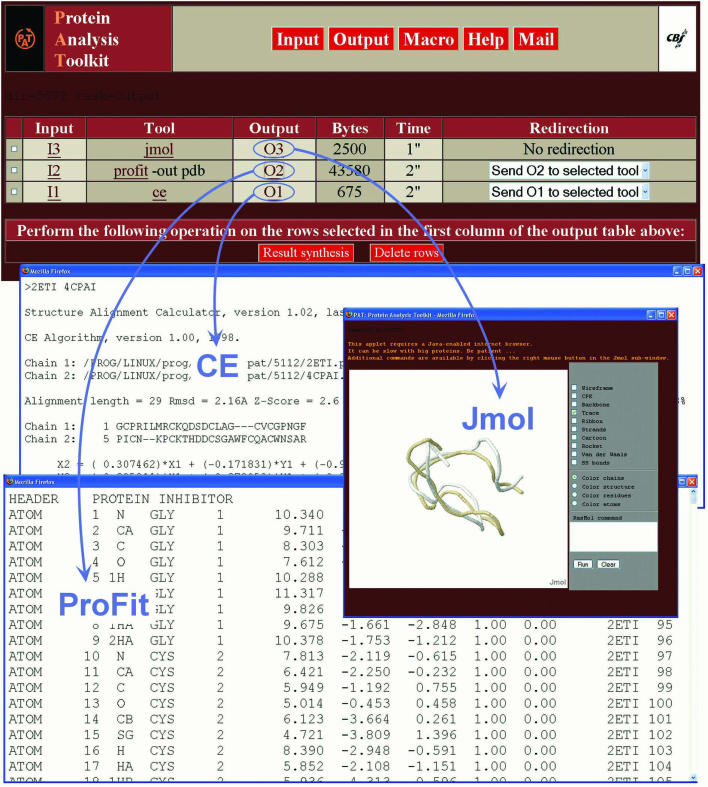
A session example corresponding to the execution of a simple macro. The data input consists of two protein structures (2eti and 4cpaI) and the macro requires successive execution of CE (structural alignment), ProFit (structure superimposition) and Jmol (display of superimposed structures). Clicking the O1, O2 or O3 links in the output table display results of each elementary step in separate windows, respectively (blue arrows).
Selecting one tool from the ‘Input’ menu creates a form which is specific to the tool but fits into a common format used for all tools, thereby simplifying the interface learning phase. Each form is made of 3–6 main areas, depending on the selected tool (Figure 1):
A ‘Tool’ information box linked to usage information accessible on the internet.
An ‘Input’ area where the user can type, paste or upload the input data.
An optional ‘Options’ area that displays a set of selectors for choosing the main option values. It can be complemented by a textual input area for specifying additional options using the syntax ‘-option1 value1 -option2 value2’.
An optional ‘Parallel processing’ area that allows the user to select other compatible tools to be launched in parallel on the same input.
An optional ‘Output redirection’ popup menu to select the output format or to redirect the results to subsequent calculations.
A ‘Run’ button for launching the query execution.
These standardized forms are generated automatically from a static description encapsulated in the modules associated to each tool. The display of the ‘Options’, ‘Parallel processing’ and ‘Output redirection’ areas is context-dependent. If a redirection is selected through the ‘Output redirection’ popup menu, the input page is updated and additional areas can be displayed depending on the selected redirection (i.e. new ‘Options’, ‘Parallel processing’ and/or ‘Output redirection’ can be displayed). This process is continued until no additional ‘Output redirection’ is selected.
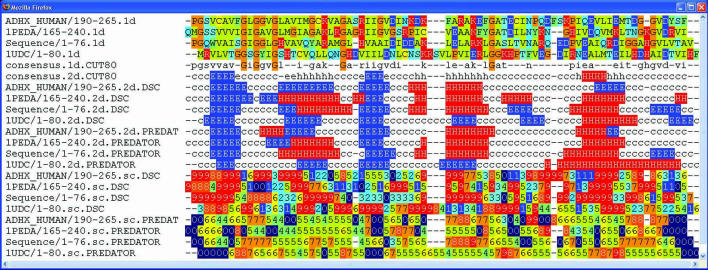
In order to determine which tool(s) could be launched in parallel, or which redirections are allowed, tool classes and compatibility rules have been defined based on the types of input and output data (e.g. single or multiple protein sequences, sequence alignment, 3D structures, etc.). As an example, the CLUSTALW tool cannot be launched in parallel with other tools (simultaneously creating different sequence alignments of the same sequences is not of general use), but the generated alignment can be redirected to several structure prediction tools in parallel to finally get a set of aligned sequences and corresponding secondary structure predictions. Such a protocol in which the output is redirected first to the CONSENSUS tool, then to the COLOR formatting tool, is displayed in Figure 1. The corresponding final output is shown in Figure 3.
Figure 3.
Final colored HTML output of the pipeline shown in Figure 1. Protein sequences, secondary structure prediction and consensus are displayed using the CLUSTALW alignment and specific color schemes.
Whenever one processing step is completed, the resulting output file is appended to the query history by a session manager, which controls all temporary files created by each launched process. In particular, each time the server ‘Output’ button is clicked, the session manager summarizes and displays the current state of the user's private workspace in the output table. This table lists the history of all temporary files created during the successive protein analyses performed by the user (Figure 4). The user can track all the protein analyses he has already launched, and keep informed of the status of ongoing processes. At any moment, from this table, the user can directly access any available input/output data. Most importantly, each data output is parsed by PAT to determine the type and content of the output. Then, depending on the data found in the output (e.g. single or multiple protein sequences, multiple sequence alignment, 3D structures, etc.), a popup menu is, or is not, displayed in the ‘Redirection’ column. This menu displays a list of compatible tools for further processing or reformatting using the data contained in the related output. If preferred, any specific identifier ‘Ox’, where x is the number of the corresponding output, can be typed in the input text area of a tool for further data-compatible processing. This pipeline mechanism makes the combination of complementary tools very easy. It should be noted that, thanks to the session manager, there is no need to wait for the completion of one query before launching a new one if both queries are independent. Each validated query will launch a new background process on the server side. By this manner, a user can execute several queries at the same time on the multi-processor server. Finally, outputs selected via the checkboxes (left column) can be either collected into a single HTML page for easier backup (‘Result synthesis’ button) or deleted to remove insignificant results from the output table (‘Delete rows’ button).
A SIMPLE MACRO LANGUAGE
As discussed above, different tools can be easily launched for parallel processing on one input data set, or chained together by redirecting the output of one tool into another tool for further calculation or formatting. This complex processing is based on a simple specific macro language. Whenever a pipeline or complex query is built by the user via the checkboxes (parallel processes) or the popup menus (redirections), the corresponding macro is saved on the server. All such user-defined macros as well as few standard macros can be quickly retrieved by clicking the ‘Macro’ button in the top menu.
The macro language is simple yet very powerful. It is based on two operators: the concatenation symbol ‘,’ and the pipe symbol ‘|’. The concatenation symbol ‘,’ allows the user perform analyses from different tools and collect them into a single global output. Each tool can be parameterized by using the syntax ‘tool -option1 value1 -option2 value2 …’. The pipe symbol ‘|’ asks for redirection of the output of the tools launched before the symbol to the input of the tools specified after the symbol. It should be noted that the pipe symbol used by PAT has the similar meaning as in the Unix world, although in PAT the redirection seamlessly involves automated data reformatting and/or index-based protein sequence or structure retrievals.
The following standard macros illustrate some automated protein analyses that can be simply performed using PAT, and highlight the ease of use and the strength of PAT. More complex or specific macros can be very easily setup by the user, either through checkboxes and popup menus or by directly typing or editing macros using the specific macro language.
Macro 1: ‘dsc, simpa96, predator, psipred, seg, ncoils, tmpred, signalp | consensus | color.’ This macro launches different local structure prediction tools, adds consensus for sequences, secondary structure predictions and transmembrane segment predictions, and then formats the resulting output using the coloring tool COLOR.
Macro 2: ‘wublast2 -d pdb_seq | sim2ali | mview.’ This macro looks for sequence homologs in the Protein Data Bank with WUBLAST2 collecting many PDB sequences, makes a multiple alignments from all pairwise sequence alignments found using SIM2ALI and then generates a HTML page using the MVIEW formatting tool.
Macro 3: ‘clustalw | bionj | atv.’ This macro aligns the input protein sequences using CLUSTALW, builds a phylogenetic tree from this alignment using BIONJ and then displays the resulting tree using the applet viewer ATV.
Macro 4: ‘ce | profit -out pdb | jmol.’ This macro builds a structural alignment of the input protein structures using CE, fits the two structures using ProFit and then displays the superpimposed proteins using the applet Jmol. It should be noted that if the input data are protein sequences, the closest homologs found in the PDB will be used for structure comparison.
Macro 5: ‘pdbgeo, verify3d, eval23d | color.’ This macro extracts 3D features using home-made software PDBGEO and evaluates the 1D–3D compatibility using the statistical potentials from EVAL23D and VERIFY3D, then tabulates the gathered information in COLOR format. For sequence input, structural data can be automatically inferred as done in macro 4.
Macro 6: ‘wublast2 | cdhit | muscle | mview.’ This macro searches query similarities using WUBLAST2, selects representative homologs with CDHIT, aligns them with MUSCLE and then displays the resulting multiple alignment using MVIEW.
Macro 7: ‘wublast2 | cdhit | seqname | dsc | selex.’ This macro searches query similarities using WUBLAST2, selects representative homologs with CDHIT, retrieves the corresponding whole sequences and predict their secondary structures with DSC, and prints all prediction using the SELEX format.
As shown by the above examples, the combination of different tools using the PAT server is straightforward and can be easily formulated through very concise macro queries, or in a more intuitive way, through checkboxes and popup menus.
SESSION EXAMPLE
A screen snapshot, corresponding to the outputs created by a single macro execution, is displayed in Figure 4. The proteins 2eti and 4cpaI have been used as input to the standard macro formulated as ‘ce | profit –out pdb | jmol’. PAT then successively launched three tools to finally display the best superimposition of the two protein structures: (i) CE calculates the structural alignment, (ii) ProFit determines the optimal fit from the calculated alignment and (iii) the applet Jmol interactively displays the superimposed structures.
The button bar, which gives access to the main server functions, can be seen at the top of Figure 4. Below it, the session output table synthesizes the information related to the macro execution (temporary file links, resources used and possible additional redirections). In particular, each intermediate result generated by any processing can be accessed by clicking the corresponding link in the ‘Output’ column of the session table. In Figure 4, the structural alignment created by CE, the PDB file created by ProFit and the interactive display of the structural superposition by Jmol were opened in separate windows by clicking the O1, O2 and O3 links, respectively. The user may then execute complementary queries by either using the redirection popup menus or by clicking the Input button in the top menu. The output of the new queries will be appended to the current session table.
Few other session examples can be found in the ‘Session examples’ section of the PAT Help file (see Supplementary Material).
PERSPECTIVES
In this article, we have described a new biocomputing server dedicated to protein analysis, which is fully accessible from the Internet. Compared with the existing meta-servers, PAT introduces new important functionalities that can strongly simplify protein analyses: (i) each tool is described by an object-oriented module which controls how the web form is generated, how option settings are translated into an executable command, how any input data are converted to a syntax compatible with the format required by the tool, and redirection compatibilities. This encapsulation allows a seamless combination of different input data types and tools through simple and standardized web forms; (ii) a macro command syntax allows the user to easily automate streamlined analyses involving successive tools and create its own new pipeline; (iii) a session manager maintains a working history of all queries launched by the user and provides direct access to any previous input or output data.
Many developments are planned to increase the efficiency of this analysis environment. First, the execution of the most time-consuming tools will soon be transferred to a multi-processor Linux cluster for shorter response delays. Second, new tools will be progressively introduced either on user request or in a projected effort to develop the structural modeling capacities of the server. Third, the macro command syntax will be extended toward a real scripting language to allow the automation of more elaborate analysis strategies. Fourth, better support for the XML data format will be added to the server input and output capabilities. This will facilitate standardized data exchange with other XML-compliant servers over the Internet. Finally, PAT will gradually integrate not only locally installed software but also remote server queries. This growing environment of compatible analysis tools will therefore provide a centralized access node to allow different servers to interact together over the Internet.
SUPPLEMENTARY MATERIAL
Supplementary Material is available at NAR Online.
Supplementary Material
Acknowledgments
ACI IMPbio (CNRS-French ministry of research) is acknowledged for financial support to computational power (Linux cluster). J.L. Pons is warmly acknowledged for computing assistance on the internet server. Funding to pay the Open Access publication charges for this article was provided by the Centre National de la Recherche Scientifique and the Institut National de la Santé et de la Recherche Médicale.
Conflict of interest statement. None declared.
REFERENCES
- 1.Editorial. Web Server issue. Nucleic Acids Res. 2003;31:3289. [PMC free article] [Google Scholar]
- 2.Editorial. Web Server issue. Nucleic Acids Res. 2004;32:W1. doi: 10.1093/nar/gkq562. [DOI] [PMC free article] [PubMed] [Google Scholar]
- 3.Basu M.K. SeWeR: a customizable and integrated dynamic HTML interface to bioinformatics services. Bioinformatics. 2001;17:577–578. doi: 10.1093/bioinformatics/17.6.577. [DOI] [PubMed] [Google Scholar]
- 4.Rost B., Yachdav G., Liu J. The PredictProtein server. Nucleic Acids Res. 2004;32:W321–W326. doi: 10.1093/nar/gkh377. [DOI] [PMC free article] [PubMed] [Google Scholar]
- 5.Perriere G., Combet C., Penel S., Blanchet C., Thioulouse J., Geourjon C., Grassot J., Charavay C., Gouy M., Duret L., et al. Integrated databanks access and sequence/structure analysis services at the PBIL. Nucleic Acids Res. 2003;31:3393–3399. doi: 10.1093/nar/gkg530. [DOI] [PMC free article] [PubMed] [Google Scholar]
- 6.Letondal C. A Web interface generator for molecular biology programs in Unix. Bioinformatics. 2001;17:73–82. doi: 10.1093/bioinformatics/17.1.73. [DOI] [PubMed] [Google Scholar]
- 7.Subramaniam S. The Biology Workbench—a seamless database and analysis environment for the biologist. Proteins. 1998;32:1–2. [PubMed] [Google Scholar]
- 8.Douguet D., Labesse G. Easier threading through web-based comparisons and cross-validations. Bioinformatics. 2001;17:752–753. doi: 10.1093/bioinformatics/17.8.752. [DOI] [PubMed] [Google Scholar]
- 9.Badidi E., De Sousa C., Lang B.F., Burger G. AnaBench: a Web/CORBA-based workbench for biomolecular sequence analysis. BMC Bioinformatics. 2003;4:63. doi: 10.1186/1471-2105-4-63. [DOI] [PMC free article] [PubMed] [Google Scholar]
- 10.Wilkinson M.D., Links M. BioMOBY: an open source biological web services proposal. Brief Bioinform. 2002;3:331–341. doi: 10.1093/bib/3.4.331. [DOI] [PubMed] [Google Scholar]
Associated Data
This section collects any data citations, data availability statements, or supplementary materials included in this article.


