Abstract
Objective
This study aimed to investigate the effect of three-dimensional (3D) printed clear aligners (CA) with different designs on the extrusion of mandibular premolars using a force/moment measurement system and digital image correlation (DIC).
Methods
The forces and moments applied to the mandibular canines, first and second premolars were measured using a multi-axis force/moment transducer when an extrusion of 0.5 mm was planned, assuming the mandibular first premolars were intruded by 1 mm. In addition, displacement and strain changes in the CA were analyzed using the DIC method. CA designs were categorized based on the presence of first premolar attachment and subdivided into equigingival margins, 1-mm extended margins, equi-margins with 1-mm thickness and height, and equi-margins with 1-mm reduced buccolingual width. The CA was printed directly at a thickness of 0.5 mm, and the experiments were conducted at 37°C.
Results
The results showed that attachment played an important role in the extrusion of first premolars in both the force/moment measurement system and the DIC method. Intrusion was observed without attachment, even though extrusion was planned. CA designs apply greater force to the cervical region by extending the margin or reducing the buccolingual width, thereby improving extrusion efficiency.
Conclusions
Force and moment changes in direct 3D printed CA are complex and difficult to predict; however, modifying aligner designs, such as extending the margin or reducing buccolingual width, and using appropriate attachments could minimize unwanted tooth movement, optimize planned treatment, and increase treatment predictability.
Keywords: Aligners, Extrusion, Force, Moment
INTRODUCTION
In a 2022 survey of Australian Orthodontic Society members, 93.13% of orthodontists reported utilizing clear aligners (CAs) in their treatment.1 Despite widespread clinical use, research on the biomechanics and treatment effects of CA remains limited. Some studies have shown limited improvement in tooth rotation, alignment, and overjet correction, low effectiveness on tooth movement ranging from 46% to 56% depending on the type of tooth movement, and poor predictability of treatment with CA compared to fixed orthodontic appliances.2-4 Extrusion of a tooth requires force to be applied in the direction of the device being peeled off, but there is no pronounced undercut in the crown, which makes it difficult for the CA to engage the tooth during treatment; therefore, the planned orthodontic forces are not fully expressed. Understanding how the CA deforms, displaces, and transmits forces/moments to teeth is a prerequisite for efficient tooth extrusion.
For CAs to move their teeth as planned, they must be fully engaged with the tooth while it is being fitted, and the desired force must be applied to the proper area of the tooth. However, if the material ages in the oral cavity or if insufficient force is applied to the appropriate tooth area owing to limitations in the material’s properties, the efficiency of tooth movement is not as good as expected. Therefore, research was performed to improve tooth movement by modifying the device design, such as a “power ridge,”5 or by varying the device thickness at specified locations to allow additional application of force.6
Grant et al.7 introduced a system to measure the forces and moments exerted by CA on teeth to understand the mechanics of CA treatment.
Despite the introduction and use of systems that can directly measure the forces and moments acting on teeth, comprehensively understanding the biomechanics of CA or how displacement and deformation of CA occur when various designs are applied remains challenging. Three-dimensional (3D) finite element analysis (FEA) has been widely used to analyze the biomechanics of CA treatment. However, limitations persist in interpreting simulation results that reflect actual biomechanical conditions.8-10 Therefore, the displacements and deformations occurring on each surface during CA treatment, made of viscoelastic materials, can be intuitively analyzed and measured using the digital image correlation (DIC) method. DIC is an analytical technique that measures the displacement and deformation of materials under external load by analyzing non-contact optical images before and after a load is applied to an object. Therefore, using a DIC method with a force/moment measurement system can accurately measure the forces and moments exerted by an aligner on the teeth and evaluate the CA displacements and strains that drive tooth movement, providing a better understanding of biomechanics.
This study aimed to investigate the effect of 3D printed CA with different designs on the extrusion of mandibular premolars using a force/moment measurement system and the DIC method. The specific aims were as follows: during mandibular first premolar extrusion with various designs of 3D printed CAs in the absence and presence of attachments and with a modified margin of 3D printed CA: 1) the forces/moments applied to the mandibular canine, first premolars, and second premolars were measured and compared, and 2) the displacement and strain of 3D printed CA before and after planned tooth extrusion using the DIC method were measured and compared.
MATERIALS AND METHODS
Fabrication of 3D printed clear aligner with different designs
The mandibular model was 3D scanned using a Nissin dental model (NISSIN B3-305; Nissin Dental Product, Kyoto, Japan) and 3D modeled using a CAD program (Spaceclaim; Ansys Inc., Canonsburg, PA, USA) to obtain a CA design. CA for mandibular first premolar extrusions was categorized into two groups based on the presence or absence of attachments and then further classified into four subgroups, each focusing on design variations at the margin. The attachment design for the mandibular first premolar was dome-shaped, with a height of 3 mm, width of 2 mm, and prominence of 1 mm (Figure 1).
Figure 1.
A, Apparatus virtual design (the mandibular left 1st premolar: 1 mm intrusion). B, Printed apparatus model. C, Attachment design and position.
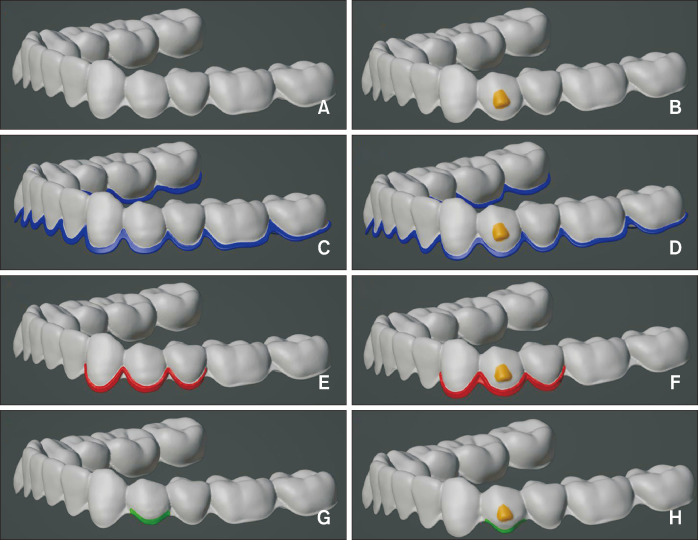
The four types of margin design for CA are shown in Figure 2A–2H.
Figure 2.
Various aligner designs. A, Group 1 (equi-margin) without attachment; B, Group 1 (equi-margin) with attachment; C, Group 2 (1-mm extended margin) without attachment; D, Group 2 (1-mm extended margin) with attachment; E, Group 3 (equi-margin with 1-mm thickness and height) without attachment; F, Group 3 (equi-margin with 1-mm thickness and height) with attachment; G, Group 4 (equi-margin with reduced buccolingual width) without attachment; and H, Group 4 (equi-margin with reduced buccolingual width) with attachment.
Group 1. Equi-margin gingival scalloped margin.
Group 2. Extended margin: 1 mm subgingival scalloped margin.
Group 3. Equi-margin with 1-mm thickness and height: gingival margin thickened to 1 mm and 1 mm height.
Group 4. Equi-margin with 1-mm reduced buccolingual width: 1 mm high at the margin of the first premolar, with a final reduction of 0.5 mm buccally and 0.5 mm lingually for a 1 mm total reduction.
By observing the lower part of the CA from the bottom, the differences in thickness and final displacement at the gingival margin can be seen when comparing Groups 3 and 4 with Group 1 (Figure 3). The CA was 3D printed directly using TC-85 (Graphy, Seoul, Korea) with a thickness of 0.5 mm.
Figure 3.
Compare aligner thicknesses (bottom view). A, Group 1 (equi-margin) and Group 4 (equi-margin with reduced buccolingual width); B, Group 1 (equi-margin) and Group 3 (equi-margin with 1-mm thickness and height); C, Group 1 (equi-margin) and 3 (equi-margin with 1-mm thickness and height), and Group 4 (equi-margin with reduced buccolingual width). Grey: Group 1, Red: Group 3, Green: Group 4.
Forces/moments measurement device for experimental clear aligner groups
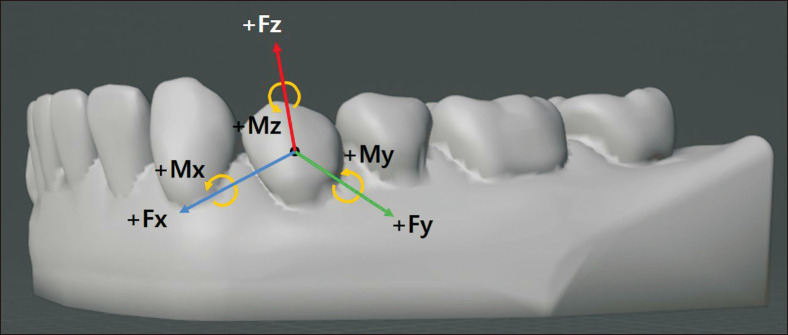
The device introduced by Grant et al.7 was modified to measure the forces and moments applied to the mandibular canine and first and second premolars (#33, #34, #35). As shown in Figure 4 and Table 1, the device was constructed by connecting multi-axis force/moment transducers (AFT20-D15; Aidin Robotics, Anyang, Korea) to measure the forces and moments applied to the teeth (Figure 1B). The directions of the force and moment on the x-, y-, and z-axes obtained from each tooth were separated by +/− signs and matched.
Figure 4.
Coordinates of data from apparatus. Centered on the facial axis of a clinical crown, we designated the X-axis to represent the mesial/distal direction, the Y-axis for the buccal/lingual direction, and the Z-axis for the occlusal/gingival direction. Fx was delineated as the proximal direction, Fy as the buccal direction, and Fz as the occlusal direction. Additionally, positive values were assigned to buccal tipping as Mx, mesial tilting as My, and distal-in rotation as Mz.
Table 1.
The sign convention of force/moment measurement system
| Component | Definition | Sign convention |
|---|---|---|
| Force (X) | Mesiodistal | (+) Mesial, (–) distal |
| Force (Y) | Buccolingual | (+) Buccal, (–) lingual |
| Force (Z) | Occlusogingival | (+) Occlusal, (–) gingival |
| Moment (X) | Inclination | (+) Buccal, (–) lingual |
| Moment (Y) | Angulation | (+) Mesial, (–) distal |
| Moment (Z) | Rotation | (+) Distal, (–) mesial |
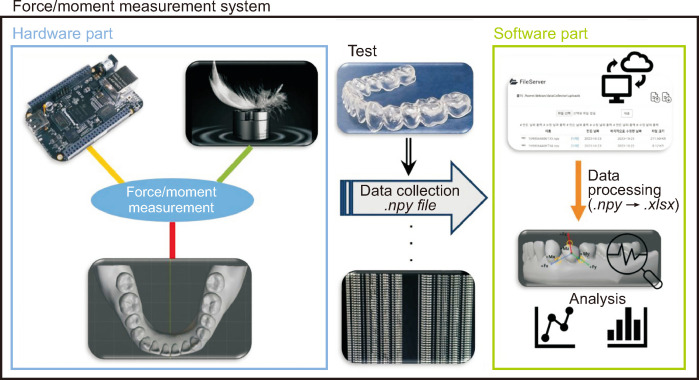
The present study analyzed the forces and moments on the mandibular canine and the first and second premolars when a 0.5 mm extrusion force was applied, assuming the mandibular first premolar was intruded by 1 mm with normal mandibular dentition. Eight groups were evaluated based on the combination of first premolar attachment and margin design (four types). Experiments were conducted to reproduce the intraoral environment using a forced convection incubator (C-INDF; Chang Shin Co., Seoul, Korea) maintained at 37°C, and the forces and moments applied to the teeth were analyzed 1 hour after the CA was mounted in the experimental device (Figure 5).
Figure 5.
The force/moment measurement system overview.
Digital image correlation method to measure experimental clear aligner’s displacement and strain
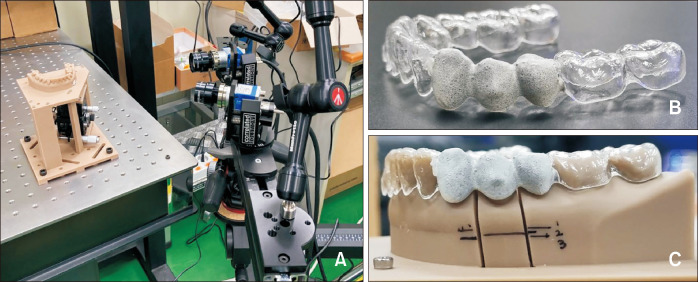
Eight CA groups were sprayed with a speckle pattern coating on the mandibular canine and first and second premolars using a Harder and Steenbeck infinity airbrush (HARDER & STEENBECK, Norderstedt, Germany) for the DIC method. Subsequently, DIC was performed using two high-resolution, ultra-high-speed cameras (VIC-3D; Correlated Solutions, Irmo, SC, USA) (Figure 6). The images were analyzed for displacement and strain changes in each part of the CA when extrusive forces were applied to the mandibular first premolars.
Figure 6.
Experimental set-up for digital image correlation method. A, Images taken using two cameras; B, Clear aligner after speckle pattern coating; and C, Aligner mounted on the experimental apparatus.
Statistical analysis
Data were obtained for all forces (Fx, Fy, and Fz) and moments (Mx, My, and Mz) of each tooth in all experimental groups, with 15 experiments in each group. As the data did not follow a normal distribution, we compared the force and moment values for each tooth in each group using the median and interquartile ranges.
The Kruskal–Wallis test was used as the nonparametric comparison test, and Bonferroni correction was used as the post-hoc test. Statistical significance was set at P < 0.05. All data were analyzed using SPSS software (version 29.0; IBM Corp., Armonk, NY, USA).
RESULTS
Forces generated by different clear aligner designs with first premolar attachment
Table 2 presents the forces generated by different CA designs with attachments on the mandibular first premolar. With attachments on the mandibular first premolars, forces occurred in the distal direction (-Fx) in the canines in all groups, with no significant differences between the groups. Buccal forces in the buccolingual direction (Fy) occurred only in Group 4. In addition, Group 4 generated an intrusion force (Fz) with a median of 0.05 N, whereas the other groups generated an intrusion force with a median of −0.68 N to −0.12 N, which was significantly different.
Table 2.
Comparison of forces generated by direct printed 3D aligners of the 4 tested groups on lower canine, first premolar, and second premolar with attachment
| Group | Force x-axis (median, IQR) | Statistics | Post-hoc analysis | Force y-axis (median, IQR) | Statistics | Post-hoc analysis | Force z-axis (median, IQR) | Statistics | Post-hoc analysis |
|---|---|---|---|---|---|---|---|---|---|
| #33 | |||||||||
| Group 1. Equi-margina | −0.13, 0.12 |
H = 3.091 df = 3 P = 0.378 |
abcd | −0.06, 0.50 |
H = 23.341 df = 3 P < 0.001*** |
abcd | −0.44, 0.25 |
H = 41.125 df = 3 P < 0.001*** |
abc* |
| Group 2. 1-mm extened marginb | −0.06, 0.11 | abcd | −0.23, 0.15 | abc* | −0.68, 0.05 | ab* | |||
| Group 3. Equi-margin with 1-mm thickness and heightc | −0.10, 0.06 | abcd | −0.08, 0.09 | abc* | −0.12, 0.10 | ac* | |||
| Group 4. Equi-margin with 1-mm reduced buccolingual widthd | −0.04, 0.10 | abcd | 0.08, 0.11 | ad* | 0.05, 0.25 | d* | |||
| #34 | |||||||||
| Group 1. Equi-margina | −0.09, 0.39 |
H = 4.292 df = 3 P = 0.232 |
abcd | −0.02, 0.38 |
H = 13.109 df = 3 P = 0.004** |
acd* | 0.27, 0.66 |
H = 30.539 df = 3 P < 0.001*** |
acd* |
| Group 2. 1-mm extened marginb | −0.08, 0.15 | abcd | −0.25, 0.36 | bd* | 0.96, 0.87 | bd* | |||
| Group 3. Equi-margin with 1-mm thickness and heightc | −0.04, 0.27 | abcd | 0.06, 0.32 | acd* | 0.08, 0.12 | ac* | |||
| Group 4. Equi-margin with 1-mm reduced buccolingual widthd | 0.02, 0.17 | abcd | −0.12, 0.45 | abcd | 0.46, 0.72 | ad* | |||
| #35 | |||||||||
| Group 1. Equi-margina | 0.06, 0.12 |
H = 4.608 df = 3 P = 0.203 |
abcd | 0.07, 0.10 |
H = 29.138 df = 3 P < 0.001*** |
ab* | −0.44, 0.44 |
H = 25.564 df = 3 P < 0.001*** |
abc* |
| Group 2. 1-mm extened marginb | 0.13, 0.14 | abcd | −0.004, 0.08 | abc* | −0.49, 0.12 | abc* | |||
| Group 3. Equi-margin with 1-mm thickness and heightc | 0.08, 0.09 | abcd | −0.05, 0.10 | bc* | −0.14, 0.50 | abc* | |||
| Group 4. Equi-margin with 1-mm reduced buccolingual widthd | 0.10, 0.14 | abcd | −0.17, 0.04 | d* | 0.11, 0.55 | d* | |||
The Kruskal–Wallis test with Bonferroni correction was performed for post-hoc multiple comparisons.
Different letters among the groups indicate a statistically significant difference at adjusted P values < 0.05, according to post-hoc comparisons using the Bonferroni correction.
IQR, interquartile range.
*Statistically significant difference at adjusted P < 0.05; **statistically significant difference at adjusted P < 0.01; ***statistically significant difference at adjusted P < 0.001.
Mesiodistal force (Fx) in the first premolar was not significantly different between the groups. The greatest lingual force was observed in Group 2. The extrusion force (Fz) was significantly lower in Group 3 than in the other groups, with the highest extrusion forces observed in Groups 2, 4, 1, and 3.
Forces were generated on the second premolars in the mesial direction (Fx) in all groups. Only Group 4 showed significant lingual and extrusion forces, whereas the other groups showed weak intrusion forces.
Forces generated by different clear aligner designs without attachment on the first premolar
Table 3 presents the forces generated by different CA designs without the mandibular first premolar attachment. Without the first premolar attachment, the canine produced a force in the distal direction (-Fx) in all groups except Group 4. Lingual forces in the Fy direction were greater in Group 1 than in the other groups. Additionally, intrusion forces occurred in all the groups.
Table 3.
Comparison of forces generated by direct printed 3D aligners of the 4 tested groups on lower canine, first premolar, and second premolar without attachment
| Group | Force x-axis (median, IQR) | Statistics | Post-hoc analysis | Force y-axis (median, IQR) | Statistics | Post-hoc analysis | Force z-axis (median, IQR) | Statistics | Post-hoc analysis |
|---|---|---|---|---|---|---|---|---|---|
| #33 | |||||||||
| Group 1. Equi-margina | −0.16, 0.11 |
H = 26.759 df = 3 P < 0.001*** |
abc* | −0.18, 0.18 |
H = 9.238 df = 3 P = 0.026* |
abc* | −1.09, 0.69 |
H = 30.185 df = 3 P < 0.001*** |
ab* |
| Group 2. 1-mm extened marginb | −0.15, 0.10 | abcd | −0.04, 0.71 | abcd | −0.89, 0.11 | ab* | |||
| Group 3. Equi-margin with 1-mm thickness and heightc | −0.16, 0.05 | abc* | −0.06, 0.21 | abcd | −0.33, 0.59 | cd* | |||
| Group 4. Equi-margin with 1-mm reduced buccolingual widthd | 0.04, 0.27 | bd* | −0.01, 0.26 | bcd* | −0.45, 0.25 | cd* | |||
| #34 | |||||||||
| Group 1. Equi-margina | −0.18, 0.32 |
H = 18.749 df = 3 P < 0.001*** |
ab* | −0.11, 0.18 |
H = 12.708 df = 3 P = 0.005** |
abcd | −1.07, 0.98 |
H = 16.298 df = 3 P < 0.001*** |
ab* |
| Group 2. 1-mm extened marginb | −0.08, 0.15 | abcd | 0.03, 0.16 | abc* | −0.92, 0.81 | abcd | |||
| Group 3. Equi-margin with 1-mm thickness and heightc | 0.04, 0.16 | bcd* | 0.03, 0.61 | abcd | −0.36, 0.92 | bcd* | |||
| Group 4. Equi-margin with 1-mm reduced buccolingual widthd | −0.05, 0.17 | bcd* | −0.26, 0.35 | acd* | −0.35, 0.48 | bcd* | |||
| #35 | |||||||||
| Group 1. Equi-margina | −0.21, 0.15 |
H = 19.189 df = 3 P < 0.001*** |
abcd | −0.02, 0.25 |
H = 3.369 df = 3 P = 0.338 |
abcd | −1.07, 0.72 |
H = 29.942 df = 3 P < 0.001*** |
ab* |
| Group 2. 1-mm extened marginb | −0.31, 0.17 | abc* | 0.02, 0.17 | abcd | −1.69, 0.72 | ab* | |||
| Group 3. Equi-margin with 1-mm thickness and heightc | −0.17, 0.49 | abcd | 0.07, 0.34 | abcd | −0.43, 0.82 | cd* | |||
| Group 4. Equi-margin with 1-mm reduced buccolingual widthd | 0.08, 0.32 | acd* | −0.03, 0.32 | abcd | −0.34, 0.91 | cd* | |||
The Kruskal–Wallis test with Bonferroni correction was performed for post-hoc multiple comparisons.
Different letters among the groups indicate a statistically significant difference at adjusted P values < 0.05, according to post-hoc comparisons using the Bonferroni correction.
IQR, interquartile range.
*Statistically significant difference at adjusted P < 0.05; **statistically significant difference at adjusted P < 0.01; ***statistically significant difference at adjusted P < 0.001.
Group 1 showed a relatively greater distal force in the first premolars than the other groups. Contrary to the experimental plan, all groups produced an intrusive force, with Groups 3 and 4 showing weaker intrusive forces than Group 1.
The force on the second premolars was distalized (Fx) in all groups except Group 4, with all the groups generating an intrusive force.
Moments generated by different clear aligner designs with first premolar attachment
Table 4 presents the moments generated by different CA designs with attachments on the mandibular first premolar. With attachment to the first premolars, the canine showed a buccal inclination in Groups 2 and 4 (x-axis) and a relatively greater mesial angulation in Group 4 than in the other groups (y-axis). Group 4 showed moments of distal rotation, whereas mesial rotation was evident in Group 1 (z-axis).
Table 4.
Comparison of moments generated by direct printed 3D aligners of the 4 tested groups on lower canine, first premolar, and second premolar with attachment
| Group | Moments x-axis (median, IQR) | Statistics | Post-hoc analysis | Moments y-axis (median, IQR) | Statistics | Post-hoc analysis | Moments z-axis (median, IQR) | Statistics | Post-hoc analysis |
|---|---|---|---|---|---|---|---|---|---|
| #33 | |||||||||
| Group 1. Equi-margina | 0.08, 0.66 |
H = 36.585 df = 3 P < 0.001*** |
ac* | 0.22, 1.62 |
H = 5.758 df = 3 P = 0.124 |
abcd | −1.03, 0.96 |
H = 32.170 df = 3 P < 0.001*** |
ab* |
| Group 2. 1-mm extened marginb | 1.53, 0.55 | bd* | 0.11, 0.05 | abcd | −0.38, 0.43 | abc* | |||
| Group 3. Equi-margin with 1-mm thickness and height c | −0.49, 0.64 | ac* | 0.11, 1.51 | abcd | 0.17, 0.07 | bcd* | |||
| Group 4. Equi-margin with 1-mm reduced buccolingual widthd | 0.90, 1.18 | bd* | 0.72, 1.11 | abcd | 0.77, 1.31 | cd* | |||
| #34 | |||||||||
| Group 1. Equi-margina | 2.49, 2.65 |
H = 15.733 df = 3 P = 0.001** |
abcd | 0.29, 0.66 |
H = 30.885 df = 3 P < 0.001*** |
abc* | 0.02, 0.26 |
H = 27.190 df = 3 P < 0.001*** |
ac* |
| Group 2. 1-mm extened marginb | 5.27, 7.58 | abc* | 0.21, 1.13 | abc* | 1.09, 0.74 | bcd* | |||
| Group 3. Equi-margin with 1-mm thickness and heightc | 3.89, 2.41 | abc* | 0.19, 0.66 | abc* | 0.36, 0.13 | abcd | |||
| Group 4. Equi-margin with 1-mm reduced buccolingual widthd | 1.19, 2.98 | ad* | −1.10, 0.80 | d* | 0.97, 0.91 | bcd* | |||
| #35 | |||||||||
| Group 1. Equi-margina | −0.86, 1.67 |
H = 30.722 df = 3 P < 0.001*** |
a* | −1.25, 1.60 |
H = 28.658 df = 3 P < 0.001*** |
ab* | −0.17, 1.36 |
H = 11.090 df = 3 P = 0.011* |
abcd |
| Group 2. 1-mm extened marginb | 0.31, 2.18 | bcd* | −1.19, 0.84 | ab* | −0.40, 1.75 | abc* | |||
| Group 3. Equi-margin with 1-mm thickness and heightc | 1.35, 0.52 | bcd* | −0.34, 1.10 | cd* | 0.16, 1.79 | abcd | |||
| Group 4. Equi-margin with 1-mm reduced buccolingual widthd | 0.95, 0.57 | bcd* | 0.05, 1.43 | cd* | 0.12, 0.41 | acd* | |||
The Kruskal–Wallis test with Bonferroni correction was performed for post-hoc multiple comparisons.
Different letters among the groups indicate a statistically significant difference at adjusted P values < 0.05, according to post-hoc comparisons using the Bonferroni correction.
IQR, interquartile range.
*Statistically significant difference at adjusted P < 0.05; **statistically significant difference at adjusted P < 0.01; ***statistically significant difference at adjusted P < 0.001.
The first premolars showed a buccal inclination in all groups, with only Group 4 showing distal angulation. The rotation moments were relatively large in the distal direction in Groups 2 and 4.
In the second premolars, Groups 2, 3, and 4 showed weak buccal inclination, whereas Groups 1 and 2 showed significant distal angulation. Additionally, Groups 1 and 2 showed weak mesial rotation.
Moments generated by different designs of clear aligner without attachment on the first premolar
Table 5 presents the moments generated by different CA designs without attachment on the mandibular first premolar. In canines without attachment to the first premolars, Group 2 showed a lingual inclination, whereas the other groups showed a buccal inclination. At the moment of angulation, only Group 1 showed mesial angulation. In addition, Groups 2 and 3 showed distal rotation.
Table 5.
Comparison of moments generated by direct printed 3D aligners of the 4 tested groups on lower canine, first premolar, and second premolar without attachment
| Group | Moments x-axis (median, IQR) | Statistics | Post-hoc analysis | Moments y-axis (median, IQR) | Statistics | Post-hoc analysis | Moments z-axis (median, IQR) | Statistics | Post-hoc analysis |
|---|---|---|---|---|---|---|---|---|---|
| #33 | |||||||||
| Group 1. Equi-margina | 1.56, 1.46 |
H = 28.318 df = 3 P < 0.001*** |
acd* | 0.50, 0.92 |
H = 18.927 df = 3 P < 0.001*** |
a* | 0.10, 1.67 |
H = 20.972 df = 3 P < 0.001*** |
acd* |
| Group 2. 1-mm extened marginb | −1.06, 1.36 | b* | −0.51, 0.45 | bcd* | −0.70, 0.69 | bc* | |||
| Group 3. Equi-margin with 1-mmthickness and heightc | 1.97, 2.57 | acd* | −0.31, 0.93 | bcd* | −0.34, 1.40 | abc* | |||
| Group 4. Equi-margin with 1-mm reduced buccolingual widthd | 1.94, 1.58 | acd* | −0.12, 0.48 | bcd* | 0.10, 0.39 | ad* | |||
| #34 | |||||||||
| Group 1. Equi-margina | 4.50, 4.09 |
H = 20.583 df = 3 P < 0.001*** |
abc* | 0.87, 1.05 |
H = 16.161 df = 3 P = 0.001** |
abd* | 0.50, 1.15 |
H = 17.824 df = 3 P < 0.001*** |
abcd |
| Group 2. 1-mm extened marginb | 4.79, 1.38 | abc* | −0.04, 0.59 | abcd | 1.02, 0.78 | abc* | |||
| Group 3. Equi-margin with 1-mm thickness and heightc | 2.57, 2.02 | abcd | −0.28, 0.72 | bcd* | 1.00, 0.86 | abc* | |||
| Group 4. Equi-margin with 1-mm reduced buccolingual widthd | −0.06, 2.53 | cd* | 0.15, 0.47 | abcd | 0.20, 0.51 | ad* | |||
| #35 | |||||||||
| Group 1. Equi-margina | −0.47, 2.56 |
H = 7.106 df = 3 P = 0.069 |
abcd | −1.36, 1.83 |
H = 2.870 df = 3 P = 0.412 |
abcd | −0.72, 3.04 |
H = 3.350 df = 3 P = 0.341 |
abcd |
| Group 2. 1-mm extened marginb | 0.33, 1.51 | abcd | −0.69, 1.26 | abcd | −0.07, 1.83 | abcd | |||
| Group 3. Equi-margin with 1-mm thickness and heightc | −0.09, 2.64 | abcd | 0.93, 1.28 | abcd | −0.79, 2.39 | abcd | |||
| Group 4. Equi-margin with 1-mm reduced buccolingual widthd | −0.65, 1.32 | abcd | −0.06, 2.57 | abcd | 0.64, 2.71 | abcd | |||
The Kruskal–Wallis test with Bonferroni correction was performed for post-hoc multiple comparisons.
Different letters among the groups indicate a statistically significant difference at adjusted P values < 0.05, according to post-hoc comparisons using the Bonferroni correction.
IQR, interquartile range.
*Statistically significant difference at adjusted P < 0.05; **statistically significant difference at adjusted P < 0.01; ***statistically significant difference at adjusted P < 0.001.
The moments at the first premolars showed a buccal inclination in all groups except Group 4, with mesial rotation observed in all the groups.
No significant differences in moment values were observed between the groups in the second premolars.
Displacement field in buccal surface of clear aligner
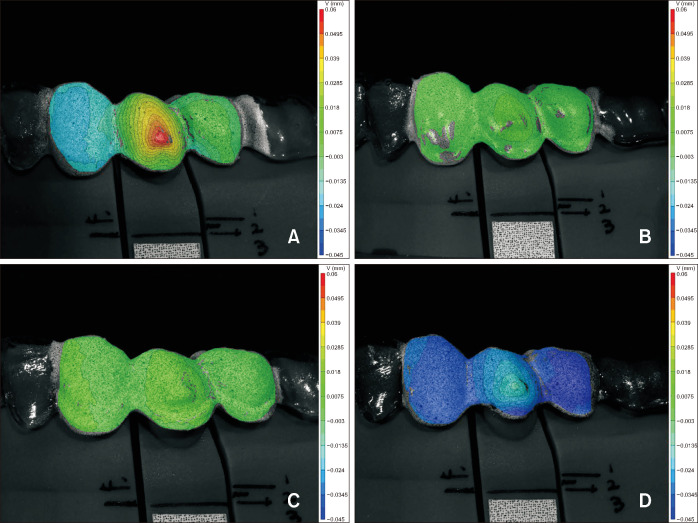
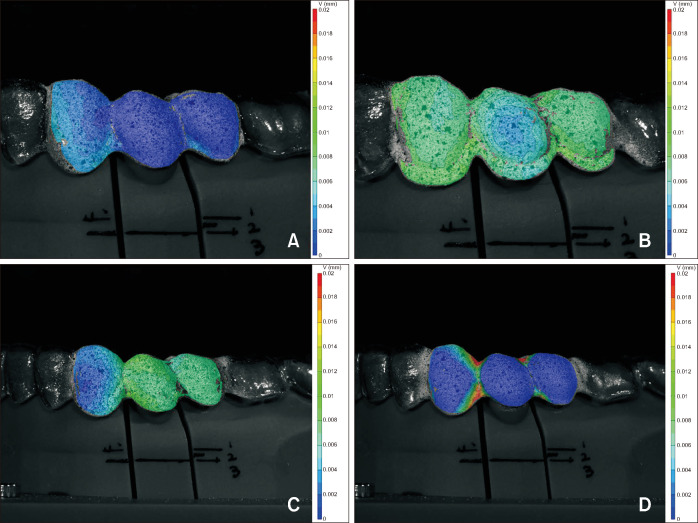
Figure 7 shows the displacement field measured on the surface of the aligner in each of the four groups for the first premolars with attachment and Figure 8 for those without attachment. In the groups with attachments, displacement was significantly more concentrated around the attachment than elsewhere. In Groups 1 and 4, the displacement around the attachment was particularly prominent (Figure 7).
Figure 7.
Displacement field in surface load with attachment. A, Group 1 (equi-margin); B, Group 2 (1-mm extended margin); C, Group 3 (equi-margin with 1-mm thickness and height); and D, Group 4 (equi-margin with reduced buccolingual width).
Figure 8.
Displacement field in surface load without attachment. A, Group 1 (equi-margin); B, Group 2 (1-mm extended margin); C, Group 3 (equi-margin with 1-mm thickness and height); and D, Group 4 (equi-margin with reduced buccolingual width).
In the group without attachment, displacement was not concentrated in the first premolar; however, overall displacement was observed in the canines and the first and second premolars, with slightly different patterns depending on the design. In particular, in Group 4, unlike the other groups, the displacement of the first premolar was significantly higher in the proximal area (Figure 8).
Major principal strain
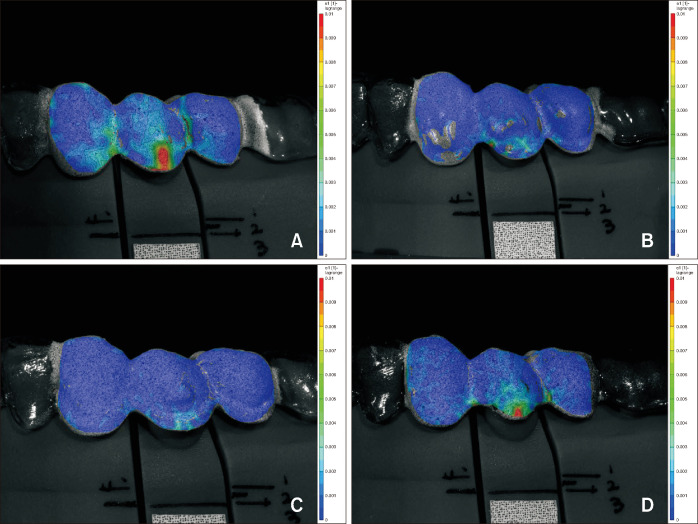
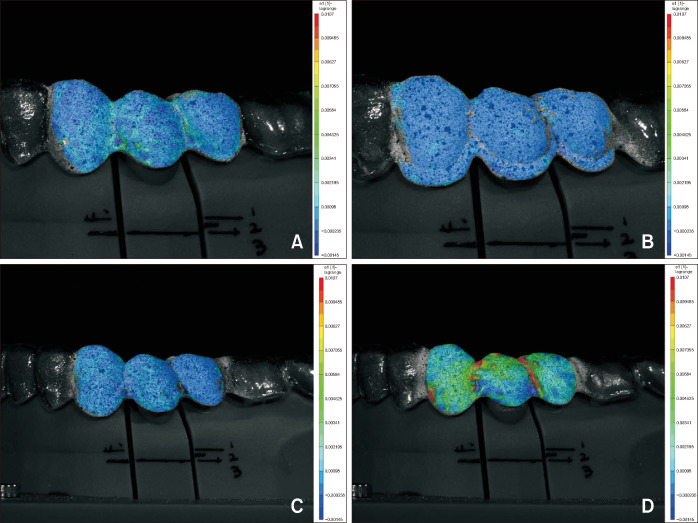
Figures 9 and 10 show the principal strains in the four groups with and without attachments, respectively.
Figure 9.
Major principal strain with attachment. A, Group 1 (equi-margin); B, Group 2 (1-mm extended margin); C, Group 3 (equi-margin with 1-mm thickness and height); and D, Group 4 (equi-margin with reduced buccolingual width).
Figure 10.
Major principal strain without attachment. A, Group 1 (equi-margin); B, Group 2 (1-mm extended margin); C, Group 3 (equi-margin with 1-mm thickness and height); and D, Group 4 (equi-margin with reduced buccolingual width).
With attachment, all groups exhibited strain at the bottom margin (Figure 9).
In the absence of attachment, no consistent trend among groups was observed. However, in Group 4, distinct deformation in the proximal and marginal areas of the aligner was noted, whereas a recurring pattern of expansion and contraction was observed in the other groups (Figure 10).
DISCUSSION
When fabricating CA from thermoplastic materials, various shrinkages and expansions can occur depending on the thermoforming material or during the thermoforming process itself, resulting in uneven thicknesses and changes in properties,11 with thickness variations ranging from 57.5% to 92.6% during the fabrication process.12,13 The thickness unevenness of the CA substantially affects the magnitude of the force transmitted to the teeth.
Direct 3D printing has recently been developed to increase the precision of the manufacturing process of CA.7,14 3D printed CA has advantages in terms of thickness uniformity and fit, and its flexibility and viscoelastic properties allow for the continuous application of light forces during orthodontic treatment. In addition, 3D printing enables the thickness or shape of certain parts of aligners to be changed, making it easier to implement the desired aligner design.15
We first analyzed how the presence of attachment affected the extrusion of the first premolar. The results showed that attachment is a key factor in the extrusion of the mandibular first premolar. Savignano et al.16 also concluded through FEA that using rectangular attachments could improve the efficiency of the CA during the extrusion of maxillary incisors by increasing the contact area and that movement could not be achieved without attachments.
Previous studies on the efficacy of CA treatment in relation to orthodontic extrusion have reported more variability and less predictability than other orthodontic treatments.17,18 Similarly, the need for attachments was also confirmed in this study; however, the shape of the attachment in this study was dome-shaped, which was different from the horizontal attachment suggested by Rossini et al.19 to be most effective for extrusion. A recent retrospective study found no significant difference in effectiveness between conventional and optimized attachments in achieving the extrusion for mild discrepancy with a required extrusion of 0.3–2.5 mm.20 Therefore, that the results of this study might be similar to other types of attachment designs. However, Kim et al.21 suggested that cylindrical lingual attachments were the most suitable for extrusion; therefore, further research is needed to determine whether the attachment is positioned lingually.
Another result of this study was that design modifications such as extending the margin length or reducing the buccolingual margin width of the CA may be effective in improving extrusion. However, among the various designs, increasing the thickness of the margin did not significantly improve extrusion, and it is considered that the design of the CA should be changed to a structure that can efficiently apply force to the cervical region. Yao et al.22 performed a finite element methods (FEM) analysis of a CA with an internal embossment to apply pressure to the cervical area and promote torque control. The results showed that the embossment inside the CA improved movement efficiency but resulted in uncontrolled torque and tilting movement,6 which was caused by insufficient support of the aligners on the opposite side of the crown.23 This was also confirmed in this study, as the value of Mx of the first premolar showed minimal moment in Group 4. Therefore, Group 4 had a 1 mm reduction in the buccolingual margin width of the CA, which was interpreted as increased support of the CA on the lingual side.
However, when the outer surface of the CA was thickened instead of the inner surface, as in Group 3, the extrusion force was significantly lower, even with attachment. The efficiency of CA treatment is affected by factors other than attachment, such as margin thickening. The thickness of the CA is an important variable in relation to the magnitude and duration of the orthodontic forces applied to the teeth.24,25 This is because thicker aligners increased the minimum and maximum von Mises stresses, which increased the forces transmitted to the teeth.26 However, this study did not show significantly more efficient tooth movement in Group 3 with thicker margins, indicating the need for further studies with different designs and more efficient areas of thickness.
In contrast, intrusive forces were generated in all the groups, particularly in the first premolars. These results were consistent with those of previous studies on maxillary incisor extrusion, which showed relatively large intrusive forces without attachments or power ridges.27 These results indicate that the force system generated by the CA in the absence of attachments is difficult to predict and cannot be simplified to the force system generated by conventional wires and brackets owing to the interaction of various factors, such as the viscoelasticity of the aligner materials, contact surface, and force between the CA and teeth.
The results of this study showed that Groups 2 and 4 delivered adequate extrusion forces at attachment, with a median of 0.96 N and 0.46 N, respectively, whereas the other groups did not. Extrusion movement requires a force system with only one force; therefore, the most effective design should provide a maximum contact surface in the xy plane through the CA to transfer the force to Fz only, with the contact surface located as close as possible to the center of resistance in each axis to avoid undesirable results.16 Therefore, the design that increased the buccal contact surface by extending the margin by 1 mm (Group 2) and reducing the buccolingual width of the margin (Group 4) was more likely to transmit the static force close to the center of resistance.
The difference between the planned movement, the measured forces and moments, and the lack of extrusion force during premolar extrusion can be interpreted by analyzing CA deformation. In this study, the DIC method was used to determine the location of displacement and strain of the CA by group. The displacement was concentrated around the attachment in the group with attachment. Strains also occurred at the inferior part of the attachment in most groups. These results were consistent with those of a previous FEM study of open bite, which showed that the greatest strain occurred in the lateral incisors, especially at the gingival margin.19 However, most groups showed variations in strain not only below the attachment but also above the occlusal and proximal surfaces. Therefore, the variations in displacement and strain in this study can be understood as a result of the complexity of the DIC method, owing to the viscoelastic properties of the aligner material, the contact area between the tooth and CA, and the forces applied at the contact surface. In the future, more studies on various tooth movements should be conducted to comprehensively understand the results of the DIC method in conjunction with the force/moment values applied to the teeth.
Although DIC is based on a 3D method, it can show only one side of a CA. Since a CA consists of a single viscoelastic material, changes in one part can affect the entire aligner. While the DIC method can be used to analyze these changes, it is challenging. Applying the DIC method to various tooth movements can yield more accurate and diverse interpretations if an effective experimental environment is established and data are accumulated.
In this study, we quantitatively measured the forces and moments generated when applying an extrusion force using CA and examined the morphological changes resulting from the material properties of CA using the DIC method. Nonetheless, it is important to note that the force and moment measurement system may not perfectly replicate the real oral environment because it is challenging to incorporate all biomechanical factors, such as periodontal ligaments and tooth roots, into the mechanical components. As this aspect of the system is established, the gradual inclusion of biological elements into the mechanism is expected to enhance its accuracy.
Furthermore, it would be helpful to design a similar study comparing CAs fabricated by direct 3D printing with those made by traditional vacuum-forming techniques to understand the material-dependent properties of CA.
Limitations
In this study, we used high-precision sensors whose specifications, including limits and resolutions for forces/moments, were provided and guaranteed by the manufacturer. Based on the established use and validation of these sensors in similar studies7,27 and often focusing on the precision and calibration standards provided by sensor manufacturers, we initially determined that no additional reliability assessment was necessary for the scope of our experimental analysis.
However, conducting measurement reliability assessments through intraclass correlation coefficient calculations could further strengthen our study by quantifying the consistency of sensor outputs under similar conditions across multiple experiments.
CONCLUSIONS
This study used a system capable of quantitatively measuring the force and moment generated by CA to apply an orthodontic force to the intruded mandibular first premolars, and this study also verified the morphological changes caused by the material properties of the aligners using the DIC method. Both the force and moment measurement system and the DIC method revealed that attachment plays an important role in the extrusion of the first premolar and that morphological changes, such as margin extension and margin reduction of the buccolingual width of the first premolar, could improve the efficiency of tooth movement.
Footnotes
AUTHOR CONTRIBUTIONS
Conceptualization: YIK. Data curation: JCB, YC. Formal analysis: YKC, YIK. Funding acquisition: YKC, YIK. Investigation: JCB, SHK. Methodology: KBK, YC. Project administration: SSK, SBP. Resources: KBK. Software: YC, YB. Supervision: YIK, SSK. Validation: YIK. Visualization: YC, YB. Writing–original draft: JCB. Writing–review & editing: YKC, YIK.
CONFLICTS OF INTEREST
No potential conflict of interest relevant to this article was reported.
FUNDING
This study was supported by a Biomedical Research Institute Grant (20240051) from Pusan National University Hospital.
REFERENCES
- 1.Meade MJ, Weir T. A survey of orthodontic clear aligner practices among orthodontists. Am J Orthod Dentofacial Orthop. 2022;162:e302–11. doi: 10.1016/j.ajodo.2022.08.018. https://doi.org/10.1016/j.ajodo.2022.08.018. [DOI] [PubMed] [Google Scholar]
- 2.Galan-Lopez L, Barcia-Gonzalez J, Plasencia E. A systematic review of the accuracy and efficiency of dental movements with Invisalign®. Korean J Orthod. 2019;49:140–9. doi: 10.4041/kjod.2019.49.3.140. https://doi.org/10.4041/kjod.2019.49.3.140. [DOI] [PMC free article] [PubMed] [Google Scholar]
- 3.Rossini G, Parrini S, Castroflorio T, Deregibus A, Debernardi CL. Efficacy of clear aligners in controlling orthodontic tooth movement: a systematic review. Angle Orthod. 2015;85:881–9. doi: 10.2319/061614-436.1. https://doi.org/10.2319/061614-436.1. [DOI] [PMC free article] [PubMed] [Google Scholar]
- 4.Haouili N, Kravitz ND, Vaid NR, Ferguson DJ, Makki L. Has Invisalign improved? A prospective follow-up study on the efficacy of tooth movement with Invisalign. Am J Orthod Dentofacial Orthop. 2020;158:420–5. doi: 10.1016/j.ajodo.2019.12.015. https://doi.org/10.1016/j.ajodo.2019.12.015. [DOI] [PubMed] [Google Scholar]
- 5.Meng X, Wang C, Xu W, Wang R, Zheng L, Wang C, et al. Effects of different designs of orthodontic clear aligners on the maxillary central incisors in the tooth extraction cases: a biomechanical study. BMC Oral Health. 2023;23:416. doi: 10.1186/s12903-023-03106-8. https://doi.org/10.1186/s12903-023-03106-8. 730e97a860524051b1e7c5382f99c1a4 [DOI] [PMC free article] [PubMed] [Google Scholar]
- 6.Cheng Y, Liu X, Chen X, Li X, Fang S, Wang W, et al. The three-dimensional displacement tendency of teeth depending on incisor torque compensation with clear aligners of different thicknesses in cases of extraction: a finite element study. BMC Oral Health. 2022;22:499. doi: 10.1186/s12903-022-02521-7. https://doi.org/10.1186/s12903-022-02521-7. 768eaba0adc04a52a78c1a6fe69c8a2e [DOI] [PMC free article] [PubMed] [Google Scholar]
- 7.Grant J, Foley P, Bankhead B, Miranda G, Adel SM, Kim KB. Forces and moments generated by 3D direct printed clear aligners of varying labial and lingual thicknesses during lingual movement of maxillary central incisor: an in vitro study. Prog Orthod. 2023;24:23. doi: 10.1186/s40510-023-00475-2. https://doi.org/10.1186/s40510-023-00475-2. dde3a9dad6254735b63e88aa717b05b0 [DOI] [PMC free article] [PubMed] [Google Scholar]
- 8.Jiang T, Wu RY, Wang JK, Wang HH, Tang GH. Clear aligners for maxillary anterior en masse retraction: a 3D finite element study. Sci Rep. 2020;10:10156. doi: 10.1038/s41598-020-67273-2. https://doi.org/10.1038/s41598-020-67273-2. [DOI] [PMC free article] [PubMed] [Google Scholar]
- 9.Cai Y, Yang X, He B, Yao J. Finite element method analysis of the periodontal ligament in mandibular canine movement with transparent tooth correction treatment. BMC Oral Health. 2015;15:106. doi: 10.1186/s12903-015-0091-x. https://doi.org/10.1186/s12903-015-0091-x. [DOI] [PMC free article] [PubMed] [Google Scholar]
- 10.Yokoi Y, Arai A, Kawamura J, Uozumi T, Usui Y, Okafuji N. Effects of attachment of plastic aligner in closing of diastema of maxillary dentition by finite element method. J Healthc Eng. 2019;2019:1075097. doi: 10.1155/2019/1075097. https://doi.org/10.1155/2019/1075097. [DOI] [PMC free article] [PubMed] [Google Scholar]
- 11.Johal A, Sharma NR, McLaughlin K, Zou LF. The reliability of thermoform retainers: a laboratory-based comparative study. Eur J Orthod. 2015;37:503–7. doi: 10.1093/ejo/cju075. https://doi.org/10.1093/ejo/cju075. [DOI] [PubMed] [Google Scholar]
- 12.Min S, Hwang CJ, Yu HS, Lee SB, Cha JY. The effect of thickness and deflection of orthodontic thermoplastic materials on its mechanical properties. Korean J Orthod. 2010;40:16–26. doi: 10.4041/kjod.2010.40.1.16. https://doi.org/10.4041/kjod.2010.40.1.16. [DOI] [Google Scholar]
- 13.Ryokawa H, Miyazaki Y, Fujishima A, Miyazaki T, Maki K. The mechanical properties of dental thermoplastic materials in a simulated intraoral environment. Orthod Waves. 2006;65:64–72. doi: 10.1016/j.odw.2006.03.003. https://doi.org/10.1016/j.odw.2006.03.003. [DOI] [Google Scholar]
- 14.Lee SY, Kim H, Kim HJ, Chung CJ, Choi YJ, Kim SJ, et al. Thermo-mechanical properties of 3D printed photocurable shape memory resin for clear aligners. Sci Rep. 2022;12:6246. doi: 10.1038/s41598-022-09831-4. https://doi.org/10.1038/s41598-022-09831-4. 916cae2b1906469492ffad0957859600 [DOI] [PMC free article] [PubMed] [Google Scholar]
- 15.Tartaglia GM, Mapelli A, Maspero C, Santaniello T, Serafin M, Farronato M, et al. Direct 3D printing of clear orthodontic aligners: current state and future possibilities. Materials (Basel) 2021;14:1799. doi: 10.3390/ma14071799. https://doi.org/10.3390/ma14071799. [DOI] [PMC free article] [PubMed] [Google Scholar]
- 16.Savignano R, Valentino R, Razionale AV, Michelotti A, Barone S, D'Antò V. Biomechanical effects of different auxiliary-aligner designs for the extrusion of an upper central incisor: a finite element analysis. J Healthc Eng. 2019;2019:9687127. doi: 10.1155/2019/9687127. https://doi.org/10.1155/2019/9687127. [DOI] [PMC free article] [PubMed] [Google Scholar]
- 17.Kassas W, Al-Jewair T, Preston CB, Tabbaa S. Assessment of Invisalign treatment outcomes using the ABO model grading system. J World Fed of Orthod. 2013;2:e61–4. doi: 10.1016/j.ejwf.2013.03.003. https://doi.org/10.1016/j.ejwf.2013.03.003. [DOI] [Google Scholar]
- 18.Kravitz ND, Kusnoto B, Agran B, Viana G. Influence of attachments and interproximal reduction on the accuracy of canine rotation with Invisalign. A prospective clinical study. Angle Orthod. 2008;78:682–7. doi: 10.2319/0003-3219(2008)078[0682:IOAAIR]2.0.CO;2. https://doi.org/10.2319/0003-3219(2008)078[0682:ioaair]2.0.co;2. [DOI] [PubMed] [Google Scholar]
- 19.Rossini G, Modica S, Parrini S, Deregibus A, Castroflorio T. Incisors extrusion with clear aligners technique: a finite element analysis study. Appl Sci. 2021;11:1167. doi: 10.3390/app11031167. https://doi.org/10.3390/app11031167. 51c1fcdd298d49b6bffe6415c4a5d7be [DOI] [Google Scholar]
- 20.Karras T, Singh M, Karkazis E, Liu D, Nimeri G, Ahuja B. Efficacy of Invisalign attachments: a retrospective study. Am J Orthod Dentofacial Orthop. 2021;160:250–8. doi: 10.1016/j.ajodo.2020.04.028. https://doi.org/10.1016/j.ajodo.2020.04.028. [DOI] [PubMed] [Google Scholar]
- 21.Kim WH, Hong K, Lim D, Lee JH, Jung YJ, Kim B. Optimal position of attachment for removable thermoplastic aligner on the lower canine using finite element analysis. Materials (Basel) 2020;13:3369. doi: 10.3390/ma13153369. https://doi.org/10.3390/ma13153369. [DOI] [PMC free article] [PubMed] [Google Scholar]
- 22.Yao S, Jiang W, Wang C, He Y, Wang C, Huang L. Improvements of tooth movement efficiency and torque control in expanding the arch with clear aligners: a finite element analysis. Front Bioeng Biotechnol. 2023;11:1120535. doi: 10.3389/fbioe.2023.1120535. https://doi.org/10.3389/fbioe.2023.1120535. 9812c9117f514c2bb19d1c08d9050ae7 [DOI] [PMC free article] [PubMed] [Google Scholar]
- 23.Elkholy F, Panchaphongsaphak T, Kilic F, Schmidt F, Lapatki BG. Forces and moments delivered by PET-G aligners to an upper central incisor for labial and palatal translation. J Orofac Orthop. 2015;76:460–75. doi: 10.1007/s00056-015-0307-3. https://doi.org/10.1007/s00056-015-0307-3. [DOI] [PubMed] [Google Scholar]
- 24.Wheeler TT. Orthodontic clear aligner treatment. Semin Orthod. 2017;23:83–9. doi: 10.1053/j.sodo.2016.10.009. https://doi.org/10.1053/j.sodo.2016.10.009. [DOI] [Google Scholar]
- 25.Phan X, Ling PH. Clinical limitations of Invisalign. J Can Dent Assoc. 2007;73:263–6. https://pubmed.ncbi.nlm.nih.gov/17439714/ [PubMed] [Google Scholar]
- 26.Seo JH, Eghan-Acquah E, Kim MS, Lee JH, Jeong YH, Jung TG, et al. Comparative analysis of stress in the periodontal ligament and center of rotation in the tooth after orthodontic treatment depending on clear aligner thickness-finite element analysis study. Materials (Basel) 2021;14:324. doi: 10.3390/ma14020324. https://doi.org/10.3390/ma14020324. [DOI] [PMC free article] [PubMed] [Google Scholar]
- 27.McKay A, McCray J, Bankhead B, Lee MM, Miranda G, Adel SM, et al. Forces and moments generated during extrusion of a maxillary central incisor with clear aligners: an in vitro study. BMC Oral Health. 2023;23:495. doi: 10.1186/s12903-023-03136-2. https://doi.org/10.1186/s12903-023-03136-2. 8360f2497e2a4aceba8cf425ca374ac6 [DOI] [PMC free article] [PubMed] [Google Scholar]


