


Abstract
Functionally associated genes tend to be co-expressed, which indicates that they could also be co-regulated. Since co-regulation is usually governed by transcription factors via their specific binding elements, putative regulators can be identified from promoter sets of (co-expressed) genes by screening for over-represented nucleotide patterns. Here, we present a program, POCO, which discovers such over-represented patterns from either one or two promoter sets. Typical microarray experiments yield up- and down-regulated gene sets that may represent, for example, distinct defense pathways. Assuming that a functional transcription factor cannot simultaneously both up- and down-regulate the gene sets, its binding element should respectively be over- and under-represented in the corresponding promoter sets. This idea is implemented in POCO, which tests the hypothesis that the distributions of a pattern differ among three sets of promoters: up-regulated, down-regulated and randomly-chosen. In the program, pattern discovery is based on explicit enumeration of all possible patterns on the alphabet (A, C, G, T and N). The mean occurrences and SDs of the patterns are estimated using bootstrapping and their significance is assessed using ANOVA F-statistics, Tukey's honestly significantly difference test and P-values. The program is freely available at http://ekhidna.biocenter.helsinki.fi/poco.
INTRODUCTION
One important biological phenomenon that can be explored by using high-throughput genomic techniques combined with computational methods is gene regulation: which genes are regulated and what causes the regulation. Gene expression is typically regulated by two mechanisms working in concert. Chromatin remodeling controls closely located genes, whereas transcription factors activate or repress more distantly located genes. In chromatin remodeling, genes are regulated by altering the structure of DNA blocks, thus controlling the accessibility of the genes to the regulatory factors (1). In the second mechanism, regulated genes are identified via specific nucleotide patterns situated within the regulatory regions of the target genes (2). If a set of similarly expressed genes are distantly located, then the regulation is more likely to be governed by transcription factors, via their patterns, than by chromatin remodeling.
The usual computational pipeline to discover the regulatory transcription factors begins with the generation of the co-expressed gene groups, e.g. by gathering the gene groups from expression data. The second step is to analyze the promoter regions of these gene groups in order to detect over-represented nucleotide patterns that could indicate a co-regulation phenomenon. The final step is then to link the over-represented pattern(s) with a particular transcription factor(s) to create the hypothesis. Various algorithms and tools have been designed to screen for over-represented patterns, and thus also the associated regulatory factors, from an input promoter set. These tools fall into two main categories: probabilistic sequence models (3–5) and pattern enumerators (6–8). The advantage of probabilistic sequence model tools, such as Gibbs samplers, is the ability to find long and general patterns, but the disadvantage is the possibility of failing to find the correct one as a result of getting trapped in a locally optimal solution (8). Pattern enumeration tools are always guaranteed to find the globally optimal solution, because they analyze every pattern in the input set. However, they also have drawbacks, such as reporting multiple hits from a single original pattern, a limited pattern vocabulary and a relatively short pattern length. While one method is more suitable for one purpose and the other is more suitable for another, their goal is the same—to report biologically functional patterns.
To address the question of how to find biologically functional patterns, we have developed a program that can analyze either one or two input promoter sets. When the program is used to analyze two promoter sets, it cross-validates the found patterns. The cross-validation can be a powerful method to detect the true patterns from distinct cellular pathways or from oppositely expressed gene sets. For example, defense-related genes are needed when the cell is under pathogen attack, but genes needed during an attack of one pathogen can be harmful during an attack of another, and vice versa. Hence, when the first gene group is activated, the second must be repressed and when the second gene group is activated, the first must be repressed. An example is provided by the competition between salicylic acid and jasmonic acid defense-pathways in Arabidopsis thaliana (9). Assuming that both gene groups are regulated by transcription factors and that a single transcription factor cannot simultaneously both up- and down-regulate these given groups, there should be specific transcription factors and characteristic patterns for both gene groups. Otherwise, a common transcription factor would produce similar regulation for both groups and compromise the desired gene expressions. With these hypotheses, differently expressed genes belonging to distinct pathways can be exploited to filter unimportant patterns and to find biologically functional patterns.
METHODS
Principles of POCO
The basic idea of pattern discovery programs is that patterns occurring surprisingly often in the promoters of co-expressed genes can have a regulatory function. Our extended version of this idea is that the same regulatory pattern should not exist in oppositely expressed gene groups. In other words, biological patterns are expected to be over-represented in the promoters of one gene group and under-represented in the other, relative to each other and to the background promoter collection.
Overview of POCO
The program can be described in three parts. First, all patterns composed of the alphabet A, C, G, T and N (N is the wildcard and stands for any of A, C, G or T) that occur in the input promoter sequences or in their reverse complements and have the desired maximum length or length smaller than this are stored into suffix-trie (10). The N-degenerated wildcard forms are generated according to two rules: they must contain at least 4 nt and the first or the last nucleotide must not be N. All full-length patterns as well as their smaller sub-patterns are automatically analyzed, and thus the user is not obligated to perform different analyses for different pattern lengths.
Second, the means and SDs of pattern occurrences in the input promoter sets and in the background promoter collection are estimated by using bootstrap simulations (11). Bootstrap simulations are performed in a manner similar to the one performed by our previous algorithm (12). Briefly, simulations are performed for each of the three promoter datasets. In these simulations, an equal number of promoters are selected by using random sampling with replacement and this is repeated (11). Both the number of promoters to be selected with random sampling with replacement and the number of repeats are user determinable. The use of the bootstrapped pattern occurrences rather than raw occurrences leads to normally distributed samples and allows the application of statistical tests for equal size data. It can also be noted that the simulations allow the elimination of uninteresting and repeated patterns with statistical tests, because patterns that occur multiple times in few promoters tend to have bigger SDs than patterns that are more evenly distributed.
Third, similarities and dissimilarities between the pattern distributions are evaluated and the patterns are grouped using ANOVA, honestly significantly difference (HSD) test and P-values. ANOVA measures the differences between the means of more than two groups, and its null hypothesis is that the means are the same (13). ANOVA is calculated from the bootstrap estimated means and deviations and its result, the F-score, gives the magnitude of the difference (larger F-scores indicate larger difference than smaller ones). The program also groups the patterns into five groups by calculating the HSD-test (Q-value) for each pair of the three datasets and by comparing results (13). The significance of the patterns is then reported to the users with P-values, which is the probability to find a larger F-score from the data by chance (13). In the program, P-values are calculated from a standardized f-distribution, where each F-score, and pattern, has a corresponding P-value and the interesting P-values locate in the extreme right-hand tail. The P-values are calculated using the observed F-score distribution of analyzed patterns, which is translated to correspond to the standardized f-distribution, if necessary. As a result, P-values that are highly consistent with those in the random data are reported (for detailed explanation of the statistics and equations see Supplementary Material).
Inputs to POCO
To start POCO, users give their promoter sequence set(s) and set a few parameters (see Supplementary Figure 2). The input promoter set(s), for which reversible complementary strands are automatically generated, must be in FASTA format. Other parameters: ‘promoter length’ is the length of the sequences retrieved for the background calculation as well as the truncation length for the input sequences (shorter sequences are accepted). ‘Motif length’ is the maximum number of nucleotides in the searched patterns. ‘Motifs to report’ is the number of patterns grouped into the five groups and reported to the user (all discovered patterns can be downloaded from the all-file). ‘Min occurrence’ excludes patterns that occur in less than this number of promoters. For example, if the value is 4 and the input set has 20 promoters, then patterns occurring in 4 or more promoters are analyzed. ‘Chosen background’ is the used background organism; the full background promoter collection consists of the promoter sequences of all known genes in this organism. Since comparison points for the significance of a pattern are generated from the real promoter sequences, constraints to remove duplicated TA-repeats, poly(A) or poly(T) etc. are not required. Currently, there are seven organisms available: Anopheles gambiae, A.thaliana, Caenorhabditis elegans, Drosophila melanogaster, Homo sapiens, Mus musculus and Saccharomyces cerevisiae, which are the same as in the POBO-server (12). ‘Number of promoters to pick-out’ and ‘Number of samples to generate’ are bootstrapping parameters. ‘Number of promoters to pick-out’ should be equal or less than the size of the smaller input promoter set, whereas ‘Number of samples to generate’ depends on ‘Motif length’ parameter (see Supplementary Material), but basically higher values yield more accurate results.
Outputs of POCO
The output (see Supplementary Figure 2) contains F-score sorted patterns that are assigned into five groups by comparing the results of the HSD-tests. The five groups are groups 1 and 2, patterns over-represented only either in the first (1) or the second (2) input promoter set; group 3, patterns over-represented in both input promoter sets; and groups 4 and 5, patterns over-represented in the first input promoter set and under-represented in the second (4) or vice versa (5). When ‘Min occurrence’ is used, the over-represented patterns must occur at least in this number of promoters. The output contains the following information: the number of promoters with the pattern, total occurrence, input and background bootstrap means and SDs, t-test values, F-score, Q-, Z- and P-values. All reported patterns are linked to the POBO-server (12), which can be used to perform more demanding bootstrap simulations, to disambiguate the wildcards (N) or to map the locations of the patterns in the promoters.
Availability and running the program
POCO is written in the C++ language, a MySQL (http://www.mysql.com/) database is used to store the background promoters and the P-values are calculated using the DCDFLIB-package (http://www.netlib.org/random). In the server, some parameters are limited: number of characters in input sets ≤31 000, Motif length ≤8, Number of promoters to pick-out ≤20 and Number of samples to generate ≤300. Typical run times, when using the maximum parameters, are a few hours. The server, help-pages, backgrounds (MySQL dump-files) and the source code to run POCO locally are available at http://ekhidna.biocenter.helsinki.fi/poco/.
Artificial data tests
For comparison of Z-scores and F-scores and randomized data, see Supplementary Material.
RESULTS
Example data
To demonstrate the functionality of the program and to give an example how to use it, we reanalyze A.thaliana microarray datasets from a transgenic plant constitutively over-expressing WRKY70 (14). In the experiment, it was observed that a set of defense-related genes were either up-regulated (24 genes) or down-regulated (10 genes) compared with the control plant. WRKY is a plant-specific transcription factor superfamily and it is the second largest transcription factor superfamily of the A.thaliana consisting of 74 proteins (15,16). The WRKY factor has been reported to bind onto patterns like TTTGAC(C/T), which are called the W-box (15). Their biological role is to regulate genes involved in developmental processes, responses to various stresses and plant defense via the salicylic acid pathway (14). We retrieved the promoter sequences of the reported genes (from the ATG) and analyzed them using the following parameter settings: Motif length, 8 bp; Promoter length, 1500 bp; Number of promoters to pick-out, 20; Number of samples to generate, 1000; Min occurrence, 1; and Chosen background, A.thaliana.
Discovered patterns from the WRKY70-example
Table 1 shows patterns over-represented in the up-regulated and under-represented in the down-regulated promoter set. An interesting finding is that three out of the five patterns (patterns at rank 1, 2 and 5 and corresponding P-values 3.7 × 10⁻⁷, 3.5 × 10⁻⁶ and 8.8 × 10⁻⁵) contain an ACT/AGT-core (Figure 1a). This nucleotide triplet is reported to be significant for the binding of some C2H2 zinc finger proteins (17,18). Another interesting finding is that the flanking sequences of these patterns resemble the known W-box. Also, a pattern TTGACTNA (at rank 39, F-score 8239.46, P-value 1 × 10⁻³) that is highly similar to the known W-box is in the results of group 4. The data indicate a possible presence of an over-represented W-box in the promoters of the up-regulated genes that is missing in the down-regulated promoter set. Therefore, it is possible that these patterns bind WRKY-factors and presumably the over-expressed WRKY70. The two other patterns at ranks 3 and 4 (P-values 3.2 × 10⁻⁵ and 3.3 × 10⁻⁵) resemble a pattern C(A/T)TCATTC (Figure 1b), which was found to be over-represented within the promoters of the up-regulated genes in a chitin-treated plant (19). Chitin induces defense-related responses in plant and the proposed hypothesis was that the transcription factor that binds onto this pattern could co-operate with WRKY (19).
Table 1.
The five top patterns over-represented in the up-regulated and under-represented in the down-regulated WRKY70 promoter set
| Pattern | Up-regulated | Down-regulated | Background | F-score | P | |||||||
|---|---|---|---|---|---|---|---|---|---|---|---|---|
| Occ | Pro | Avg | SD | Occ | Pro | Avg | SD | Avg | SD | |||
| TTTNNACT/AGTNNAAA | 70 | 23 | 58.22 | 5.46 | 7 | 5 | 14.00 | 3.55 | 40.63 | 6.66 | 17120.47 | 3.7 × 10⁻⁷ |
| GACTNNNA/TNNNAGTC | 110 | 24 | 91.82 | 9.53 | 19 | 9 | 38.09 | 4.78 | 47.78 | 7.33 | 14690.51 | 3.5 × 10⁻⁶ |
| TNANNCNT/ANGNNTNA | 424 | 24 | 353.72 | 24.74 | 105 | 10 | 209.88 | 17.88 | 310.68 | 19.96 | 12294.69 | 3.2 × 10⁻⁵ |
| ATNATTC/GAATNAT | 62 | 22 | 51.48 | 6.94 | 6 | 4 | 12.07 | 3.50 | 31.25 | 5.90 | 12244.94 | 3.3 × 10⁻⁵ |
| TNTNNACT/AGTNNANA | 169 | 24 | 140.62 | 10.91 | 36 | 9 | 71.98 | 8.83 | 106.31 | 10.90 | 11192.62 | 8.8 × 10⁻⁵ |
In the table, occ is the pattern occurrence, pro is the number of promoters with the pattern, and avg and SD are the bootstrap mean and standard deviation.
Figure 1.
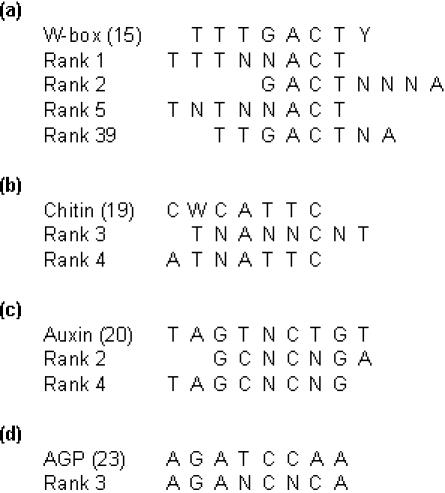
Comparison of known and the discovered patterns (alignments were done by hand). (a) Patterns resembling the W-box (15). (b) Patterns resembling the novel chitin binding element (19). (c) Patterns resembling the auxin-responsive element (20). (d) Patterns resembling the AGP-factor element (23).
Table 2 shows patterns under-represented in the up-regulated and over-represented in the down-regulated promoter set. In the table, patterns at rank 2 and 4 (P-values 7.6 × 10⁻⁵ and 2.1 × 10⁻⁴) resemble a pattern TAGTNCTGT (Figure 1c) that was demonstrated to be the regulatory element of several auxin-responsive genes in soybean (20). Auxin is a plant signaling molecule that is involved in most major growth responses, such as cell extension, division and differentiation (21). It has also been shown that auxin is engaged in plant defense, where it interacts with the jasmonic acid defense pathway (22). The pattern at rank 3 (P-value 1.0 × 10⁻⁴) has similarities with a pattern AGATCCAA (Figure 1d), which was shown to bind novel GATA-type transcription factors (AGPs) (23). The expression of one of them, AGP1, was up-regulated by wounding and this protein has been proposed to be a wounding specific regulator (23). The patterns at ranks 1 and 5 (P-values 2.9 × 10⁻⁵ and 2.5 × 10⁻⁴) did not show strong similarity to previously reported binding elements.
Table 2.
The five top patterns under-represented in the up-regulated and over-represented in the down-regulated WRKY70 promoter set (notation as in Table 1)
| Pattern | Up-regulated | Down-regulated | Background | F-score | P | |||||||
|---|---|---|---|---|---|---|---|---|---|---|---|---|
| Occ | Pro | Avg | SD | Occ | Pro | Avg | SD | Avg | SD | |||
| CANNNCCC/GGGNNNTG | 13 | 9 | 10.82 | 3.61 | 24 | 10 | 48.07 | 5.54 | 21.90 | 5.20 | 15524.94 | 2.9 × 10⁻⁵ |
| GCNCNGA/TCNGNGC | 7 | 7 | 5.84 | 1.99 | 17 | 9 | 33.91 | 4.91 | 13.43 | 4.04 | 14230.12 | 7.6 × 10⁻⁵ |
| AGANCNCA/TGNGNTCT | 7 | 6 | 5.83 | 2.44 | 16 | 8 | 32.00 | 4.51 | 12.43 | 3.73 | 13837.37 | 1.0 × 10⁻⁴ |
| TAGCNCNG/CNGNGCTA | 0 | 0 | 0.00 | 0.00 | 6 | 6 | 11.94 | 2.25 | 3.30 | 1.95 | 12829.72 | 2.1 × 10⁻⁴ |
| GCCNNNC/GNNNGGC | 48 | 21 | 39.86 | 5.80 | 44 | 10 | 87.80 | 5.52 | 49.31 | 9.44 | 12629.53 | 2.5 × 10⁻⁴ |
As a summary, on the one hand the patterns in the promoters of up-regulated genes (Table 1) can be associated with a WRKY-mediated salicylic acid defense pathway. On the other hand, patterns discovered in the promoters of down-regulated genes (Table 2) can be associated with wounding and with another plant defense pathway, the jasmonic acid pathway. Therefore, the results suggest that the genes in the down-regulated gene cluster of the WRKY70-experiment could belong to distinct and competing defense pathways, which are silenced to favor other defense pathways. This hypothesis is also supported by experimental data, which show that the jasmonic acid pathway is indeed activated under different stresses and stimuli than the salicylic acid pathway (9).
DISCUSSION
The program demonstrated in this article can be used to find biologically significant putative regulatory patterns. Our opinion is that the program is well suited for a subset of biological experiments where different promoter sets can be obtained and where competition really takes place. This situation can arise, for example, in comparisons of competitive pathways, such as defense and stress, and in comparisons of oppositely expressed gene sets.
SUPPLEMENTARY MATERIAL
Supplementary Material is available at NAR Online.
Supplementary Material
Acknowledgments
The authors thank Günter Brader for providing the data, Christopher Wilton for fixing the language, and Alvis Brazma and the group members for helpful discussion. This work was supported by a grant from the Ministry of Education to M.K. Funding to pay the Open Access publication charges for this article was provided by Academy of Finland.
Conflict of interest statement. None declared.
REFERENCES
- 1.Meyer P. Chromatin remodeling. Curr. Opin. Plant Biol. 2001;4:457–462. doi: 10.1016/s1369-5266(00)00200-4. [DOI] [PubMed] [Google Scholar]
- 2.Ping Q. Recent advances in computational promoter analysis in understanding the transcriptional regulatory network. Biochem. Biophys. Res. Commu. 2003;309:495–501. doi: 10.1016/j.bbrc.2003.08.052. [DOI] [PubMed] [Google Scholar]
- 3.Bailey T.L., Elkan C. Fitting a mixture model by expectation maximization to discover motifs in biopolymers. Proceedings of the Second International Conference on Intelligent Systems for Molecular Biology; Menlo Park, California: AAAI Press; 1994. pp. 28–36. [PubMed] [Google Scholar]
- 4.Hughes J.D., Estep P.W., Tavazoie S., Church G.M. Computational identification of cis-regulatory elements associated with groups of functionally related genes in Saccharomyces cerevisiae. J. Mol. Biol. 2000;296:1205–1214. doi: 10.1006/jmbi.2000.3519. [DOI] [PubMed] [Google Scholar]
- 5.Thijs G., Lescot M., Marchal K., Rombauts S., De Moor B., Rouzé P., Moreau Y. A higher order background model improves the detection of regulatory elements by Gibbs sampling. Bioinformatics. 2001;17:1113–1122. doi: 10.1093/bioinformatics/17.12.1113. [DOI] [PubMed] [Google Scholar]
- 6.Brazma A., Jonassen I., Vilo J., Ukkonen E. Predicting gene regulatory elements in silico on a genomic scale. Genome Res. 1998;8:1202–1215. doi: 10.1101/gr.8.11.1202. [DOI] [PMC free article] [PubMed] [Google Scholar]
- 7.van Helden J., André B., Collado-Vides J. Extracting regulatory sites from the upstream region of yeast genes by computational analysis of oligonucleotide frequencies. J. Mol. Biol. 1998;281:827–842. doi: 10.1006/jmbi.1998.1947. [DOI] [PubMed] [Google Scholar]
- 8.Sinha S., Tompa M. Discovery of novel transcription factor binding sites by statistical overrepresentation. Nucleic Acids Res. 2002;30:5549–5560. doi: 10.1093/nar/gkf669. [DOI] [PMC free article] [PubMed] [Google Scholar]
- 9.Glazebrook J., Chen W., Estes B., Chang H.-S., Nawrath C., Metraux J.-P., Zhu T., Katagiri F. Topology of the network integrating salicylate and jasmonate signal transduction derived from global expression phenotyping. Plant J. 2003;34:217–228. doi: 10.1046/j.1365-313x.2003.01717.x. [DOI] [PubMed] [Google Scholar]
- 10.Gusfield D. String Algorithms. Cambridge, UK: Cambridge University Press; 1997. [Google Scholar]
- 11.Efron B., Tibshirani R.J. An Introduction to the Bootstrap. New York, NY: Chapman and Hall/CRC; 1993. [Google Scholar]
- 12.Kankainen M., Holm L. POBO, transcription factor binding site verification with bootstrapping. Nucleic Acids Res. 2004;32:W222–W229. doi: 10.1093/nar/gkh463. [DOI] [PMC free article] [PubMed] [Google Scholar]
- 13.Petruccelli J.D., Nandram B., Chen M. Applied Statistics for Engineers and Scientists. Uapper Saddle River, NJ: Prentice-Hall Inc; 1999. [Google Scholar]
- 14.Li J., Brader G., Palva E.T. The WRKY70 transcription factor: a node of convergence for jasmonate-mediated and salicylate-mediated signals in plant defense. Plant Cell. 2004;16:319–331. doi: 10.1105/tpc.016980. [DOI] [PMC free article] [PubMed] [Google Scholar]
- 15.Eulgem T., Rushton P.J., Robatzek S., Somssich I.E. The WRKY superfamily of plant transcription factors. Trends Plant Sci. 2000;5:199–206. doi: 10.1016/s1360-1385(00)01600-9. [DOI] [PubMed] [Google Scholar]
- 16.Ülker B., Sommich I.E. WRKY transcription factors: from DNA binding towards biological function. Curr. Opin. Plant Biol. 2004;7:491–498. doi: 10.1016/j.pbi.2004.07.012. [DOI] [PubMed] [Google Scholar]
- 17.Takatsuji H. Zinc-finger proteins: the classical zinc finger emerges in contemporary plant science. Plant Mol. Biol. 1999;39:1073–1078. doi: 10.1023/a:1006184519697. [DOI] [PubMed] [Google Scholar]
- 18.Sakamoto H., Maruyama K., Sakuma Y., Meshi T., Iwabuchi M., Shinozaki K., Yamaguchi-Schinozaki K. Arabidopsis Cys2/His2-Type zinc-finger proteins function as transcription repressors under drought, cold, and high-salinity stress conditions. Plant Physiol. 2004;136:2734–2746. doi: 10.1104/pp.104.046599. [DOI] [PMC free article] [PubMed] [Google Scholar]
- 19.Ramonell K.M., Zhang B., Ewing R.M., Chen Y., Xu D., Stacey G., Somerville S. Microarray analysis of chitin elicitation in Arabidopsis thaliana. Mol. Plant Pathol. 2002;3:301–311. doi: 10.1046/j.1364-3703.2002.00123.x. [DOI] [PubMed] [Google Scholar]
- 20.Nagao R.T., Goekjian V.H., Hong J.C., Key J.L. Identification of protein-binding DNA sequences in an auxin-regulated gene of soybean. Plant Mol. Biol. 1993;21:1147–1162. doi: 10.1007/BF00023610. [DOI] [PubMed] [Google Scholar]
- 21.Hagen G., Guilfoyle T. Auxin-responsive gene expression: genes, promoters and regulatory factors. Plant Mol. Biol. 2002;49:373–385. [PubMed] [Google Scholar]
- 22.Devoto A., Turner J.G. Regulation of jasmonate-mediated plant responses in arabidopsis. Ann. Bot. 2003;92:329–337. doi: 10.1093/aob/mcg151. [DOI] [PMC free article] [PubMed] [Google Scholar]
- 23.Sugimoto K., Takeda S., Hirochika H. Transcriptional activation mediated by binding of a plant GATA-type zinc finger protein AGP1 to the AG-motif (AGATCCAA) of the wound-inducible Myb gene NtMyb2. Plant J. 2003;36:550–564. doi: 10.1046/j.1365-313x.2003.01899.x. [DOI] [PubMed] [Google Scholar]
Associated Data
This section collects any data citations, data availability statements, or supplementary materials included in this article.