Abstract
The Remote Analysis Computation for gene Expression data (RACE) suite is a collection of bioinformatics web tools designed for the analysis of DNA microarray data. RACE performs probe-level data preprocessing, extensive quality checks, data visualization and data normalization for Affymetrix GeneChips. In addition, it offers differential expression analysis on normalized expression levels from any array platform. RACE estimates the false discovery rates of lists of potentially regulated genes and provides a Gene Ontology-term analysis tool for GeneChip data to support the biological interpretation and annotation of results. The analysis is fully automated but can be customized by flexible parameter settings. To offer a convenient starting point for subsequent analyses, and to provide maximum transparency, the R scripts used to generate the results can be downloaded along with the output files. RACE is freely available for use at http://race.unil.ch.
INTRODUCTION
DNA microarrays are standard tools in biology and medicine. An increasingly long list of applications includes the identification of gene expression changes associated with changes in cell state (1,2), classifying clinical samples based on the underlying pathological characteristics (3,4), drug development (5) and the functional annotation of genes (6). A typical microarray experiment might measure expression levels of tens of thousands of genes, and systematic variations introduced into the datasets (e.g. variations in labeling efficiencies or scanner settings) can often obscure the biological variation that is of real interest. Furthermore, once differentially expressed genes have been identified, inferring function based simply on their expression pattern can be both arduous and ineffective. Hence, bioinformatics tools that facilitate rigorous data analysis and interpretation are of the highest importance. Presented here is Remote Analysis Computation for gene Expression data (RACE), a web server which provides some solutions to these problems.
Microarray data analysis typically begins with data quality checks and data normalization (7). Once normalized expression levels are determined, expression ratios can be calculated and differentially expressed genes identified. At this stage of data analysis, the magnitude and significance of gene expression changes as well as the false discovery rate are important measures. Once a list of differentially expressed genes is identified, the task often turns to describing and interpreting the biological significance of the results. An often useful approach is to compile a list of the Gene Ontology (GO) terms associated with the differentially expressed genes (8). This provides an overview of the biological, physiological and cellular processes potentially involved in the biological phenomena and suggests directions for further studies.
A number of very useful web tools for microarray data analysis exist (e.g. 9–13). RACE contributes to the field by providing access to a wide range of quality checks, probe-level methods and state-of-the-art normalization techniques for Affymetrix raw data. To the best of our knowledge, these are not provided by any other publicly available server. Additionally, RACE provides tools to identify lists of differentially expressed genes and to determine and investigate the associated GO-term composition of those genes. To facilitate subsequent analyses and guarantee maximal transparency and reproducibility, the R script used to generate the results is provided.
SYSTEM AND MODULE DESIGN
RACE is divided into two components: the user interface and the analysis part. RACE uses basic authentication provided by Apache. HTTP communication is exclusively via port 80, making the system easily accessible through a firewall. Submitted jobs are queued and a customized analysis script is generated by a set of Perl scripts. The analysis script is executed in a subprocess.
All statistical analysis is performed using the free high-level interpreted statistical language R (R Core, 2004, http://www.R-project.org) and various Bioconductor packages (http://www.Bioconductor.org). The design of the software is modular to facilitate the addition of further analysis tools.
User accounts
RACE can be used with an anonymous guest account but personal password-protected access is recommended. Registered users can store data in a personal account on the server, making it possible to run multiple tasks without the need to re-upload input files. Moreover, waiting times are avoided as the user is automatically emailed at the completion of a job. RACE creates for each job a directory for storing the input files, the selected parameters, the utilized R script and the results.
File handling
The upload files module allows users to upload and store files, decompress ZIP files and organize the data in different subdirectories. After setting the parameters in the analysis tools, the user is given the option of providing the input data either by a new upload or by copying or splitting previously uploaded or generated data.
The download files module allows users to access their password-protected directories, to browse their data and to download or delete files. Every file is deleted automatically by the system 1 week after its creation.
RACE ANALYSIS TOOLS
RACE currently offers three analysis tools accessible via the web interface, namely Data Quality Checks & Normalization, Statistical Tests and GO-term Analysis. Each tool is structured into three sections. The first section contains links to three help pages describing the purpose and implemented methods, the required input data format and the output files generated. Parameters which are required for the analysis are set in the second section. Parameters which can be optionally changed to customize the output files generated are set in the third section. At the bottom of the second section the user can provide the data to be analyzed.
After the submission of an analysis request, a confirmation message, including a link to the output page, is displayed. When the job is completed, authenticated users will receive the link to the output page by email. The output page contains the user data, the customized R script used for the analysis, all result files, ZIP archives and a log file which tracks job start and completion as well as problems that may have occurred during the run.
Data Quality Checks & Normalization tool
Purpose and required data input format
The Data Quality Checks & Normalization tool is dedicated to the visualization, quality checking and normalization of Affymetrix GeneChip data. Data should be provided as Affymetrix CEL files in ASCII format, optionally zipped.
Description
The Data Quality Checks & Normalization tool uses primarily methods implemented in the Bioconductor packages ‘affy’ (14) and ‘affyPLM’. To quality check the perfect match (PM), probe levels are summarized in spatial and density plots. Individual probes in each probe set are numbered starting from the 5′ end of the transcript, and the mean 5′ to 3′ probe intensity bias for each array is determined. The probe-level intensities for probe sets are summarized to define a measure of the individual gene expression. To make data from different arrays comparable, RACE provides several normalization methods. The first of these is MAS 5.0, the current Affymetrix default algorithm. However, several studies (15,16) suggest that measures based only on the PM probes outperform the MAS 5.0 algorithm. For this reason RACE also provides access to two of the most prominent PM-based algorithms: RMA (Robust Multichip Average; 17) and gcRMA (see the Bioconductor website: http://www.Bioconductor.org). RMA includes quantile normalization and a robust multi-array probe-level fit, and gcRMA additionally exploits sequence information for the background adjustment. Based on the normalized expression values the Pearson correlation and the standard deviation of gene-wise expression differences between two arrays are calculated to evaluate similarities of the gene expression profile for each pair of samples. Moreover, a hierarchical sample cluster is built using Ward's minimum variance method.
Output
The principle output of this tool is a file containing normalized gene expression levels. In addition, multiple data visualizations are provided to assist in judging the quality of the data and the success of the normalization.
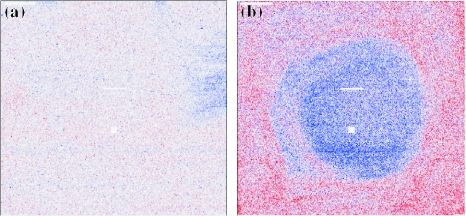
Figure 1 shows two examples of the output type ‘PLM pseudo images’ (see Table 1) displaying the spatial distribution of the residuals obtained from a probe-level fit over multiple arrays. High-quality data have characteristics similar to Figure 1a, which shows only a few small defects. In general, small defects do not seriously bias the expression levels, since probes representing one gene are distributed across the array and robust summary methods are used. However, extensive regions with large residuals—the dark regions seen in Figure 1b—are a clear indication of an experimental artifact (e.g in array production, hybridization or processing) and the array should be considered for exclusion from the analysis.
Figure 1.
‘PLM pseudo image’ tool output. The spatial distribution of residuals obtained from probe-level fitting over multiple arrays is shown. (a) High-quality data showing almost no defects; (b) low-quality data showing large artifacts.
Table 1.
Graphical outputs and their functions for the RACE Quality Checks & Normalization tool
| Output | Function |
|---|---|
| CEL intensity images | Detect spatial intensity artifacts |
| Boxplots of raw PM probe intensities | Display PM probe intensity distribution for selected array; compare overall brightness of selected array |
| Density distribution of the raw PM probe intensities | Check the intensity density for selected arrays; compare the densities of selected arrays |
| Boxplots of the normalized PM intensities | Assess the success of the normalization |
| 5′ to 3′ feature intensity plot (‘RNA digestion plot’) | Detect a bias in probe intensities; identify outlier arrays with deviating biases |
| PLM pseudo images | Assess spatial distribution of weights derived during robust linear model probe-level fit; detect obscure/dark array regions with low weights; assess the spatial distribution of residuals; detect obscure/dark array regions with high positive or negative residuals |
| NUSE boxplots | Identify arrays where the standard errors for gene expression estimates from PLM fit are overall larger relative to other arrays |
| RLE boxplots | Identify arrays where relative log expression compared with a median array are larger than other arrays |
| Pair-wise scatter plots | Assess similarities and differences in expression values measured on two arrays; identify outliers arrays |
| Correlation matrix plot | Detect homogeneous groups of arrays; identify outlier arrays |
| Sample cluster | Find subgroups of similar samples |
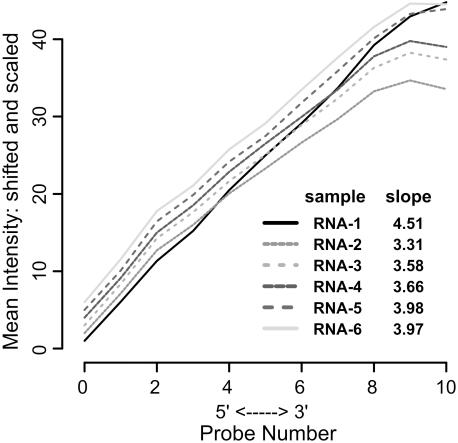
An example of the output type ‘Bias 5′ to 3′end plot’ is shown in Figure 2. Here, each line corresponds to an individual array. The graph is generated by calculating and plotting the array-wide mean intensities of ordered PM probe sets, where position 0 corresponds to the most 5′ probe and position 10 the most 3′ probe (the data are from an Affymetrix HGU133A array, whose probe sets each contain 11 PM probes). The slope and shape of each line is characteristic of each target sample and is dependent on the RNA sample source and the array type. When comparing expression data from a group of hybridizations, a sample whose slope and shape deviate significantly from the rest will often have anomalous ‘outlier’ results.
Figure 2.
‘Bias 5′ to 3′ end plot’ tool output. Each line represents the overall 5′ to 3′ intensity bias of a different chip.
Owing to space limitations, the content and purpose of all other output graphs can be only briefly summarized in Table 1.
Statistical Tests tool
Purpose and required data input format
The Statistical Tests tool identifies genes which are differently expressed between two groups. The input files for this tool are two expression matrices provided as tab-delimited ASCII files. The first column of both files must contain unique gene identifiers and all other columns contain normalized expression values of the samples corresponding to the different groups. The input files can be generated on the server by splitting the output file ‘NormExprLevels.txt’ from the first tool into two groups.
Description
The design of gene expression experiments can be represented in terms of a linear model (18). At the moment RACE supports designs where two groups are compared to identify genes changing expression across the groups. RACE uses the Bioconductor package ‘limma’ (http://bioinf.wehi.edu.au/limma/usersguide.pdf), which makes use of an empirical Bayesian approach, to fit the linear model. This approach outperforms a conventional t-test under conditions typical for microarray experiments (18–20). Owing to the large number of genes analyzed in a typical microarray experiment, an assessment of the effect of multiple testing is necessary. Therefore, we estimate from the distribution of raw p-values the fraction of the non-changing genes among all tested genes, as well as the false discovery rate (FDR) for each p-value threshold using the Bioconductor package ‘qvalue’ (21,22).
Output
The principle output are lists of potentially differentially expressed genes chosen according to user-specified fold-change and p-value thresholds. A separate overview list containing all genes, complemented by statistical measures and additional gene annotations (e.g. GeneSymbol and LocusID), is also provided. RACE determines for each gene the fold-change, the logarithm of the fold-change (M), the mean expression level (A), the uncorrected p-value, the estimated FDR, the regularized t-value, the log odds ratio (B) and the standard deviations of the expression levels in each group. RACE provides multiple ways of visualizing these values. See Table 2 for an overview of the output graphs.
Table 2.
Graphical outputs and their functions for the RACE Statistical Tests tool
| Output | Function |
|---|---|
| Correlation matrix plot | Check whether intra-group correlations are higher than correlations between groups; identify outlier samples |
| Sample cluster | Check whether uploaded groups yield separated clusters; identify sample subgroups |
| StdDev plots | Compare distributions of expression standard deviations in the different groups; assess variability in different groups |
| p-Value histogram | Obtain a visual impression of the amount of differentially expressed genes by the height of a potential peak at small p-values |
| Volcano plots | Check for genes with high significance and large expression changes across groups |
| FDR versus p-value plot | Find the appropriate p-value threshold to limit the estimated FDR of the resulting gene list below a fixed value |
| MvA plot | Visualize mean expression and log changes of all genes; label genes which were selected according to user's defined p-value and fold-change cutoffs |
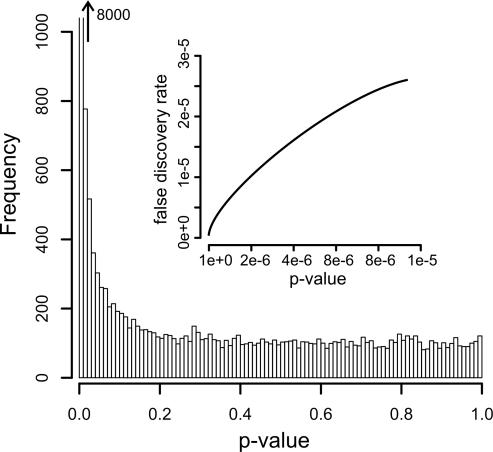
Figure 3 shows an example of the output type ‘p-Value histogram’ with an inset displaying the dependency between the FDR and the p-value. The p-value distribution is expected to be uniform if there are no differentially expressed genes. As the number of differentially expressed genes increases, the p-value distribution will show a more and more pronounced peak at small values. Figure 3 shows the output from a comparison of human testis and placenta RNA. A sharp, very high peak at small p-values is seen, indicating many highly significant expression differences between these two RNAs. By specifying a p-value and fold-change threshold, the user defines a candidate list of regulated genes. The inset shows the estimated FDR as a function of the p-value threshold.
Figure 3.
‘p-Value histogram’ output. The number of genes (‘Frequency’) which fall into each p-value bin is presented. In the insert, the False Discovery Rate versus the p-value threshold is plotted.
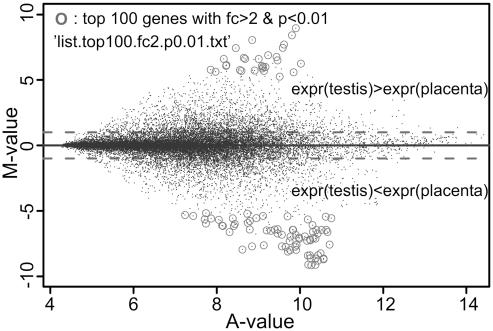
Figure 4 shows the output type ‘MvA plot’ for the experiment in which human placenta and testis RNA were compared. Each point represents one gene. M is the log (base 2) of the fold-change in expression between testis and placenta, and A is the log average of the expression level. Very large expression differences over a wide range of expression intensities are seen. Genes which meet user-defined p-value and fold-change criteria are labeled in the output graph. Additionally, the selection criteria and the file name of the list which contains the labeled genes accompanied by annotations and statistical measures are presented in the output graph. In this example, the 100 most significant genes with fold-changes >2 (p < 0.01) have been selected.
Figure 4.
‘MvA plots’ output. The expression ratio (log base 2) of genes is plotted against their average expression intensity. Circles identify genes that pass user-defined p-value and fold-change value thresholds.
GO-term Analysis tool
Purpose and required data input format
The aim of the GO-term Analysis tool is to assist in the biological interpretation of gene lists by identifying functional annotations (GO terms) which are enriched among the user-provided input genes. Users can choose among the different ontology categories and GO-term levels and can select threshold combinations for list coverage (minimum number of genes corresponding to each GO term) and statistical significance (p-value) for the overrepresentation of each GO term. GO terms which meet these criteria are reported together with the corresponding genes. A tab-delimited file containing Affymetrix identifiers in one column is required as input. Optionally, another column may contain log ratios, which can then be used to analyze the GO terms according to the under- or overexpression of the genes being analyzed. Gene lists generated by the Statistical Tests tool can be used directly as input files.
Description
GO (23) provides three structured, controlled vocabularies (ontologies) that describe gene products species-independently in terms of their associated biological processes, cellular components and molecular functions. GO terms are organized in directed acyclic graphs, representing networks where each term may be a ‘child’ (more specialized term) of one or more ‘parents’ (less specialized terms). The networks define the ‘is a’ or ‘part of’ relationships between terms and allow the grouping of all GO terms into different levels. As the GO term level increases, the informational specificity increases and the genome coverage decreases (24; also see http://www.geneontology.org/ for a more detailed description).
RACE uses the Bioconductor meta-data packages for the mappings of Affymetrix identifiers to LocusLink identifiers and of LocusLink identifiers to GO terms. GO-term levels are derived from the ‘gene_ontology.obo’ text file provided by the Gene Ontology Consortium. Based on the GO-term composition of all genes on the array used, a p-value is determined using a hypergeometric distribution for the overrepresentation of each GO term among the specified gene list. The ‘Gostats' Bioconductor package was used to implement this method. For more information, see http://Bioconductor.org/Docs/Papers/2003/Compendium/GOstats.pdf.
Output
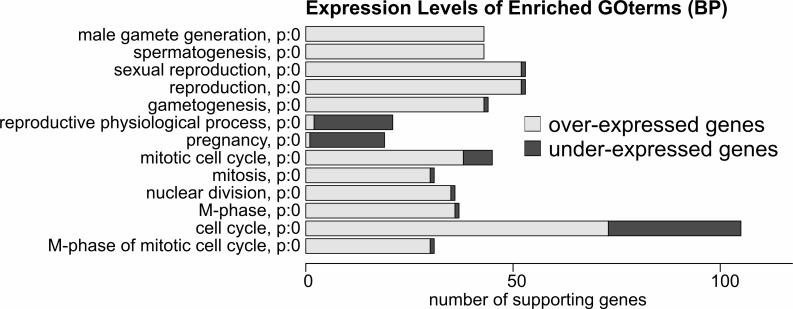
According to the user-specified parameters (GO-term type, GO-term specificity level, minimum number of genes annotated with a certain GO term, p-value threshold), a list of enriched GO terms is generated for the genes provided. For each enriched GO term, the numbers of supporting genes from the list as well as from the entire chip are reported and visualized. The counts of annotated and unannotated genes are reported as well. If the gene list corresponds to differentially expressed genes which are supplied with log ratios, the numbers of over- and underexpressed genes among the regulated genes are presented. To generate a ranking based on statistical significance, a p-value is calculated for the overrepresentation of GO-terms based on the hypergeometric distribution. The results are summarized in bar graphs and tables
Figure 5 shows such a GO-term bar chart for the experiment comparing human placenta and testis gene expression patterns. Different colors are assigned to up- and downregulated genes. The number of GO terms in the ‘biological function’ category significantly enriched in the group of differentially expressed genes is presented. Not surprisingly considering the source of the RNAs, the biological function GO terms ‘spermatogenesis’ (overexpressed in testis) and ‘pregnancy’ (underexpressed in testis) dominate the list.
Figure 5.
‘GO-term chart’ output. Biological function GO terms calculated to be statistically overrepresented in a user-specified gene list are reported along with the number of genes from the list associated with each term.
SUMMARY
RACE offers an easy to use collection of bioinformatics web tools to analyze DNA microarray data, without requiring any installation or maintenance on the user side. By using various R subroutines and Bioconductor packages, RACE provides users with access to powerful statistical analysis tools without the need for specific expertise in their use. It offers different users or laboratories the possibility of performing data QC, normalization and analysis in a standardized way, which is likely to lead to more consistent and reproducible results.
Acknowledgments
We thank all the people providing and maintaining the excellent open source software on which RACE is based, i.e. Linux, Apache, Perl and R, together with CRAN and Bioconductor. We also thank Olivier Schaad for beta-testing RACE and providing numerous suggestions, Robeto Fabbretti from the Vital-IT Group of the Swiss Institute of Bioinformatics for hosting the RACE server, Otto Hagenbüchle and Johann Weber for comments on the manuscript, and Thierry Sengstag and the members of the DAFL for support. The DNA Array Facility is supported by the Etat de Vaud. Funding to pay the Open Access publication charges for this article was provided by the Etat de Vaud.
Conflict of interest statement. None declared.
REFERENCES
- 1.Chi J.-T., Chang H.Y., Haraldsen G., Jahnsen F.L., Troyanskaya O.G., Chang D.S., Wang Z., Rockson S.G., van de Rijn M., Botstein D., Brown P.O. Endothelial cell diversity revealed by global expression profiling. Proc. Natl Acad. Sci. USA. 2003;100:10623–10628. doi: 10.1073/pnas.1434429100. [DOI] [PMC free article] [PubMed] [Google Scholar]
- 2.Magee J.A., Abdulkadir S.A., Milbrandt J. Haploinsufficiency at the Nkx3.1 locus: a paradigm for stochastic, dosage-sensitive gene regulation during tumor initiation. Cancer Cell. 2003;3:273–283. doi: 10.1016/s1535-6108(03)00047-3. [DOI] [PubMed] [Google Scholar]
- 3.Roepman P., Wessels L.F., Kettelarij N., Kemmeren P., Miles A.J., Lijnzaad P., Tilanus M.G., Koole R., Hordijk G.J., van der Vliet P.C., et al. An expression profile for diagnosis of lymph node metastases from primary head and neck squamous cell carcinomas. Nature Genet. 2005;37:182–186. doi: 10.1038/ng1502. [DOI] [PubMed] [Google Scholar]
- 4.Chung C.H., Bernard P.S., Perou C.M. Molecular portraits and the family tree of cancer. Nature Genet. 2002;32:533–540. doi: 10.1038/ng1038. [DOI] [PubMed] [Google Scholar]
- 5.Gerhold D.L., Jensen R.V., Gullans S.R. Better therapeutics through microarrays. Nature Genet. 2002;32(Suppl.):547–551. doi: 10.1038/ng1042. [DOI] [PubMed] [Google Scholar]
- 6.Zhang W., Morris Q.D., Chang R., Shai O., Bakowski M.A., Mitsakakis N., Mohammad N., Robinson M.D., Zirngibl R., Somogyi E., et al. The functional landscape of mouse gene expression. J. Biol. 2004;3:21. doi: 10.1186/jbiol16. [DOI] [PMC free article] [PubMed] [Google Scholar]
- 7.Yang Y.H., Dudoit S., Luu P., Lin D.M., Peng V., Ngai J., Speed T.P. Normalization for cDNA normalization data: a robust composite method addressing single and multiple slide systematic variation. Nucleic Acids Res. 2002;30:e15. doi: 10.1093/nar/30.4.e15. [DOI] [PMC free article] [PubMed] [Google Scholar]
- 8.Desagher S., Severac D., Lipkin A., Bernis C., Ritchie W., Le Digarcher A., Journot L. Genes regulated in neurons undergoing transcription-dependent apoptosis belong to signaling pathways rather than the apoptotic machinery. J. Biol. Chem. 2004;280:5693–5702. doi: 10.1074/jbc.M408971200. [DOI] [PubMed] [Google Scholar]
- 9.Colantuoni C., Henry G., Zeger S., Pevsner J. SNOMAD (Standardization and NOrmalization of MicroArray Data): web accessible gene expression data analysis. Bioinformatics. 2002;18:1540–1541. doi: 10.1093/bioinformatics/18.11.1540. [DOI] [PubMed] [Google Scholar]
- 10.Herrero J., Al-Shahrour F., Díaz-Uriarte R., Mateos A., Vaquerizas J.M., Santoyo J., Dopazo J. GEPAS: a web-based resource for microarray gene expression data analysis. Nucleic Acids Res. 2003;31:3461–3467. doi: 10.1093/nar/gkg591. [DOI] [PMC free article] [PubMed] [Google Scholar]
- 11.Kapushesky M., Kemmeren P., Culhane A.C., Durinck S., Ihmels J., Korner C., Kull M., Torrente A., Sarkans U., Vilo J., Brazma A. Expression Profiler: next generation—an online platform for analysis of microarray data. Nucleic Acids Res. 2004;32:W465–W470. doi: 10.1093/nar/gkh470. [DOI] [PMC free article] [PubMed] [Google Scholar]
- 12.Luscombe N.M., Royce T.E., Bertone P., Echols N., Horak C.E., Chang J.T., Snyder M., Gerstein M. ExpressYourself: A modular platform for processing and visualizing microarray data. Nucleic Acids Res. 2003;31:3477–3482. doi: 10.1093/nar/gkg628. [DOI] [PMC free article] [PubMed] [Google Scholar]
- 13.Knudsen S., Workman C., Sicheritz-Poten T., Friis C. GenePublisher: automated analysis of DNA microarray data. Nucleic Acids Res. 2003;31:3471–3476. doi: 10.1093/nar/gkg629. [DOI] [PMC free article] [PubMed] [Google Scholar]
- 14.Gautier L., Cope L., Bolstad B.M., Iriyarry R.A. affy—analysis of affymetrix genechip data at the probe level. Bioinformatics. 2004;20:307–315. doi: 10.1093/bioinformatics/btg405. [DOI] [PubMed] [Google Scholar]
- 15.Bolstad B.M., Irizarry R.A., Astrand M., Speed T.P. A comparison of normalization methods for high density oligonucleotide array data based on variance and bias. Bioinformatics. 2003;19:185–193. doi: 10.1093/bioinformatics/19.2.185. [DOI] [PubMed] [Google Scholar]
- 16.Naef F., Socci N.D., Magnasco M. A study of accuracy and precision in oligonucleotide arrays: extracting more signal at large concentrations. Bioinformatics. 2003;19:178–184. doi: 10.1093/bioinformatics/19.2.178. [DOI] [PubMed] [Google Scholar]
- 17.Irizarry R.A., Bolstad B.M., Collin F., Cope L.M., Hobbs B., Speed T.P. Summaries of Affymetrix GeneChip probe level data. Nucleic Acids Res. 2003;31:e15. doi: 10.1093/nar/gng015. [DOI] [PMC free article] [PubMed] [Google Scholar]
- 18.Smyth G.K. Linear Models and Empirical Bayes Methods for assessing differential expression in microarray experiments. Stat. Appl. Genet. Mol. Biol. 2004;3 doi: 10.2202/1544-6115.1027. Article 3. [DOI] [PubMed] [Google Scholar]
- 19.Hatfield G.W., Hung S., Baldi P. Differential analysis of DNA microarray gene expression data. Mol. Microbiol. 2003;47:871–877. doi: 10.1046/j.1365-2958.2003.03298.x. [DOI] [PubMed] [Google Scholar]
- 20.Baldi P., Long A.D. A Bayesian framework for the analysis of microarray expression data: regularized t-test and statistical inferences of gene changes. Bioinformatics. 2001;17:509–519. doi: 10.1093/bioinformatics/17.6.509. [DOI] [PubMed] [Google Scholar]
- 21.Storey J.D., Tibshirani R. Statistical significance for genome-wide experiments. Proc. Natl Acad. Sci. USA. 2003;100:9440–9445. doi: 10.1073/pnas.1530509100. [DOI] [PMC free article] [PubMed] [Google Scholar]
- 22.Benjamini Y., Hochberg Y. Controlling the false discovery rate: a practical and powerful approach to multiple testing. J. R. Stat. Soc. B. 1995;57:289–300. [Google Scholar]
- 23.Harris M.A., Clark J., Ireland A., Lomax J., Ashburner M., Foulger R., Eilbeck K., Lewis S., Marshall B., Mungall C., et al. The Gene Ontology (GO) database and informatics resource. Nucleic Acids Res. 2004;32:D258–D261. doi: 10.1093/nar/gkh036. [DOI] [PMC free article] [PubMed] [Google Scholar]
- 24.Dennis G., Sherman B.T., Hosack D.A., Yang J., Gao W., Lane H.C., Lempicki R.A. DAVID: database for annotation, visualization, and integrated discovery. Genome Biol. 2003;4:P3. [PubMed] [Google Scholar]


