

Abstract
Photodynamic therapy (PDT) is a minimally invasive therapeutic approach that has shown promising results in recent years, particularly in the dermatological clinical treatment of several pathologies, including neoplastic skin diseases. In light of the recent discovery of the photosensitizing properties of a water-soluble group of amino-based flavylium dyes, research efforts have led to the development of a novel synthetic dye with two diethylamino moieties in its structure, 7,4’-di(diethylamino)flavylium (7,4′diN(Et)2). This dye was tested as a potential photosensitizer for PDT of skin cancer. A single light dose of 22.5 J/cm2 efficiently killed SCC-25 (squamous cell carcinoma) and A375 (melanoma) cells, reducing cellular viability by more than 80% in the presence of the flavylium at 0.75 µM. Meanwhile, the negligible cellular toxicity of the dye in the absence of light stimulus points out a wide and safe therapeutic window. Interestingly, significant light-induced toxicity effects were still observed after washing out the compound before cell irradiation. Moreover, out of the three prototype flavylium-loaded hydrogels, each one based on a different polymer (Carbomer, Caesalpinia Spinosa Gum and Hydroxypropyl methyl cellulose), carbomer-based formulation stood out for its substantial absorbance and fluorescence increment and enhanced1O2 photogeneration activity compared to the flavylium in aqueous solution. The findings of this study provide valuable insights concerning the potential of this flavylium dye as a candidate for photodynamic therapy of skin cancer and strongly support the need for further testing in more advanced biological settings to fully assess its efficacy and safety.
Supplementary Information
The online version contains supplementary material available at 10.1038/s41598-024-80860-x.
Subject terms: Medicinal chemistry, Photochemistry, Photobiology
Introduction
The use of light in combination with chemical agents as a treatment modality can be traced back to ancient civilizations but it was not until the early 20th century that this therapy gained reinvigorated interest1. Since then, PDT has been progressively developing into a mature technology with well-established key principles. Those consist of the combination of three individually innocuous components that become lethal to the target tumor cells when combined: a photosensitizer (PS) that is delivered and accumulates within the target biological tissue, molecular oxygen, and an external light source with an appropriate emission bandwidth that coincides with the absorption band of the PS. The photoactivation of the PS causes an exacerbated generation of reactive oxygen species (ROS), which although essential at physiological levels, result in severe and irreversible cellular damage when present at unusually high levels, leading to cell death through apoptosis, necrosis, or autophagy2.
The dermatological clinical application of PDT has shown remarkable results in treating several skin disorders, from acne and psoriasis to pre- and cancerous lesions such as actinic keratoses and squamous cell carcinoma, respectively3. In the context of skin cancer, PDT has gradually emerged as an alternative treatment, used alone or in combination with more conventional treatment modalities, such as chemotherapy, radiotherapy, gene therapy, surgery, and immunotherapy4. The advantages of the topical route of PS administration include easy access to the lesioned area, minimal damage of surrounding normal tissues due to selective PS accumulation in the tumor, the possibility of recurrent treatment sessions with negligible drug resistance, low systemic effects, and improved patients’ compliance owing to its minimally invasive nature. Also, given the limitation in light penetration and delivering the energy required for PS activation to deeper tissues, the skin surface is an organ of excellence concerning phototherapeutics.
Owing to the pivotal role of PSs in determining the PDT effectiveness, continuous iterative development has been carried out on this matter but the complex number of criteria that must be attained for an ideal PS, which makes the process of development and regulatory approval a particularly challenging one2. Over the past few years, clinical cancer research has been mostly focused on optimizing the PSs already in the market (improving physicochemical properties, exploring the combination with conventional treatments, or refining current protocol conditions), which are known to have some inherent limitations5. Most of the PSs approved for cancer treatment are derived from a tetrapyrrole molecular core structure but most of them exhibit high hydrophobicity, with poor solubility and a strong tendency to aggregate in aqueous solutions, limiting their photoactivity and consequent clinical use6. Appreciable improvements in PDT performance have been achieved with the development of derivatives of such PSs, including TMPyP, chlorins and phthalocyanines. Nevertheless, the discovery and exploitation of new molecules either of natural or synthetic origin is highly desirable to enrich the therapeutic repertoire and provide a wider and more versatile range of options in future research.
Following the encouraging recent findings about the appreciable photosensitizing properties of a family of amino-based flavylium dyes7,8 and based on the correlation observed between the photoactivity effectiveness and the presence of amine groups in rings A and B, a new flavylium chromophore exhibiting a diethylamine group at C4’ and C7 (7,4’-di(diethylamino)flavylium)) was synthesized and proposed as photosensitizer for photodynamic therapy of skin cancer (Fig. 1). Physicochemical properties and the cyto- and phototoxicity of the flavylium dye were studied against human keratinocytes (HaCat), squamous cell carcinoma (SCC-25) and melanoma (A375) skin cells.
Fig. 1.
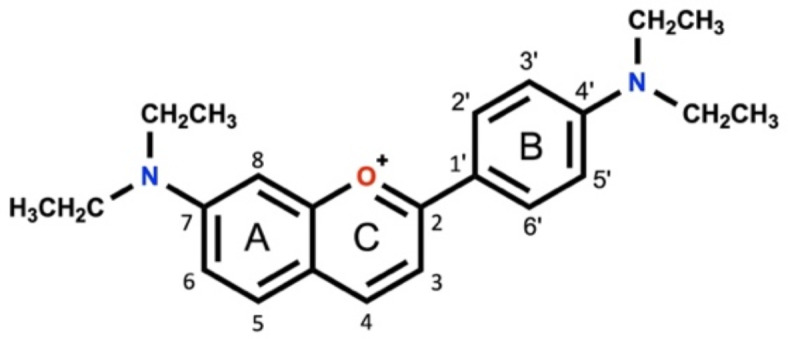
Molecular structure of 7,4’-di(diethylamino)flavylium (7,4′-diN(Et)2).
Considering the intricate and dynamic network of reversible chemical reactions flavylium compounds can undergo (flavylium multistate), this work also intended to study the physical and chemical properties, as well the stability of the flavylium dye when incorporated in formulations for photoactivable systems9. Hydrogels are highly valued in the field of PDT and dermatology due to their ability to moisturize and adhere well to the skin, exhibiting a good retention at the treatment site and transparency, which allows efficient light penetration. Furthermore, they serve as a versatile delivery vehicle, with adjustable mechanical properties and drug release profiles, and can also be loaded with multiple therapeutic agents, enabling the combination of PDT with another treatments10–12. Therefore, three prototype flavylium-loaded hydrogels based on three different polymers (Carbomer, Caesalpinia Spinosa Gum and Hypromellose) were developed and compared in terms of color, absorbance, fluorescence and singlet oxygen production.
Results and discussion
Synthesis and characterization of 7,4′-diN(Et)2
Throughout recent years of research, flavylium dyes carrying different patterns of substitution with amine groups in the 2-phenyl-1-benzopyrylium core structure have been studied to understand their photosensitizing properties. The introduction of amino groups in specific positions of these molecules confers them a higher chemical stability, as the electronic delocalization stabilizes the positive charge of the pyrylium ring. Furthermore, the presence of stronger electron-donating groups such as dimethyl- or diethylamino in this type of structures, has been demonstrated to promote a bathochromic shift on the maximum absorption wavelength, higher molar absorption coefficients, fluorescence emission and1O2 production, properties that make these molecules particular interesting for PDT7,13. With this in mind, to further improve the physicochemical properties of these flavylium dyes, a novel dye carrying two diethylamine groups, 7,4’-di(diethylamino)flavylium, was synthesized from “Robinson´s method”14,15 that is one of the most widely used methods for the synthesis of flavylium dyes. This method is mainly based on an acidic aldolic condensation reaction of salicylaldehydes and acetophenone derivatives, which in our study were the 4-(diethylamino)salicylaldehyde and 4-diethylaminoacetophenone, yielding a blue-colored flavylium dye (Fig. 2). The compound was then purified and analyzed by HPLC-DAD the chromatogram of purified 7,4′-diN(Et)2 shown in Figure S1. The full characterization was performed by1H and13C NMR spectroscopy and ESI-MS.
Fig. 2.

Synthetic pathway of 7,4’-di(diethylamino)flavylium. RT – Room temperature; TMSCl – Trimethylsilyl chloride.
Spectroscopic and photophysical properties
Developing photosensitizers that absorb at long wavelengths (600–800 nm) with a high extinction coefficient, is one of the main goals for the overall effectiveness of PDT. This region, commonly known as “phototherapeutic window”, allows a greater light penetration depth to activate the photosensitizer (which is particularly relevant in cases of more deeply located tumors) and avoids the strong absorption at lower wavelengths by endogenous chromophores in skin tissues, which otherwise could decrease the photodynamic process by competing with PS in the absorption process16. On the other hand, a high molar extinction coefficient (ε) is also a key parameter with close relationship with PDT effectiveness, since low ε values require higher PSs administration doses and/or light fluences. Therefore, photosensitizers combining a strong absorption in the red-region of the visible spectrum and a pronounced ε are highly desirable.
Considering this, the spectroscopic and photophysical properties of 7,4′-diN(Et)2 were determined in distinct solvents, and the results are presented in Table 1.
Table 1.
Summary of the main spectroscopic and photophysical properties for 7,4′-diN(et)2, in different solvents.
| Compound | Solvent | λabs(nm) | λem(nm) | Stokes shift (nm) |
ε (M− 1.cm− 1) |
Φf(%) |
|---|---|---|---|---|---|---|
| 7,4′-diN(Et)2 | DMSO | 608 | 654 | 46 | 3.9 × 10⁴ | 10.6 |
| EtOH | 605 | 640 | 35 | 5.8 × 10⁴ | 10.1 | |
| MeOH | 602 | 637 | 35 | 5.0 × 10⁴ | 4.5 |
The new flavylium shows strong absorption in the range of 600–608 nm, for the three different solvents, fitting within the desired absorption range. Regarding the molar extinction coefficient of 7,4′-diN(Et)2, the values obtained in different solvents support its absorption efficiency, ranging from 3.9 × 10⁴ to 5.8 × 10⁴ M− 1 cm− 1, comparable to several porphyrin and non-porphyrin photosensitizers reported in the literature17. Compared to similar flavylium dyes previously reported in literature (7NEt24′OH, 7NEt24′NH2 and 7NEt24′NMe2)8, the inclusion of the diethylamine moiety at C4′ of 7,4′diN(Et)2, led to a slight bathochromic shift in the λmáx and improvement of the molar absorption coefficient, as a result of the more powerful electron-donating capacity of N(CH2CH3)2 group.
7,4′diN(Et)2 also showed strong fluorescence emission capacity, exhibiting maximum signal intensity between 637 and 654 nm (Fig. 3). In every solvent tested, the flavylium fluorescence recorded was in the order of 106 cps, showing the highest intensity in ethanol (6.6 × 10⁶ cps). In the perspective of tumor identification and treatment, fluorescence properties of photosensitizers like 7,4’diN(Et)2 are highly advantageous as they can be used for cell-imaging, helping in delineating tumor boundaries, monitoring of photosensitizer accumulation, assessment of treatment response and improving visibility for surgical removal18,19.
Fig. 3.

Fluorescence emission spectra of 7,4′diN(Et)2, in three different solvents (DMSO, EtOH and MeOH). The absorption of 7,4′diN(Et)2 solutions was adjusted to 0.018. The excitation wavelengths were set according with the maximum absorption wavelengths for each solvent.
As in previous studies conducted with photoactivatable flavylium dyes, a LED panel emitting in the full visible range (white light) was used as the light source, and the emission spectrum of this light together with the absorption spectrum of 7,4′-diN(Et)2 in the different solvents are represented in Fig. 4. Although it should be taken into account that other light sources could have been used, namely monochromatic lasers with narrower emission bandwidths matching the absorption peak of photosensitizers, this approach was chosen for the sake of coherence and practicability, so that it would be possible to maintain the irradiation protocol parameters and compare the efficiency of the new flavylium dye with the previous results8.
Fig. 4.

Absorption spectra of 7,4′-diN(Et)2 at 20 μm in DMSO, EtOH and MeOH and light emission of the LED source used in the PDT experiments. Molar extinction coefficient values are expressed in M− 1 cm− 1.
Cellular cytotoxicity and phototoxicity
Before evaluating the photosensitizing properties of 7,4′diN(Et)2 dye against skin cells, the toxicity profile in the absence of light stimulus was evaluated over 24 h of incubation of the different cell lines in the presence of the flavylium dye. As can be observed in Fig. 5, 7,4′diN(Et)2 exerted negligible dark toxicity towards HaCat, SCC-25, and A375. Only when higher concentrations are reached, does cell survival start to be affected, particularly in the case of HaCat and A375 cells, whose cell viability drops below 70% at 24 µM. SCC-25 on the other hand, was the least affected, retaining above 90% cell survival.
Fig. 5.

Cytotoxicity effects after 24 h incubation of increasing concentrations of 7,4′diN(Et)2 dye with HaCat, SCC-25, and A375 cells. Results are expressed as the mean ± standard error of the mean (SEM). Two-way analysis of variance (two-way ANOVA) was used to determine statistically significant differences between the means of the three cell lines using Sidak’s multiple comparisons tests (**** p value < 0.0001, *** p value < 0.001, ** p value < 0.01, * p value < 0.05).
In the presence of light, the magnitude of cell death induced by the photoactivation of 7,4′diN(Et)2 dye was remarkable (Fig. 6). Treatment at 1.5 µM caused a massive reduction of 90% in cell survival in the three cell lines. Although at higher concentrations, 7,4′diN(Et)2 was revealed to be equally phototoxic, in more intermediate concentrations, particularly at 0.75 µM, HaCat cells are less affected than SCC-25 and A375 cells, showing a cell survival rate of approximately 33%, comparing to tumoral cells, where cell viability was no higher than 15%. The IC50 values (Fig. 6B) support the higher sensitivity of SCC-25 and A375 after irradiation in the presence of the flavylium dye (0.35 µM and 0.32 µM, respectively) when compared to HaCat cells (0.60 µM). Attending to the results evidenced earlier, the gap between the light-induced effects and dark toxicity caused by 7,4′diN(Et)2 is sufficiently large to ensure the therapeutic window required to safely perform photodynamic therapy with this flavylium dye.
Fig. 6.

(A) Photodynamic effect of 7,4′diN(Et)2 dye on cellular viability of HaCat, SCC-25, and A374 after a 15-minute irradiation period (white light, 22.5 J/cm2). Results are expressed as the mean ± standard error of the mean (SEM). Two-way analysis of variance (two-way ANOVA) was used to determine statistically significant differences between the three cell lines using Sidak’s multiple comparisons tests (**** p value < 0.0001, *** p value < 0.001, ** p value < 0.01, * p value < 0.05). (B) Dose response curves for each cell line, indicating the corresponding IC50 (half maximal inhibitory concentration) values.
In addition, a pre-washing step was introduced before the irradiation process to remove the compound in solution, ensuring that only the adsorbed or internalized molecules would be photoactivated. Interestingly, the extent of cellular damage was found to be similar to the treatment group where no washing step was included before light exposure (Fig. 7). This result is quite surprising as it would be expected that the intermediate washing step, immediately after the 30 min of incubation, would reduce the efficiency of the photodynamic treatment. However, this was not the case as the fraction of 7,4′diN(Et)2 remaining in contact with the cells appears to be sufficient to maintain the PDT performance. Therefore, no significant differences were observed between the washed and unwashed treatment groups. In the case of A375 however, a small reduction in the efficacy of light-induced treatment was observed after washing out the flavylium dye solution, which might indicate a lower uptake in the 30-minute incubation interval compared to HaCat and SCC-25. Fluorescence measurements were conducted to estimate the remaining amount of 7,4′diN(Et)2 following the washing step, by interpolation with a calibration curve of the flavylium dye in 1% SDS (Figure S2), confirming the lower uptake efficiency in A375 cells (approximately 27%) compared with the other two cell lines (Table 2). The same tendency was observed regardless of the initially administered concentration of 7,4′diN(Et)2 dye, as shown in Figure S3.
Fig. 7.

Photodynamic effect of 7,4′diN(Et)2 dye at 1.5 µM on cellular viability of HaCat, SCC-25 and A374 after a 15-minute irradiation period (white light, 22.5 J/cm2). Cells were either exposed directly to light in the presence of 7,4′diN(Et)2 (full colored bars) or washed before irradiation (bars with square pattern). Results are expressed as the mean ± standard error of the mean (SEM). Two-way analysis of variance (two-way ANOVA) was used to determine statistically significant differences between the means of different treatment groups (washed vs. unwashed) within each cell line using Sidak’s multiple comparisons tests (**** p value < 0.0001, *** p value < 0.001, ** p value < 0.01, * p value < 0.05).
Table 2.
Uptake efficiency after 30 min of incubation of 7,4′diN(et)2 with the different cell lines.
| Cell line | 7,4′diN(Et)2 initial concentration (µM) | Uptake (µM) | Uptake % |
|---|---|---|---|
| HaCat | 1.5 | 0.55 | 35 |
| SCC-25 | 1.5 | 0.58 | 37 |
| A375 | 1.5 | 0.42 | 27 |
Confocal imaging
The cellular location of 7,4′diN(Et)2 dye was evaluated by confocal laser scanning microscopy (CLSM) analysis. Images were recorded after incubating HaCat, SCC-25, and A375 with 3 µM of 7,4′diN(Et)2. A strong red fluorescence emission period confirms the rapid accumulation, after 30 min of compound administration, essentially located in the cytoplasm and perinuclear region of the three skin cellular types (Fig. 8). The relatively small molecular size compared to other conventional photosensitizing structures, might explain the rapid accumulation detected just after a short period of incubation.
Fig. 8.

Confocal laser scanning microscopy images of HaCat, SCC-25 and A374 after incubation with 3 µM of 7,4′diN(Et)2 dye. Cells stained with DAPI (blue signal), cellular accumulation of photosensitizer (red signal), and merged images (right panel) showing the localization of the photosensitizer. Scale bar of 20 μm.
Moreover, specific organelle accumulation of the flavylium dye, namely lysosomal, was found in both cancer/non-cancer cell lines. CSLM images show that, only after 30 min of 7,4′diN(Et)2 administration to the cell cultures, strong yellow colored regions (Fig. 9) become evident in both HaCat and A375 cells, resulting from the overlap between the fluorescence signals of 7,4′diN(Et)2 and the lysosome marker. This suggests a lysosome-targeting ability of the flavylium similar to other previously reported photosensitizers20,21.
Fig. 9.

Confocal laser scanning microscopy images of HaCat and A374 CLSM images showing colocalization between lysosomes (marked with LumiTracker® Lyso Green) and 7,4′diN(Et)2 after incubation for 30 min. The merged images (right panel) show the lysosomal accumulation of the dye (yellow color). Scale bar of 10 μm.
Given the noticeable phototoxicity effects observed in the previous experiment, the intracellular ROS levels were detected using the DCFH-DA probe, which could be oxidized from the nonfluorescent to the fluorescent 2,7-dichlorofluorescein (DCF) form. As expected, flavylium dye significantly enhanced ROS levels upon irradiation. The combination of 3 µM flavylium and 22.5 J/cm2 light exposure increased the intracellular ROS levels, perceptible by the intense DCF green fluorescence detected in the PDT treatment group. Imaging of non-treated cells but subjected to light exposure also indicates the presence of some basal fluorescence but considerably lower and negligible when compared to the high-intensity signal detected in cells irradiated in the presence of 7,4′diN(Et)2 dye (Fig. 10).
Fig. 10.

Confocal laser scanning microscopy images of HaCat, SCC-25 and A374 after being incubated with 3 µM of 7,4′diN(Et)2 and irradiated (15 min, 22.5 J/cm2). Intracellular ROS generation indicated by the green fluorescence signal of DCDFA. Within each subset of microscopy images, the right panel represents the merge between the DCFA signal and bright field contrast image. Scale bar of 20 μm.
Formulation development
It is well established that flavylium molecules follow a basic network of chemical reactions under different pH values, known as “flavylium multistate”, characterized by different species which are reversibly interconnected by the occurrence of different chemical reactions. The molar fraction distribution in the equilibrium and the rates of conversion between species are highly dependent on external stimuli, such as pH, light, and temperature and presence of other substances such as phenolic compounds, metal ions, carbohydrates or proteins22. Thus, it is important to understand, particularly when working with such dynamic class of compounds, how they behave when incorporated in formulations. For that purpose, three different physical hydrogels were developed, each one based on a different polymer: Carbomer, Caesalpinia Spinosa Gum (Gum) and Hydroxypropyl Methylcellulose (HPMC) (Table 3). Hydrogels consist of three-dimensional, highly crosslinked polymeric networks that contain a significant amount of water in their composition. The ease in drug incorporation and release from this type of matrices, along with the good biocompatibility, flexible mechanical properties and the analogous physical properties of real tissues have made them a frequent choice for various biomedical applications23,24. Several studies have reported the development and administration of photosensitizer-loaded hydrogels in the context of photodynamic therapy25,26. These examples highlight the versatility of such semi-solid vehicles in the delivery of different molecules, either of hydrophilic or lipophilic nature, offering opportunities to tailor treatment strategies for specific diseases and clinical settings.
Table 3.
List of ingredients used in the development of hydrogel formulations containing 7,4′diN(et)2.
| Ingredient | % (w/w) | ||||
|---|---|---|---|---|---|
| Purified water | Qb/100 | ||||
| Glycerine | 10 | ||||
| Carbomer | Caesalpinia Spinosa Gum | HPMC | 0.5 | 1 | 1 |
| Dehydroacetic acid and Benzyl Alcohol | 0.5 | ||||
| Sodium hydroxide 10 M | Qb/pH 5-5.5 | ||||
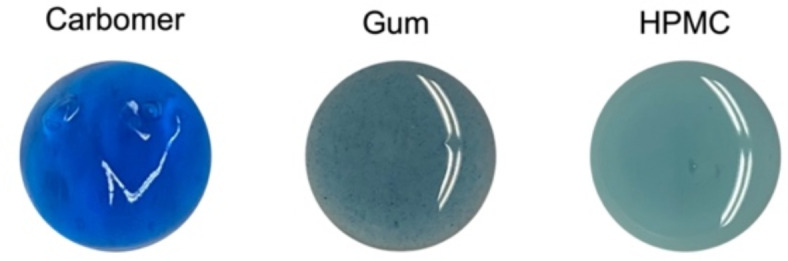
The flavylium-loaded hydrogels (prepared at 37.5 µM) are represented in Fig. 11. In all of them, complete solubilization of 7,4′diN(Et)2 was achieved, however, despite being relatively similar in composition, the choice of polymer had noticeable impact on the final color of the formulation. It is quite clear that the Carbomer-based hydrogel led to major absorbance (hyperchromic effect) and fluorescence increments of 7,4′diN(Et)2, compared to the other formulations, visually perceptible by its intense blue-colored aspect (Fig. 12).
Fig. 11.
Flavylium-loaded hydrogels, prepared with 7,4′diN(Et)2 37.5 µM.
Fig. 12.

Absorbance and fluorescence spectra of 7,4′diN(Et)2 (37.5 µM) in different hydrogel matrices and in water.
This color intensification is probably caused by the establishment of electrostatic interactions between the negatively charged ionized carboxylic functional groups of Carbomer and the positively charged flavylium core of 7,4′diN(Et)2. Despite the neutralization step (required to increase the viscosity of the system) with sodium hydroxide, Carbomer polymers are usually only partially neutralized, at least in the pH range of 7,4′diN(Et)2-loaded gels (pH adjusted to 5.05–5.14), to respect the moderately acidic conditions of the human skin27. Complete neutralization would lead to pH values above 10. Bearing this in mind, the available ionized carboxylic functional groups can interact and stabilize the flavylium cation form of 7,4′diN(Et)2 in the three-dimensional network of the hydrogel. Several examples in literature have described the impact of negatively charged molecules on the kinetic and thermodynamic properties of flavylium-derived compounds and the overall stabilization effect achieved in their presence, as they tend to shift the equilibrium towards higher molar fraction percentages of flavylium cation in the system28,29. On the other hand, the non-charged nature of the other two polymers, Caesalpinia Spinosa Gum and HPMC, does not enable such interactions, justifying the less intense bluish appearance of their respective hydrogels.
The great fluorescence improvement achieved in the Carbopol formulation could be highly advantageous for image-guided PDT. Clinical application of fluorescence emitting photosensitizers has been widely reported in literature, playing a multifaceted role either in tumor diagnosis, treatment or a combination of both (theragnostic application)30.
Singlet oxygen production
Owing to its crucial role as mediator of the phototoxic effects upon light activation of photosensitizers, determination of the singlet oxygen production is a key aspect to consider. More than studying the photogeneration of1O2, 7,4′diN(Et)2 in aqueous solution, it is important to assess and compare the response of the photosensitizer in more complex environments, such as the hydrogels developed for its topical delivery. Indirect monitorization of1O2 production was performed using 1,3-Diphenylisobenzofuran (DPBF) as1O2 trapping agent. DPBF is known to react with1O2, losing its visible light absorption and emission capacity as it decomposes to 1,2-dibenzoylbenzene (DBB)31. Over 750 s of red-light irradiation, 7,4′diN(Et)2 was able to cumulatively produce singlet oxygen, as proven by the successive absorbance intensity reduction of DPBF at 410 nm. (Fig. 13).
Fig. 13.

Visible absorption spectra (300–500 nm) of DPBF (100 µM) after successive 30-second pulses of red-light irradiation in the presence of 7,4′diN(Et)2 (4.2 µM) in different matrices.
Not only the incorporation of 7,4′diN(Et)2 in semi-solid hydrogel matrices did not affect the photogeneration of singlet oxygen, but it also improved the response when compared to the aqueous solution. Analysis of the first-order plots of the natural logarithm of normalized absorption of DPBF over time (representing its photodegradation rate) provide a better perception of the distinct behavior of 7,4′diN(Et)2 in the different matrices (Fig. 14). The highest efficiency in1O2 production is achieved with the Carbomer hydrogel, followed by the other two formulations which showed an identical response. The greater activity of 7,4′diN(Et)2 dye in the Carbomer formulation is probably caused by the increment of the molar extinction coefficient, previously shown by the major absorbance improvements obtained in the hydrogel, which most likely enhanced the light absorption and consequent singlet oxygen production process.
Fig. 14.

First-order plots of the natural logarithm of normalized absorption of DPBF at 410 nm over time, representing its photodegradation rate in the presence of 7,4′diN(Et)2 dye in different matrices. Solid line presents linear fits from which the slope is directly proportional to the photoinduced generation of1O2.
Color stability
The semi-solid formulations were stored under different conditions (dark and light) and color evolution was monitored for 28 days. As discussed earlier, the relative distribution of chemically reversible species of flavylium-derived structures highly depends on the surrounding environmental conditions. The color changes noticed in some of the developed formulations provide evidence of such process. As shown in Fig. 15, over the 28 days kept under dark storage conditions, the Gum hydrogel undergoes major color changes, transiting from blue to purple. This phenomenon is essentially due to the balance of the 7,4′diN(Et)2 flavylium cation species (AH+), blue in color, with other species in the network, namely trans-chalcone (Ct), orange in color, and anionic trans chalcone (Ct−), orange-reddish (Fig. 16). The emergence of such species, whose formation is thermodynamically favored due to the range of pH selected for formulation development, is further supported by the absorbance changes observed over time (Figure S4). The peak at 605 nm (corresponding to flavylium cation) decreases concomitantly with the appearance of two new absorption bands, around 510 and 535 nm, which may be attributed to neutral and anionic chalcone species of 7,4′diN(Et)2, respectively. By the end of the 28th day, the absorbance from these two bands inclusively surpasses the absorbance of the flavylium cation. The rise of such orange/red hues, combined with the remaining fraction of blue-colored 7,4′diN(Et)2 flavylium cation explains the conversion of the hydrogel color to purple.
Fig. 15.

Color stability of 7,4′diN(Et)2-loaded hydrogels over 28 days (dark vs. light storage conditions).
Fig. 16.

General kinetic scheme of the chemical species generated from 7,4’-di(diethylamino)flavylium in its cationic form. The species represented in grey color are transients, not directly detected in this system.
HPMC-based hydrogel follows a similar color evolution, yet more tenuous. Again, the spectrum in Figure S4 shows absorbance changes, with a decrease of the band at λmax (605 nm) and the clear emergence of a single band at 510 nm. However, compared to the Gum hydrogel, the purple hues are not so evident, and the formulation shows a more faded appearance, possibly due to a lower conversion of the AH+ species into Ct and Ct−.
On the other hand, a distinct behavior was detected in the Carbopol hydrogel. In the dark, an intense blue color (λmax 610 nm) was observed throughout the 28 days, confirming the strong stabilization of the 7,4′diN(Et)2 flavylium cation and the absence of chemical conversion to other species, as noticed by the absence of additional bands in the absorption spectrum (Figure S4).
The color of 7,4′diN(Et)2-loaded hydrogel was quite stable for a week, with the absorbance and fluorescence parameters remaining nearly unchanged, regardless of light exposure (Figures S4 and S5). Nonetheless, from that moment on, it was observed a gradual fading of the color, with a more pronounced decline of fluorescence and absorbance (as a result of compound degradation) being detected after prolonged light exposure.
Intriguing observations were detected in Gum and HPMC-based hydrogels exposed to daylight. In fact, and contrary to the gradual evolution towards the purple hues observed in the formulations kept under dark storage conditions, light-exposed hydrogels remained blue throughout the entire storage period. Unlike anthocyanins (due to the small mole fraction of trans-chalcone at equilibrium), synthetic flavyliums are well-known photochromic systems. The photochromatic properties of flavylium multistate often arise from photoinduced cis − trans isomerizations32. Therefore, upon light excitation, trans-chalcone species (whose photochemical reactivity is widely described in the literature) that gradually form under the hydrogel pH conditions can isomerize to the cis form, which in turn can be converted to the blue flavylium cation species. Curiously, when the hydrogels were moved back to dark conditions, the appearance of purple hues was again noticed after a few weeks, which is compatible with reversible photochromism, a phenomenon already observed and described for other flavylium-derived molecules, where at a certain pH the flavylium cation can be formed by light irradiation of the trans-chalcone but then eventually reverts to the initial thermodynamically stable state when kept in the dark15,33. This explains the blue color observed in light-exposed Gum and HPMC-based hydrogels, further corroborated by the corresponding absorbance spectra, where no absorptive bands appear in the range of 500–550 nm (where predictably would be expected as a result of trans-chalcone formation).
Photostability determination
The development and application of photosensitizers displaying high photostability is highly desirable, not only to prevent the breaking down of the PS into unknown and potentially deleterious secondary oxidation products but also to allow the use of higher energy sources, which may result in deeper tissue penetration and greater therapeutic efficacy. Moreover, ensuring photostability can enhance the effectiveness of PDT by providing consistent singlet oxygen1O2) production over time, consequently reducing the required PS concentration, which could otherwise elicit side effects such as skin photosensitization2,4.
As expected, and similar to the previously reported resistance to photobleaching for other amino substituted flavylium dyes8, 7,4′diN(Et)2 in aqueous solution presented an analogous performance, retaining above 90% of the initial absorbance after a light dose of 67.5 J/cm2 being delivered over 45 min (data not shown). Considering the interesting outcomes of the Carbomer formulation, the flavylium dye was further tested in the hydrogel form and exposed to a higher light dose (90 J/cm2 delivered over 60 min). The spectral variation of 7,4′diN(Et)2 was barely noticeable, showing a notable photostability of 98% as demonstrated in Fig. 17.
Fig. 17.

UV-visible absorption spectra of 7,4′diN(Et)2 dye in Carbomer hydrogel (37.5 µM) recorded at different time points after light exposure. Photostability was estimated based on the ratio between AUC60 and AUC0 (area under curve). Values of absorbance spectra after 60 min of light exposure and from the absorbance spectral changes. Calculations were performed with GraphPad Prism software version 8.2.1.
Structural analysis of the carbomer-based hydrogel
The rheological assessment of the carbomer-based hydrogel containing the flavylium dye was performed by rotational and dynamic viscosity and oscillation frequency sweep tests. Continuous shear experiments measure the ability of each system to resist structural breakdown during the standardized shearing procedure. The formulation presents a non-Newtonian, pseudoplastic (shear thinning) behavior, since the viscosity values decreased with increasing shear rates, meaning the “structure” of the sample is broken down by an external force. The results for the flow curve method show the hydrogel viscosity response when the shear rate increases (up-curve), gradually breaking down the formulation’s structure, as well as the hydrogel behavior when the shear rate decreases (down-curve), to allow the structure recovery34 (Fig. 18). The two curves clearly overlap, indicating a non-thixotropic behavior, suggesting that the gel once applied or injected to the skin (under stress) becomes less viscous, recovering the original viscosity when the stress is removed. Shear-thinning hydrogels adhere well to skin or wound surfaces, ensuring that the hydrogel remains in contact with the skin throughout the PDT process. Their ability to conform to the skin’s surface makes them particularly suitable for this type of application, where patient comfort is essential, especially in treating sensitive skin areas or wounds35,36.
Fig. 18.

Flow curves of the carbomer-based hydrogel, obtained in the viscosity ramp up/ramp down assays.
The oscillatory frequency sweep test results are presented as G’ (the storage modulus or elastic component) and G” (loss modulus or viscous component) moduli as a function of frequency (Fig. 19), at constant shear strain. G’ and G” are nearly parallel, a typical frequency response for a gel-like behavior, in agreement with the viscosity measurements37.
Fig. 19.

Effect of oscillation frequency sweep test of the carbomer-based hydrogel.
Conclusions
PDT’s uniqueness is partly due to its non-invasiveness nature, offering aesthetic advantages that are particularly relevant in the case of skin cancerous lesions treatment. Besides, its potential to be applied in combination with other treatment modalities, makes it a very interesting therapeutic option. Despite the tremendous evolution in the field, the interdisciplinary nature of the process of development and approval of PSs for photodynamic therapy, poses some limitations to their clinical translation.
Following the encouraging preliminary results on the photosensitizing properties of synthetic flavylium dyes functionalized with amino groups, this work reports the synthesis of 7,4’-di(diethylamino)flavylium, a new proposed PS for PDT. Photoactivation of a reduced concentration of 7,4′diN(Et)2 (1.5 µM) caused more than 90% cell death, across the three different cell lines tested. At lower concentrations, namely 0.75 and 0.375 µM, 7,4′diN(Et)2 showed higher toxicity towards skin cancer cell lines, SCC-25 and A375.
Overall, the three developed hydrogels were able to incorporate and easily solubilize the flavylium dye. However, from the different prototypes, Carbomer-based hydrogel provided the most interesting improvements concerning the photochemical and photophysical properties of 7,4′diN(Et)2. The pronounced absorbance enhancement as a result of the stabilization of the flavylium cation, promoted by the negatively charged carboxylic groups of Carbomer, translated into a better singlet oxygen photogeneration. Moreover, when kept in the dark, the formulation maintained its stability over a week, with unchanged absorbance and fluorescence. The notable photostability of the flavylium-loaded hydrogel after being exposed to a 90 J/cm2 light dose and the remarkable fluorescence emission, reinforce the suitability of this formulation for PDT-related applications, including imaging-guided PDT.
Experimental section
Materials and methods
The reagents and solvents used in this work were obtained from commercial sources and used as received. Aluminium sheets 20 ⋅ 20 cm, coated with a 0.2 mm thick layer of silica gel 60 F254 were used for thin-layer chromatography analysis (TLC). The formation and purity of 7,4′diN(Et)2 were checked from the HPLC system (Thermo ScientificTM, UltimateTM 3000 Standard), equipped with a reversed-phase C18 column (Agilent) (250 × 4.6 mm i.d., 2.7 μm). The column oven temperature was set at 25 °C. The solvents used were: (A) 1% (v/v) formic acid in water and (B) 0.5% (v/v) formic acid in 80% (v/v) acetonitrile, with a solvent B gradient of 40 to 85%, during 50 min, and a flow rate of 0.4 mL/ min. Electrospray ionization mass spectrum (ESI-MS) was performed on an LTQ OrbitrapTM XL hybrid mass spectrometer (Thermo Fischer Scientific, Bremen, Germany) controlled by LTQ Tune Plus 2.5.5 and Xcalibur 2.1.0. and fitted with an electrospray ionization source (ESI) in positive ionization mode. The capillary voltage and temperature of the ESI was set to 3.4 kV and 350ºC, respectively. Nitrogen was used as a sheath gas at flow rate of 5 au (arbitrary unit), as provided by the software settings. The capillary voltage was 36 V and the tube lens voltage 80 V. The ESI-MS analysis was operated in full MS scan mode with a m/z range from 50 to 2000. The Xcalibur QualBrowser, Thermo Fischer Scientific was the mass spectra data handling software used to search the predicted compound by m/z value. NMR spectra (Figure S6)1H and13C) were acquired on a Bruker–Avance 600 spectrometer, at 298.15 K, and the pigment was dissolved in deuterated methanol (CD3OD). The chemical shifts (δ) were expressed in parts per million (ppm), the multiplicities as singlets (s), doublets (d) and triplets (t) and the coupling constants (J) in Hertz.
Synthesis of 7,4′diN(Et)2
7,4′diN(Et)2 was synthesized for the first time using the well-known mechanism for the synthesis of flavylium dyes14,38 based on an acidic aldolic condensation of salicylaldehydes and acetophenones. 4-(diethylamino)salicylaldehyde (100 mg, 1.3 mmol) and 4-diethylaminoacetophenone (200 mg, 2.4 mmol) were dissolved in a mixture of ethyl acetate: methanol (2:1) (5 mL). Then, TMSCl (1.315 mL, 20 equivalents) was added, and the reaction mixture was stirred for 28 h at room temperature and protected from light. The reaction was quenched by the addition of water, and the product was purified by liquid–liquid extraction (using ethyl acetate), and by column chromatography (stationary phase LiChroprep RP-18 (40–63 μm), eluent water/methanol (6/4, v/v) acidified with 2% HCl). The yield of photosensitiser synthesis was 56%. The fraction of the purified compound was evaporated and freeze-dried to obtain a blue solid. The structure of this compound was confirmed by ESI-MS and NMR. ESI-MS m/z: [M]+ calculated for C23H29ON2 was 349.22815 Da; found 349.48272 Da (Figure S7)1. H NMR (600.13 MHz, CD3OD, 25 ºC): δ ppm 7.72 (1 H, d, J = 8.6 Hz), 8.39 (1 H, d, J = 8.6 Hz), 7.81 (1 H, d, J = 9.2 Hz), 7.27 (1 H, dd, J = 2.2 and 9.2 Hz), 7.13 (1 H, d, J = 2.2 Hz), ), 8.23 (2 H, d, J = 9.2 Hz), 6.99 (2 H, d, J = 9.2 Hz), 3.65 (4 H, q, J = 7.2 Hz), 3.72 (4 H, q, J = 7.2 Hz), 1.32 (6 H, t, J = 7.2 Hz), 1.36 (6 H, t, J = 7.2 Hz)13. C NMR (125.77 MHz, CD3OD, 25 ºC): δ (ppm) 168.4, 107.5, 146.6, 131.1, 115.3, 155.2, 95.6, 115.4, 158.3, 114.8, 131.1, 112.2, 153.6, 44.7, 45.3, 11.4, 11.3 (Table S1).
Spectroscopic properties
UV-VIS absorption spectra were recorded on a Cary 60 UV-Vis spectrophotometer (Agilent) and the spectroscopic absorption curves were registered from 250 to 750 nm using a quartz cell cuvette with 1 cm optical path. To determine the dye’s molar extinction coefficient (ε) values, several solutions with increasing dye concentrations were prepared in triplicate, in three different solvents (DMSO, EtOH and MeOH). Afterwards, the spectrum of each solution was recorded and the absorbances at the maximum absorption wavelength were plotted against the concentration. ε values were obtained directly from the slopes of the resulting curve equations (cuvette with a 1 cm optical path).
Fluorescence emission spectrum
Fluorescence spectra were measured on a FluoroMax®-4 (HORIBA Scientific) fluorimeter in a QS high-precision cell made of quartz SUPRASIL with a length path of 10 mm (Hellma Analytics). The absorbance of the dye solutions was kept below 0.1 at the excitation wavelength (608, 605 and 602 nm for DMSO, EtOH and MeOH, respectively) with both slit widths set to 5 nm. All emission fluorescence spectra were recorded from 620 to 750 nm.
Light sources
Light irradiation experiments were conducted with a device composed by light-emitting diodes (LEDs), emitting at 400–650 nm at an irradiance of 25 mW/cm2. The spectral emission of the LEDs system was obtained using a spectrofluorometer (Varian Cary Eclipse, San Diego, CA, USA). The absolute irradiance of the LEDs was evaluated with a Spectroradiometer USB2000 + RAD (OceanOptics, Winter Park, FL, USA).
Photostability determination
To evaluate the photostability of PS-loaded hydrogel, aliquots of 100 µL were added to a 96 well plate, and irradiated from the top at room temperature and the absorbance was registered at different timepoints (15, 30, 45 and 60 min). The irradiation step was carried out using the same LED light device used in the photodynamic experiments. UV-Visible spectra were recorded in a FlexStation 3 Multi-Mode Microplate Reader (Molecular Devices).
Singlet oxygen (1O2) photogeneration measurement
Generation of singlet oxygen was measured by an indirect method, using 1,3- diphenylisobenzofuran (DPBF) (Sigma-Aldrich), a chemical quencher of singlet oxygen.
A working solution of DPBF was freshly prepared in ethanol and carefully kept in the dark throughout the entire experimental procedure. In a 96-well plate, 25 µL of each flavylium-loaded hydrogel was mixed with 200 µL of the DPBF solution, resulting in a final concentration of 4.2 µM and 100 µM, respectively. Irradiation was carried out with the LED device, adjusting the light emission to the red-light channel (λ = 637 nm) instead of white light, to prevent side-photodegradation of the quencher. The stability of DPBF in the absence of light exposure was monitored throughout the assay. The absorption spectra (300–500 nm) were recorded over 750 s (successive measurements were at each 30-second irradiation pulse) in a FlexStation 3 Multi-Mode Microplate Reader (Molecular Devices).
Cell culture conditions
Human skin keratinocyte cell line (HaCat) was provided by CLS Cell Lines Service GmbH and maintained in DMEM High Glucose Basic (820300a, CLS). Tongue squamous carcinoma (SCC-25, CRL-1628) and human melanoma (A375, CRL-1619) cell lines were purchased from the American Type Culture Collection (ATCC, Manassas, VA, USA) and maintained in Dulbecco′s Modified Eagle′s Medium/Nutrient Mixture F-12 Ham (D8437, Sigma-Aldrich) supplemented with 10% fetal bovine and 400 ng/mL hydrocortisone (H0888, Sigma-Aldrich) and DMEM High Glucose Basic (820300a, CLS). All cell culture mediums were supplemented with 10% fetal bovine serum (FBS) (S1810, Biowest) and 1% of antibiotic/antimycotic solution (100 units/mL of penicillin, 10 mg/mL of streptomycin and 0.25 mg/mL of amphotericin B, Sigma-Aldrich, St. Louis, MO, USA) (except for SCC-25).
Cells were kept at 37 ºC in an atmosphere of 5% CO2, cell morphology checked regularly and medium was renewed every two days. Cells were harvested when necessary.
Cell viability assays
For the cytotoxicity and phototoxicity experiments, cells were seeded in 96 well plates at a density of 4 × 10⁴ cells/well and left to grow for two days to reach confluence. Serially diluted compound solutions (0–25 µM) were prepared in Hanks Balanced Salt Saline and added to the wells. After a pre-incubation period of 30 min at 37 ºC, cells were either irradiated immediately or, alternatively, a pre-washing step with PBS was performed to remove the compound in solution before irradiation. Fresh medium was then added, and the plates were further incubated for 24 h at 37 ºC, followed by cellular viability determination by Alamar Blue assay. FlexStation 3 Multi-Mode Microplate Reader (Molecular Devices). Experiments were performed in triplicates. The percentage of cell viability was determined using the following equation: % viability = Asample/Acontrol × 100, where Asample is the absorbance of wells with cells treated with the compounds at a given concentration and Acontrol corresponds to absorbance of control wells, where cells were not subjected to treatment. Data are expressed as mean absorbance ± standard error of the mean.
Cellular uptake and ROS production: confocal laser scanning microscopy imaging
Cellular uptake, cellular location and ROS generation after irradiation of 7,4′diN(Et)2 was analyzed by confocal imaging. Preparation of samples consisted of seeding cells in 8 Well µ-slides (Ibitreat, Ibidi GmbH, Germany) at 2 × 10⁵ cells/well. After 24 h incubation, cells were incubated with 7,4′diN(Et)2 for 30 min. Then, for the uptake evaluation, cells were rinsed 3x with PBS pH 7.4 to remove unbound/non-internalized flavylium dye and then incubated 10 min with 10% formalin for cell fixation. Cells were washed again with PBS and incubated with DAPI solution (1 µg/mL in PBS) for 10 min and then rinsed and kept in PBS for confocal imaging analysis. In the case of cellular location evaluation, procedure was quite similar, except after the 30 min, cells were washed and LumiTracker® Lyso Green (75 nM in 1x PBS) was added directly to the cells for 7 min before image acquisition.
Regarding the ROS production assessment, cells were incubated for 30 min with 7,4′diN(Et)2, irradiated for 15 min (22.5 J/cm2) and then incubated with DCFDA (20 µM) for 20 min. Cells were then rinsed with PBS and the following experimental steps were similar to the ones described for the uptake assay. Cells subjected to the same experimental conditions, but in the absence of flavylium were considered as negative control.
Images were recorded with a Leica Stellaris 8 confocal microscope (Leica Microsystems, Wetzlar, Germany) equipped with Leica Application Suite X package (LAS X), acquired with a resolution of 1024 × 1024 using a 63X/1.4 oil immersion objective. Image processing was performed with ImageJ software (version 2.1.0/1.53c). For imaging acquisition, λex selected were: 485 nm for DCFDA, 610 nm for 7,4′diN(Et)2 and 358 nm for DAPI. Experiments were performed at CEMUP (Imaging by confocal and fluorescence lifetime laboratory).
Statistical analyses
Statistical analyses were performed with GraphPad Prism 8.2.1. software Experiments were performed at least three times in triplicates to ensure the reproducibility of the results. Data are expressed as the mean ± standard error of the mean (SEM). Significance was set at p < 0.05.
Formulation development
Preparation of hydrogels was performed as follows: water and glycerin were initially mixed, followed by gradual polymer addition and gently manual mixing to avoid air bubble formation until a homogeneous mixture was achieved. In the case of Carbomer, a neutralization step was required after polymer hydration to achieve the desired viscosity. NaOH was selected as neutralizer and thickening gradually occurred as it was added to the solution. Finally, a concentrated aqueous solution of 7,4′diN(Et)2 (previously dissolved in water) was gradually mixed with the gel. The corresponding water volume was taken into consideration and subtracted from the initial total volume of the formulation and restored upon compound addition. After complete solubilization and color uniformity was achieved, hydrogels were kept at room temperature for 24 h and the pH values were adjusted in the range 5.05–5.14.
Rheological analysis
Dynamic viscosity measurements were carried out between 1 and 100 Pa on a logarithmic increment, ranging from 0.1 to 10 s− 1, on 10 samples per decade. For the oscillation frequency sweep, the equipment was set to apply a frequency ranging between 0.01 and 100 Hz, on 5 samples per decade with a constant strain (0.1%), which was previously determined to be within the linear viscoelastic region (LVER) of the sample. Analysis was performed with a controlled stress Kinexus Lab + Rheometer (Malvern Instruments, Worcestershire, UK). All measurements were performed at 25 °C, using cone and plate geometry (truncated angle 4° and radius 40 nm), 5 days after the preparation of the hydrogel.
Electronic supplementary material
Below is the link to the electronic supplementary material.
Acknowledgements
Authors thank the technical support given in confocal microscopy analysis (Imaging by confocal and fluorescence lifetime laboratory, CEMUP, UP). This work was financially supported by FCT project FERMEN.TO - FERmented foods to struggle MEtabolic syNdrome. An inTegrated in vitro dynamic approach (2023.00164.RESTART). This work was supported by the Associate Laboratory for Green Chemistry - LAQV (LA/P/0008/2020 10.54499/LA/P/0008/2020; UIDP/50006/2020 10.54499/UIDP/50006/2020; UIDB/50006/2020 10.54499/UIDB/50006/2020) which is financed by national funds from FCT/MCTES. P.C. and P.A. thank their PhD grant from FCT (SFRH/BD/150661/2020, SFRH/BD/143309/2019). J.O. would like to thank FCT for her research contract (2022.00042.CEECIND/CP1724/CT0017). Iva Fernandes acknowledges her assistant professor contract CEECINST/00064/2021.
Author contributions
P.C., P.A, J.O. and I.F. conceptualized and designed the study and methodology. P.C. and P.A. performed the experiments and analyzed the data. N.M, V.F, I.F, J.O., J.M and H.R. provided work supervision.P.C. wrote the main manuscript text and prepared the figures and tables.P.C, P.A., I.F, J.O. collaborated to analyze the research data comprehensively. All authors reviewed and validated the manuscript.
Data availability
The datasets used and/or analyzed during the current study are available from the corresponding author on reasonable request.
Declarations
Competing interests
The authors declare no competing interests.
Footnotes
Publisher’s note
Springer Nature remains neutral with regard to jurisdictional claims in published maps and institutional affiliations.
Contributor Information
Joana Oliveira, Email: jsoliveira@fc.up.pt.
Iva Fernandes, Email: iva.fernandes@fc.up.pt.
References
- 1.Abdel-kader, M. H. in Photodynamic Medicine: From Bench to Clinic (eds Herwig Kostron & Tayyaba Hasan) 0 (The Royal Society of Chemistry, 2016).
- 2.Lima, E. & Reis, L. V. Photodynamic therapy: From the basics to the current progress of N-heterocyclic-bearing dyes as effective photosensitizers. Molecules28, 10.3390/molecules28135092 (2023). [DOI] [PMC free article] [PubMed]
- 3.Sun, J., Zhao, H., Fu, L., Cui, J. & Yang, Y. Global trends and research progress of photodynamic therapy in skin cancer: A bibliometric analysis and literature review. Clin. Cosmet. Investig. Dermatol.16, 479–498. 10.2147/ccid.S401206 (2023). [DOI] [PMC free article] [PubMed] [Google Scholar]
- 4.Mariño-Ocampo, N. et al. Recent photosensitizer developments, delivery strategies and combination-based approaches for photodynamic therapy. Photochem. Photobiol.99, 469–497. 10.1111/php.13749 (2023). [DOI] [PubMed] [Google Scholar]
- 5.Penetra, M., Arnaut, L. G. & Gomes-da-Silva, L. C. Trial watch: An update of clinical advances in photodynamic therapy and its immunoadjuvant properties for cancer treatment. Oncoimmunology12, 2226535. 10.1080/2162402x.2023.2226535 (2023). [DOI] [PMC free article] [PubMed] [Google Scholar]
- 6.Park, J., Lee, Y. K., Park, I. K. & Hwang, S. R. Current limitations and recent progress in nanomedicine for clinically available photodynamic therapy. Biomedicines9, 10.3390/biomedicines9010085 (2021). [DOI] [PMC free article] [PubMed]
- 7.Oliveira, H. et al. Photoactivated cell-killing amino-based flavylium compounds. Sci. Rep.11, 22005. 10.1038/s41598-021-01485-y (2021). [DOI] [PMC free article] [PubMed] [Google Scholar]
- 8.Correia, P. et al. Light-activated amino-substituted dyes as dual-action antibacterial agents: Bio-efficacy and AFM evaluation. Dyes Pigm.224, 111975. 10.1016/j.dyepig.2024.111975 (2024). [Google Scholar]
- 9.Cruz, L., Basílio, N., Mateus, N., de Freitas, V. & Pina, F. Natural and synthetic flavylium-based dyes: The chemistry behind the color. Chem. Rev.122, 1416–1481. 10.1021/acs.chemrev.1c00399 (2022). [DOI] [PubMed] [Google Scholar]
- 10.Ran, P. et al. Light-triggered theranostic hydrogels for real-time imaging and on-demand photodynamic therapy of skin abscesses. Acta Biomater.155, 292–303. 10.1016/j.actbio.2022.11.039 (2023). [DOI] [PubMed] [Google Scholar]
- 11.Hamed, E., Al Balah, O. F. A., Refaat, M., Badr, A. M. & Afifi, A. Photodynamic therapy mediated by methylene blue-loaded PEG accelerates skin mouse wound healing: An immune response. Lasers Med. Sci.39, 141. 10.1007/s10103-024-04084-1 (2024). [DOI] [PMC free article] [PubMed] [Google Scholar]
- 12.Chen, G. et al. Intelligent hydrogels for treating malignant melanoma. Eng. Regen.5, 295–305. 10.1016/j.engreg.2024.05.004 (2024). [Google Scholar]
- 13.Araújo, P. et al. Synthesis, structural characterization and chromatic features of new 2-phenyl-1-benzopyrylium and 2-phenyl-styryl-1-benzopyrylium amino-based blue dyes. Tetrahedron Lett.85, 153487. 10.1016/j.tetlet.2021.153487 (2021). [Google Scholar]
- 14.Charlesworth, E. H., Chavan, J. J. & Robinson, R. 100. A synthesis of pyrylium salts of anthocyanidin type. Part XX. Morinidin chloride. Observations on cyanomaclurin. J. Chem. Soc. (Resumed), 370–374, 10.1039/JR9330000370 (1933).
- 15.Pina, F., Melo, M. J., Laia, C. A. T., Parola, A. J. & Lima, J. C. Chemistry and applications of flavylium compounds: A handful of colours. Chem. Soc. Rev.41, 869–908. 10.1039/C1CS15126F (2012). [DOI] [PubMed] [Google Scholar]
- 16.Rodrigues, J. A. & Correia, J. H. Enhanced photodynamic therapy: A review of combined energy sources. Cells11, 10.3390/cells11243995 (2022). [DOI] [PMC free article] [PubMed]
- 17.O’Connor, A. E., Gallagher, W. M. & Byrne, A. T. Porphyrin and nonporphyrin photosensitizers in oncology: Preclinical and clinical advances in photodynamic therapy. Photochem. Photobiol.85, 1053–1074. 10.1111/j.1751-1097.2009.00585.x (2009). [DOI] [PubMed] [Google Scholar]
- 18.Celli, J. P. et al. Imaging and photodynamic therapy: Mechanisms, monitoring, and optimization. Chem. Rev.110, 2795–2838. 10.1021/cr900300p (2010). [DOI] [PMC free article] [PubMed] [Google Scholar]
- 19.Blanco, K. C. et al. Fluorescence guided PDT for optimization of the outcome of skin cancer treatment. Front. Phys.3, 10.3389/fphy.2015.00030 (2015).
- 20.Gonçalves, R. C. R. et al. Bioimaging of lysosomes with a BODIPY pH-dependent fluorescent probe. Molecules27 (2022). [DOI] [PMC free article] [PubMed]
- 21.Li, Y. et al. A self-assembled nanophotosensitizer targets lysosomes and induces lysosomal membrane permeabilization to enhance photodynamic therapy. Chem. Sci.14, 5106–5115. 10.1039/d3sc00455d (2023). [DOI] [PMC free article] [PubMed] [Google Scholar]
- 22.Pina, F., Petrov, V. & Laia, C. A. T. Photochromism of flavylium systems. An overview of a versatile multistate system. Dyes Pigm.nts92, 877–889. 10.1016/j.dyepig.2011.03.033 (2012). [Google Scholar]
- 23.Gan, S. et al. Recent advances in hydrogel-based phototherapy for tumor treatment. Gels9 (2023). [DOI] [PMC free article] [PubMed]
- 24.Itoo, A. M., Paul, M., Padaga, S. G., Ghosh, B. & Biswas, S. Nanotherapeutic intervention in photodynamic therapy for cancer. ACS Omega7, 45882–45909. 10.1021/acsomega.2c05852 (2022). [DOI] [PMC free article] [PubMed] [Google Scholar]
- 25.Glass, S., Rüdiger, T., Griebel, J., Abel, B. & Schulze, A. Uptake and release of photosensitizers in a hydrogel for applications in photodynamic therapy: The impact of structural parameters on intrapolymer transport dynamics. RSC Adv.8, 41624–41632. 10.1039/C8RA08093C (2018). [DOI] [PMC free article] [PubMed] [Google Scholar]
- 26.Liu, S. et al. Photosensitizer-loaded hydrogels: A new antibacterial dressing. Wound Repair Regen.32, 301–313. 10.1111/wrr.13156 (2024). [DOI] [PubMed] [Google Scholar]
- 27.Segger, D. et al. Multicenter study on measurement of the natural pH of the skin surface. Int. J. Cosm. Sci.30, 75–75. 10.1111/j.1468-2494.2007.00403_1.x (2008). [Google Scholar]
- 28.Araújo, P. et al. Impact of lignosulfonates on the thermodynamic and kinetic parameters of malvidin-3- O-glucoside in aqueous solutions. J. Agric. Food Chem.66, 6382–6387. 10.1021/acs.jafc.8b02273 (2018). [DOI] [PubMed] [Google Scholar]
- 29.Cruz, L., Basílio, N. & de Freitas, V. Color stabilization of cyanidin-3-glucoside-based dyes by encapsulation with biocompatible PEGylated phospholipid micelles. Dyes Pigm.181, 108592. 10.1016/j.dyepig.2020.108592 (2020). [Google Scholar]
- 30.Sarbadhikary, P., George, B. P. & Abrahamse, H. Recent advances in photosensitizers as multifunctional theranostic agents for imaging-guided photodynamic therapy of cancer. Theranostics11, 9054–9088. 10.7150/thno.62479 (2021). [DOI] [PMC free article] [PubMed] [Google Scholar]
- 31.Zhang, X.-F. & Li, X. The photostability and fluorescence properties of diphenylisobenzofuran. J. Luminesc.131, 2263–2266. 10.1016/j.jlumin.2011.05.048 (2011). [Google Scholar]
- 32.Figueiredo, P. et al. Photochromism of the synthetic 4’,7-dihydroxyflavylium chloride. J. Am. Chem. Soc.116, 1249–1254. 10.1021/ja00083a011 (1994). [Google Scholar]
- 33.Gomes, R., Parola, A. J., Laia, C. A. T. & Pina, F. Promoting photochromism on flavylium derived 2-hydroxychalcones in aqueous solutions by addition of CTAB micelles. J. Phys. Chem. B111, 12059–12065. 10.1021/jp073859c (2007). [DOI] [PubMed] [Google Scholar]
- 34.Ramli, H., Zainal, N. F. A., Hess, M. & Chan, C. H. Basic principle and good practices of rheology for polymers for teachers and beginners. Chem. Teach. Int.4, 307–326. 10.1515/cti-2022-0010 (2022). [Google Scholar]
- 35.Glass, S. et al. Photosensitizer-loaded hydrogels for photodynamic inactivation of multirestistant bacteria in wounds. RSC Adv.11, 7600–7609. 10.1039/D0RA09786A (2021). [DOI] [PMC free article] [PubMed] [Google Scholar]
- 36.Lu, P. et al. Harnessing the potential of hydrogels for advanced therapeutic applications: Current achievements and future directions. Signal Transd. Targ. Ther.9, 166. 10.1038/s41392-024-01852-x (2024). [DOI] [PMC free article] [PubMed] [Google Scholar]
- 37.de Camargo, I. L., Morais, M. M., Fortulan, C. A. & Branciforti, M. C. A review on the rheological behavior and formulations of ceramic suspensions for vat photopolymerization. Ceram. Int.47, 11906–11921 (2021). [Google Scholar]
- 38.Robinson, R. & Todd, A. R. 369. Experiments on the synthesis of anthocyanins. Part XVII. The syntheses of pelargonin, peonin, and cyanin chlorides. Journal of the Chemical Society (Resumed), 2488–2496, 10.1039/JR9320002488 (1932).
Associated Data
This section collects any data citations, data availability statements, or supplementary materials included in this article.
Supplementary Materials
Data Availability Statement
The datasets used and/or analyzed during the current study are available from the corresponding author on reasonable request.