Abstract
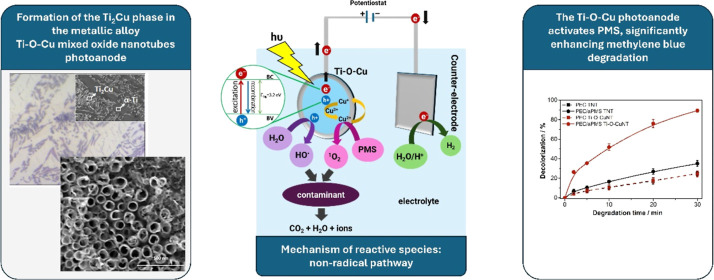
This study introduces a novel photoelectrocatalytic (PEC) system featuring a Ti–O–Cu mixed nanotubular oxide photoanode for the simultaneous activation of peroxymonosulfate (PMS), targeting the removal of emerging contaminants, such as methylene blue dye, tetracycline, and ibuprofen. The Ti–5.5Cu (atom %) alloy substrate and the nanotubular oxide layer were synthesized through arc melting and electrochemical anodization. The conditions of photoelectrocatalysis-assisted PMS activation (PEC/aPMS) were optimized using experimental design, achieving 90.4% decolorization of methylene blue dye within 30 min under optimal conditions: pH 4, an applied potential of 0.5 V vs Ag/AgCl, and a PMS concentration 50 times the molar concentration of the contaminant, utilizing a 10 W UV LED at 365 nm. In contrast, only 25% decolorization was observed without PMS. Singlet oxygen (1O2) was identified as the primary pathway for PMS activation (nonradical). Additionally, the PEC/aPMS system effectively degraded model contaminants, achieving 52% degradation of ibuprofen, 78% of methylene blue, and 92% of tetracycline in 10 mg L–1 total organic carbon solutions within 60 min under optimized conditions. The electrode exhibited remarkable stability, maintaining its efficiency throughout the experiments. These findings highlight the potential of mixed nanostructured oxide electrodes for developing highly efficient and durable PEC systems with integrated PMS activation for the removal of organic contaminants.
1. Introduction
The contamination of water sources has become a pressing environmental issue due to the toxicity and persistence of pollutants released into the environment. Approximately 80,000 chemical compounds, totaling 500 million tons, are discharged annually, many categorized as contaminants of emerging concern (CECs). These include pharmaceuticals, pesticides, personal care products, flame retardants, and perfluoroalkyl substances, among others.1 CECs can act as endocrine disruptors, posing significant health risks to humans and wildlife.1,2 Despite the severity of this issue, current water treatment plants often fail to adequately monitor or regulate these contaminants, presenting a challenge in their detection and removal from the environment. Conventional wastewater treatment plants, while crucial, struggle to remove and degrade many CECs effectively,2−4 highlighting the need for advanced solutions.
Advanced oxidation processes (AOPs) are methods used to remove contaminants from water sources by generating highly reactive species such as hydroxyl radicals (•OH) or other reactive species.3,4 These species can effectively break down a wide range of contaminants, resulting in byproducts with decreased toxicity.5,6 In recent years, peroxymonosulfate (PMS) activation has garnered attention as a viable alternative for contaminant removal. PMS, available commercially as Oxone (2KHSO5·KHSO4·K2SO4), is a potent oxidant (E0 = 1.85 V vs NHE) but exhibits limited reactivity toward organic contaminants.7 PMS can be activated through heat, light, or catalysis, with catalytic activation being a more efficient and low-temperature alternative.8 A range of catalysts, including transition metals, noble metals, and metal oxides, have been used in the catalytic activation of PMS. These methods help produce sulfate radicals and other reactive species that effectively degrade pollutants.8−10
Various heterogeneous catalysts, primarily metal oxides and some carbonaceous (metal-free) materials, have been investigated for PMS activation.7 However, most of these catalysts are used in dispersion form, often as nanoparticles, which poses significant challenges for recovery and reuse, requiring additional filtration steps. In contrast, immobilized catalysts offer a distinct advantage as they can be more easily recovered and reused without complex separation processes. This highlights the potential of immobilized catalysts, which offer scalability, enhanced stability, and efficient pollutant degradation. Notably, recent studies have explored the activation of PMS within a photoelectrocatalysis (PEC) system.11−16 A photoelectrocatalytic oxidation process typically involves an n-type photoelectrode that generates electrons and holes upon light absorption and a cathode that receives electrons directed by the electrochemical potential difference. These e–/h+ pairs can also participate in redox reactions with PMS. While previous research predominantly utilized catalyst cathodes to activate PMS, such as platinum,11 CuO2,14 and polydopamine-modified carbon felt cathodes,13 there is growing interest in the potential of photoanodes to achieve PMS activation. The photoelectrode can be made from various materials, including semiconductors and metal oxides, and the choice of material depends on the desired properties, such as bandgap, light absorption, and electron transfer. For example, Bacha et al.16 developed a Co-BiVO4/FTO photoanode that showed significant PMS activation compared to other photocatalysts. Zheng and colleagues prepared a modified molybdenum disulfide-embedded carbon cloth photoanode for PMS activation.15 However, the development of efficient photoanodes for this purpose remains in its nascent stages, necessitating further research to optimize the performance and elucidate mechanisms of PMS activation.
Inspired by these challenges, in this work, we report the synthesis of a novel Ti–O–Cu mixed nanotubular oxide photoanode directly grown on a TiCu alloy through a simple and controllable electrochemical anodization process. This unique material combines the benefits of copper doping and a nanotubular structure to enhance light absorption, promote charge separation, and improve catalytic activity for pollutant degradation. This is the first time a Ti–O–Cu mixed nanotubular oxide photoanode has been synthesized and applied for simultaneous photoelectrocatalytic degradation and PMS activation to remove emerging contaminants. Given the limited understanding of PMS activation in photoelectrocatalytic systems, developing multifunctional materials such as the Ti–O–Cu mixed nanotubular oxide is crucial for advancing the removal of emerging contaminants through AOPs. The photoanode, comprising a Ti–O–Cu mixed nanotubular oxide prepared through electrochemical anodization of a Ti–Cu alloy, offers a highly stable oxide film with excellent surface area and electron transport properties.17
2. Experimental Section
2.1. Preparation of Ti–Cu Alloys and Characterization
Ti–5.5Cu (atom %) in atomic composition was prepared in an arc furnace under an inert atmosphere using 99.9% titanium (Ti-Brasil) and 99.9% copper (Alfa Aesar) as raw materials. During the preparation of the alloy, the lost mass was lower than 0.02 wt % in relation to the nominal composition. The ingot with 20 g was maintained at 1050 °C for 7200 min for homogenization and then cooled down to 1.0 °C min–1 in a vacuum furnace until it reached room temperature. After this, the ingot was chopped into a disk shape (∼2.0 cm diameter and ∼1.0 mm thickness), and the elemental composition was verified using an X-ray fluorescence spectrometer (XRF—BRUKER S8 Tiger). For microstructural analysis, discs were polished and etched with a mixed acid solution (1.5% HCl, 2.5% HNO3, and 1.0% HF in water). The morphological and compositional characterization of the sample was carried out using an optical microscope, Zeiss Axiolab 5, connected with a Cam Zeiss AxioCam ERc 5s, and scanning electron microscopy (SEM) JEOL-LV 6600 coupled with energy-dispersive X-ray spectroscopy (EDX). The crystalline phases of the alloys were determined by X-ray diffraction (XRD) using a Bruker D8 Advance AXS diffractometer, Cu Kα radiation, a Bragg–Brentano optical setup, and a Lynxeye detector. The angular range covered was 2θ = 10–90° with a step size of 0.02°. The Rietveld method was applied to XRD data to quantify the substrate phases (using TOPAS software).
2.2. Nanotube Array Electrode Preparation
The nanotubular oxide layer was produced by the electrochemical anodization of Ti–5.5Cu alloy discs in a two-electrode cell configuration. The cell included a platinum spiral as the counter electrode and an alloy disc as the working electrode. The electrolyte comprised 0.2 M HF in ethylene glycol with 3.5% (v/v) H2O. Anodization was carried out at 30 V for 120 min using a DC power supply. After anodization, the electrodes were rinsed with distilled water to remove residual electrolytes and soaked in ethanol for 24 h to remove the nanograss. Nanograss refers to a type of surface morphology characterized by the presence of very short and thin nanowires on top of the underlying nanotube structure. Finally, the electrode was annealed at 450 °C for 150 min in atmospheric air in a muffle furnace (EDG-F3000) to convert amorphous structures into crystalline phases. This electrode with the layer of a nanotubular mixed oxide of titanium and copper was named Ti–O–CuNT. Similarly, pure TiO2 oxide electrodes (TNT) were produced using grade 2 titanium sheets (∼99.7%, Realum, Brazil) under identical conditions.
2.3. Physical–Chemical and Photocharacterization
The morphology and elemental composition of Ti–O–CuNT were examined using field emission scanning electron microscopy (SEM-FEG, FEI Inspect F50) and energy-dispersive X-ray spectroscopy (EDX), respectively. High-resolution SEM images were taken at 200,000× with an acceleration voltage of 5.0 kV and a current of 1.0 × 10⁻⁸ A. Cross-sectional analysis for EDX was prepared via focused ion beam (FEI Helios G4 CX Dual Beam). The chemical states of the elements in the oxide layer were identified using X-ray photoelectron spectroscopy (XPS, K-alpha, Thermo Scientific) with a monochromatic Al Kα X-ray source (hν = 1486.6 eV) operating at 150 W under a pressure fixed to 4.8 × 10⁻⁹ mbar. The sample was irradiated for one hour in a typical setup with the X-ray source at 45° from the sample surface while the angle between the analyzer and the sample surface was 90°. Spectra were charge-corrected to the main line of the C 1s (aromatic carbon) set to 284.7 eV and deconvoluted by OriginPro software using linear background subtraction and fitted with a Gaussian function. The peak positions were determined with ±0.1 eV accuracy. Crystalline phases were determined using an X-ray diffractometer (XRD) (Bruker D8 ADVANCE) with Cu Kα radiation (λ = 1.5406 Å), a Ni filter, and a parallel beam optical setup. The patterns were obtained at room temperature, and the angular range covered was 2θ = 24–48° with a step size of 0.02°. Diffuse reflectance spectroscopy (DRS) spectra in the ultraviolet–visible region were recorded between 200 and 800 nm at ambient temperature using a spectrophotometer (UV-2600 Shimadzu) with an integrating sphere module for diffuse reflectance.
Photoelectrochemical characteristics of TNT and Ti–O–CuNT were evaluated using current versus potential curves in the presence and absence of irradiation. Linear scanning voltammograms were taken at −0.5 to 1.5 V vs Ag/AgCl (3 M KCl) in a 0.1 M Na2SO4 electrolyte at a scan rate of 20 mV s–1. The semiconductor electrode was irradiated by a 10 W UV LED (365 nm) positioned 5 mm from the external wall of the cell. A 50 mL highly transparent polystyrene cell was used to accommodate the working electrode (TNT or Ti–O–CuNT), counter electrode (stainless steel), and reference electrode (Ag/AgCl/KCl 3 M). An Ivium Vertex potentiostat was used for these measurements.
2.4. Activation of PMS in a Photoelectrocatalytic System
The mixed oxide electrode (Ti–O–CuNT) was applied in the photoelectrocatalytic degradation of the methylene blue (MB) dye solution by adding PMS (PEC/aPMS system). To determine the performance of the Ti–O–CuNT electrode in activating the PMS, a 5.0 mg L–1 solution (1.56 × 10⁻⁵ M) of methylene blue (MB) dye was used as a model contaminant containing a 0.1 M Na2SO4 electrolyte. The initial concentration of PMS in the reactor was 0.468 mM, which refers to 30 times the MB molar concentration (0.1 mL of a PMS stock solution of 0.117 M was added to the cell). The PEC cell was a highly transparent polystyrene flask (50 mL) filled with 25.0 mL of the work solution.
The electrochemical setup featured a photoanode as the working electrode, comprising either Ti–O–CuNT or TNT (0.283 cm2), a stainless-steel counter electrode (2.0 × 2.0 cm), and a Ag/AgCl reference electrode immersed in a KCl solution (3 M). The measurements were conducted using an Ivium Vertex potentiostat. A 10 W UV LED, emitting at a maximum wavelength of 365 nm (below TiO2’s common band gap of 390 nm), was positioned 5 mm from the external wall of the cell to illuminate the photoanode, situated close to this wall. Continuous agitation was maintained at 500 rpm throughout the experiments, and 2 mL of the solution was periodically collected from the reactor at 2, 5, 10, 20, and 30 min intervals. The collected samples were subsequently assessed for decolorization of the methylene blue (MB) dye using a UV/vis absorption spectrophotometer, specifically at 664 nm (Shimadzu UV 1800-PC). Following each measurement, collected aliquots were reintroduced into the cell. Every degradation experiment was conducted at least in duplicate, ensuring the reliability and consistency of our results.
2.5. Experimental Design
A full factorial design (FFED) with three independent variables (pH, applied potential, and PMS concentration) was applied for the optimization of MB degradation solution by the PEC/aPMS process using the response surface methodology18 (see Table 1). Assays corresponding to the upper and lower values of the independent variables were conducted in duplicate. In contrast, a central point test was additionally performed in triplicate to evaluate the pure error of the MB degradation experiments. The independent variables, namely, solution pH, applied potential (Eapp), and PMS concentration, were explored in the ranges of 4.00–8.00, 0.5–1.5 V (vs Ag/AgCl), and 0.156–0.780 mmol L–1, respectively. Subsequently, three levels for each ith independent variable (i.e., −1, 0, +1) were chosen and coded according to eq 1
| 1 |
where xi is the coded level, Xi is the real value, Xi0 is its real value in the central point, and ΔXi is half of the difference between the upper and lower values of the ith independent variables. Table 1 presents the coded and real values for the three independent variables. Decolorization efficiency (DE/%) was chosen as a response and correlated with the coded values of the variables to generate a general first-order polynomial eq 2 by using the least-squares method18−20
| 2 |
where Y is the observed response (i.e., DE/%), β0 is a constant coefficient, βi is the linear effect, and βij is the interaction effect between the independent variables, respectively. The terms k and ε are the number of independent variables and the random error, respectively. The generated polynomial equation was then used to construct response surfaces (with StatSoft Statistica version 10 software) to determine the optimal conditions for MB degradation. All degradation assays were randomly conducted to minimize systematic errors in the decolorization efficiencies.
Table 1. Experimental Design Matrix with Response Values for MB Decolorization by Photoelectrocatalysis with Activated PMS (PEC/aPMS) Using a Ti–O–CuNT Photoanodea.
| run | coded
levels |
real
valuesb |
observed response | ||||
|---|---|---|---|---|---|---|---|
| X1 | X2 | X3 | X1a | X2b | X3c | DE/% | |
| 1 | –1 | –1 | –1 | 4.00 | 0.5 | 0.156 | 86.6 |
| 2 | –1 | –1 | –1 | 4.00 | 0.5 | 0.156 | 83.3 |
| 3 | 1 | –1 | –1 | 8.00 | 0.5 | 0.156 | 28.9 |
| 4 | 1 | –1 | –1 | 8.00 | 0.5 | 0.156 | 35.1 |
| 5 | –1 | 1 | –1 | 4.00 | 1.5 | 0.156 | 63.9 |
| 6 | –1 | 1 | –1 | 4.00 | 1.5 | 0.156 | 57.7 |
| 7 | 1 | 1 | –1 | 8.00 | 1.5 | 0.156 | 32.8 |
| 8 | 1 | 1 | –1 | 8.00 | 1.5 | 0.156 | 34.7 |
| 9 | –1 | –1 | 1 | 4.00 | 0.5 | 0.780 | 90.4 |
| 10 | –1 | –1 | 1 | 4.00 | 0.5 | 0.780 | 88.1 |
| 11 | 1 | –1 | 1 | 8.00 | 0.5 | 0.780 | 55.9 |
| 12 | 1 | –1 | 1 | 8.00 | 0.5 | 0.780 | 52.5 |
| 13 | –1 | 1 | 1 | 4.00 | 1.5 | 0.780 | 80.4 |
| 14 | –1 | 1 | 1 | 4.00 | 1.5 | 0.780 | 76.2 |
| 15 | 1 | 1 | 1 | 8.00 | 1.5 | 0.780 | 46.3 |
| 16 | 1 | 1 | 1 | 8.00 | 1.5 | 0.780 | 47.4 |
| 17 | 0 | 0 | 0 | 6.00 | 1.0 | 0.468 | 58.1 |
| 18 | 0 | 0 | 0 | 6.00 | 1.0 | 0.468 | 64.2 |
| 19 | 0 | 0 | 0 | 6.00 | 1.0 | 0.468 | 57.7 |
Conditions: 25 mL of MB 5 mg L–1 in Na2SO4 0.1 M; irradiation by a 10 W UV LED at 365 nm.
Real values: X1a = pH, X2b = Eapp (V vs Ag/AgCl), and X3c = PMS concentration (mmol L–1).
In cases involving the addition of PMS, a volume of a 0.04 M PMS stock solution prepared in ultrapure water was introduced into the cell to achieve the final concentrations, as detailed in Table 1.
After the conditions for degrading the MB solution were optimized, experiments were conducted to compare various treatments and assess the contribution of each factor to PMS activation. These treatments included direct oxidation by PMS, PMS + UV radiation, PMS + electrocatalysis, PMS + photocatalysis, photocatalysis alone, photolysis, and pure catalysis (free electrode in the presence of PMS).
2.6. Mechanism of Generation of Reactive Species
The contribution of reactive species •OH, SO4•–, and 1O2 was investigated through quenching experiments using the appropriate scavengers. Methyl alcohol (MeOH), tert-butyl alcohol (TBA), and sodium azide (SA) were employed as quenchers for •OH/SO4•–, •OH, and 1O2, respectively.21,22 In a typical degradation experiment outlined in Section 2.4, a 50× quantity (molar ratio) of each scavenger was added to the PEC/aPMS system relative to the concentration of PMS in 25 mL of the working solution. The decolorization of the MB solution was monitored by using the same approach described in the previous sections.
2.7. Degradation of Different Organic Contaminants
The capacity of the PEC/aPMS system was assessed by degrading three distinct contaminants: methylene blue (MB), tetracycline (TC), and ibuprofen (IBP). In each case, 25 mL of a 10 mg L–1 total organic carbon (TOC) solution (in 0.1 M Na2SO4) was introduced into the degradation cell. This concentration of contaminants is equivalent to 16.6 mg L–1 MB, 17 mg L–1 TC, and 13.9 mg L–1 IBP. A volume of PMS stock solution was added to achieve a final molar concentration 50 times that of the contaminant. Subsequently, simultaneous application of UV light at 365 nm and an electrochemical potential of +0.5 V vs Ag/AgCl was initiated.
The degradation progress of MB and TC was monitored using molecular absorption spectrophotometry at 664 and 356 nm, respectively. Samples were withdrawn at predetermined intervals, promptly analyzed, and returned to the reactor. IBP degradation was assessed using high-performance liquid chromatography (HPLC Ultimate 3000 SD, ThermoFisher) with a diode array detector at λ = 190 nm. In this case, 0.5 mL aliquots were withdrawn at predetermined intervals and combined with 50 μL of a 0.4 M sodium azide solution, acting as a quencher for singlet oxygen. Separation was achieved on a Restek C18 column (5 μm, 150 × 4.6 mm), and the mobile phase consisted of acetonitrile (70%) and 0.1 M acetic acid (30%) eluted in isocratic mode at a flow rate of 1 mL min–1. The retention time for the IBF was 3.59 min.
Moreover, the TOC (total organic carbon) concentration of the initial and final aliquots (60 min) was assessed to evaluate mineralization (TOC-LCSH, Shimadzu). Two samples were taken for the 60 min aliquot: one sample was analyzed without quenching, and the other was quenched with sodium azide (NaN3).
3. Results and Discussion
3.1. Metallography and Quantification of Substrate Phases
The stoichiometric composition of the Ti–5.5Cu alloy substrate was measured by XRF, and the values in mass percentage were 92.82% and 7.18%, which correspond to 94.49 (±0.01) and 5.51 (±0.01) in atomic percentage for Ti and Cu, respectively. The measured and expected values of the Ti and Cu contents are in excellent agreement, indicating that the casting procedures were appropriate.
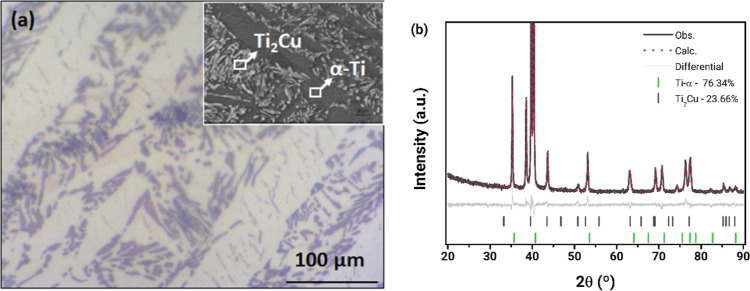
Figure 1a shows an optical micrograph and inset scanning electron microscopy image obtained from the Ti–5.5Cu (at. %) substrate. The optical image exhibits two different fields, corresponding to a lenticular region separated by darker fields and the opposite color on the electron image. From EDX analysis, the lenticular region was associated with the primary α-Ti (1—dark phase), and Ti2Cu was related to the precipitate (2—white phase), as predicted by the Ti–Cu phase diagram for this composition.23
Figure 1.
Characterization of the Ti–5.5Cu (% at.) substrate. (a) Optical microscopy image and scanning electron micrograph of the annealed substrate microstructure in detail. (b) X-ray diffractometry pattern and phase quantification obtained from Rietveld refinement.
The X-ray diffraction measurement was carried out to corroborate the phases identified by EDX analysis for Ti–5.5Cu (at. %). The data were compared with the standard XRD patterns, and Rietveld refinement (Figure 1b) was used to determine the quantification of phases that comprise the substrate. Rietveld refinements of the XRD data showed two phases, indicating that Ti-α (P63/mmc) was a majority phase of Ti–5.5Cu (at. %) (∼76.4%) with the minor phase of Ti2Cu (I4/mmm) (∼23.7%), in an approximate 3:1 ratio composition. The refinement parameters obtained were as follows: residual profile (Rp = 4.14), expected residual (Rexp = 4.03), weighted residual (Rwp = 5.40), and goodness of fit (X2 = 1.34). The Ti-α and Ti2Cu phases are equilibrium phases in the Ti–Cu system. However, only Ti-α can dissolve copper below the solubility limit in the Ti–Cu system (≤1.6 at. % Cu), forming a solid solution.23 All analyses carried out on the Ti–5.5Cu (at. %) substrate suggest the composition α-Ti as the predominant phase, α-Ti doped with copper and Ti2Cu precipitate.24
3.2. Characteristics of TNT and Ti–O–CuNT Electrodes
3.2.1. Morphological and Crystallographic Characterization
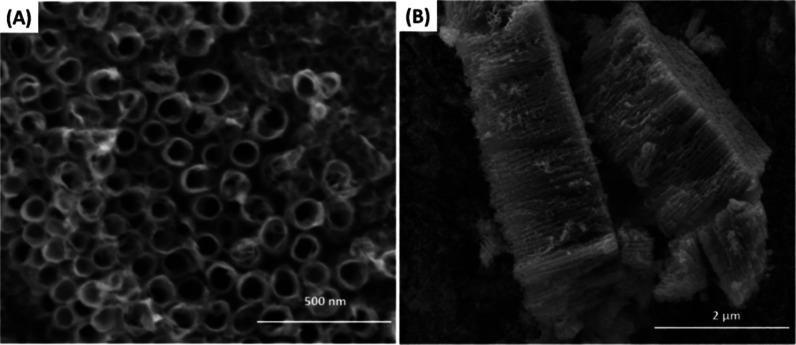
Electrochemical anodization of the Ti–5.5Cu (atom %) alloy followed by annealing at 450 °C produced well-ordered Ti–O–Cu mixed oxide nanotubes as observed by SEM (Figure 2). The uniform nanotube morphology with an inner diameter of ∼70 nm, wall thickness of 12 nm, and length of 2 μm provides a high surface area, beneficial for enhanced mass transport and light absorption in photoelectrocatalysis.
Figure 2.
Scanning electron microscopy (SEM) images of the Ti–O–Cu nanotubular oxide film (Ti–O–CuNT) grown on a Ti–5.5Cu (at. %) alloy substrate by electrochemical anodization and annealed at 450 °C. (A) Top view showing the nanotube structure. (B) Cross-section illustrating the film thickness and nanotube architecture.
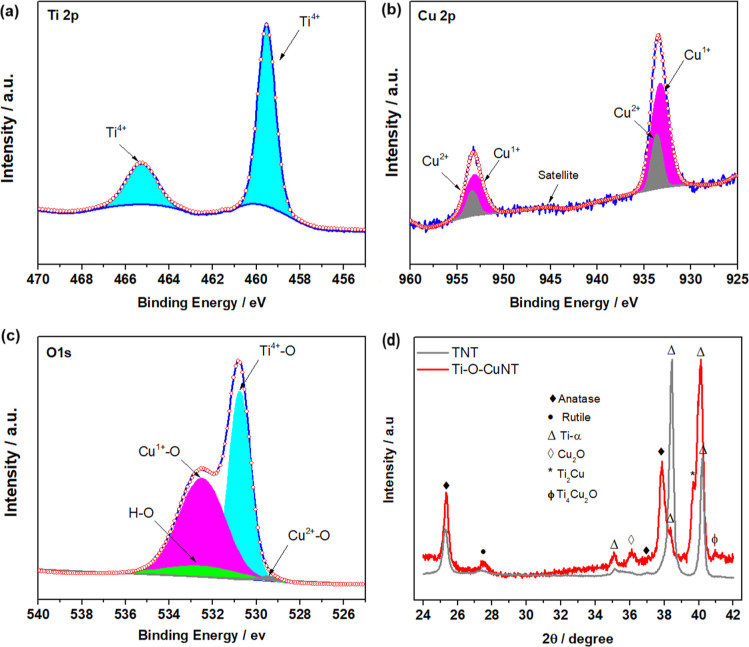
XPS analysis confirmed the presence and chemical states of Ti, Cu, and O on the film surface (Figure 3). The Ti, Cu, and O species were confirmed on the film surface by the peaks in the Ti 2p, Cu 2p, and O 1s binding energy regions, respectively (Figure 3a–c). For Ti 2p spectra (Figure 3a), the peaks at 459.5 eV (Ti 2p3/2) and 465.3 eV (Ti 2p1/2) correspond to the Ti4+ and its doublet, respectively, separated by 5.8 eV. However, these peaks shifted by 1.0 eV when compared with the reference standard,25 indicating the presence of impurity dopants in the TiO2 lattice.
Figure 3.
Analysis of layer composition and crystalline structures of Ti–O–CuNT annealed at 450 °C: (a–c) XPS spectrum of Ti 2p, Cu 2p, and O 1s and (d) XRD profiles of Ti–O–CuNT compared with TNT.
The Cu 2p spectra showed signatures of Cu1+ and Cu2+ (Figure 3b), which are assigned with Cu 2p3/2 and Cu 2p1/2, respectively, derived from copper oxide. The deconvolution of this spectrum revealed that the material is composed of a mix of valences between Cu1+ (933.1/933.6 eV) and Cu2+ (953.0/953.3 eV),25 where the Cu+ species was predominant on the composition in relation to Cu2+. Despite the detected Cu 2p1/2 peak and its respective doublet Cu 2p3/2 from Cu2+, the shakeup satellite characteristic of this species was absent. The absence of shakeup satellite peaks in the Cu2+ spectrum may be associated with a high density of oxygen vacancies in the oxide composition.26
The O 1s binding energy region of Ti–O–CuNT is shown in Figure 3c, which is fitted with four peaks after deconvolution. The peaks at binding energies 530.7, 532.5, and 529.4 eV are attributed to the oxygen atoms bound to Ti4+, Cu1+, and Cu2+ species, respectively.27 Meanwhile, the peak of 532.6 eV can be ascribed to oxygen bound to H due to the interaction of the sample with the atmospheric air.28 Furthermore, a shift of peaks at ∼0.9 eV was observed, which may indicate a TiO2 doping process and/or the formation of a mixed valence oxide between Ti–O–Cu.29,30
From the diffraction data obtained for Ti–O–CuNT, crystalline phases of TiO2 (anatase and rutile), Cu2O, and nonstoichiometric Ti4Cu2O were obtained, with the anatase phase being the predominant. The anatase is the most photoactive and desirable TiO2 phase in photoelectrocatalytic applications due to its lower charge recombination rate and greater charge carrier mobility.31 Also, XRD data revealed only the incidence of Cu1+, whereas the peak of Cu2+ was suppressed, which may be due to its lower concentration on the composition of the film grown on Ti–5.5Cu (at. %). This result was similar to XPS data, indicating a higher concentration of Cu1+ than Cu2+.
3.2.2. Photoelectrochemical Characterization
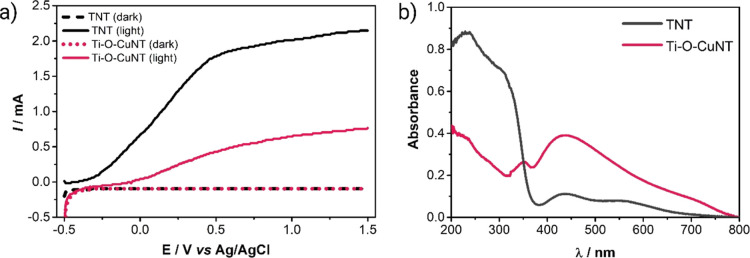
Linear scanning voltammograms of the TNT and Ti–O–CuNT electrodes, in the dark and under irradiation (10 W UV 365 nm LED) (photocurrent), are shown in Figure 4a. At both electrodes, an approximately zero anodic current is displayed without irradiation, as expected for an n-type semiconductor. However, when the TNT electrode is irradiated, the current increases linearly from −0.25 to +0.5 V (vs Ag/AgCl), reaching about 1.8 mA and becoming approximately constant. The Ti–O–CuNT electrode showed a significantly lower photocurrent than the electrode without copper doping. This behavior can be explained by the absorptivity of the materials in the ultraviolet region, as shown in Figure 4b (obtained by diffuse reflectance spectroscopy). The absorption spectrum of the TNT sample clearly shows that its absorbance is much higher than that of Ti–O–CuNT in the region from 200 to 350 nm.
Figure 4.
(a) Linear scan voltammograms for TNT and Ti–O–CuNT electrodes under irradiation and in the dark. Conditions: 0.1 M Na2SO4 electrolyte; scan rate of 20 mV s–1; radiation from a 10 W UV 365 nm LED. (b) Absorption spectra obtained by diffuse reflectance spectroscopy for UV and visible regions for TNT and Ti–O–CuNT samples.
3.3. Simultaneous Photoelectrocatalytic Oxidation and PMS Activation by the Ti–O–CuNT Electrode
3.3.1. Experimental Design for Optimization of PEC MB Degradation Conditions
Initially, it was found that the Ti–O–Cu mixed oxide electrode can activate PMS in a photoelectrocatalytic system (Figure 5). In the absence of PMS, there was a photoelectrocatalytic decolorization of 19% in 30 min, while in the presence of PMS, it reached 56%. Then, the degradation conditions were optimized through a 23 FFED using the independent variables, and their ranges are shown in Table 1. The pH range (i.e., from 4.00 to 8.00) was chosen because it is closer to neutral pH and fits most wastewater available for treatment. In addition, the SO4•– radical has a wide operational pH range, so it is possible to use the AOPs in a range of 3.0 to 9.0.32 The potential range (0.5 to 1.5 V vs Ag/AgCl) refers to the lowest potential capable of generating maximum photocurrent values (see Figure 4a), while the potential of 1.5 V is the threshold value, above which the stability of the mixed oxide is affected. The concentration of PMS, the reactive species precursor, was selected within a range (0.156 to 0.780 mM) commonly used in related studies.33 These concentrations are equivalent to 10, 30, and 50 times the molar concentration of the contaminant (MB dye).
Figure 5.
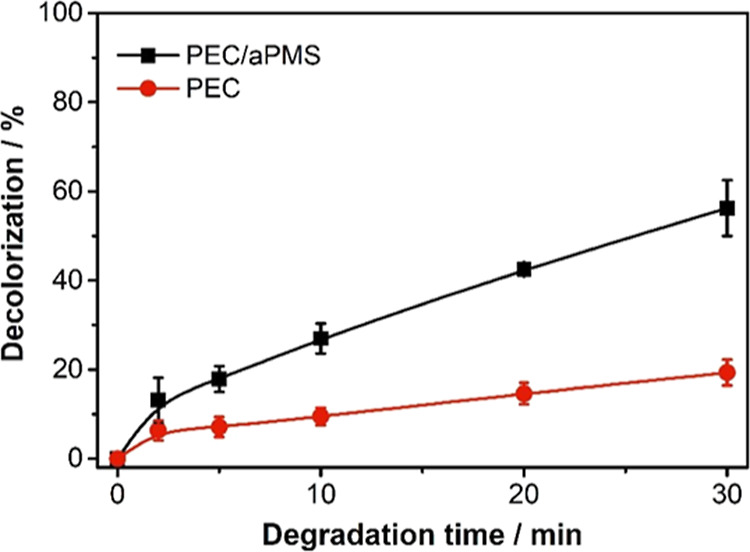
Decolorization of a 5 mg L–1 MB solution by photoelectrocatalysis (PEC) and photoelectrocatalysis with activated PMS (PEC/aPMS) using a Ti–O–CuNT photoanode. Conditions: 25 mL of MB 5 mg L–1 in Na2SO4 0.1 M; [PMS] = 0.468 mM; pH 6.5; 1.5 V vs Ag/AgCl potential; constant agitation of 1000 rpm; irradiation by a 10 W UV LED at 365 nm; spectrophotometric analysis at 664 nm.
Using the least-squares method, a first-order polynomial model (eq 2) was constructed from the data of runs 1–19. The resulting model (eq 3) for decolorization efficiency is
| 3 |
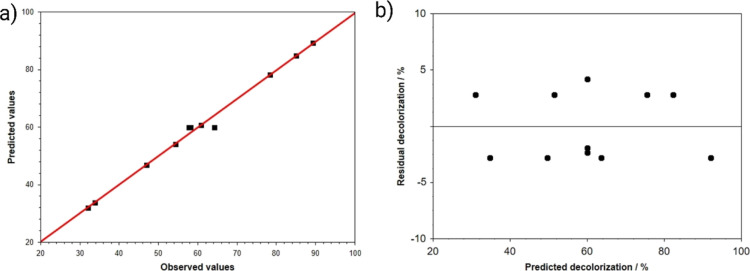
Only the statistically significant terms (at a 95% confidence level) were included in eq 3, where X1, X2, and X3 represent the coded variables for pH, applied potential, and PMS concentration, respectively. Polynomial eq 3 was statistically evaluated using the analysis of variance (ANOVA) comparing the variation sources with the F-test (i.e., the Fisher distribution), which allows finding the polynomial with the best fit to the experimental data.34Figure 6a depicts a good correlation between the predicted and observed values with an R2 value equal to 0.962, whereas Figure 6b confirms the absence of systematic errors attributed to the random distribution of the residuals around the zero deviation. Therefore, these statistical results indicate that the model is statistically significant (at a 95% confidence level) (see also Table S1).18
Figure 6.
(a) Predicted–observed and (b) residual–predicted plots determined for the decolorization of a 5 mg L–1 of MB solution in 0.10 mol L–1 Na2SO4 with a Ti–O–CuNT anode irradiated by a 10 W UV LED at 365 nm in the presence of PMS (PEC/aPMS system).
Analyzing polynomial eq 3, it is observed that the pH value, applied potential, and PMS concentration significantly influenced the decolorization efficiency. Equation 3 also shows that the decrease in pH causes a higher decolorization efficiency, indicated by the highly negative value of the coded variable X1, which is the most significant variable. This effect is attributed to the electrostatic interaction between the surface charges of the Ti–O–CuNT electrode and the ionic form of PMS (HSO5–). The point of zero charge of TiO2 is known to be found at pH 5.9.35 Therefore, at pH 4.0, the electrode surface is positively charged, and PMS exists as an anion (HSO5–/SO52– with pKa = 9.4).32 Consequently, more PMS is adsorbed on the electrode surface, increasing the formation of the PMS–Ti–O–Cu complex and facilitating the PMS catalysis cycle with the copper catalytic sites. Regarding the concentration of PMS, there is a positive effect on the response when its concentration is increased as this implies a greater generation of reactive species that act directly on the degradation of the MB dye.
Therefore, considering the negative effect of pH on the decolorization, added to the fact that the interactions between the investigated variables were not statistically significant, only the response surface for decolorization as a function of applied potential and PMS concentration was investigated, setting the coded variable X1 at the lowest level (i.e., at pH 4.0), as previously justified. Figure 7 shows the response surface related to DE (in %) as a function of the applied potential and PMS concentration. As can be seen, the increase in PMS concentration causes a higher DE for all applied potential values, with a maximum decolorization efficiency of about 94% after 30 min of PEC/aPMS treatment of MB solution for a higher PMS concentration (which is 50 times the molar concentration of the dye) and lower applied potential. Furthermore, eq 3 and the response surface show that DE increased linearly with the increase in the PMS concentration and the decrease in the applied potential in the investigated intervals.
Figure 7.
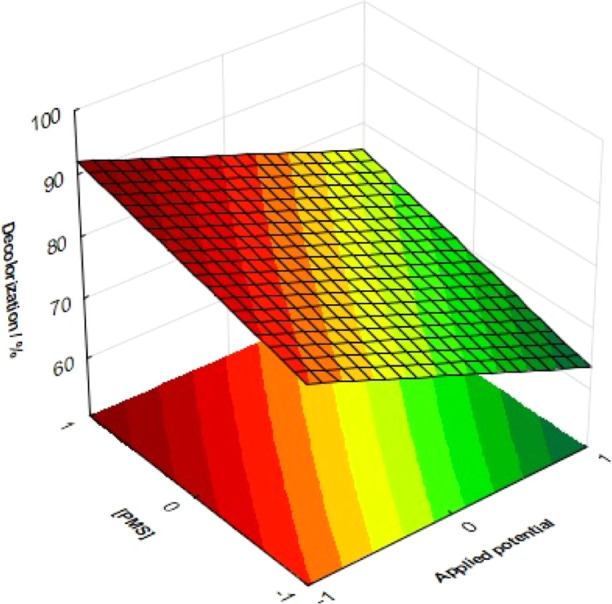
Response surface generated from a full factorial design expressing the decolorization efficiency as a function of PMS concentration and applied potential after 30 min of PEC/aPMS treatment. Conditions: 25 mL of 5.0 mg L–1 of MB solution in 0.1 M Na2SO4 with a Ti–O–CuNT anode, potential of 0.5 V vs Ag/AgCl, irradiated by a 10 W UV LED at 365 nm. Independent variable pH solution was set at coded level −1 (i.e., at pH 4.0).
As is already known, irradiating the TiO2 and other semiconductors with photons of appropriate energy generates electron–hole pairs. Using a photoelectrocatalytic system, with the application of a potential difference, accelerates the transfer of electrons from the semiconductor to the counter electrode, reducing the recombination of charges in relation to a purely photocatalytic (PC) system.17 A lower potential level (0.5 V vs Ag/AgCl) was observed to contribute positively to more significant MB degradation. As observed in the photocurrent curve (Figure 4a), this potential can produce practically the maximum photocurrent and favors the activation of the PMS. This behavior can be attributed to the fact that more positive potentials can have a negative effect on the copper oxidation state cycle responsible for PMS catalysis. For PMS conversion, the catalyst (copper centers) must transfer an electron to the PMS that is adsorbed on the catalyst surface. Thus, with this electronic transfer, the oxidation of Cu(I) centers to Cu(II) or Cu(III) occurs. Photogenerated electrons may be able to reduce the Cu(II) or Cu(III) centers again to Cu(I) for the renewal of the catalysis cycle. Thus, higher potentials, such as 1.5 V, may disfavor this reduction process due to the high positive potential and the depletion of photogenerated electrons from the photoanode. This behavior corroborates what is observed in eq 3 (see the negative coefficient in the variable X2 for the applied potential) and the response surface generated from this polynomial equation.
These findings identify the optimal conditions for the independent variables—pH, applied potential, and PMS concentration—within the studied range, determined as pH 4.0, an applied potential of 0.5 V vs Ag/AgCl, and a PMS concentration of 0.780 mmol L–1 (equivalent to 50 times the MB concentration) for effective PEC/aPMS treatment of the MB solution.
3.3.2. Comparison between Various Treatment Combinations
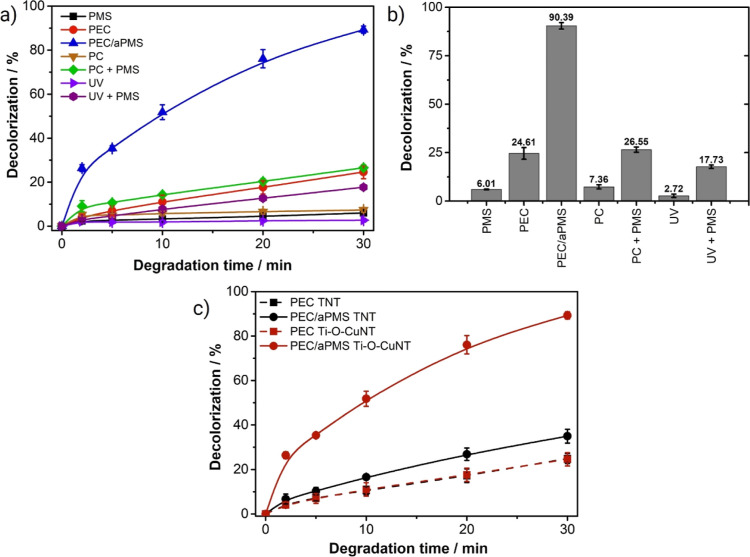
After the optimization of some conditions of PEC/aPMS treatment (pH 4, potential 0.5 V vs Ag/AgCl, and [PMS] = 0.780 mM), several different combinations and isolated systems were evaluated for comparison purposes (Figure 8a,b). For each electrode use, a “regeneration” step was performed by cyclic voltammetry in a 0.1 M Na2SO4 solution (50 cycles) under UV irradiation, ensuring good repeatability. No decrease in the material efficiency was observed.
Figure 8.
(a) Comparison of decolorization of MB dye solution by different systems. Common conditions: 25 mL of 5 mg L–1 MB in 0.1 M Na2SO4 at pH 4, under constant stirring. The independent conditions were as follows: Ti–O–CuNT electrode, [PMS] = 0.780 mM, potential of 0.5 V vs Ag/AgCl, 10 W UV LED irradiation at 365 nm; (b) % of decolorization in 30 min of treatment by the different evaluated systems. (c) Comparison of decolorization of MB dye solution by PEC (■) and PEC/aPMS (●) with Ti–O–CuNT (red) and TNT (black) electrodes.
Direct oxidation by PMS resulted in only 6% decolorization of the MB solution at 30 min due to the direct redox reaction (E0 = 1.85 V).36 The photolysis of the dye is negligible, obtaining a decolorization of only 3%, showing that the dye is relatively stable under 365 nm UV irradiation. Combining irradiation with PMS (photolysis + PMS) resulted in a decolorization of 17%, indicating that UV light allowed an increase of 9%. This may be attributed to the activation of PMS by radiation (HSO5– + hν → HO• + SO4•–), which generated additional reactive species, albeit at a negligible scale.37
The photocatalytic (PC) decolorization using Ti–O–CuNT and light was only 7%, but it improved to 27% with the addition of PMS due to generating additional reactive species. The photoelectrocatalysis (PEC) treatment showed a decolorization of 25% because of the more effective charge separation compared to PC. However, adding PMS to the PEC system resulted in a substantial improvement of 90% in decolorization, revealing a synergistic effect. This significant increase in decolorization efficiency is attributed to the formation of additional reactive species, including radicals (•OH, SO4•–, and/or O2•–), PMS activated at the surface, or singlet oxygen (1O2). These mechanistic details will be discussed later.
Finally, it was verified whether the copper in the mixed Ti–O–CuNT electrode was responsible for activating the PMS. For this, the PEC/aPMS and PEC systems were investigated using the TNT and Ti–O–CuNT electrodes (Figure 8c). It was found that PEC treatment resulted in 25% decolorization with both electrodes. In PEC/aPMS with the copper-free electrode (TNT), a decolorization of 35% was obtained. Thus, adding PMS resulted in a 10% increase, which can be attributed to the activation of PMS by light but not necessarily due to the conversion of PMS by TiO2-based PEC. It is only in the PEC/aPMS system with the Ti–O–CuNT electrode that a significant efficiency improvement is observed (to 90.4%), proving that the mixed oxide (Cu2Ti4O and Cu2O, Figure 3) acts directly in PMS catalysis. These results also confirm no activation of PMS by the stainless-steel cathode, as reported by other works using platinum cathodes.11
3.4. Mechanism of Generation of Reactive Species
Using scavengers of free radicals and other reactive species is essential for studying their actions in advanced oxidation systems.38 Methanol (MeOH) interacts similarly with sulfate radicals (SO4•–) and hydroxyl radicals (•OH), having rate constants of 9.7 × 10⁸ M–1 s–1 and 1.0 × 10⁷ M–1 s–1, respectively; hence, its use suggests the involvement of radical reactions when MB degradation is inhibited.21 Conversely, tert-butyl alcohol (TBA) predominantly scavenges •OH due to its significantly higher rate constant with •OH (3.8–7.6 × 10⁸ M–1 s–1) compared to SO4•– (4.0–9.1 × 10⁵ M–1 s–1).21 Sodium azide (SA) serves as a quencher of singlet oxygen (1O2) as it can promote the nonradiative decay back to its ground state.22
As shown in Figure 9, under optimized conditions, the PEC/aPMS system achieves a 90.4% degradation efficiency after 30 min without any scavengers. However, decolorization decreased to 37.7%, 37.1%, and 11.7% after adding MeOH, TBA, and SA, respectively. Thus, the main route of formation of reactive species via PMS activation by the Ti–O–CuNT electrode can be ascribed to the formation of the 1O2. In addition, there is a contribution of photoelectrocatalytically generated •OH, but no SO4•– was formed by PMS activation.
Figure 9.
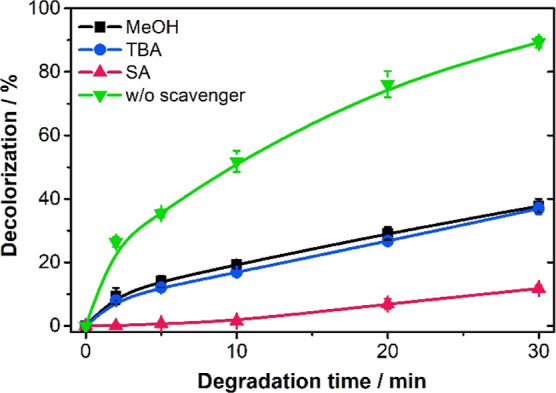
Influence of scavengers on the decolorization of MB dye solution by the PEC/aPMS system using sodium azide (SA), methyl alcohol (MeOH), and tert-butyl alcohol (TBA) in the proportion of 50 × [PMS] = 0.4 M. Conditions: 25 mL MB 5 mg L–1 in Na2SO4 0.1 M; 0.5 V; [PMS] of 0.780 mM; pH 4; constant agitation; irradiation by a 10 W UV LED at 365 nm.
Considering pseudo-first-order kinetics for all curves is shown in Figure S1, the rate constants, k, were calculated and are shown in Table 2. From these data, the contributions of the radical and nonradical pathways to the MB decolorization by PEC/aPMS were calculated using eqs 4 and 5(9)
| 4 |
| 5 |
where Rradical and Rnonradical represent the estimated contribution rates calculated for the radical and nonradical mechanisms, respectively, kMeOH is the rate constant in the presence of the scavenger MeOH, and ktotal refers to the constant in the absence of scavengers.
Table 2. Rate Constants (k) Obtained by ln[abs/abs0] vs Time for the Degradation of 25 mL of 5 mg L–1 MB in Na2SO4 0.1 M Using PEC/aPMS in the Absence and Presence of Different Scavengers.
| quencher | captured species | k (min–1) | R2 | contribution (%) |
|---|---|---|---|---|
| 0.0755 | 0.994 | |||
| MeOH | SO4•– e HO• | 0.0139 | 0.971 | 18.4 |
| TBA | HO• | 0.0136 | 0.979 | 18.0 |
| sodium azide | 1O2 | 0.0039 | 0.939 | 81.6 |
As the contribution percentages of MeOH and TBA scavengers were very close (about 18%), there were no captured SO4•– radicals but only •OH (generated by photoelectrocatalysis on TiO2). Then, the contribution of the nonradical species (1O2) was 81.6%. Therefore, the most significant contribution of decolorization is due to the nonradical pathway. However, at this moment, it is impossible to state that other species are not being generated, such as the surface-activated PMS route.39,40
Activation of peroxymonosulfate (PMS) through both radical and nonradical pathways results in significant differences. The nonradical oxidation reactions have a significant advantage as they are not impacted by pH, are resistant to inorganic ions and organic matter found in wastewater, reduce the formation of toxic byproducts (such as chloride and bromide), and increase the efficiency of PMS consumption.33
This evidence suggests a possible PMS
activation mechanism by copper
in the PEC/aPMS system. In the 1O2 activation
pathway, SO5•/O2•– radicals are generally considered precursor intermediates. Moreover,
these species can be produced by copper oxide. X-ray photoelectron
spectroscopy (XPS) of the Ti–O–CuNT sample showed that
the copper is mainly in the Cu(I) oxidation state and, to a lesser
extent, Cu(II). The first step of PMS activation (HSO5–) involves the formation of a high-valence oxidation
state, Cu(III) (eq 6).40,41 Then, Cu(III) (in the form of the complex [≡Cu(III)–O–H])
reacts with PMS (HO–O–SO3–), forming the metastable complex [≡Cu(III)–O–O–SO3] (eq 7). Then,
there is an electron transfer from the PMS (a ligand) to the metal,
producing O2•– (eq 8).40 Subsequently,
O2•– is oxidized by Cu(III) sites,
generating 1O2 (eqs 9 and 10), which is thermodynamically
possible (E0Cu(III)/Cu(II) =
2.3 V vs  0.79 V).41 Another
possible reaction to generate 1O2 occurs by
recombining two O2•– (eq 11).40 Finally, 1O2 acts directly on the
MB decolorization.
| 6 |
| 7 |
| 8 |
| 9 |
| 10 |
| 11 |
Additional 1O2 production route is from SO5•–. This can happen through direct one-electron oxidation of PMS by both Cu(III) and Cu(II) (eqs 12 and 13). Thus, the recombination of two SO5•– radicals occurs, forming 1O2 (eq 14). Furthermore, the combination of SO5•– and SO4•– radicals can also occur to generate 1O2 (eq 15).40
| 12 |
| 13 |
| 14 |
| 15 |
Although it is not entirely possible to rule out the activation of PMS through radical pathways due to the occurrence of multiple simultaneous reactions, the evidence obtained from experiments using scavengers suggests that the radical component of the PEC/aPMS system primarily stems from the photoelectrocatalytic process. In this process, the photogenerated holes oxidize water molecules and create radicals •OH. Therefore, Figure 10 illustrates the proposed mechanism for generating reactive species in the PEC/aPMS system.
Figure 10.
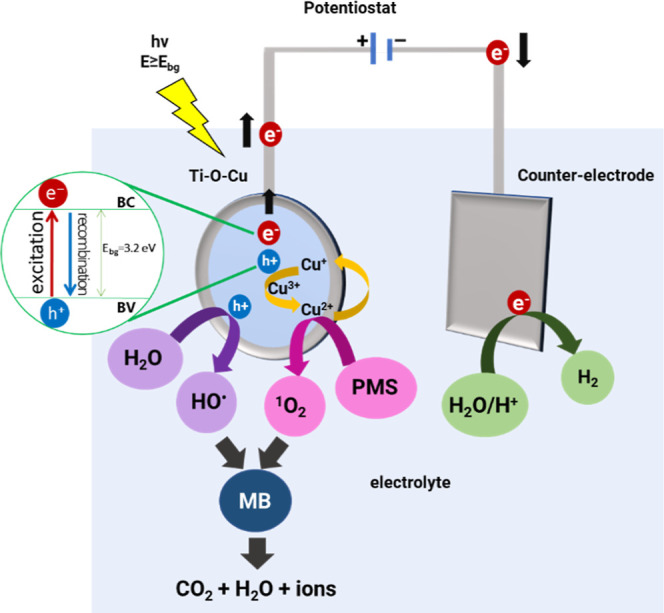
Proposed mechanism for generating reactive species in the photoelectrocatalytic system with the Ti–O–CuNT electrode in the presence of PMS (PEC/aPMS) during the degradation of methylene blue (MB) dye under irradiation. The mechanism was based on the results of experiments with different scavengers, and the detailed chemical reactions are presented in eqs 6–15.
3.5. Degradation of the Drugs Ibuprofen and Tetracycline for Proof of Concept
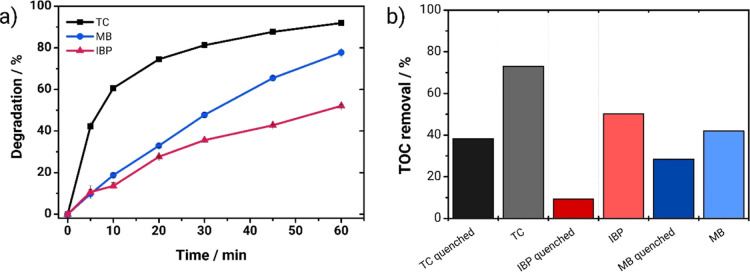
To demonstrate the broad applicability of the PEC/aPMS system, we evaluated its effectiveness against tetracycline (TC) and ibuprofen (IBP) alongside methylene blue (MB) (all 10 mg L–1 total organic carbon (TOC) solution in 0.1 M Na2SO4). As shown in Figure 11a, the system achieved significant degradation for all contaminants within 60 min, reaching 78, 52, and 92% for MB, IBP, and TC, respectively. These results highlight the system’s ability to degrade structurally diverse organic pollutants.
Figure 11.
(a) Degradation (%) vs treatment time and (b) removal of total organic carbon (TOC) at 60 min for the treatment of different contaminants by the PEC/aPMS system: tetracycline (TC), methylene blue (MB), and ibuprofen (IBP), all 10 mg L–1 in total organic carbon in 0.1 M Na2SO4. Conditions: [PMS] = 50 × [contaminant]; pH 4; constant agitation; irradiation by a 10 W UV LED at 365 nm. TOC samples were also quenched using sodium azide to stop reactions with reactive species.
Finally, we tested that the PEC/aPMS system can activate PMS and significantly increase the photoelectrocatalytic system’s efficiency with two other model contaminants: tetracycline and ibuprofen. Figure 11a illustrates the percentage degradation over a 60 min treatment period, while Figure 11b depicts the mineralization at the end of this duration. The photoelectrocatalytic system can degrade all the contaminants, which have very different chemical structures, reaching 78, 52, and 92% degradation for MB, IBP, and TC, respectively. On the other hand, TOC measurements showed an interesting behavior: when we quenched the 60 min sample with sodium azide, the mineralization was 28, 9, and 39% for MB, IBP, and TC, respectively. However, another sample that was not quenched was also measured, reaching 42, 50, and 73%, respectively. This result further confirms the nonradical mechanism, which has slower kinetics. This result confirms that singlet oxygen is generated since the surface-activated PMS route cannot occur without the catalyst material. Singlet oxygen is less efficient than radicals (such as sulfate/hydroxyl) in completely oxidizing contaminants. While less efficient than radicals in complete oxidation, singlet oxygen offers advantages like resistance to common wastewater contaminants and reduced formation of harmful byproducts.40
To further evaluate the performance of the Ti–O–CuNT electrode in the PEC/aPMS system, we conducted a comparison to recently published studies using similar materials (Table 3). Our system utilized contaminant concentrations that were even higher than those in other comparable studies, along with a less powerful, cost-effective light source that is more energy-efficient. Additionally, we maintained a compatible concentration of PMS, achieving excellent removal percentages for the contaminants. These results underscore the robustness of our PEC/aPMS system compared to other advanced photoelectrocatalytic technologies. Notably, our system demonstrated high stability and reusability as a single electrode was used for all experiments. In the event of electrode deactivation, the oxide layer can be easily removed, allowing for reanodization to regenerate a new catalytic oxide without complex procedures, excessive reagent costs, or waste generation. The table highlights the versatility of our system, particularly in its ability to effectively degrade structurally diverse pollutants, positioning it as a competitive option for wastewater treatment applications.
Table 3. Comparative Analysis of Degradation Efficiencies of Various Contaminants by Photoelectrocatalysis-Assisted PMS Activation by Photoanodes.
| photoanode material | contaminant | [PMS] | light source | potential | degradation % | reference |
|---|---|---|---|---|---|---|
| Ti–O–Cu nanotubular mixed oxide grown on a TiCu alloy | methylene blue, MB (16.6 mg L–1) | 2.6 mM | 10 W UV LED (365 nm) | 0.5 V vs Ag/AgCl | 78% (MB) | this work |
| ibuprofen, IBP (13.9 mg L–1) | 3.0 mM | 52% (IBP) | ||||
| tetracycline, TC (17 mg L–1) | 1.7 mM | 92% (TC) (60 min) | ||||
| MoS2@C/CC | norfloxacin (2 mg L–1) | 40 ppm (0.13 mM) | 350 W xenon lamp with a 420 nm cutoff filter | 1.5 V | 100% (30 min) | (15) |
| g-C3N4/TiO2 nanotube arrays | tetracycline (10 mg L–1) | 2 mM | 500 W xenon lamp | 2.0 V | 95.69% (60 min) | (42) |
| BiVO4 | bisphenol A (10 mg L–1) | 5 mM | 300 W Xe lamp with a 420 nm cutoff filter | 0.25 V vs SCE | 100% (120 min) | (43) |
| FTO-Bi2WO6 | sulfamethoxazole, SMX (5 mg L–1) | 3 mM | 300 W xenon lamp with a AM1.5G filter | 1.0 V vs Ag/AgCl | 98% (SMX) | (44) |
| tetracycline, TC (5 mg L–1) | 79% (TC) | |||||
| diclofenac chloride, DC (5 mg L–1) | 83% (DC) (90 min) | |||||
| TiO2/WO3 | 17α-ethinyl estradiol (1 mg L–1) | 10 mg L–1 | 100 W xenon ozone-free solar simulator | 1.0 V vs Ag/AgCl | 88.8% (60 min) | (45) |
| Co-BiVO4 | bisphenol A (20 mg L–1) | 2 mM | 300 W Xe-lamp (100 mW cm–2) | 1.2 V | 99.16% (60 min) | (16) |
| CoFe2O4–BiVO4 | tetracycline (20 mg L–1) | 0.5 mM | 300 W Xe lamp with a 420 nm cutoff filter | 0.6 V vs RHE | 89.1% (60 min) | (46) |
| Sn-doped α-Fe2O3 | 2-(4-isobutylphenyl)propanoic acid (10 mg L–1) | 5 mM | visible LED 400 nm, 6 mW cm–2 | 1.5 V vs RHE | 99% (210 min) | (47) |
4. Conclusions
In an unprecedented way, we showed that it is possible to activate PMS by the photoanode of a photoelectrochemical system consisting of a Ti–O–Cu mixed oxide nanotube. Through a 23 experimental design and surface response, the conditions of the combined PEC/aPMS system showed superior activity at pH 4, an applied potential of 0.5 V vs Ag/AgCl, and a PMS concentration of 0.780 mM (50× the molar concentration of the contaminant). In only 30 min of treatment, 90.4% MB decolorization (5 mg L–1) was achieved by the PEC/aPMS system. Additionally, it was demonstrated that PMS activation occurs mainly through nonradical pathways, likely through the formation of singlet oxygen, 1O2. Due to its preparation method (anodization of a Ti–Cu alloy), the catalyst (copper) is firmly bonded to the TiO2 crystal structure, and the electrodes showed excellent stability. There is still a need to assess the toxicity of the treated sample, the efficiency in the presence of real contaminated matrices, and the scale-up of the system, which will be evaluated in the future stages. These results are an essential step in the search for more efficient advanced oxidative processes, showing a new approach for applying high-stability mixed oxide electrodes prepared from metal alloys.
Acknowledgments
The authors would like to express their gratitude and indebtedness for the financial support provided by the Conselho Nacional de Desenvolvimento Científico e Tecnológico—CNPq, Brazil (grant nos. 465571/2014-0, 428014/2018-6, and 406156/2022-0); Fundação de Amparo à Pesquisa do Estado de São Paulo—FAPESP, Brazil (grant no. 2014/50945-4); Coordenação de Aperfeiçoamento de Pessoal de Nível Superior—CAPES, Brazil (finance code 001); and National Institute of Alternative Technologies for Detection, Toxicological Assessment and Removal of Micropollutants and Radioactives—INCT-DATREM. We also thank the Núcleo de Instrumentação para Pesquisa e Ensino—NIPE and Laboratório de Caracterização de Materiais—LACAM of the Centro de Equipamentos Multiusuários de Diadema—CEMUD-ICAQF/UNIFESP—Campus Diadema for the Raman, DRS, and XRD analyses; Brazilian Nanotechnology National Laboratory—LNNano/CNPEM, a private nonprofit organization under the supervision of the Brazilian Ministry for Science, Technology, and Innovations—MCTI for SEM (proposal no. 20230746) and XPS experiments (proposal no. 20232113); and Center of Analyses (LabCA) from the Universidade Tecnológica Federal do Paraná—Campus Dois Vizinhos—for the TOC and HPLC analyses.
Supporting Information Available
The Supporting Information is available free of charge at https://pubs.acs.org/doi/10.1021/acsomega.4c07301.
Analysis of variance (ANOVA) of data experimental design and curves of ln[abs/abs0] vs time (kinetics) (PDF)
The Article Processing Charge for the publication of this research was funded by the Coordination for the Improvement of Higher Education Personnel - CAPES (ROR identifier: 00x0ma614).
The authors declare no competing financial interest.
Supplementary Material
References
- Khan S.; Naushad M.; Govarthanan M.; Iqbal J.; Alfadul S. M. Emerging Contaminants of High Concern for the Environment: Current Trends and Future Research. Environ. Res. 2022, 207, 112609. 10.1016/j.envres.2021.112609. [DOI] [PubMed] [Google Scholar]
- Petrie B.; Barden R.; Kasprzyk-Hordern B. A Review on Emerging Contaminants in Wastewaters and the Environment: Current Knowledge, Understudied Areas and Recommendations for Future Monitoring. Water Res. 2015, 72, 3–27. 10.1016/j.watres.2014.08.053. [DOI] [PubMed] [Google Scholar]
- Mukherjee J.; Lodh B. K.; Sharma R.; Mahata N.; Shah M. P.; Mandal S.; Ghanta S.; Bhunia B. Advanced Oxidation Process for the Treatment of Industrial Wastewater: A Review on Strategies, Mechanisms, Bottlenecks and Prospects. Chemosphere 2023, 345, 140473. 10.1016/j.chemosphere.2023.140473. [DOI] [PubMed] [Google Scholar]
- Preethi; Shanmugavel S. P.; Kumar G.; N Y. K.; M G.; J R. B. Recent Progress in Mineralization of Emerging Contaminants by Advanced Oxidation Process: A Review. Environ. Pollut. 2024, 341, 122842. 10.1016/j.envpol.2023.122842. [DOI] [PubMed] [Google Scholar]
- Sharma A.; Ahmad J.; Flora S. J. S. Application of Advanced Oxidation Processes and Toxicity Assessment of Transformation Products. Environ. Res. 2018, 167, 223–233. 10.1016/j.envres.2018.07.010. [DOI] [PubMed] [Google Scholar]
- Wang J.; Wang S. Toxicity Changes of Wastewater during Various Advanced Oxidation Processes Treatment: An Overview. J. Clean. Prod. 2021, 315, 128202. 10.1016/j.jclepro.2021.128202. [DOI] [Google Scholar]
- Ghanbari F.; Moradi M. Application of Peroxymonosulfate and its Activation Methods for Degradation of Environmental Organic Pollutants: Review. Chem. Eng. J. 2017, 310, 41–62. 10.1016/j.cej.2016.10.064. [DOI] [Google Scholar]
- Ren G.; Zhang J.; Wang X.; Liu G.; Zhou M. A Critical Review of Persulfate-Based Electrochemical Advanced Oxidation Processes for the Degradation of Emerging Contaminants: From Mechanisms and Electrode Materials to Applications. Sci. Total Environ. 2024, 944, 173839. 10.1016/j.scitotenv.2024.173839. [DOI] [PubMed] [Google Scholar]
- Ding Y.; Wang X.; Fu L.; Peng X.; Pan C.; Mao Q.; Wang C.; Yan J. Nonradicals Induced Degradation of Organic Pollutants by Peroxydisulfate (PDS) and Peroxymonosulfate (PMS): Recent Advances and Perspective. Sci. Total Environ. 2021, 15, 142794. 10.1016/j.scitotenv.2020.142794. [DOI] [PubMed] [Google Scholar]
- Tian D.; Zhou H.; Zhang H.; Zhou P.; You J.; Yao G.; Pan Z.; Liu Y.; Lai B. Heterogeneous Photocatalyst-Driven Persulfate Activation Process under Visible Light Irradiation: From Basic Catalyst Design Principles to Novel Enhancement Strategies. Chem. Eng. J. 2022, 428, 131166. 10.1016/j.cej.2021.131166. [DOI] [Google Scholar]
- Li N.; Tang S.; Rao Y.; Qi J.; Zhang Q.; Yuan D. Peroxymonosulfate Enhanced Antibiotic Removal and Synchronous Electricity Generation in a Photocatalytic Fuel Cell. Electrochim. Acta 2019, 298, 59–69. 10.1016/j.electacta.2018.12.063. [DOI] [Google Scholar]
- Lim J.; Kwak D.; Sieland F.; Kim C.; Bahnemann D. W.; Choi W. Visible Light-Induced Catalytic Activation of Peroxymonosulfate Using Heterogeneous Surface Complexes of Amino Acids on TiO2. Appl. Catal., B 2018, 225, 406–414. 10.1016/j.apcatb.2017.12.025. [DOI] [Google Scholar]
- Wang K.; Liang G.; Waqas M.; Yang B.; Xiao K.; Zhu C.; Zhang J. Peroxymonosulfate Enhanced Photoelectrocatalytic Degradation of Ofloxacin Using an Easily Coated Cathode. Sep. Purif. Technol. 2020, 236, 116301. 10.1016/j.seppur.2019.116301. [DOI] [Google Scholar]
- Liu X.; You S.; Ren N.; Zhou H.; Zhang J. Complete Solar-Driven Dual-Photoelectrode Fuel Cell for Water Purification and Power Generation in the Presence of Peroxymonosulfate. J. Hazard. Mater. 2021, 416, 125682. 10.1016/j.jhazmat.2021.125682. [DOI] [PubMed] [Google Scholar]
- Zheng Z.; Zhang Z.; Wong K. C. J.; Lung C. W.; Khan M.; He J.; Kumar A.; Lo I. M. C. Facilitating Peroxymonosulfate Activation for Effective Antibiotics Degradation from Drinking Water by Photoelectrocatalytic System Using MoS2 Embedded Carbon Substrate. Chem. Eng. J. 2023, 452 (P4), 139591. 10.1016/j.cej.2022.139591. [DOI] [Google Scholar]
- Bacha A. U. R.; Nabi I.; Cheng H.; Li K.; Ajmal S.; Wang T.; Zhang L. Photoelectrocatalytic Degradation of Endocrine-Disruptor Bisphenol – A with Significantly Activated Peroxymonosulfate by Co-BiVO4 Photoanode. Chem. Eng. J. 2020, 389, 124482. 10.1016/j.cej.2020.124482. [DOI] [Google Scholar]
- Bessegato G. G.; Guaraldo T. T.; de Brito J. F.; Brugnera M. F.; Zanoni M. V. B. Achievements and Trends in Photoelectrocatalysis: From Environmental to Energy Applications. Electrocatalysis 2015, 6 (5), 415–441. 10.1007/s12678-015-0259-9. [DOI] [Google Scholar]
- Myers R. H.; Montgomery D. C.; Anderson-Cook C. M.. Response Surface Methodology: Process and Product Optimization Using Designed Experiments, 3rd ed.; John Wiley and Sons, Inc.: Hoboken, 2009. [Google Scholar]
- Almeida L. C.; Garcia-Segura S.; Bocchi N.; Brillas E. Solar Photoelectro-Fenton Degradation of Paracetamol Using a Flow Plant with a Pt/Air-Diffusion Cell Coupled with a Compound Parabolic Collector: Process Optimization by Response Surface Methodology. Appl. Catal., B 2011, 103 (1–2), 21–30. 10.1016/j.apcatb.2011.01.003. [DOI] [Google Scholar]
- Rajendran H. K.; Fakrudeen M. A. D.; Chandrasekar R.; Silvestri S.; Sillanpää M.; Padmanaban V. C. A Comprehensive Review on Analytical and Equation Derived Multivariate Chemometrics for the Accurate Interpretation of the Degradation of Aqueous Contaminants. Environ. Technol. Innov. 2022, 28, 102827. 10.1016/j.eti.2022.102827. [DOI] [Google Scholar]
- Cai J.; Zhou M.; Pan Y.; Du X.; Lu X. Extremely Efficient Electrochemical Degradation of Organic Pollutants with Co-Generation of Hydroxyl and Sulfate Radicals on Blue-TiO2 Nanotubes Anode. Appl. Catal., B 2019, 257, 117902. 10.1016/j.apcatb.2019.117902. [DOI] [Google Scholar]
- Burns J. M.; Cooper W. J.; Ferry J. L.; King D. W.; DiMento B. P.; McNeill K.; Miller C. J.; Miller W. L.; Peake B. M.; Rusak S. A.; Rose A. L.; Waite T. D. Methods for Reactive Oxygen Species (ROS) Detection in Aqueous Environments. Aquat. Sci. 2012, 74 (4), 683–734. 10.1007/s00027-012-0251-x. [DOI] [Google Scholar]
- Murray J. L. The Cu-Ti (Copper-Titanium) System. Bull. Alloy Phase Diagrams 1983, 4 (1), 81–95. 10.1007/bf02880329. [DOI] [Google Scholar]
- de Almeida J.; Câmara S. H.; Bertazzoli R.; Rajeshwar K.; da Silva R. A. G.; de Arruda Rodrigues C. Selective Photoelectrocatalytic CO2 Reduction to Ethanol Using Nanotubular Oxides Grown on Metastable Ti-Cu Alloy. Chem. Eng. J. 2023, 477, 147117. 10.1016/j.cej.2023.147117. [DOI] [Google Scholar]
- Moulder J. F.; Chastain J.. Handbook of X-ray Photoelectron Spectroscopy: A Reference Book of Standard Spectra for Identification and Interpretation of XPS Data; Physical Electronics Division, Perkin-Elmer Corporation, 1992. [Google Scholar]
- Poulston S.; Parlett P. M.; Stone P.; Bowker M. Surface Oxidation and Reduction of CuO and Cu2O Studied Using XPS and XAES. Surf. Interface Anal. 1996, 24, 811–820. . [DOI] [Google Scholar]
- Idriss H. On the Wrong Assignment of the XPS O 1s Signal at 531–532 EV Attributed to Oxygen Vacancies in Photo- and Electro-Catalysts for Water Splitting and Other Materials Applications. Surf. Sci. 2021, 712, 121894. 10.1016/j.susc.2021.121894. [DOI] [Google Scholar]
- Kim H. I.; Kim J.; Kim W.; Choi W. Enhanced Photocatalytic and Photoelectrochemical Activity in the Ternary Hybrid of CdS/TiO2/WO3 through the Cascadal Electron Transfer. J. Phys. Chem. C 2011, 115 (19), 9797–9805. 10.1021/jp1122823. [DOI] [Google Scholar]
- Zhang L.; Cao H.; Lu Y.; Zhang H.; Hou G.; Tang Y.; Zheng G. High-Efficiency and Sustainable Photoelectric Conversion of CO2 to Methanol over CuxO/TNTs Catalyst by Pulse Potential Method. J. Solid State Electrochem. 2020, 24 (2), 447–459. 10.1007/s10008-019-04439-7. [DOI] [Google Scholar]
- Wang Y.; Yang R.; Ding Y.; Zhang B.; Li H.; Bai B.; Li M.; Cui Y.; Xiao J.; Wu Z. S. Unraveling Oxygen Vacancy Site Mechanism of Rh-Doped RuO2 Catalyst for Long-Lasting Acidic Water Oxidation. Nat. Commun. 2023, 14 (1), 1412. 10.1038/s41467-023-37008-8. [DOI] [PMC free article] [PubMed] [Google Scholar]
- Paramasivam I.; Jha H.; Liu N.; Schmuki P. A Review of Photocatalysis Using Self-Organized TiO2 Nanotubes and Other Ordered Oxide Nanostructures. Small 2012, 8 (20), 3073–3103. 10.1002/smll.201200564. [DOI] [PubMed] [Google Scholar]
- Oh W. D.; Dong Z.; Lim T. T. Generation of Sulfate Radical through Heterogeneous Catalysis for Organic Contaminants Removal: Current Development, Challenges and Prospects. Appl. Catal., B 2016, 194, 169–201. 10.1016/j.apcatb.2016.04.003. [DOI] [Google Scholar]
- Zhou X.; Zhao Q.; Wang J.; Chen Z.; Chen Z. Nonradical Oxidation Processes in PMS-Based Heterogeneous Catalytic System: Generation, Identification, Oxidation Characteristics, Challenges Response and Application Prospects. Chem. Eng. J. 2021, 410, 128312. 10.1016/j.cej.2020.128312. [DOI] [Google Scholar]
- Bezerra M. A.; Santelli R. E.; Oliveira E. P.; Villar L. S.; Escaleira L. A. Response Surface Methodology (RSM) as a Tool for Optimization in Analytical Chemistry. Talanta 2008, 76 (5), 965–977. 10.1016/j.talanta.2008.05.019. [DOI] [PubMed] [Google Scholar]
- Kosmulski M. The Significance of the Difference in the Point of Zero Charge between Rutile and Anatase. Adv. Colloid Interface Sci. 2002, 99 (3), 255–264. 10.1016/S0001-8686(02)00080-5. [DOI] [PubMed] [Google Scholar]
- Khalik W. F.; Ho L. N.; Ong S. A.; Voon C. H.; Wong Y. S.; Yusoff N. A.; Lee S. L.; Yusuf S. Y. Optimization of Degradation of Reactive Black 5 (RB5) and Electricity Generation in Solar Photocatalytic Fuel Cell System. Chemosphere 2017, 184, 112–119. 10.1016/j.chemosphere.2017.05.160. [DOI] [PubMed] [Google Scholar]
- Çobanoğlu K.; Değermenci N. Comparison of Reactive Azo Dye Removal with UV/H2O2, UV/S2O82– and UV/HSO5– Processes in Aqueous Solutions. Environ. Monit. Assess. 2022, 194 (4), 302. 10.1007/s10661-022-09964-z. [DOI] [PubMed] [Google Scholar]
- Huang Y.; Nengzi L. c.; Zhang X.; Gou J.; Gao Y.; Zhu G.; Cheng Q.; Cheng X. Catalytic Degradation of Ciprofloxacin by Magnetic CuS/Fe2O3/Mn2O3 Nanocomposite Activated Peroxymonosulfate: Influence Factors, Degradation Pathways and Reaction Mechanism. Chem. Eng. J. 2020, 388, 124274. 10.1016/j.cej.2020.124274. [DOI] [Google Scholar]
- Xing S.; Li W.; Liu B.; Wu Y.; Gao Y. Removal of Ciprofloxacin by Persulfate Activation with CuO: A PH-Dependent Mechanism. Chem. Eng. J. 2020, 382, 122837. 10.1016/j.cej.2019.122837. [DOI] [Google Scholar]
- Ding Y.; Fu L.; Peng X.; Lei M.; Wang C.; Jiang J. Copper Catalysts for Radical and Nonradical Persulfate Based Advanced Oxidation Processes: Certainties and Uncertainties. Chem. Eng. J. 2022, 427, 131776. 10.1016/j.cej.2021.131776. [DOI] [Google Scholar]
- Jawad A.; Zhan K.; Wang H.; Shahzad A.; Zeng Z.; Wang J.; Zhou X.; Ullah H.; Chen Z.; Chen Z. Tuning of Persulfate Activation from a Free Radical to a Nonradical Pathway through the Incorporation of Non-Redox Magnesium Oxide. Environ. Sci. Technol. 2020, 54 (4), 2476–2488. 10.1021/acs.est.9b04696. [DOI] [PubMed] [Google Scholar]
- Li Q.; Wang Z.; Li Y.; Zhang H. Degradation of Tetracycline Hydrochloride through G-C3N4/TiO2 Nanotube Arrays for Photoelectrocatalytic Activation of PMS System: Performance and Mechanistic Analysis. Mater. Sci. Semicond. Process. 2025, 185, 108879. 10.1016/j.mssp.2024.108879. [DOI] [Google Scholar]
- Shao H.; Wang Y.; Zeng H.; Zhang J.; Wang Y.; Sillanpää M.; Zhao X. Enhanced Photoelectrocatalytic Degradation of Bisphenol a by BiVO4 Photoanode Coupling with Peroxymonosulfate. J. Hazard. Mater. 2020, 394, 121105. 10.1016/j.jhazmat.2019.121105. [DOI] [PubMed] [Google Scholar]
- Orimolade B. O.; Idris A. O.; Feleni U.; Mamba B. Peroxymonosulfate Assisted Photoelectrocatalytic Degradation of Pharmaceuticals at a FTO-Bi2WO6 Electrode: Mechanism and Kinetics Studies. Catal. Commun. 2022, 169, 106481. 10.1016/j.catcom.2022.106481. [DOI] [Google Scholar]
- Dhawle R.; Giannakopoulos S.; Frontistis Z.; Mantzavinos D. Peroxymonosulfate Enhanced Photoelectrocatalytic Degradation of 17α-Ethinyl Estradiol. Catal. Today 2023, 413–415, 114026. 10.1016/j.cattod.2023.02.003. [DOI] [Google Scholar]
- Wang W.; Liu X.; Jing J.; Mu J.; Wang R.; Du C.; Su Y. Photoelectrocatalytic Peroxymonosulfate Activation over CoFe2O4-BiVO4 Photoanode for Environmental Purification: Unveiling of Multi-Active Sites, Interfacial Engineering and Degradation Pathways. J. Colloid Interface Sci. 2023, 644, 519–532. 10.1016/j.jcis.2023.03.202. [DOI] [PubMed] [Google Scholar]
- Machreki M.; Tyuliev G.; Žigon D.; Guo Q.; Chouki T.; Sobrido A. B. J.; Dimitrov S.; Emin S. Photoelectrochemical Activation of Peroxymonosulfate Using Sn-Doped α-Fe2O3 Thin Film for Degradation of Anti-Inflammatory Pharmaceutical Drug. J. Photochem. Photobiol., A 2024, 446, 115126. 10.1016/j.jphotochem.2023.115126. [DOI] [Google Scholar]
Associated Data
This section collects any data citations, data availability statements, or supplementary materials included in this article.


