Abstract
The dynamics of droplets spreading on surfaces have been extensively studied across various influencing factors, necessitating an exploration of their effect on wettability. Herein, the specific composition, size distribution, and contact angle of the coal dust preparation were characterized by a series of experiments to determine the conditions for the simulation. Meanwhile, the multiphase volume of the fluid method was implemented in the simulations, predicated on appropriate boundary conditions, and verified by a mesh independence test. The findings confirmed that the numerical approach for contact angle validation had a minor deviation, making it suitable for multiphase interface tracking. Besides, the typical wetting pattern of droplets was hereby identified into three stages, including the moving stage (stage I), the periodic wetting stage (stage II), and the balancing stage (stage III). The initial diameter could effectively increase the coverage area and spreading time for stage II. Obviously, the first amplitude of first maximum spreading diameter (Dmax-1) significantly increased with higher impact velocities, corresponding to an increase in kinetic energy. Despite the significant spreading effect of the falling height mainly on Dmax-1 and contact time, the increased trend of wetting efficiency was not obvious. However, the spreading factor and wetting efficiency decreased with increased roughness height. Finally, the difference in spreading wettability was illustrated based on the spreading wetting mechanism. The wetting efficiency of droplets on coal dust was remarkably influenced by the dynamic spreading behaviors of droplets. Overall, the findings from this study offer insights into the extent of spreading wetting that occurs before a droplet reaches an equilibrium state.
1. Introduction
Coal, being one of the most indispensable sources of energy in modern industry, plays a pivotal role in driving economic and societal development.1 However, coal dust is inevitably generated during the coal extraction and utilization process, standing as a primary threat and cause of accidents for miners.2,3 It has been found that with the mechanization and modernization of mining processes, overexposure to coal mine dust can lead to “Coal Worker Pneumoconiosis” (CWP), which is also referred to as black lung disease.4 Additionally, high concentrations of coal dust have been identified as the primary causes of dust explosions and mechanical hazards, owing to their ubiquitous presence in the environment and the duration of their activity.5
At present, spray dust reduction is a widely applied hydraulic method to control dust in the safety precautions of coal mines in China.6 Specifically, Yao et al. pointed out the wettability of coal dust as a critical factor in characterizing the dust removal efficiency,7 whereas Yin et al. reported that the wetting degree and behavior could be described by the contact angle and wetting area.8 However, wetting coal dust is challenging due to its hydrophobicity and the high surface tension of water.9 If the coal dust is effectively wetted in dust reduction to achieve more moisture, a higher dust removal efficiency will be achieved. Therefore, investigation of surface wettability and wetting behavior holds considerable significance for revealing the wetting mechanism in spraying technology.
The wetting behavior of droplets on solid objects experiences the impacting, spreading, recoiling, rebounding, or splashing, which is controlled by the kinetic energy, surface energy, viscous dissipation, and its interaction with the solid surface.10−14 Existing research has shown that the spreading efficacy is jointly affected by the droplet physical properties (e.g., density, dynamic viscosity, and surface tension) and initial conditions (e.g., diameter, velocity, and falling height).15−17 To clarify the detailed effect of the above-mentioned factors on spreading, the two utmost crucial nondimensional parameters, Weber number (We), known as the ratio of inertial force to surface tension, and Reynolds number (Re), referred to as the ratio of inertial force to viscous force, have been mainly adopted in most study cases.18−20 Moreover, as the key stage of the wettability process, spreading determines the contact time and wetting area, both of which are contingent upon the impacting energy.
During the deformation process of droplets, scholars have commonly evaluated the spreading ability based on the maximum spreading diameter and the nondimensional spreading factor. For instance, Liu et al. conducted a comprehensive investigation, and found that the maximum spreading diameter increased with the increased Weber number by varying impacting parameters.21 Cai et al. observed that the spreading factor was alternatively used as an indicator of the wetting ability, with a higher value implying better wettability.22 Vincent et al. simulated the effect of contact angle on the spreading,23 and found that the spreading factor was proportional to dimensionless time during the spreading stage. Furthermore, focusing on internal factors, numerous researchers explored the surface wettability of droplets, particularly concerning the roughness of porous surfaces,24 and claimed that surface wettability depended on the surface roughness, which in turn, was affected by the particle distribution.25−28
Generally, scholars have preferred conducting experiments to investigate the dynamic spreading of droplets using high-speed cameras. Specifically, Zhao et al. delved into maximum spreading factors at different Weber numbers on porous surfaces.14 While the rapid advancement of high-speed photography technology has been utilized to visually document the wetting area through experiments, it is also true that numerical simulation methods can provide detailed records of droplet morphology at various contact times. Shen et al. reported that numerical methods proposed in previous studies mainly included the volume of fluid (VOF), the lattice Boltzmann method (LBM), and many-body dissipative particle dynamics (MDPD).29−32 However, Xu et al. and Zanutto et al. emphasized that the VOF method was frequently adopted due to its advantages in tracking the interface of multiphase and calculating the surface tension. In addition, the mechanisms about spreading wetting of droplets were clarified by further investigating the coverage area.17,33 Zhang et al. performed an experiment to evaluate the surface wettability based on the effective wetting area.34 Malgarinos et al. defined the wetting area according to the percentage of surfaces covered by droplets.35
Previous studies on the spreading of droplets mainly focused on various factors affecting the spreading behavior, such as impact velocity, droplet size, and surface roughness. Meanwhile, several attempts have been made to investigate the relationship between wettability properties and spreading through experiments and simulation. However, given that the wetting process involves intricate mechanisms of moisture adsorption and energy conversion, the effects of spreading dynamics on the wetting efficiency have seldom been detailed. Consequently, there is a pressing need for further research into the wettability of coal dust surfaces to enhance dust reduction effectiveness using spraying techniques.
As reviewed above, the purpose of this work is to illustrate the wetting mechanisms and efficiency of droplets on rough surfaces. Upon sample preparation, the specific compositions, size distributions, and contact angles were characterized by a series of experiments in the laboratory. Subsequently, the VOF method was implemented in the simulations, ensuring that they were based on appropriate boundary conditions and had passed a mesh independence test. The numerical methodology was validated by comparing the numerical, calculated, and experimental contact angles. Furthermore, the effects of various factors on dynamic spreading, which depended on impact velocity, initial velocity, falling height, and roughness height, were systematically identified and discussed in the simulation scheme. Finally, the spreading wetting mechanism was delved into by examining the characteristics of wettability, and the wetting efficiency was determined using a dimensionless spreading factor and normalized contact time for the calculations. Collectively, the exploration results could offer an explanation for the extent of spreading wetting that occurred prior to the droplet reaching an equilibrium state.
2. Methodology
2.1. Coal Dust Preparation
The experimental coal samples were freshly collected from a producing coalfield area present in Shanxi Province, China, and were utilized as a raw material of coal dust. Ethanol C2H5OH (AR, ≥ 99.7%) was purchased from Aladdin Industrial Corporation. The obtained coal samples were crushed into powder and ground into particles of ∼80 mesh. Subsequently, they were sealed in an airtight cabinet to prevent oxidation reactions and changes in wettability. Following that, the prepared coal dust particles (1.25g) were added into ethanol (60 mL) and stirred with a glass rod until the particles were uniformly mixed. Besides, some samples were placed in a vacuum and dried at 105–110 °C for 2 h to remove moisture. Typically, 200 mg portions of dried samples were transferred into a mold with a diameter of 13 mm and compressed at 10 MPa for 5 min in a hydraulic press machine (YF-2). Finally, adhering to identical procedures, 9 smooth coal slices were divided into three groups, each approximately 1–2 mm in thickness, were obtained. Figure 1 displays the acquired samples.
Figure 1.
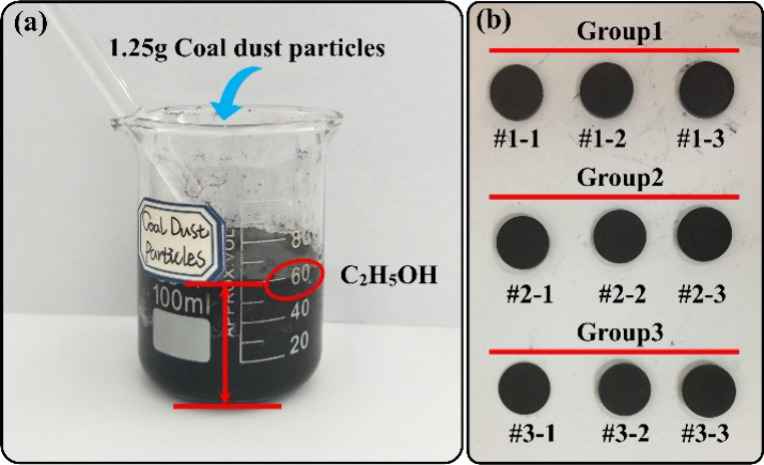
Experimental samples: (a) suspensions and (b) coal slices.
2.2. Characterization
The basic properties of coal samples were analyzed using an automated industrial analyzer (TGA-200) with reference given to the Chinese National Standard GB/T 212–2008. The specific compositions of the proximate and ultimate analyses are listed in Table 1. One 10 μL droplet of suspension was drop-casted on the glassy carbon with a loading of 1.5 mg/cm2. The size of the coal dust particles was measured using a dust morphology and dispersion tester (WKL-722), as shown in Figure 2. The contact angles test was performed on a contact angle system (MG-SL200A/SDC-350) using a high-resolution camera at 5 μL distilled water dropped from a syringe onto the surface of the coal slice. To ensure measurement accuracy, the group was quantified in triplicate, as illustrated in Figure 3.
Table 1. Proximate and Ultimate Analysis of the Coal Sample Used in the Experiment.
| Proximate
analysis (wt %, d) |
Ultimate analysis (wt %, daf) |
||||||||
|---|---|---|---|---|---|---|---|---|---|
| Sample | Mar | Vd | FCd | Ad | Cdaf | Hdaf | Odiff | Ndaf | Sdaf |
| Shanxi, China | 2.77 | 8.45 | 79.94 | 8.84 | 85.15 | 3.18 | 1.83 | 1.15 | 0.82 |
Figure 2.
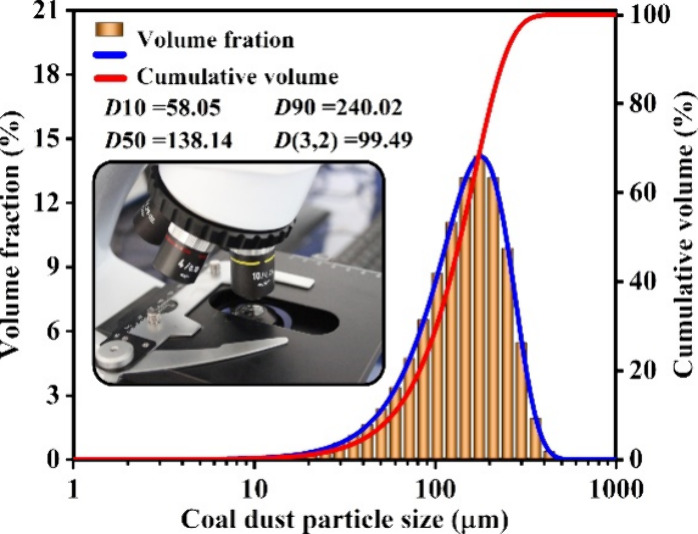
Size of coal dust particles.
Figure 3.
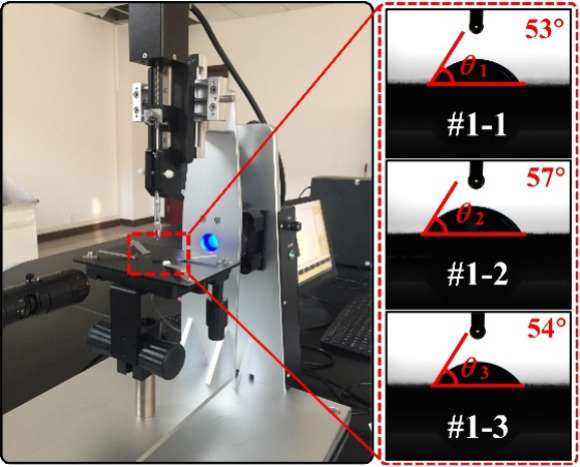
Contact angle test.
Wettability was defined as the interaction between the liquid and solid and characterized by the cosine of the equilibrium contact angle θ.36 Generally, the equilibrium contact angle (CA) was used as an indicator of the wetting agent. A better wettability surface indicated a smaller contact angle, as clarified by the definition of well-known Young’s equation:37
| 1 |
Where γSV and γLV are the solid surface tension and liquid surface tension, respectively; and γSL represents the interfacial tension between the solid and the liquid.
Furthermore, the wettability was also characterized by using different spreading parameters. By assuming the shape of wetting balance to be a truncated sphere, the surface area S, volume V, and centroid l were calculated using the formulas given below:38
| 2 |
| 3 |
| 4 |
Where Dt represents the spreading diameter on the surface of coal slices within the contact time (m); θ is the contact angle (deg); and l is the centroid of the droplet (m). As shown in Equations 2, 3, and 4, the spreading parameters (S and V) of droplets played an important role in quantifying the wettability.
2.4. Simulation Section
2.4.1. Physical Model
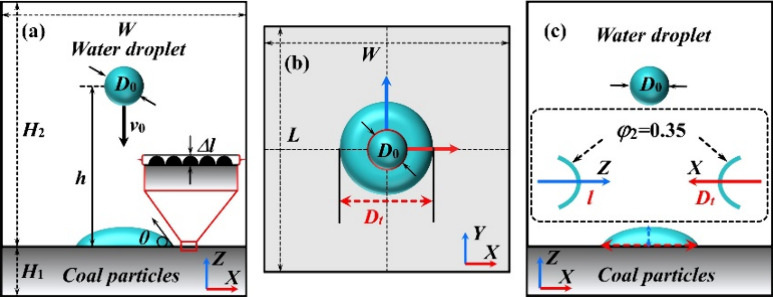
According to the wettability test experiment, the physical model in the simulation was the simplified device with dimensions 10 mm × 10 mm × 12 mm (width × length × height), as shown in Figure 4. The porous medium of the coal particles was located at the bottom of the fluid zone. The droplet was patched on the contact face at a certain height h with a diameter D0.
Figure 4.
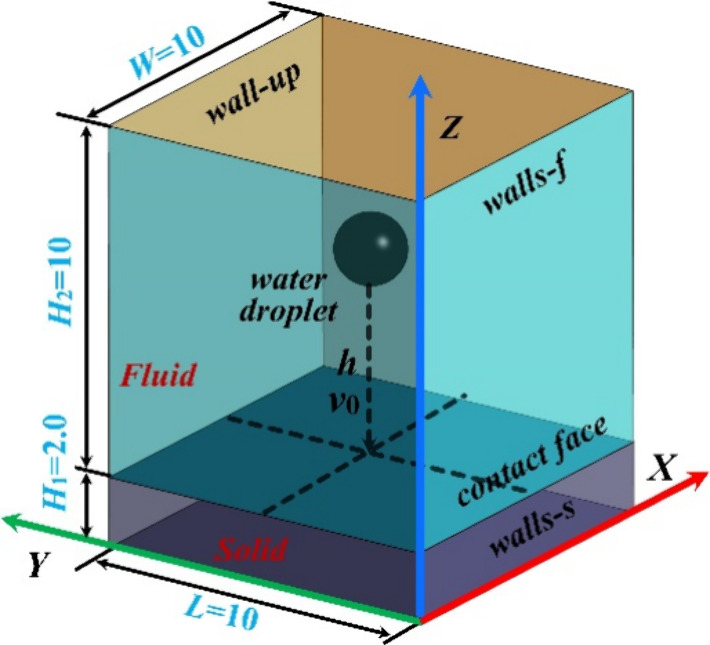
Physical model of water droplet spreading.
2.4.2. Numerical Method
The numerical simulations were performed by Ansys Fluent (Academic version 2020R1), an open commercial computational fluid dynamic. The multiphase volume of fluid (VOF) model, coupled with the turbulent transient state, was selected for this study. This model is extensively utilized for tracking the interface between water and air on rough surfaces.39 In the VOF model, the primary and binary phases were air and water, respectively, while the continuous phase interaction was considered the wall adhesion with a surface tension coefficient of 0.072 N m–1. The water droplet was driven to spread at gravity and hydrodynamic velocity by overcoming the constraint of the viscous and surface tension force. Subsequently, the RNG k-ε turbulence model was adopted for the analysis of interfacial dynamics. To achieve high stability, the second-order upwind method was used in the solution section. Finally, the time step size and the max simulation time were calculated to be 50 μs and 0.25 s, respectively.
In order to track the water–air interface on the roughness surface, the continuity, momentum, and energy equations are expressed as below.40,41
- Continuity:

5 - Momentum:

6 - Energy:

7
Where v⃗, p, and g are the velocity vector (m s–1), pressure (Pa), and gravity acceleration (m s–2), respectively; T is the temperature (K), k and cp are the thermal conductivity and specific heat capacity of liquid, respectively; ρ represents the density, (kg m–3) ρ = ρ1φ1 + ρ2φ2; φ is the volume fraction, φ1 + φ2 = 1; and μ is the dynamic viscosity (kg m–1 s–1), μ = μ1φ1 + μ2φ2.42 Besides, subscripts 1 and 2 represent the air and water phase, respectively. The surface tension force Fσ was modeled by Brackbill et al.:43
| 8 |
Where σ is the interfacial tension coefficient
(N m–1).  , and n⃗ is the
gradient of φ2. For the VOF model, the φ2 was adopted to indicate the interface by solving the transport
function:44
| 9 |
2.4.3. Simulation Scheme and Boundary Conditions
To investigate the dynamic performance of the water droplet, the numerical study was carried out as the simulation scheme shown in Figure 5. First, the control variables, initial diameter D0, velocity v0, and height h, of the water droplet were used to independently assess the effects of spreading behaviors. Following that, these variables specified in the boundary conditions were controlled as the principle of a single variable. In order to validate the influence of the roughness of contact surface, 4 surface types (0.05, 0.20, 0.35, and 0.50 mm) shown in Figure 5(a) were applied on a fixed contact angle of 54°. Finally, the spreading parameters (diameter Dt and centroid l) were documented with the φ2 = 0.35, as shown in Figure 5(c).
Figure 5.
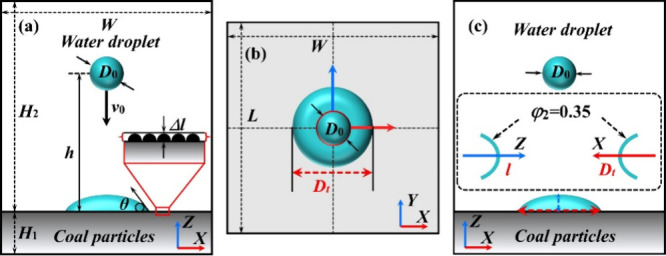
Simulation scheme: (a) four simulation schemes, (b) top view of simulated droplet, and (c) spreading parameters monitoring.
Herein, by assuming the temperature T = 293K, ambient pressure was treated as the outlet. To realistically simulate the droplet spreading, the volume fraction of water was set to 1.0 at the original time. The contact angle of characterization was utilized in the contact surface. The simulation was configured with a total of 5000 time steps, each with a size of 5e-5s. The numerical models, boundary conditions, and materials used in all simulations are summarized in Table 2.
Table 2. Numerical Simulation Parameters Setting.
| Name | Type | Parameter | |
|---|---|---|---|
| Models | Viscous | Viscous | RNG k-epsilon45,46 |
| Multiphase | Volume of fluid47 | Phase1-air | |
| Phase2-water | |||
| Boundary | Wall-up | Pressure outlet | Standard ambient pressure (101 325 Pa) |
| Walls-f | |||
| Walls-s | Wall | No-slip standard wall | |
| Contact face | Roughness height Δl48,49 | 0.05–0.5m/s mm | |
| Roughness constant | 0.5 | ||
| Contact angle θ | ∼54° | ||
| Water droplet | Volume fraction | 1.0 | |
| Velocity v0(49−51) | 0.15–0.45 | ||
| Diameter D0(50,51) | 1.5–3.0 mm | ||
| Height h(52,53) | 2.0–8.0 mm | ||
| Material | Water | Density | 998.2 kg/m3 |
| Viscosity | 1.03 × –3 kg/(m s) | ||
| Surface tension | 0.072 N/m | ||
2.4.4. Computational Mesh and Adaptive Refinement
It is widely recognized that the mesh independence test is crucial in CFD because an appropriately selected mesh leads to accurate computational results.41 As a result, the structured meshes were hereby generated in ICEM. In order to provide accurate solutions and fast convergence, the mesh independence tests were conducted with 4 mesh resolutions (M1 ∼ M4) to reach the optimum mesh. As shown in Figure 6, the meshing approach for M1, M2, and M3 was consistent. In contrast, M4 utilized a BiGeometric method, which was specifically designed to establish the first layer height close to the contact surface. The total number of cells was 0.150 (M1), 0.225 (M2), 0.576 (M3), and 0.576 (M4) million, respectively. As indicated by the values of spreading diameter, while M3 and M4 shared the same elements, M4 was found to be more reliable at the second peak. Therefore, the mesh generated as M4 was further selected to maintain the accuracy and calculation efficiency in this study.
Figure 6.
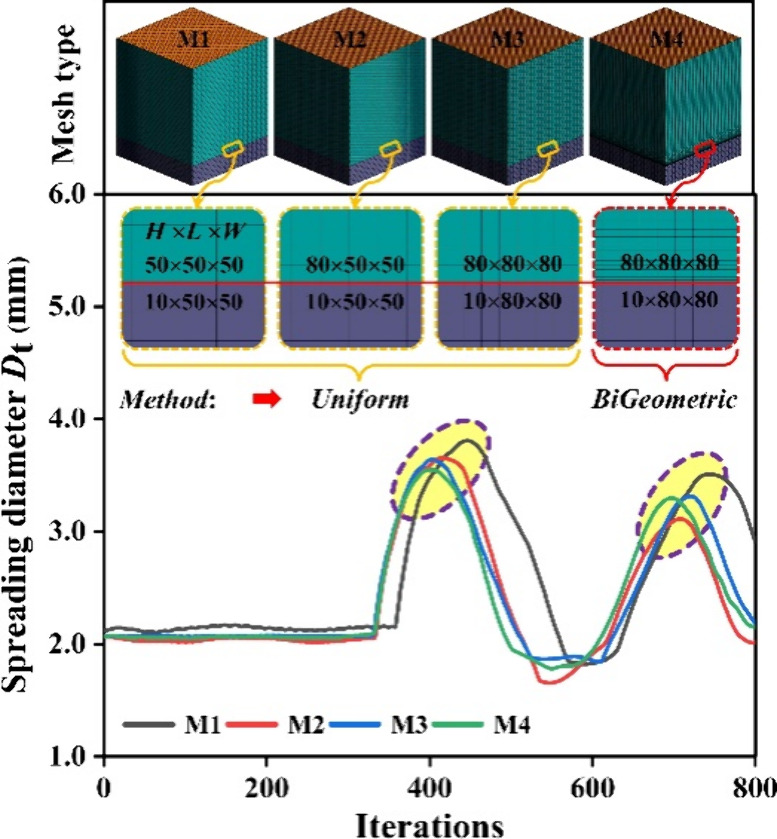
Mesh independence tests using 4 mesh resolutions.
2.5. Validation of the Numerical Methodology
In this section, the precision of the numerical method was confirmed and a quantitative comparison of contact angles, as determined by both computational predictions and experimental measurements, was conducted. Details are shown in Figure 7. The simulation was carried out, with specific parameters illustrated in Table 1, including a droplet with an initial diameter D0 = 2.0 mm, an impact velocity v0 = 0.25 m/s, and a falling height h = 6 mm roughness surface (Δl = 0.05 mm). As shown in Figure 7, the simulated CA decreased rapidly from 170° to about 50° when the droplet made contact with the surface within 16.5 ms. As the contact time increased, the equilibrium CA was calculated by Equations 3 and 4, whereas the experimental CA was collected from the characterization. It was found that a deviation of less than 6.5% was necessary to verify the established simulation model. Furthermore, the calculation method in this article predicted the CA accurately and credibly, confirming the feasibility and reliability of the adopted numerical methodology to further explore droplet spreading and wettability.
Figure 7.
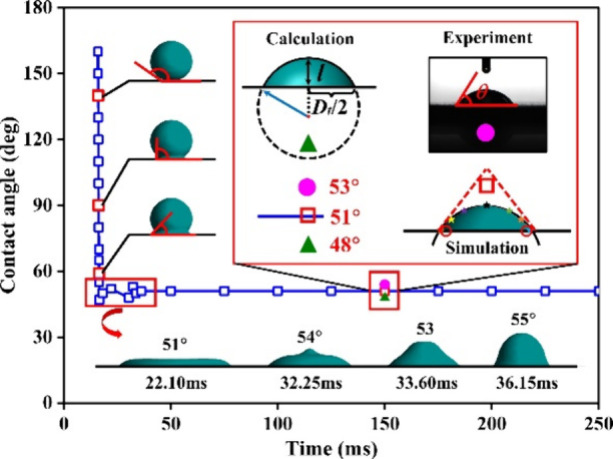
Comparison of the numerical, calculated, and experimental contact angles.
3. Results and Discussions
3.1. Dynamic Spreading Behaviors of Droplets
Numeral relevant researches focus on the dynamic spreading behaviors of the droplets, the spreading diameter, or the contact time that have been intensively studied.54,55 For instance, Lin et al. pointed out that these behaviors were characterized by Weber number (We) and Reynolds number (Re).56 Simhadri Rajesh et al. found that the maximum spreading diameters could be significantly affected by increasing the We value.57 Therefore, as the most important dimensionless parameters to describe the droplet spreading and wetting, We and Re were defined as below:
| 10 |
| 11 |
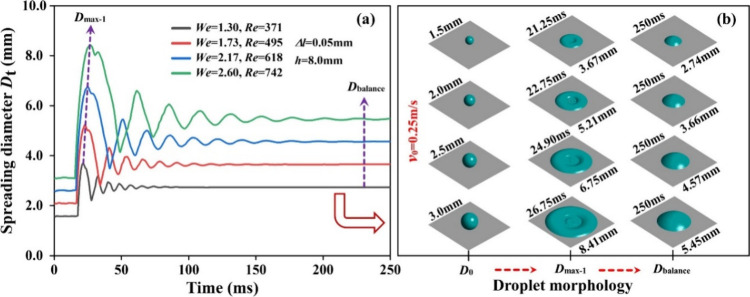
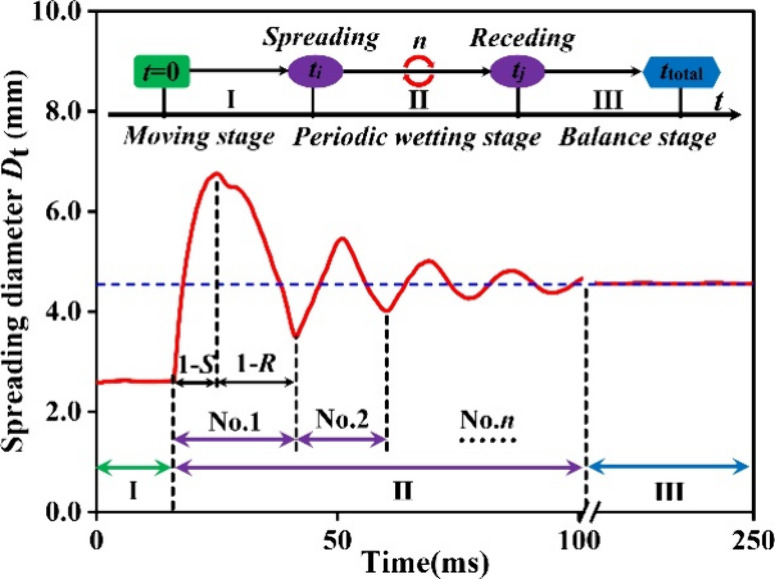
Luo et al. observed that the progress of water droplets into a stable shape after impacting the flat surface was governed by inertial force and overcame the surface tension and viscous force.58Figure 8 shows the typical wetting pattern of droplets when We, Re, and θ were 1.73, 495, and 54°, respectively. Generally, three stages of the spreading process were identified. In the moving stage (stage I), the droplet kept a free-falling movement during the time interval of t1. After that, a damping movement was observed when the droplet spread on the contact surface in the periodic wetting stage (stage II). The amplitude values gradually decreased with the increased contact time in stage II. The No. 1 period consisted of the spreading and receding movement, in which the maximum spreading diameter and rebounding height were achieved. However, the balance stage (stage III) with a constant spreading diameter Dt could predict the wetting ability, as shown in Equations 2, 3, and 4. When further increasing the contact time ttotal, for a hydrophilic surface, a considerable wetting efficiency could be obtained until the droplet left the surface.
Figure 8.
Typical wetting pattern of droplets with D0 = 2.0 mm under the We = 1.73, Re = 495, and θ = 54°.
3.1.1. Effect of the Droplet Diameter
Figure 9 presents the change of spreading diameter Dt with initial diameter D0. Obviously, the spreading behaviors of droplets were sensitive to the value of D0. The findings indicated that the maximum spreading diameter for the No. 1 instance increased as the D0 grew from 1.5 mm to 3.0 mm. Moreover, the period of damping movement increased significantly with the trend of D0, and it decreased gently with further spreading in stage II. As the spreading time progressed, no difference was observed between the nth maximum spreading diameter (Dmax-n) and balance spreading diameter (Dbalance), suggesting that the spreading process had transitioned to stage III. Meanwhile, the number of cycles (n) was calculated when |Dmax-n – Db| ≤ 1.0%Do was satisfied. An interesting phenomenon was noticed that different D0 values corresponded to 7 cycles in stage II. Obviously, this finding indicated that the initial diameter had no influence on the number of cycles. Therefore, the initial diameter primarily served to effectively increase the coverage area and prolong the spreading time during stage II. To investigate more details about the droplet shapes, a comparison was made of the three critical shapes (initial shape, max-spreading shape, and equilibrium shape) involving different D0 values as illustrated in Figure 9(b). Observations revealed that the droplets achieved their maximum-spreading shape at 21.25 22.75, 24.90, and 26.75 ms, respectively. At the moment of maximum spread, the shape of the droplet closely resembled a pancake with a concave shape at the top.
Figure 9.
Comparisons of 4 initial diameters with an impacting velocity of 0.25 m/s; (a) spreading diameter and (b) droplet morphology.
3.1.2. Effect of the Impact Velocity
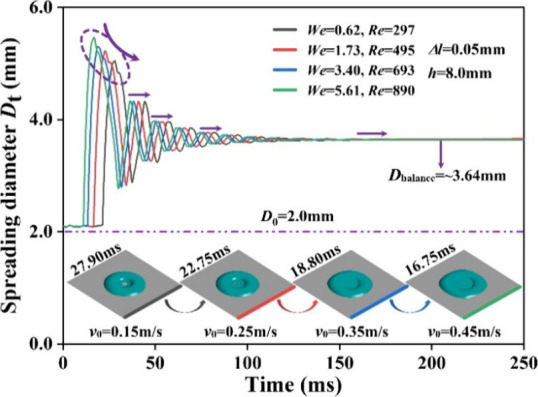
In this section, the initial diameter was fixed at D0 = 2.0 mm, and the impact velocity of the droplet varied from v0 = 0.15 to 0.45 m/s for the investigation of spreading behaviors. As displayed in Figure 10, noticeable differences in the No. 1 wetting circle were observed when the droplet began to spread on the contact surface until it reached a subsequent stage. The parallel curves in the No. 1 spreading (1 – S in Figure 8) indicated that kinetic energy dissipation was predominantly determined by the water viscosity rather than the impact velocity. Obviously, the first amplitude Dmax-1 was remarkably higher with the increase of impact velocity, corresponding to more kinetic energy. Besides, the maximum-spreading shape in Figure 10 was improved with the increase of impact velocity, thus forming a thin and large coverage area. Afterward, a nearly constant amplitude was found throughout the complete stage II, coinciding with the dissipation of the inertial force in the No. 1 receding (1 – R in Figure 8).
Figure 10.
Comparisons of 4 impact velocities with an initial diameter of 2.0 mm.
3.1.3. Effect of the Falling Height
Figure 11 presents a comparison of changes in the spreading behaviors at different free-falling heights h. The initial contact time showed a significant variation due to the increased kinetic energy as the droplet was released from a greater height. For example, when the droplet was released from a height of h = 2.0 mm, the initial contact time was measured at 4.85 ms. However, when the height was increased to 8.0 mm, the contact time extended to 21.4 ms. However, the max-spreading diameter of the droplet in the horizontal direction for h = 8.0 mm was Dmax-1 = 2.5 mm, which was 2.7%, 1.2%, and 0.2% greater compared to other cases. The difference in the first amplitude Dmax-1 among the 4 free-falling heights was not as significant as that in the impact velocity. In addition, the variety of several cycles (n) and amplitude (n ≥ 2) presented patterns similar to those in the above description.
Figure 11.
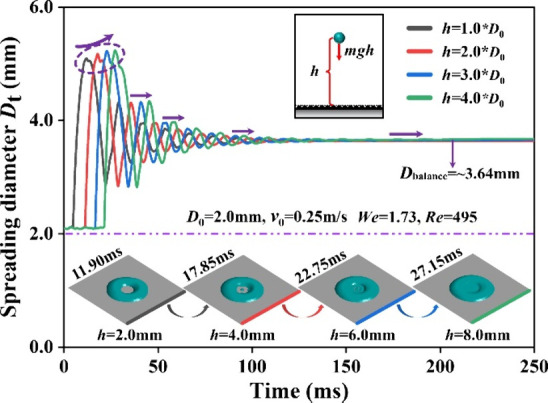
Comparisons of 4 free-falling heights with We = 1.73 and Re = 495.
3.1.4. Effect of the Roughness Height
The variation of the droplet’s spreading diameter Dt on the rough flat surface over different time intervals is presented in Figure 12. When droplets impacting surfaces with varying roughness heights achieved their maximum spreading shape, the contact time for all cases except for the 0.05 mm roughness was approximately 22 ms. Moreover, the difference in the maximum diameter among these cases was minimal, ranging from 0 to 0.24 mm. It was found that with the increase of the Δl, the amplitude (n ≥ 2) values presented a decreasing trend during stage II. Noteworthily, an increase in the roughness height led to a slight reduction in the number of spreading cycles observed. Meanwhile, the contact time, which was influenced by the interruptions caused by surface roughness, showed a tendency to increase with higher Δl. These findings were found to be in good agreement with the results of the study conducted by Negeed et al.59 This could be the main reason that the kinetic energy dissipation was promoted with a higher viscosity on the surface Δl = 0.5 mm.
Figure 12.
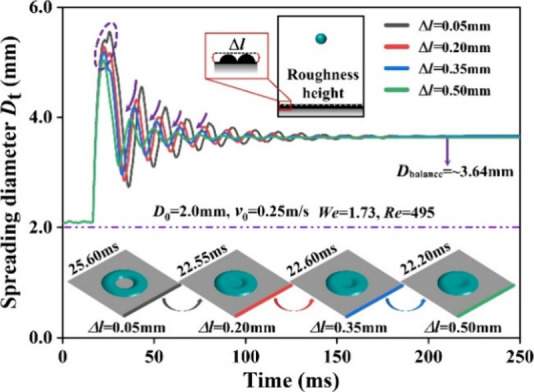
Comparisons of 4 roughness heights with We = 1.73 and Re = 495.
3.2. Wettability Characteristics
In this section, the focus was shifted toward the effect of dynamic spreading behaviors on the wettability characteristics. The wetting characteristic was sensitive to the equilibrium contact angle (θ), which increased with decreased contact angle, as described in Equation 1. In order to describe the difference between results and the variable more intuitively, the normalized contact time t* = t/ttotal and dimensionless spreading factor β = Dt/D0 of the droplet were quantitatively characterized. As presented in Figure 13, the increase of the maximum spreading factor for D0 was found to be more pronounced compared to the v0 with the increase of We. Meanwhile, regarding a constant Weber number, different values of Δl could result in substantial differences in the spreading behavior.
Figure 13.
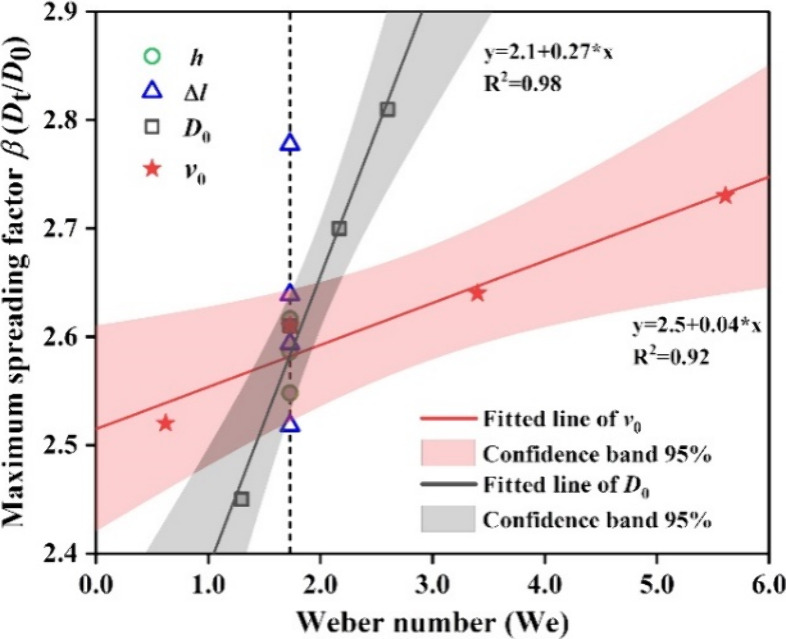
Effect of Weber number on the maximum spreading factor.
3.2.1. Wetting Mechanism of Spreading
In order to elucidate the effect of the spreading factor in conjunction with wettability, the mechanism of the spreading effect on the wettability progress was analyzed, as shown in Figure 14(a). Obviously, the coverage area of the droplet was a vital parameter besides the contact angle and composition in Table 1 when examining the droplet dynamics.60 The variety of coverage areas depended on the spreading diameter, as shown in Equation 2. Figure 14(b) demonstrates some representative droplet morphologies at some critical t* values on 4 different roughness surfaces. This information mattered considerably for understanding the spreading of the droplet and the progression of wetting, particularly for forecasting the wettability efficiency.
Figure 14.
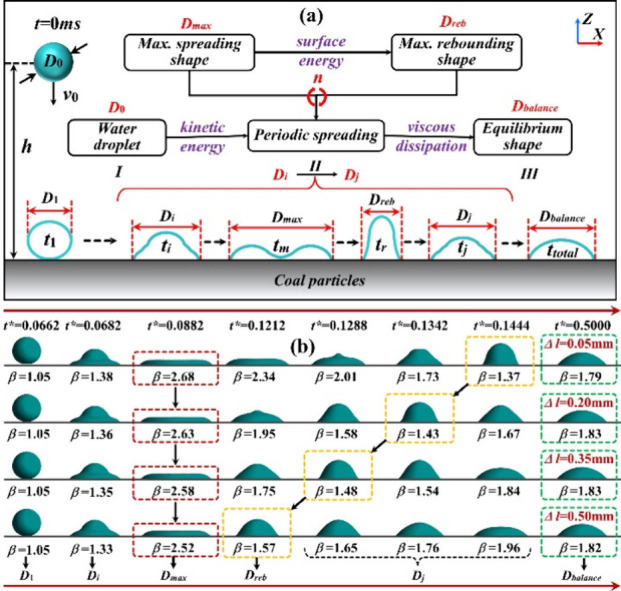
(a) Mechanism of the spreading effect on the wettability progress; (b) The spreading droplet morphology on 4 different roughness surfaces with an initial diameter D0 of 2.0 mm.
From the perspective of energy balance, when the water droplet was mainly induced by the kinetic energy impacted on the rough surface, the droplet spread, as described in Figure 8. The initial kinetic energy of the droplet and the gravitational forces were consumed by viscous dissipation, which, along with the energy from spreading, was irreversibly converted into the wetting heat. The equilibrium shape was finally achieved through several periodic energy dissipations, which corresponded to the number of cycles (n). Therefore, the spreading effect on the wettability characteristics was mainly attributed to the energy dissipation in stage II and the resulting coverage area.
3.2.2. Effects on the Wetting Efficiency of the Spreading Parameters
To further evaluate the wettability characteristics, the dimensionless wetting efficiency was hereby adopted to quantitatively describe the wetting agent given by
| 12 |
Where S0 represents the projection area with initial diameter D0; Smax-n is the spreading area with the maximum spreading diameter in each cycle, whereas n is the number of cycles; and Sbalance denotes the coverage area with the droplet reaching a stable shape. Following that, the spreading factor β was substituted into Equation 2, and the governing equation for wetting efficient η could be rewritten as
| 13 |
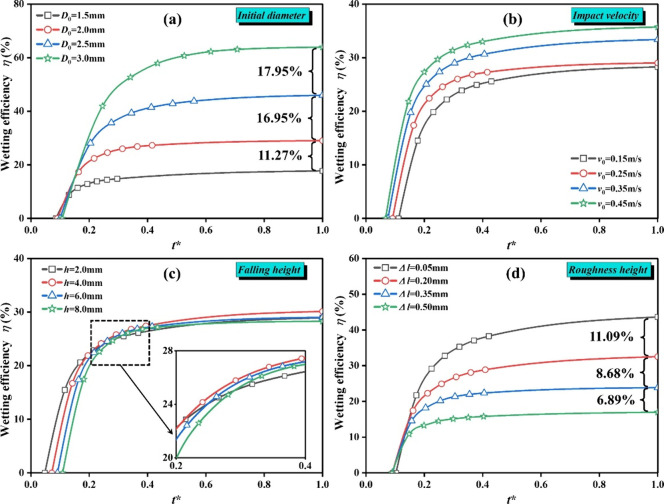
Figure 15 depicts the simulated results under different conditions at a constant CA = 54° surface. It was observed that as the contact time increased, the wetting efficiency η increased rapidly at a higher rate from the No. 1 period to No. 2, implying that more energy dissipation was converted to the wetting heat. After that (n ≥ 3), the wetting efficient η gradually weakened. Furthermore, it could be concluded that the droplet spreading wettability was mainly dominated by the surface tension force, outweighing the viscous dissipation and kinetic energy.
Figure 15.
Wetting efficiency at a constant CA = 54° surface with different (a) initial diameters, (b) impact velocities, (c) falling heights, and (d) roughness heights.
For the initial diameter case shown in Figure 15(a), the η increased with the initial diameter ranging from 1.5 mm to 3.0 mm, and then remained almost unchanged when the t* reached a certain value. The difference in the η values was obvious, and the values were 11.27%, 16.95%, and 17.95%, respectively. As shown in Figure 15(b), the η remained constant after 0.4, indicating the equilibrium shape of the droplet. Moreover, when the v0 raised from 0.2m/s to 0.3m/s, a relative higher η increased with the increase of the t* value. In addition, Figure 15(c) presents the simulation results of the falling height. It was observed that as the t* increased, the wetting efficiency followed a very similar trend, especially when 0.2 < t* < 0.4. The similar value of η at t* = 1 about 28.5% might suggest that the gravitational force had mild effects on the wettability characteristics. As described in the Wenzel model, the wettability was directly related to roughness conditions.61,62 It was also observed that as t* increased, η increased due to the decrease of the roughness height, as presented in Figure 15(d). The difference was promoted from zero to 6.89%, 8.68, and 11.09% as the Δl increased to 0.5 mm. Hence, the simulated wetting efficiency indicated that both the initial diameter and roughness conditions had profound effects on the spreading wettability.
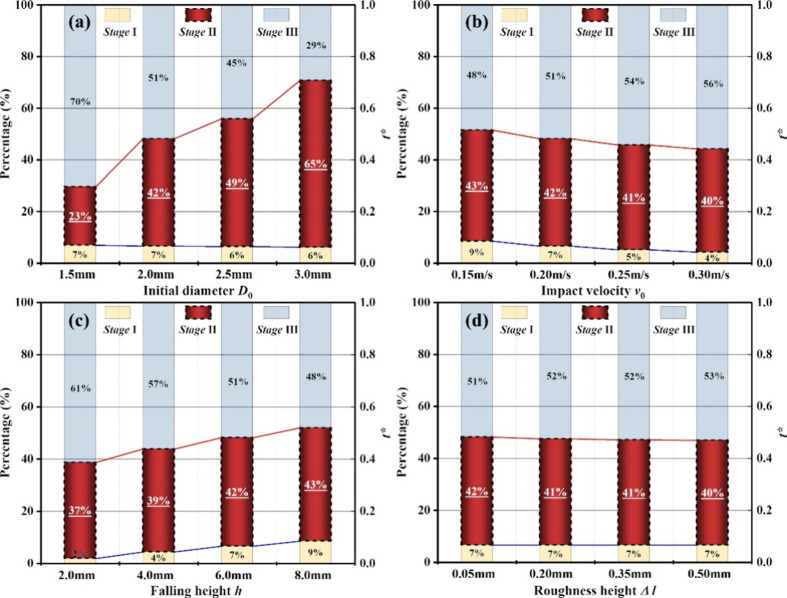
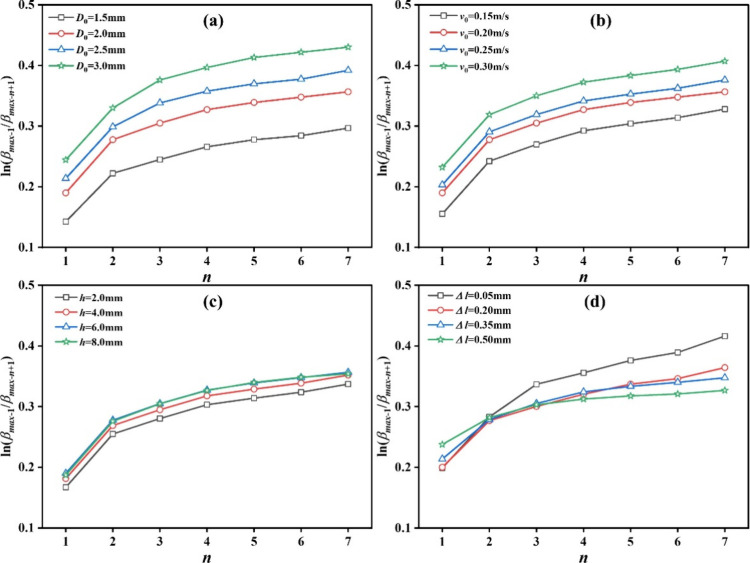
As discussed above, it could be concluded that the wetting efficiency η was significantly influenced by the dynamic spreading behaviors of droplets. This occurred because the wettability was related to the wetting time and attenuation coefficient of the spreading diameter. According to the diffusion theory reported by Zou et al. in 2018, the increase of the wetting time in stage II could promote the wetting ability.63 As shown in Figure 16, the percentage of the wetting time in stage II was increased by about 3 times as the initial diameter increased from 1.5 mm to 3.0 mm. However, a slight difference less than 6.0% was observed in Figures 16(b) and (c). While this percentage in Figure 16(d) retained a similar value of about 41%, the attenuation coefficient of the spreading diameter ln(βmax-1/βmax-n+1) increased with the number of circles, as shown in Figure 17. Whereas the value of the attenuation coefficient represented the energy dissipation in the spreading progress. Therefore, synthesizing all the findings made it possible to elucidate the wettability from an additional perspective. For example, no significant difference between h = 6.0 mm and h = 8.0 mm in Figure 17(c) could offer a compelling interpretation that supported the discussion regarding the outcomes depicted in Figure 15(c).
Figure 16.
Time percentage in different stages: (a) initial diameter, (b) impact velocity, (c) falling height, and (d) roughness height.
Figure 17.
Attenuation coefficient of the spreading diameter, (a) initial diameter, (b) impact velocity, (c) falling height, and (d) roughness height.
4. Conclusions
In this research investigation, the dynamic spreading behavior and wettability characteristics were revealed and analyzed. The numerical methodology was validated by the results of the numerical, calculated, and experimental contact angles. The main conclusions were as follows:
-
(1)
The amplitude values diminished progressively as the contact time extended throughout the 7 cycles in stage II. In stage III, the wetting ability could be predicted by a constant spreading diameter, referred to as Dbalance.
-
(2)
The No. 1 max-spreading diameter Dmax-1 enlarged due to an increase in the initial diameter D0. The period of damping movement increased significantly with the trend of D0, and decreased gently during further spreading in stage II. The D0 could effectively amplify the coverage area and prolong the spreading time during stage II.
-
(3)
The first amplitude of Dmax-1 was remarkably higher as the impact velocity increased, corresponding to a greater amount of kinetic energy. The max-spreading shape was improved with higher impact velocities, resulting in a thinner and larger coverage area.
-
(4)
The falling height had a significant spreading effect mainly in the Dmax-1 and contact time, but the increased trend of wetting efficiency was not obvious.
-
(5)
The amplitude (n ≥ 2) values presented a decreasing trend during stage II with the increase of the roughness height Δl. The number of cycles reduced with higher Δl. Meanwhile, the contact time, which was disrupted by the surface roughness, showed a tendency to increase with higher Δl.
-
(6)
The spreading effect on wettability characteristics was mainly attributed to the energy dissipation in stage II and the coverage area. The droplet spreading wettability was mainly dominated by the surface tension force to outweigh the viscous dissipation and kinetic energy.
Acknowledgments
This research project was funded by the Research Start-up Funds for Shanxi College of Technology; Shanxi Province Higher Education Science and Technology Innovation Project (2023L424); Major Technological Research Projects of Shanxi Coking Coal Group Co. Ltd. (No.201812xs06); Opening Project of State Key Laboratory of Explosion Science and Technology, Beijing Institute of Technology (KFJJ19-03M). The authors would particularly like to express their gratitude for the Shanxi Natural Science Foundation Youth Program (202403021212128).
Author Contributions
Yan Jingjing: Conceptualization, Methodology, Resources, Writing - review and editing, Supervision. Li Yifang: Methodology, Software, Formal analysis, Investigation, Data curation, Writing-Original Draft. Wang Fei: Methodology, Resources, Writing - review and editing. Li Junpeng: Data curation, Writing - review and editing. Liu Hongwei: Formal analysis, Writing - review and editing. Pei Zhengyu: Writing - review and editing. Gao Haidong: Writing - review and editing.
The authors declare no competing financial interest.
References
- Trechera P.; Moreno T.; Cordoba P.; Moreno N.; Zhuang X.; Li B.; Li J.; Shangguan Y.; Kandler K.; Dominguez A. O.; et al. Mineralogy, geochemistry and toxicity of size-segregated respirable deposited dust in underground coal mines. Journal of Hazardous Materials 2020, 399, 122935. 10.1016/j.jhazmat.2020.122935. [DOI] [PubMed] [Google Scholar]
- Wang H.; Zhang L.; Wang D.; He X. Experimental investigation on the wettability of respirable coal dust based on infrared spectroscopy and contact angle analysis. Advanced Powder Technology 2017, 28 (12), 3130–3139. 10.1016/j.apt.2017.09.018. [DOI] [Google Scholar]
- Guanhua N.; Hongchao X.; Shang L.; Qian S.; Dongmei H.; Yanying C.; Ning W. The effect of anionic surfactant (SDS) on pore-fracture evolution of acidified coal and its significance for coalbed methane extraction. Advanced Powder Technology 2019, 30 (5), 940–951. 10.1016/j.apt.2019.02.008. [DOI] [Google Scholar]
- Wang Z.; Ren T. Investigation of airflow and respirable dust flow behaviour above an underground bin. Powder Technol. 2013, 250, 103–114. 10.1016/j.powtec.2013.08.045. [DOI] [Google Scholar]
- Wang P.; Shi Y.; Zhang L.; Li Y. J. P. S.; Protection E. Effect of structural parameters on atomization characteristics and dust reduction performance of internal-mixing air-assisted atomizer nozzle. Process Safety and Environmental Protection 2019, 128, 316. 10.1016/j.psep.2019.06.014. [DOI] [Google Scholar]
- Bao Q.; Nie W.; Liu C.; Zhang H.; Wang H.; Jin H.; Yan J.; Liu Q. The preparation of a novel hydrogel based on crosslinked polymers for suppressing coal dusts. Journal of Cleaner Production 2020, 249, 119343. 10.1016/j.jclepro.2019.119343. [DOI] [Google Scholar]
- Yao Q.; Xu C.; Zhang Y.; Zhou G.; Zhang S.; Wang D. Micromechanism of coal dust wettability and its effect on the selection and development of dust suppressants. Process Safety and Environmental Protection 2017, 111, 726–732. 10.1016/j.psep.2017.08.037. [DOI] [Google Scholar]
- Yin B.; Sun M.; Zhu W.; Yang L.; Zhou Y. Wetting and spreading behaviour of molten CMAS towards thermal barrier coatings and its influencing factors. Results in Physics 2021, 26, 104365. 10.1016/j.rinp.2021.104365. [DOI] [Google Scholar]
- Shi G. Q.; Qi J. M.; Wang Y. M.; Shen H. Y. Synergistic influence of noncationic surfactants on the wettability and functional groups of coal. Powder Technol. 2021, 385, 92–105. 10.1016/j.powtec.2021.02.056. [DOI] [Google Scholar]
- Werner S. R. L.; Jones J. R.; Paterson A. H. J.; Archer R. H.; Pearce D. L. Droplet impact and spreading: Droplet formulation effects. Chem. Eng. Sci. 2007, 62 (9), 2336–2345. 10.1016/j.ces.2006.12.024. [DOI] [Google Scholar]
- Yarin A. L. DROP IMPACT DYNAMICS: Splashing, Spreading, Receding, Bouncing. Annu. Rev. Fluid Mech. 2006, 38 (1), 159–192. 10.1146/annurev.fluid.38.050304.092144. [DOI] [Google Scholar]
- Azmi W. H.; Sharma K. V.; Mamat R.; Najafi G.; Mohamad M. S. The enhancement of effective thermal conductivity and effective dynamic viscosity of nanofluids - A review. Renewable Sustainable Energy Reviews 2016, 53, 1046–1058. 10.1016/j.rser.2015.09.081. [DOI] [Google Scholar]
- Hu M.; Zhou J.; Li Y.; Zhuo X.; Jing D. Effects of the surface wettability of nanoparticles on the impact dynamics of droplets. Chem. Eng. Sci. 2021, 246, 116977. 10.1016/j.ces.2021.116977. [DOI] [Google Scholar]
- Zhao P.; Hargrave G. K.; Versteeg H. K.; Garner C. P.; Reid B. A.; Long E. J.; Zhao H. The dynamics of droplet impact on a heated porous surface. Chem. Eng. Sci. 2018, 190, 232–247. 10.1016/j.ces.2018.06.030. [DOI] [Google Scholar]
- Ebrahim M.; Ortega A. An Experimental Technique for Accelerating a Single Liquid Droplet to High Impact Velocities against a Solid Target Surface using a Propellant Gas. Experimental Thermal and Fluid Science 2017, 81, 202–208. 10.1016/j.expthermflusci.2016.10.019. [DOI] [Google Scholar]
- Qin Y.; Guo Q.; Chen R.; Zhuang Y.; Wang Y. Numerical investigation of water droplet impact on PEM fuel cell flow channel surface. Renewable Energy 2021, 168, 750–763. 10.1016/j.renene.2020.12.075. [DOI] [Google Scholar]
- Xu Y.; Vincent S.; He Q. C.; Le-Quang H. J. E. Spread and recoil of liquid droplets impacting on solid surfaces with various wetting properties. Surface and Coatings Technology 2019, 357, 140. 10.1016/j.surfcoat.2018.09.079. [DOI] [Google Scholar]
- Wang Y.; Gratadeix A.; Do-Quang M.; Amberg G. Events and conditions in droplet impact: A phase field prediction. International Journal of Multiphase Flow 2016, 87, 54–65. 10.1016/j.ijmultiphaseflow.2016.08.009. [DOI] [Google Scholar]
- Ferrão I.; Vasconcelos D.; Ribeiro D.; Silva A.; Barata J. A study of droplet deformation: The effect of crossflow velocity on jet fuel and biofuel droplets impinging onto a dry smooth surface. Fuel 2020, 279, 118321. 10.1016/j.fuel.2020.118321. [DOI] [Google Scholar]
- Vaikuntanathan V.; Sivakumar D. Maximum Spreading of Liquid Drops Impacting on Groove-Textured Surfaces: Effect of Surface Texture. Langmuir 2016, 32 (10), 2399–2409. 10.1021/acs.langmuir.5b04639. [DOI] [PubMed] [Google Scholar]
- Liu X.; Zhang X.; Min J. J. P. o. F. Maximum spreading of droplets impacting spherical surfaces. Physics Fluids 2019, 31 (9), 092102. 10.1063/1.5117278. [DOI] [Google Scholar]
- Cai C.; Si C.; Liu H.; Yin H. Influence of alcohol additive and surface temperature on impact and spreading characteristics of a single water droplet. International Journal of Heat and Mass Transfer 2021, 180, 121795. 10.1016/j.ijheatmasstransfer.2021.121795. [DOI] [Google Scholar]
- Vincent S.; Bot C. L.; Sarret F.; Meillot E.; Caltagirone J. P.; Bianchi L. J. C. Fluids, Penalty and Eulerian-Lagrangian VOF methods for impact and solidification of metal droplets plasma spray process. Computers Fluids 2015, 113, 32. 10.1016/j.compfluid.2014.10.004. [DOI] [Google Scholar]
- Qi Z.; Liao L.; Wang R.-y.; Zhang Y.-g.; Yuan Z.-f. Roughness-dependent wetting and surface tension of molten lead on alumina. Transactions of Nonferrous Metals Society of China 2021, 31 (8), 2511–2521. 10.1016/S1003-6326(21)65671-6. [DOI] [Google Scholar]
- Bai Y.; Zhang F.; Xu K.; Wang X.; Wang C.; Zhang H.; Tan Y.; Wang P. Pickering emulsion strategy to control surface wettability of polymer microspheres for oil-water separation. Appl. Surf. Sci. 2021, 566, 150742. 10.1016/j.apsusc.2021.150742. [DOI] [Google Scholar]
- Wang L.; Feng J.; Dang T.; Peng X. Dynamics of oil droplet impacting and wetting on the inclined surfaces with different roughness. International Journal of Multiphase Flow 2021, 135, 103501. 10.1016/j.ijmultiphaseflow.2020.103501. [DOI] [Google Scholar]
- Tang C.; Qin M.; Weng X.; Zhang X.; Zhang P.; Li J.; Huang Z. Dynamics of droplet impact on solid surface with different roughness. International Journal of Multiphase Flow 2017, 96, 56–69. 10.1016/j.ijmultiphaseflow.2017.07.002. [DOI] [Google Scholar]
- Zhang W.; Liu N.; Cao Y.; Lin X.; Liu Y.; Feng L. Superwetting Porous Materials for Wastewater Treatment: from Immiscible Oil/Water Mixture to Emulsion Separation. Advanced Materials Interfaces 2017, 4 (10), 1600029. 10.1002/admi.201700029. [DOI] [Google Scholar]
- Bussmann M.; Mostaghimi J.; Chandra S. On a Three-Dimensional Volume Tracking Model of Droplet Impact. Phys. Fluids 1999, 11, 1406–1417. 10.1063/1.870005. [DOI] [Google Scholar]
- Lee T.; Liu L. Lattice Boltzmann simulations of micron-scale drop impact on dry surfaces. J. Comput. Phys. 2010, 229 (20), 8045–8063. 10.1016/j.jcp.2010.07.007. [DOI] [Google Scholar]
- Warren P. B. Vapor-liquid coexistence in many-body dissipative particle dynamics. Physical review. E, Statistical, nonlinear, and soft matter physics 2003, 68 (6), 066702. 10.1103/PhysRevE.68.066702. [DOI] [PubMed] [Google Scholar]
- Shen M.; Li B. Q.; Yang Q.; Bai Y.; Wang Y.; Zhu S.; Zhao B.; Li T.; Hu Y. A Modified Phase-Field Three-dimensional Model for Droplet Impact with Solidification. Int. J. Multiphase Flow 2019, 116, 51. 10.1016/j.ijmultiphaseflow.2019.04.004. [DOI] [Google Scholar]
- Zanutto C. P.; Paladino E. E.; Evrard F.; van Wachem B.; Denner F. Modeling of interfacial mass transfer based on a single-field formulation and an algebraic VOF method considering non-isothermal systems and large volume changes. Chemical Engineering Science 2022, 247, 116855. 10.1016/j.ces.2021.116855. [DOI] [Google Scholar]
- Zhang D.; Takase S.; Nagayama G. Measurement of effective wetting area at hydrophobic solid-liquid interface. Journal of Colloid and Interface Science 2021, 591 (13), 474. 10.1016/j.jcis.2021.01.056. [DOI] [PubMed] [Google Scholar]
- Malgarinos I.; Nikolopoulos N.; Gavaises M. J. I. J. o. H.; Flow F. A numerical study on droplet-particle collision dynamics. International Journal of Heat and Fluid Flow 2016, 61, 499–509. 10.1016/j.ijheatfluidflow.2016.06.010. [DOI] [Google Scholar]
- Rbihi S.; Aboulouard A.; Laallam L.; Jouaiti A. Contact Angle Measurements of Cellulose based Thin Film composites: wettability, surface free energy and surface hardness. Surfaces and Interfaces 2020, 21, 100708. 10.1016/j.surfin.2020.100708. [DOI] [Google Scholar]
- Sang F.; Yan S.; Wang G.; Ma Z.; Li J.; Ju S. The effect of microemulsion on coal wetting characteristics and physicochemical structure. Colloid and Interface Science Communications 2020, 39, 100335. 10.1016/j.colcom.2020.100335. [DOI] [Google Scholar]
- Majhy B.; Singh V. P.; Sen A. K. Understanding wetting dynamics and stability of aqueous droplet over superhydrophilic spot surrounded by superhydrophobic surface. J. Colloid Interface Sci. 2020, 565, 582–591. 10.1016/j.jcis.2020.01.056. [DOI] [PubMed] [Google Scholar]
- Singh D.; Kumar A. Numerical and experimental analysis of rapid solidification considering undercooling effect during water droplet impact on a substrate. Thermal Science and Engineering Progress 2020, 20, 100722. 10.1016/j.tsep.2020.100722. [DOI] [Google Scholar]
- Salama A. Investigation of the onset of the breakup of a permeating oil droplet at a membrane surface in crossflow filtration: A new model and CFD verification. International Journal of Multiphase Flow 2020, 126, 103255. 10.1016/j.ijmultiphaseflow.2020.103255. [DOI] [Google Scholar]
- Chaves I. L.; Duarte L. C.; Coltro W. K. T.; Santos D. A. Droplet length and generation rate investigation inside microfluidic devices by means of CFD simulations and experiments. Chem. Eng. Res. Des. 2020, 161, 260–270. 10.1016/j.cherd.2020.07.015. [DOI] [Google Scholar]
- Luo J.; Wu S.-Y.; Xiao L.; Chen Z.-L. Hydrodynamics and heat transfer of multiple droplets successively impacting on cylindrical surface. Int. J. Heat Mass Transfer 2021, 180, 121749. 10.1016/j.ijheatmasstransfer.2021.121749. [DOI] [Google Scholar]
- Brackbill J. U.; Kothe D. B.; Zemach C. J. A continuum method for modeling surface tension. Journal of Computational Physics 1992, 100, 335. 10.1016/0021-9991(92)90240-Y. [DOI] [Google Scholar]
- Yin S.; Huang Y.; Wong T. N.; Ooi K. T. Dynamics of droplet in flow-focusing microchannel under AC electric fields. International Journal of Multiphase Flow 2020, 125, 103212. 10.1016/j.ijmultiphaseflow.2020.103212. [DOI] [Google Scholar]
- Jiang Y.; Yang Z.; Xu X.; Xie B.; Duan J. Spreading model of single droplet impacting the banana leaf surface and computational fluid dynamics simulation analysis. Computers and Electronics in Agriculture 2024, 223, 109113. 10.1016/j.compag.2024.109113. [DOI] [Google Scholar]
- Du Z.; Shan Y.; Wang H. Influence of thermostat on droplet spreading in molecular dynamics simulations. J. Mol. Liq. 2024, 396, 123936. 10.1016/j.molliq.2023.123936. [DOI] [Google Scholar]
- Yang J.; Gao M.; Sun H.; Liu Z.; Zhang K. Simulation of the dynamic behavior of droplet impact on the microstructure surface. Journal of Physics: Conference Series 2023, 2441 (1), 012064. 10.1088/1742-6596/2441/1/012064. [DOI] [Google Scholar]
- Deendarlianto; Takata Y.; Kohno M.; Hidaka S.; Wakui T.; Majid A. I.; Kuntoro H. Y.; Indarto; Widyaparaga A. The effects of the surface roughness on the dynamic behavior of the successive micrometric droplets impacting onto inclined hot surfaces. Int. J. Heat Mass Transfer 2016, 101, 1217–1226. 10.1016/j.ijheatmasstransfer.2016.05.132. [DOI] [Google Scholar]
- Chen X.; Du A.; Liang K.; Li Z.; Zhang M.; Yang C.; Wang X. Interaction between droplet impact and surface roughness considering the effect of vibration. Int. J. Heat Mass Transfer 2024, 220, 125018. 10.1016/j.ijheatmasstransfer.2023.125018. [DOI] [Google Scholar]
- Li J.; Zhao C.; Wang C. Experimental study on the dynamics of droplet impacting on solid surface. Microfluid. Nanofluid. 2023, 27 (10), 69. 10.1007/s10404-023-02680-1. [DOI] [Google Scholar]
- Zhou J.; Shi X.; Liu J.; Jing D. Regulation of droplet dynamic behavior after droplet impact on superhydrophobic surfaces. Colloids Surf., A 2024, 685, 133211. 10.1016/j.colsurfa.2024.133211. [DOI] [Google Scholar]
- Yang D.; Li M.; Yun Q.; Sun H.; Li Q.; Gao X.; Chen C.; He L. Falling, deformation, and coalescence of droplet in model waxy oil under an electric field. Chem. Eng. Res. Des. 2024, 205, 376–387. 10.1016/j.cherd.2024.04.012. [DOI] [Google Scholar]
- Abedsoltan H. A review on liquid flow through low-density fibrous porous media. Chem. Eng. Res. Des. 2023, 200, 445–455. 10.1016/j.cherd.2023.10.058. [DOI] [Google Scholar]
- Banitabaei S. A.; Amirfazli A. Droplet impact onto a solid sphere: Effect of wettability and impact velocity. Phys. Fluids 2017, 29 (6), 062111. 10.1063/1.4990088. [DOI] [Google Scholar]
- Laan N.; de Bruin K. G.; Bartolo D.; Josserand C.; Bonn D. Maximum Diameter of Impacting Liquid Droplets. Physical Review Applied 2014, 2 (4), 044018. 10.1103/PhysRevApplied.2.044018. [DOI] [Google Scholar]
- Lin S.; Zhao B.; Zou S.; Guo J.; Wei Z.; Chen L. Impact of viscous droplets on different wettable surfaces: Impact phenomena, the maximum spreading factor, spreading time and post-impact oscillation. Journal of Colloid and Interface Science 2018, 516, 86. 10.1016/j.jcis.2017.12.086. [DOI] [PubMed] [Google Scholar]
- Simhadri Rajesh R.; Naveen P. T.; Krishnakumar K.; Kumar Ranjith S. Dynamics of single droplet impact on cylindrically-curved superheated surfaces. Experimental Thermal and Fluid Science 2019, 101, 251. 10.1016/j.expthermflusci.2018.10.011. [DOI] [Google Scholar]
- Luo J.; Wu S. Y.; Xiao L.; Chen Z. L. Parametric influencing mechanism and control of contact time for droplets impacting on the solid surfaces. Int. J. Mech. Sci. 2021, 197, 106333. 10.1016/j.ijmecsci.2021.106333. [DOI] [Google Scholar]
- Negeed E.-S. R.; Hidaka S.; Kohno M.; Takata Y. Effect of the surface roughness and oxidation layer on the dynamic behavior of micrometric single water droplets impacting onto heated surfaces. Int. J. Therm. Sci. 2013, 70, 65–82. 10.1016/j.ijthermalsci.2013.03.004. [DOI] [Google Scholar]
- Malgarinos I.; Nikolopoulos N.; Gavaises M. A numerical study on droplet-particle collision dynamics. International Journal of Heat and Fluid Flow 2016, 61, 499–509. 10.1016/j.ijheatfluidflow.2016.06.010. [DOI] [Google Scholar]
- Yonemoto Y.; Kunugi T. Estimating critical surface tension from droplet spreading area. Phys. Lett. A 2020, 384 (10), 126218. 10.1016/j.physleta.2019.126218. [DOI] [Google Scholar]
- Paxson A. T.; Varanasi K. K. Self-similarity of contact line depinning from textured surfaces. Nat. Commun. 2013, 4 (1), 1492. 10.1038/ncomms2482. [DOI] [PMC free article] [PubMed] [Google Scholar]
- Zou C.; Sun X.; Xu C.; Li X.; Xiao S.; Deng H.; Gao F.; Hu W. Wetting characteristics of lithium droplet on iron surfaces in atomic scale: A molecular dynamics simulation. Comput. Mater. Sci. 2018, 149, 435–441. 10.1016/j.commatsci.2018.03.058. [DOI] [Google Scholar]


