

Abstract
The most prominent and persistent feature of the eastern Mediterranean Levantine Basin (LB) is the warm anticyclonic Cyprus Eddy (CE) located above the Eratosthenes Seamount (ESM). This eddy periodically couples with two smaller cyclonic and anticyclonic eddies, the South Shikmona Eddy (SSE) and North Shikmona Eddy (NSE), which form downstream. The reason for the zonal drift of the CE center and the formation mechanism of the CE, SSE and NSE is largely debated today, yet the upwelling and biological productivity of the LB can be strongly impacted by the local dynamics. Using a variety of research methods—theory, models, laboratory and field experiments—we demonstrate that the CE is an anticyclonic Taylor column generated by the eastward Mid Mediterranean Jet (MMJ) impinging over the ESM. When the center of the CE is west of 32.7° E, a Rossby wave with embedded cyclonic and anticyclonic vortices corresponding to the SSE and NSE, respectively, forms downstream. The position of the CE center reveals to be dependent on the intensity of the MMJ and thus on the cyclonic/anticyclonic mode of the North Ionian Gyre. Our results highlight the key role the central Mediterranean Sea plays on LB, and can be used to predict the Easter Mediterranean Sea mesoscale dynamics up to about three years in advance. They also show how Rossby waves can trigger the transport of nutrient-rich coastal waters offshore, a mechanism that is of paramount importance for the oligotrophic environment of the LB. The coherent results from our multi-approach research underscore the uniqueness and reliability of our findings.
Keywords: Cyprus eddy, Rossby waves, Levantine Basin, Stratified beta plane, Laboratory experiments, Mid Mediterranean Jet, North Ionian Gyre
Subject terms: Physical oceanography, Ocean sciences
Introduction
The eastern Mediterranean features a complex system of meandering jets, currents and eddies that interact dynamically. The seasonal variability of the stratification and the presence of the coast along Israel, Lebanon and Egypt acting as a barrier and/or as a source of eddies (through barotropic and/or baroclinic instability), further complicate thedynamic of the area1
In the north-western part of the Levantine Basin (LB), the cyclonic Rhodes Gyre is located between the islands of Cyprus, Rhodes and Crete (Fig. 1), bordered by the westward Asia Minor Current to the north and by the eastward cross-basin meandering current named Mid-Mediterranean Jet2–6, (MMJ). The latter, flowing from ∼ 24° E to southeast of Cyprus, advects the Atlantic Water to the LB, potentially generating mesoscale features. The MMJ varies on a seasonal and interannual scale and its variability along with the volume of Atlantic Water transferred to the LB, follows the cyclonic-anticyclonic regime of the North Ionian Gyre4,7–9(NIG), a permanent feature of the central Ionian Sea with a switching mode on a quasi-decadal scale10,11. The eastern LB hosts a non-permanent, multi-pole Shikmona Gyre system, consisting of three anticyclonic eddies12–14: one offshore Israel-Lebanon, a second close to the Eratosthenes seamount (ESM) and a third one offshore Egypt (MMG, not discussed hereafter).
Fig. 1.

Absolute Dynamics Topography (ADT) of the Central and Eastern Mediterranean Sea averaged for the period January-May 2015. Black arrow indicates the Mid Mediterranean Jet (MMJ) and the Asia Minor Current (AMC). Red circles indicate anticyclonic eddies: Pelops Gyre (PG), Marsa Matrouh gyre (MMG), Cyprus Eddy (CE), North Shikmona Eddy (NSE), and North Ionian Gyre (NIG) anticyclonic mode. White circles indicate cyclonic eddies: Rhodes gyre (RG), South Shikmona Eddy (SSE) and the NIG cyclonic mode. Spatially averaged low-passed filtered (13 months) current vorticity has been computed for the blue box area (37–39.5° N; 17–19.5° E) while the incoming flow Uo averaged in the upper 1000 m was computed across the Sect. 33–34° N, 31° E highlighted by the gray vertical line. The topography of the Levantine Basin is shown in the upper corner of the figure, where the white diamond highlights the ESM summit.
The anticyclonic North Shikmona Eddy (NSE, Fig. 1) offshore Israel-Lebanon, first identified by the Physical Oceanography of the Eastern Mediterranean (POEM) group in the late 1980s13,15,16, was later confirmed by in-situ glider measurements described by Mauri et al.17. This eddy, with a center located between 34° – 35° E, is believed to form due to the instability of the northward slope current flowing along the Israeli-Lebanese coast5 and it is periodically observed as reported by Özsoy et al.18. A nearby cyclonic eddy, the South Shikmona Eddy (SSE), was detected west of the NSE during the same glider field campaign.
The anticyclonic eddy near the ESM is known as Cyprus Eddy19,20(CE) although in the literature sometimes it is referred to as Cyprus Gyre21,22. First observed southeast of Cyprus island in 198323,24, its diameter can be as large as 120 km6,25, with a vertical extension of approximately 800 m of depth17. The CE is believed to be topographically trapped by the combined effects of the island of Cyprus, the ESM, and the coast of Lebanon23. Described as a transient or recurrent feature13,15,16, its center migrates seasonally between 33.25° – 33.5° N and 31.75° – 33° E with average coordinate of 33.5° N, 33° E6,26,27. For instance, Brenner20 noted its presence at the end of 1985-early 1986, centered around 34° N, 34° E. Zodiatis et al.14revealed that during the period 1996–1997, the CE center was located between 33° – 34° E, about 55 km westward from the position reported by Brenner19,20. However, between 2001–2007, the CE shifted to the west (~ 32° E) allowing space to form meandering wakes with eddies. This westward-eastward shifting of the CE center has been connected to the appearance of the anticyclonic NSE, which forces the CE to migrate west and away from the ESM area14,19,25.
The exact causes of the CE center migration and the generation mechanisms of CE, NSE and SSE remain today unresolved and largely debated. A recent numerical study by Egorova et al.28linked the formation of the CE to the growth of non-axisymmetric perturbations over a hollow-mount system in the broader area of the ESM. Their analytical solutions for a homogeneous ocean predict the CE center southwest of this system while, for a three-layer stratified ocean, their model results indicate that the CE formation is not affected by the angle of the flow, and high velocities in the vicinity of the ESM prevent its formation29.
In previous studies, the formation of an anticyclonic eddy above a sea-mountain on a ß (the Rossby parameter) and f (the Coriolis parameter) plane, along with downstream cyclonic-anticyclonic eddies, has been addressed theoretically, numerically, and experimentally in both homogeneous and stratified flows30–39. McCartney’s analytical solutions37showed that an anticyclonic Taylor column forms above a submerged bump, and under specific inflow conditions, a stationary meandering wake with embedded eddies develops downstream (see also McCartney36 and Pirro et al.40). Numerical simulations by Verron and Provost39 suggest that this wake is a standing Rossby wave with group velocity approximately equal to the incoming flow.
The present study aims to define the physical mechanism behind the CE formation and link its variability to the Central and Eastern Mediterranean Sea dynamics through laboratory experiments, theory, numerical models and in-situ products. It shows that the CE is an anticyclonic Taylor column generated by the eastward MMJ impinging over the ESM, which rises from 2.5 km depth to about 600 m below the sea surface, and has an averaged diameter of 80 km that varies with the latitude and the depth. The study also reveal that the downstream meandering wake exhibits characteristics of a standing Rossby wave, whose embedded cyclonic and anticyclonic eddies correspond to the SSE and NSE, respectively (Fig. 1). Furthermore, our findings establish a direct link between the CE center position and the intensity of the MMJ, which is regulated by the dynamics of the NIG. Laboratory experiments were conducted following the theoretical work of McCartney (1975). Considering ß-plane, homogeneous and stratified flow, along with topography height and the b parameter (which measures the dynamic importance of ß), these experiments were scaled based on in-situ ocean data and the results were further supported and validated by theory, numerical models, Argo floats, and glider data.
Results
Eddies tracking and Rossby waves analysis
The LB’s anticyclonic and cyclonic activity from 1993 to 2021 was assessed using the TOEddies algorithm, hereafter TOEddies41 (see the Methods and data section for more details) applied to the Absolute Dynamic Topography (ADT) derived from satellite altimetry. This aimed to identify periods when the CE surrounds the ESM (highlighted by a white diamond, Fig. 2), and to what extent the cyclonic and anticyclonic eddies downstream are related to the position of the CE center.
Fig. 2.

TOEddies algorithm results applied to the Absolute Dynamic Topography (ADT) between 1993 and 2021 in the Levantine Basin. (a,b) Percentage of time each grid cell (1/8° × 1/8°) is within an anticyclonic (left column) or a cyclonic (right column) eddy; the time when the CE was present was splitted in the west case (c-d), when the CE center is west of the ESM) and in the east case (e–f), when the CE is east of the ESM). The percentage shown for panels (c-f) is computed over the subsampled period. The characteristics of the CE for the west case (Center, Vmax , Rmax and Roe = Vmax/ f Rmax) with the standard deviation (std) are reported in Fig. 2c. The white diamond at 32.7° E, 33.7° N indicates the ESM summit.
Using the TOEddies database, we statistically analyzed the entire eddy field by calculating the percentage of days when each 1/8th degree cell is encompassed by anticyclonic (Fig. 2a) or cyclonic (Fig. 2b) eddies. The analysis found that the ESM is within an anticyclonic eddy (the CE) 52% of the time (Fig. 2a), and that a region centered around 34.5° E, 33.9° N and connected to the CE also locates within anticyclonic eddies (45% of the time; Fig. 2a). Conversely, the area at ~ 33.5° E, 33.8° N between these two anticyclonic regions experiences cyclonic vortices ~ 12% of the time (Fig. 2b).
Focusing on the period when the CE is present (52% of the total study period) we discriminated two cases: when the CE’s center is west (23% of the total study period; Figs. 2c-d) or east (29% of the total study period; Figs. 2e-f) of the ESM. In the west case (Fig. 2c), an anticyclonic region labeled G1 and centered at ~ 34.5° E, now appears to be separated from the CE by a cyclonic eddy labeled G2 and appearing 15 to 20% of the time (Fig. 2d). Conversely, when the center of the CE is located to the east of the ESM (Fig. 2e), the CE extends further eastward, leaving no space for the formation of the anticyclonic G1 vortex. This eastern extension may emphasize the connection between the CE and G1 (see Figs. 2a, 2c). Additionally, the area under the influence of the cyclonic eddy east of the CE also shifts eastward (34.5° E, 34° N) , occurring less frequently (8 to 10% of the time; Fig. 2f).
The above analysis highlights that when the CE’s center is located west of the ESM, a pronounced anticyclonic vortex G1 often occurs east of it, with a cyclonic eddy G2 between them. When the CE is east of the ESM, G1 is usually absent, and the cyclonic corridor becomes less active, shifting eastwards.
To investigate the spatio-temporal evolution of CE, G1 and G2, a time series correlation between the CE center (detected with TOEddies) and incoming velocity Uo averaged in the upper 1000 m depth at the section upstream of the ESM (33–34° N, 31° E; based on the ESM bathymetry) is presented in Fig. 3a. The daily time series of the CE longitude center (gray dots) and Uo (not shown) were filtered using a 13-month moving average (purple and black lines, respectively) to remove the seasonal variations of the signal. The analysis reveals a significant correlation (~ 0.62; p-value < 0.05; confidence level 95%, with a time lag close to zero) between the east/west shift of the CE center and the corresponding weakening/strengthening of the current.
Fig. 3.

(a) Time series of the low-pass filtered (13 months) incoming velocity Uo (normal velocity component across the gray transect of Fig. 1) at the Sect. 33–34° N, 31° E averaged in the upper 1000 m of depth (black line); time series of the low-pass filtered (13 months) CE longitude center detected with the TOEddies algorithm (purple line); daily longitude values of the CE center detected with the TOEddies algorithm (gray dots); daily longitude center of the cyclonic eddy G2 (red crosses) and anticyclonic eddy G1 (blue crosses) detected with the TOEddies algorithm; CE longitude center calculated from in-situ glider data (green diamonds). (b) Time series of the low-pass filtered (13 months) spatially averaged current vorticity (green line) computed in the Northern Ionian Sea (blue box in Fig. 1, 37–39° N; 17–19.5° E); solid orange and blue arrows indicate the decreasing and the increasing of the NIG vorticity, respectively; cyclonic and anticyclonic phases of the NIG are highlighted by the pink and white shaded areas, respectively. (c) Time series of the low-pass filtered (13 months) CE longitude detected with the TOEddies algorithm (purple line); dashed orange and blue arrows correspond to the solid arrows of the upper panel, respectively (one dashed blue arrow is missing since it is not yet occurred).
This correlation is clearly evident during two specific periods (1999–2005 and 2011–2017). During these times, the CE begins to move westward when Uo exceeds approximately 3 cm s⁻1, and it shifts eastward when Uo decreases from ~ 6.5 to 3 cm s⁻1 (Fig. 3a). The CE reached extreme western peaks at the end of 2002, with a longitude of 31.89° E, and at the end of 2015, with a longitude of 31.57° E.
Conversely, during 2007–2011, both curves display an in-phase correlation. The development of G2 and G1 eddies (red and blue crosses) primarily occurs when the CE is west of the ESM (as also shown in Fig. 2c-d), suggesting that the Israeli-Lebanese coast may limit their formation .
Previous studies based on satellite and in-situ data indicate that the variability of water volume advected to the LB through the MMJ are regulated by the cyclonic and anticyclonic mode of the NIG7,8,10,21, which increases/reduces the inflow of waters in the LB from the Ionian Sea. A correlation study between the timeseries of the NIG vorticity7,8,42,43 and the time series of the CE longitude center (Fig. 3b-c) reveals a significant anti-correlation between the two curves (correlation ~-0.6; p-value < 0.05; confidence level 95%), with a time lag of approximately 36 months. A decrease in vorticity (highlighted by the solid orange arrow) corresponds to the eastward shift of the CE center (dashed orange line) after about 3 years. Conversely, an increase in vorticity results in a westward shift of the CE center (solid and dashed blue arrows). Major westward shifts of the CE center began in early 1999 and 2011, both associated with preceding increases in negative vorticity during the anticyclonic phase. Thus, as the NIG transitions from an anticyclonic to a cyclonic mode, its effects on the CE are observed after approximately 3 years.
The position of the CE detected from satellite data aligns well with in-situ observations gathered from regular glider deployments from 2009 to 2015. During this period, the interannual east–west shifts of the CE center observed from space are well captured by the glider measurements (green diamonds in Fig. 3a). Additionally, the mean salinity between 300 and 500 m, serving as an indicator for the presence of the deep core of the CE25, corresponds well with the position of its center (Figure S1, supplementary information). The dynamical reconstruction of the CE when its longitude center is < = 32.7° E yields a mean radius Rmax = 31 km (std = 6 km), a mean velocity Vmax = 0.19 m s−1 (std = 0.04 m s−1) and a mean Rossby number Roe = 0.08 ± 0.03. These results are consistent with those obtained from the TOEddies analysis for the west case listed in Fig. 2c. However, the slightly larger Rmax (and smaller Roe) can be attributed to the coarser horizontal resolution of the satellite measurements compared to the glider data.
The TOEddies results were also used to investigate the nature of the CE, G1 and G2 eddies, particularly focusing on the Rossby wave characteristic in the eastern LB. This phenomenon was already hypothesized by Robinson et al.13 as a seasonal response of the wind-driven circulation in a very coarse resolution (1/4th degree) model with flat-bottom. Recently, Kontoyiannis et al.44 identified Rossby waves in the deep layer (700–4000 m) south of Crete. However, these waves have a different driver from the Rossby waves described in this work, and are classified as topographic Rossby waves. For the entire study period, the days when all three vortices are simultaneously present (considering the west case) were determined. The zonal wavelength (λx) was computed as the distance between the center of CE and the center of G1. The zonal wavenumber ( ) was computed as
  = 2π/λx, while the dispersion relation of the Rossby waves was derived as in Cushman45 (Eq. 9.27 page 258):
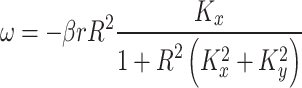 |
where  is the deformation radius and
  is the meridional wavenumber. Using H = 1000 m, a mean value of f (8.11e−5 s−1, for 33.79° N), a fixed
  (0.025 km−1 or
  = 250 km, given by the zonal and meridional symmetry of the eddies investigated) and a mean value of β (1.9e−8 km−1 s−1), different zonal wavenumber have been calculated for each
  along with the correspondent frequency (Figure S2, supplementary information). Results show that the hypothesized Rossby wave follow the eastward energy propagation curve for
  > 0.025 km−1 (that is
  < 250 km) confirming that the eddies CE, G1 and G2, when all present at the same time, are embedded within the meanders of a Rossby wave with a zonal wavelength between 180 and 250 km.
Laboratory experiments on eddies generation
The eddies generation mechanism is proven through a set of laboratory experiments. Laboratory parameters were scaled based on the 2015 ocean data, as the CE detected further west (Figs. 2c, 3a) facilitating downstream eddies formation. Considering that the TOEddies analysis indicates the formation of the eddies G1 and G2 mainly from January to May (when the ocean is homogeneous or weakly stratified, not shown), the incoming velocity (Uo = 2–5 cm s−1) and density variation ( = 0.5 kg m−3) were computed during this period and in the layer H = 0–1000 m. Specifically, the density variation between layers 0–100 m and 100–1000 m was calculated from Argo float profiles averaged over the area where CE, G1 and G2 primarily develop (32.8°—34.2° N; 31°—34–5° E). Given that the ESM top is ~ 600 m below the sea surface, its height (h'o) is chosen to be 400 m with a mean radius (L) of 40 km. The experiments have been conducted in the Coriolis Rotating Platform at LEGI (Grenoble), which consists of a circular tank of 13 m diameter. A sketch of the experimental set-up is given in Fig. 6 of the Methods and data section. The ESM is represented by a bump with L = 0.345 m base radius and a maximum height of h’o = 0.21 m, placed on an inclined boundary shaped as an inverted cone with a circular cross section and a slope of s = 0.1. The inclined boundary produced the desired topographic ß-plane effect. The tank was initially filled with fresh water at a depth of H = 0.47 m at the section on the top of the bump on the inclined boundary. For a given tank rotation characterized by a period T, the inflow velocity in the experiment was determined by imposing dynamic similarity with respect to the parameter b of the ocean and, at the same time, keeping the Rossby number Ro = Uo/f L < 1. The barotropic base inflow Uo was produced by a slight change of the tank rotation period following the techniques used by Sous et al.46 and was stationary throughout the experiments. The data were processed excluding the initial set-up phase of the flow.
Fig. 6.

(a) Sketch of the experimental set-up, with top and side views in the Coriolis Platform along with the position of the measurement instruments used, and definition of main variables. Insets on the top view shows the case on Earth and the details of the bump used in the experiments. (b) Instantaneous image of EXP-H2 (homogeneous) with fluorescent dye injected upstream, white arrows indicate the inflow direction, while the dashed circle the position of the bump. Rossby waves and embedded vortices, including the closed vortex above the bump, are clearly evident.
Table 1 summarizes all primary and derived parameters in the laboratory experiments and in the ocean. Experiments EXP-H1 and EXP-H2 have been realized under homogeneous ambient water conditions, while experiments EXP-S1 and EXP-S2 have been performed using a weakly stratified ambient flow. The two experiments for each ambient flow condition differ for the parameter b = ß L2/Uo (small values of b imply that ß effects are unimportant), and which characterize two distinct situations in the ocean case. Further details on the experimental set-up and measurements techniques are given in the Methods and data section.
Table 1.
Experimental parameters and initial conditions compared to the real ocean case. See Methods and data section for details on the flow scales and relevant non-dimensional numbers. The parameter d represents the ratio between the bottom layer and the total water depth H for the stratified cases while the Rossby number Roe refers to Vmax and Rmax.

The horizontal velocity field (from PIV technique) and positive values of the Q-criterion47,48 were used to identify the areas characterized by vortices. In both EXP-H2 and EXP-H1 (Fig. 4a-b) an anticyclonic eddy is present above the ESM and a standing wake develops downstream with a westward movement occurring only under a non stationary (e.g. decreasing) flow condition. In addition, closed cyclonic and anticyclonic eddies form within the wake meanders, and are better highlighted when the incoming flow is lower (EXP-H2).
Fig. 4.

Horizontal velocity field for homogeneous (a, EXP-H2 and b, EXP-H1) and stratified (c, EXP-S1 and d, EXP-S2) experiments. Magenta dashed circle indicates the contour of the ESM used during the experiment while the magenta diamond shows the center location of the anticyclonic eddy above the ESM based on the velocity field. Colored maps display Q-factor values, with positive values indicating cyclonic or anticyclonic vortices within Rossby waves, depending on the flow direction.
The theoretical Rossby waves wavelength for barotropic flow computed as  are 1.53 m and 2.16 m for experiments EXP-H2 and EXP-H1, respectively. Similarly to the homogeneous cases, the eddy above the bump forms in both the weakly stratified experiments and the eddies in the wake are still defined by closed streamlines. For EXP-S1 and EXP-S2 (Fig. 4c-d) the theoretical wavelengths have been computed using both
  /(
/( N) (which includes the vertical gradient of the incoming velocity (
 ), the Coriolis parameter (f), the Beta effect (β), the Brunt–Väisälä frequency (N); see Gill49, pp. 562) , and
  , where k1 is a constant that includes the stratification, the incoming flow and the
  parameter (see McCartney37, pp. 77–90).
According to Chapman and Haidvogel (1992; see their Fig.7 and 20)50, a flow above a seamountain generates a Taylor cup if Ro is less than the critical Rossby number (Roc). In our case, the laboratory Ro is smaller than the critical Rossby number (Roc = 0.14) determined for h’o/H = 0.45. This supports the conclusion that the observed anticyclonic eddy forming above the ESM is a Taylor column, formed due to the interaction between the incoming flow Uoand the ESM. These findings are also consistent with Huppert’s (1975) theory35, which predicts Taylor columns for the ratio ho/Ro > 1.5 (here = 80 for the set of our non-dimensional parameters). Meanwhile, the downstream wake can be attributed to a Rossby wave, as the ratio between the theoretical and observed wavelength values is close to one (Table 1 and Figure S3, supplementary information). The same conclusion can be drawn for the ocean case where the CE above the ESM can be considered as a Taylor column (Ro < (Roc = 0.13) computed for h’o /H = 0.4) generated by the interaction of the MMJ with the ESM. Additionally the match between observed (computed from ADT during the period January-May) and theoretical wavelength confirms that the downstream meander is a Rossby wave (Table 1 and Figure S3, supplementary information). Therefore, the oceanic and laboratory conditions are well supported by the Rossby wave theory and in particular, the laboratory wavelengths for EXP-S1 and EXP-S2 which depend on the b parameter, perfectly scale with the ocean values computed with TOEddies. Specifically, for the EXP-S2 (representative of the case of small incoming velocity and hence a large value of the parameter b) the non-dimensional wavelength  is 2.2 which is equivalent to that of the ocean (~ 2.25) computed for
  =180 km and L = 40 km (for small incoming velocity and high b parameter) while, for EXP-S1 (smaller b parameter and high incoming velocity)
  =3.2 which compares well with the values of the ocean of 3.2 computed for
  =250 km and L = 40 km (for high incoming velocity and small b parameter).
The position of the anticyclonic vortex above the bump was computed relative to the center of the seamount (Fig. 4) using the velocity field51. In EXP-H2 the center coordinates are X1 = −5.59 cm and Y1 = −3.50 cm while in EXP-H1, the center shifts westward to coordinates X2 = −12 cm and Y2 = 8.5 cm. For the weakly stratified experiment EXP-S2, the coordinates are, X1 = −0.08 cm and Y1 = 18.48 cm, and in EXP-S1, the center moves to the west again to X2 = −8.59 cm and Y2 = 19 cm. Therefore, for both homogeneous and stratified flow conditions, the zonal shift of the CE center (∆X = X2-X1) over the bumps’ diameter (L) is observed when the incoming velocity doubles (e.g. from ~ 0.8 cm s−1 to 1.4 cm s−1), with ∆Xhomg = 0.074 and ∆Xstratif = 0.12. For the ocean case (Fig. 3a) when the incoming flow increases from ~ 3 cms−1 to 6 cms−1, the CE center shifts from X1 ~ 46 km to X2 ~ 55 km (both calculated with respect to the center of the ESM). The zonal shift over the ESM radius is ∆Xocean = 0.11. This value is consistent with the laboratory ∆Xstratif, suggesting that the zonal CE position depends on current intensity.
Discussion and conclusions
The formation mechanism of the CE and of the downstream SSE and NSE in the LB was demonstrated for the first time with scaled laboratory experiments (based on in-situ ocean data) in the LEGI rotating tank under homogeneous and stratified fluid conditions. Results show that the CE is a Taylor column generated by the impingement of the MMJ on the ESM and that the downstream wave is a Rossby wave whose enclosed eddies can be associated with the cyclonic SSE and anticyclonic NSE, respectively. The TOEddies analysis based on 28 years of ADT data indicates that this laboratory case can only be observed in the real ocean when the CE center is west of 32.7° E (center of the ESM), as the Israeli-Lebanese coast acts as a barrier to the formation of waves and eddies (Fig. 2c-d). Correlation analysis between the CE longitude center and the incoming velocity Uo (which simulates the MMJ) in the layer 0–1000 m depth, shows that the CE starts to move westward when Uo exceeds ~ 3 cm s−1 and reaches a maximum of ~ 6.5 cm s−1 whereas, when Uo decreases from ~ 6.5 to ~ 3 cm s−1 the CE shifts eastward (Fig. 3a). The ocean currents’ strengthening and weakening correlate with the westward and eastward drift of the CE center during distinct time intervals: 1999–2005 and 2011–2017. A correlation analysis between the NIG vorticity and the CE longitude center was required because the Uo variability is intimately linked to the NIG dynamics. Results indicate that the effects of the NIG’s cyclonic/anticyclonic modes propagate about 3 years later in the eastern LB (Fig. 3b-c) and specifically, the CE begins to move westward in 1999 (2011) coinciding with the increasing of maximum negative vorticity of the 1993–1998 (2006–2010) anticyclonic phase of NIG. As the vorticity transitions to zero by late 1997 (2010), the cyclonic phase begins, and the CE center reaches 32.7° E about 3 years later. This leads to simultaneous occurrences of CE, G1, and G2 eddies during 2001–2004 (end of 2012–2016).
These results are consistent with the findings of Zodiatis et al.14, where in-situ data and numerical simulations show the presence of only CE in the period 1996–1999 and the simultaneous presence of CE, G1 and G2 in the period 2001–2007, although our analysis indicates a shorter period (2001–2004) and an additional one (2012–2016). The eastward and westward CE shifting in the above mentioned periods is also supported by drifters data of Poulain et al.22 and by in-situ glider data (Figs. 3a and S1). The above results reinforce earlier findings regarding the effects of the NIG reversal on water transport in the LB4,8,21,52–56, while also providing a time estimate for the connection between the NIG and the LB dynamics.
The computation of the Rossby wave dispersion relation indicates that the coexistence of CE, G1 and G2 in the ocean is related to the presence of a Rossby wave, with an eastward energy provided by the MMJ and a zonal wavelength between 180 and 250 km (Figure S2, supplementary information). However, while laboratory results point to standing Rossby waves, in the ocean these waves are forced to propagate due to the coast effect, variation of the upstream conditions and interaction with surrounding eddies and currents.
The experiments presented in this work confirm that under different conditions of the parameter b (and thus incoming velocity Uo) and ambient stratification, the anticyclonic CE consistently form above the submerged bump. A downstream wake with enclosed cyclonic and anticyclonic eddies also forms. While the inclination of the current with respect to the zonal direction is considered unimportant for dynamics when small57, a zonal Uowas consistently assumed, despite the possibility of the MMJ being southwesterly14,54. Model results by Egorova et al.28 confirm this lack of influence on CE formation, but suggest high velocities may inhibit it, contrary to our laboratory results which consistently show the CE formation, with Uo intensity affecting the CE center’s position. In fact, when the velocity doubles from ~ 0.8 cms−1 to 1.4 cms−1the center shifts westward, or in oceanic conditions, the CE forms west of 32.7° E, facilitating downstream Rossby wave formation with embedded eddies. Its interaction with the Israeli-Lebanese coast blocks the northward penetration of the southerly coastal flow, leading to anticyclonic coastal eddy formation. This eddy triggers the transport of nutrient-rich coastal water offshore58, a mechanism that is of paramount importance for an oligotrophic area such as the LB. An example is reported in Fig. 5 where the anticyclonic eddy A1 forms around January 24 at ~ 33° N (Fig. 5b) following the weakening of the northward water transport (computed in the upper 150 m along the zonal Sect. 34.1° N, 35–36° E) during the period 10–26 January (Figure S4, supplementary information). When A1 detaches from the coast, a clear surface Chlorophyll signal is associated with it (Fig. 5c) and later transported northward favored by the dynamics of the area (Fig. 5d).
Fig. 5.

Surface maps of Chlorophyll for different days of 2015 overlaid with surface geostrophic velocity. Eddies CE, G1 and G2 are reported in magenta, while the anticyclonic eddy A1 that develops from the northward current along the coast, is highlighted in red.
Our findings reveal that understanding the behavior of the NIG can be leveraged to predict the mesoscale dynamics in the LB up to about three years in advance. This emphasizes the significant impact of the central Mediterranean Sea on the mesoscale dynamics of the Eastern Mediterranean, enhancing our understanding of basin circulation and having important implications for regional biological knowledge.
Methods and data
Eddy tracking analysis
The mesoscale eddies were detected and tracked using the TOEddies algorithm41. This method identifies mesoscale eddies by detecting closed Sea Surface Height (SSH) contours that enclose an extremum. This is based on the concept that SSH isolines correspond to current streamlines in a state of geostrophic equilibrium. Therefore, a maximum (minimum) SSH value encircled by a closed contour indicates the presence of an anticyclonic (cyclonic) eddy. The algorithm tracks these eddies over time by taking advantage of their small daily movements relative to their size, resulting in overlapping regions across consecutive days. This overlap allows the algorithm to obtain eddy trajectories taking into account both merging or splitting events.
The TOEddies algorithm was applied to satellite-derived 1/8° fields of Absolute Dynamic Topography (ADT, a proxy for SSH) and associated geostrophic currents. We characterized each detected eddy using two radii defined by the TOEddies algorithm: the outermost boundary radius (Rout) corresponding to the largest closed contour, and the radius where the average geostrophic velocities reach their maximum (Rmax), along with the maximum velocity (Vmax) associated with this radius. Following LeVu et al.59, the Rossby number has been calculated as: Roe = Vmax/f Rmax where f is the Coriolis parameter.
Among all the eddies detected daily in the LB, the CE was identified as an anticyclonic eddy detected above the ESM with its topo located at 32.7° E, 33.7° N. The resulting CE are then divided into two groups depending on whether the CE center is west or east of the ESM.
Glider data
Gliders are autonomous profiling platforms used to sample the ocean in a sawtooth trajectory down to a maximum depth of 1000 m along a predefined path defined by a set of waypoints60. At each surfacing, the glider communicates scientific and technical data and receives orders by satellite iridium. The dead reckoned position of surfacing estimated by the glider is then compared with GPS fixes in order to compute a depth-averaged current61. This information is of paramount importance to study mesoscale eddies with gliders as the eddy center can be inferred using these current estimates62. The CE center was then detected (Figure S1) and a dynamical reconstruction inferred for each glider mission (dedicated to the monitoring of the CE, for periods of 3 to 7 months, from 2009 to 2015, and mostly using Seaglider missions63). Following the procedure of Bosse et al.64, cyclogeostrophic velocities of the CE were estimated. Note that given the Rossby number of the CE, the cyclostrophic component corresponds to about 10% of the total velocity amplitude. For each eddy realization, the radius is then defined at the maximum velocity, and the Rossby number computed as: Roe = Vmax/f Rmax, with f the Coriolis parameter.
Laboratory experiments
The laboratory system depends on seven independent variables which are combined to give the relevant non dimensional numbers. The basic inflow field is characterized by a mean meridionally averaged zonal velocity Uo over the water depth H. The topography is characterized by a single horizontal length scale L and a height h’o. The ß plane is defined as f(y) = fo + ßy, where fo is the Coriolis parameter and y is the poleward directed coordinate, and lastly the kinematic viscosity νu. The non-dimensional parameters characterizing the problem are: h'o/H (the relative height of the topography to the total water depth), H/L (the aspect ratio), Ro = Uo/(fo L) (the Rossby number), Ek = νu/(foH2) (the Ekman number), and b = ßL2/Uo (the b parameter) which measures the dynamic importance of ß (small values of b imply that ß effects are unimportant). Considering that the vertical stratification is characterized by the reduced gravity g’ = gΔρ/ρ0, the non-dimensional parameter S = g'H/fo2 L2 (also called the Burger number) gives a dynamic measure of the stratification. It compares the propagation speed of internal waves to topographic Rossby waves and large values of S imply relevant stratification effects.
The experiments have been conducted in the Coriolis Rotating Platform at LEGI (Grenoble, France), which consists of a circular tank of 13 m diameter. A sketch of the experimental set-up is given in Fig. 6.
The inclined boundary was used to simulate the ß-plane effect. By invoking the conservation of potential vorticity in the quasi-geostrophic approximation: ξ + fo + ßy = const (ξ is the relative vorticity of the water column, fo = 4π/T is the Coriolis parameter with T the rotation period of the platform and y is the ‘northward’ direction), the topographic ß effect in the laboratory scales as ß = sfo/H (H is the slope depth at the top of the bump and s is the slope) and it simulates the corresponding planetary effect. Hence, by moving northward, a water column experiences an induction of negative (clockwise) relative vorticity from the planetary vorticity. The situation on Earth (LB) and the corresponding Coriolis experiment are sketched in Fig. 6. It is worth to note that since our gradient vector of the Coriolis parameter is directed in the opposite direction with respect to the real ocean case, the tank was put on clockwise (anticyclonic) rotation. The ß-plane values have been corrected by the free surface deformation due to the centrifugal force, representing maximum 10% and 4% for the two rotations considered with T = 30 s and T = 40 s, respectively.
The barotropic base inflow Uo was produced by a slight change of the tank rotation period following the techniques used by Sous et al.46. In particular a spin-up has been applied to produce a barotropic inflow velocity directed in opposite direction to the clockwise tank rotation. The resulting temporal evolution of the inflow barotropic velocity field is given in Fig. 7a, relative to EXP-H2, and representative for all the performed experiments. Some oscillations in time are observed, but have shown not to affect the dynamics of the flow and the vortices position.
Fig. 7.

(a) Time evolution of the inflow velocity Uo of EXP-H2, throughout the experiment along the bump central circular section from the ADV measurement. (b) Typical inflow velocity profiles with (Uo,Vo) being the azimuthal (black) and the radial (gray) instantaneous velocity components at t/T = 0.5 along a radial section from PIV measurements taken 3L upstream of the cylinder position for EXP-H2. (c) Initial vertical density profiles along the bump central circular section for the two considered stratified experiments (EXP-S1, EXP-S2) with continuous and dashed lines, respectively. The vertical coordinate in (c) measures the distance from the free surface.
The flow velocity variation over the considered two-dimensional field of view in the circular configuration is less than 15% within a radial section of 2.8 m centered at the top of the bump and 4L upstream of the bump (Fig. 7b).
The maximum experimental duration was chosen based on the barotropic inflow velocity to ensure that the perturbations generated at the bump did not reach the inflow section, monitored using an Acoustic Doppler Velocimeter Profiler (ADV) upstream of the bump. The typical experimental duration is of t/T = 10–13 rotational days, depending on the experiment.
For the weakly stratified experiments EXP-S1 and EXP-S2, the vertical density anomaly distribution Δρ(z) from the free surface is shown in Fig. 7c with a continuous and dashed line, respectively. Considering that the barotropic flow is the same throughout the water column and that the baroclinic velocity component is proportional to the ratio between the two layers, the ß effect will be felt also in the top layer. Therefore, for these stratified experiments the horizontal velocities have been measured at the pycnocline level through a selective tracing technique detailed further below and shown in Fig. 8.
Fig. 8.

Instantaneous image of the stratified experiment EXP-S2 realized using a selective tracer technique and underwater illumination for the PIV measurements.
For the homogeneous experiment, horizontal velocities have been determined using Particle Image Velocimetry (PIV) on the Field of View (FOV) area 1 cm above the top of the bump (Fig. 6). Polyamide particles (Orgasol) with a mean diameter of 60microm and a specific density of 1.016 kgm−3 were added in the ambient water as tracer material for the PIV measurements. A 25W Yag laser operating at a wavelength of 532 nm provided a continuous light source outside the Coriolis tank. The beam was transmitted through a divergent lens (60°) in the tank and enabled to illuminate the full tank over the horizontal area of interest (Fig. 6). For the stratified experiments, a selective flow seeding at the pycnocline level has been used using subaqueous illumination (Fig. 8). Images of 4 m × 3 m were taken with a high-resolution S-CMOS Camera (JAI SP12000, 12MPx, 12bit) synchronized with the laser system, at a frame rate of 2 Hz. The spatial resolution of 1 mm/pixel was obtained using an optical lens (24 mm, F2.8) on the Camera.
The PIV measurements started with the platform spin-up. The system reached a steady state with a constant azimuthal velocity Uo approximately 10 s after onset of the experiment. Velocity fields were computed from PIV measurements using a cross-correlation PIV algorithm encoded with the UVMAT software (http://servforge.legi.grenoble-inp.fr/projects/soft-uvmat). Each element of the resulting vector field represents an area of roughly 1 cm x 1 cm. The maximum instantaneous velocity error is estimated to be 3%. The velocity 6 m upstream of the bump was monitored by means of an Acoustic Doppler Velocimetry device (ADVP, Vectrino) at a distance of 1.92 m from the tank edge (as the top of the bump) in order to determine the barotropic inflow velocity Uo and determine the maximum experimental duration. The seeding particles for PIV served also as the needed tracers for the ADV measurements. Measurements of the three velocity components (u',v',w') were taken continuously from 4.5 cm to 7.5 cm below the free surface throughout the experiment at a rate of 200 Hz. The velocities Uo reported in Table 1 have been averaged over the 3 cm depth.
For the stratified experiments, a 125 MicroScale Conductivity and Temperature Instrument (MSCTI, PME Vista, California, USA) was employed to measure the electrical conductivity and temperature of the water, yielding two analog outputs, one linearly proportional to the solution conductivity, and one non-linearly proportional to the solution temperature. The conductivity probe was installed at a distance of 50 cm from the ADV probe toward the center of the tank, and 1 cm below the free surface. Vertical profiles were taken throughout the experiment and are displayed averaged in Fig. 7c. The probe was calibrated at the beginning and at the end of each experiment to convert the voltage to density units.
Lastly, flow visualization was realized using Rhodamine 6G to highlight the Rossby waves and embedded vortices, and acquired through a GoPro camera. The reproducibility of the results has been verified analyzing the data of each of the performed experiments with the same parameters.
Reanalysis and satellite products
The daily ADT product (SEALEVEL_EUR_PHY_L4_MY_008_068) was used to detect eddies with the TOEddies algorithm (Fig. 2), to produce the January-May 2015 ADT map (Fig. 1). The surface velocity and the velocity Uo averaged in the upper 1000 m depth were computed using the product MEDSEA_MULTIYEAR_PHY_006_004. Both products were retrieved from the Copernicus Marine Service (CMEMS). The daily surface chlorophyll (OCEANCOLOUR_MED_BGC_L4_MY_009_144) with 1 × 1 km spatial resolution (L4) was also downloaded from the CMEMS website. Argo floats can be downloaded from https://dataselection.euro-argo.eu
Supplementary Information
Acknowledgements
The work was partly funded by FOE- Ministerial Decree No. 789. Ordinary fund of research institutions dedicated to infrastructures—OGS- EuroArgo-ERIC. We sincerely thank Joël Sommeria for fruitful discussions and Elena Mauri for providing the funds to run the experiments.
Author contributions
A.P. conceived the subject. A.P. and M.E.N. designed the laboratory experiment. M.E.N., S.V. and T.V. performed the experiments. M.E.N. computed the velocity and vorticity fields from the PIV data. A.P. and M.E.N. analyzed the rotating tank data. M.M. performed the analysis of the altimetric data and the time series correlation. R.L. performed the analysis of the TOEDeddies algorithm. S.S. performed the Rossby waves/dispersion relation analysis. A.B. performed the glider analysis. R.M. cured the Argo data, computed the Sverdrup and Chlorophyll analysis, and assembled figures. A.P, M.E.N., R.L.,M.M., S.S. A.B., R.M., P-M. M. and E.M contributed to the discussion and interpretation of the results. A.P. wrote the manuscript. M.E.N., M.M., S.S. and A.B. contributed to the manuscript writing . D.H. designed and performed the glider experiments (2009–2015). D.H., S.S., P-M. M. and E.M. reviewed and edited the manuscript. E.M. was in charge of Argo-Italy infrastructure management and funding acquisition, and provided financial support to run the experiment. All authors have read and agreed to the published version of the paper.
Data availability
Reanalysis and satellite data are freely downloadable for research purposes from the CMS website (https://data.marine.copernicus.eu/products): ADT: 10.48670/moi-00141; Uo u,v, and potential density: 10.25423/CMCC/MEDSEA_MULTIYEAR_PHY_006_004_E3R1; Chlorophyll: 10.48670/moi-00300; Glider data are available at the Coriolis Global Data Assembly Center: 10.17882/56509; Argo float data: 10.17882/42182. Experimental data are available upon request: Eletta.Negretti@legi.cnrs.fr.
Declarations
Competing interests
The authors declare no competing interests.
Footnotes
Publisher’s note
Springer Nature remains neutral with regard to jurisdictional claims in published maps and institutional affiliations.
Supplementary Information
The online version contains supplementary material available at 10.1038/s41598-024-80293-6.
References
- 1.Lascaratos, A. & Nittis, K. A high-resolution three-dimensional numerical study of intermediate water formation in the Levantine Sea. Journal of Geophysical Research: Oceans.103(C9), 18497–18511 (1998). [Google Scholar]
- 2.Golnaraghi, M., & Robinson, A. R. Dynamical studies of the Eastern Mediterranean circulation. Ocean processes in climate dynamics: Global and Mediterranean examples (Eds. P. Malanotte-Rizzoli and A. R. Robinson) 395–406 (Springer 1994).
- 3.Malanotte-Rizzoli, P. & Robinson, A. R. POEM: Physicalo ceanography of the Eastern Mediterranean. EOS Trans. Am. Geophys. Union69(14), 194–203 (1988). [Google Scholar]
- 4.Menna, M. et al. Climatic, decadal, and interannual variability in the upper layer of the Mediterranean Sea using remotely sensed and in-situ data. Remote Sensing14(6), 1322 (2022). [Google Scholar]
- 5.Menna, M., Poulain, P. M., Zodiatis, G. & Gertman, I. On the surface circulation of the Levantine sub-basin derived from Lagrangian drifters and satellite altimetry data. Deep Sea Research Part I: Oceanographic Research Papers.65, 46–58 (2012). [Google Scholar]
- 6.Zodiatis, G., Drakopoulos, P., Brenner, S. & Groom, S. Variability of the Cyprus warm core Eddy during the CYCLOPS project. Deep- Sea Res.52(2), 2897–2910 (2005). [Google Scholar]
- 7.Civitarese, G., et al. The BiOS mechanism: History, theory, implications. Progress in oceanography, 103056 (2023).
- 8.Menna, M. et al. Decadal variations of circulation in the Central Mediterranean and its interactions with mesoscale gyres. Deep Sea Research Part II: Topical Studies in Oceanography.164, 14–24 (2019). [Google Scholar]
- 9.Ozer, T. et al. Relationship between thermohaline and biochemical patterns in the levantine upper and intermediate water masses, Southeastern Mediterranean Sea (2013–2021). Frontiers in Marine Science.9, 958924 (2022). [Google Scholar]
- 10.Gačić, M. et al. Impact of the dense water flow over the sloping bottom on the open-sea circulation: Laboratory experiments and the Ionian Sea (Mediterranean) example. Ocean Science Discussions2021, 1–26 (2021). [Google Scholar]
- 11.Rubino, A. et al. Experimental evidence of long-term oceanic circulation reversals without wind influence in the North Ionian Sea. Scientific reports.10(1), 1905 (2020). [DOI] [PMC free article] [PubMed] [Google Scholar]
- 12.Hecht, A., Robinson, A. & Pinardi, N. Currents, water masses, eddies, and jets in the Mediterranean levantine basin. J. Phys. Oceanogr.18, 1320–1353 (1988). [Google Scholar]
- 13.Robinson, A. R. et al. General circulation of the Eastern Mediterranean. Earth Sci. Rev.32, 285–309 (1992). [Google Scholar]
- 14.Zodiatis, G. et al. Twenty years of in-situ monitoring in the south-eastern Mediterranean Levantine basin: Basic elements of the thermohaline structure and of the mesoscale circulation during 1995–2015. Frontiers in Marine Science.9, 1074504 (2023). [Google Scholar]
- 15.Malanotte-Rizzoli, P. et al. The Eastern Mediterranean in the 80s and in the 90s: the big transition in the intermediate and deep circulations. Dyn. Atmos. Oceans.29, 365–395 (1999). [Google Scholar]
- 16.Robinson, A. R. & Golnaraghi, M. Circulation and dynamics of the Eastern Mediterranean sea; quasi-synoptic data-driven simulations. Deep Sea Res.40(6), 1207–1246 (1993). [Google Scholar]
- 17.Mauri, E. et al. On the variability of the circulation and water mass properties in the Eastern Levantine Sea between September 2016–August 2017. Water.11(9), 1741 (2019). [Google Scholar]
- 18.Ozsoy, E. et al. A review of the levantine basin circulation and its variability during 1985–1988. Dyn. Atmos. Oceans.15, 421–456 (1991). [Google Scholar]
- 19.Brenner, S. Long term evolution and dynamics of a persistent warm core eddy in the Eastern Mediterranean Sea. Deep Sea Res II.40, 1193–1201 (1993). [Google Scholar]
- 20.Brenner, S. Structure and evolution of warm core eddies in the Eastern Mediterranean Levantine basin. J. Geophys. Res.94, 12593–12602 (1989). [Google Scholar]
- 21.Menna, M. et al. On the circulation and thermohaline properties of the Eastern Mediterranean Sea. Frontiers in Marine Science.8, 671469 (2021). [Google Scholar]
- 22.Poulain, P. M. et al. Drifter observations of surface currents in the Cyprus Gyre. Frontiers in Marine Science.10, 1266040 (2023). [Google Scholar]
- 23.Brenner, S., Rosentroub, Z. & Bishop, Y. Observations of a quasistationary mesoscale eddy in the northeastern Levantine Basin, Physical Oceanography of the Eastern Mediterranean (POEM): Initial Results. UNESCO Rep. in Mar. Sci.44, 55–56 (1987). [Google Scholar]
- 24.Feliks, Y. & Itzikowitz, S. Movement and geographical distribution of anticylonic eddies in the eastern Levantine Basin. Deep Sea Res.34, 1499–1508 (1987). [Google Scholar]
- 25.Brenner, S., Rozentraub, Z., Bishop, J. & Krom, M. The mixed-layer/ thermocline cycle of a persistent warm core eddy in the eastern Mediterranean. Dyn. Atmos. Oceans.15, 457–476 (1991). [Google Scholar]
- 26.Groom, S. et al. Satellite-derived spatial and temporal biological variability in the Cyprus Eddy. Deep- Sea Res II52, 2990–3010 (2005). [Google Scholar]
- 27.Law, C. et al. The fate of phosphate in an in situ Lagrangian addition experiment in the Eastern Mediterranean. Deep-Sea Research II52, 2911–2927 (2005). [Google Scholar]
- 28.Egorova, V. M., Sokolovskiy, M. A. & Zodiatis, G. A three-layer model of hydrodynamic processes in the Cyprus Eddy system. Ocean Dynamics.74(1), 19–36 (2024). [Google Scholar]
- 29.Egorova, V. M., Zyryanov, V. N. & Sokolovskiy, M. A. The hydrodynamic theory of the Cyprus eddy. Ocean Dynam.72, 1–20 (2022). [Google Scholar]
- 30.Frenzen, P. Westerly flow past an obstacle in a rotating hemispherical shell. Bull. Am. Met. Soc.36, 204–210 (1955). [Google Scholar]
- 31.Fultz, D. & Frenzen, P. A note on certain interesting ageostrophic motions in a rotating hemispherical shell. J. Meteor.12, 332–338 (1955). [Google Scholar]
- 32.Fultz, D. & Long, R. R. Two-dimensional flow around a circular barrier in a rotating spherical shell. Tellus3, 61–68 (1951). [Google Scholar]
- 33.Gülk, B., Roquet, F., Naveira Garabato, A. C., Narayanan, A., Rousset, C., & Madec, G. Variability and remote controls of the warm‐water halo and Taylor Cap at Maud Rise. Journal of Geophys. Res.: Oceans, 128(7), e2022JC019517 (2023).
- 34.Guo, B., et al. Observed deep anticyclonic cap over Caiwei Guyot. J. Geophys. Res.: Oceans, 125(10), e2020JC016254 (2020).
- 35.Huppert, H. E. Some remarks on the initiation of inertial Taylor columns. Journal of Fluid Mechanics67(2), 397–412 (1975). [Google Scholar]
- 36.McCartney, M. S. The interaction of zonal currents with topography with applications to the Southern Ocean. Deep Sea Research and Oceanographic Abstracts. 413–427 (1976).
- 37.McCartney, M. S. Inertial Taylor columns on a beta plane. Journal of Fluid Mechanics.68(1), 71–95 (1975). [Google Scholar]
- 38.Meredith, Michael P., et al. An anticyclonic circulation above the northwest Georgia rise, Southern Ocean. Geophys. Res.Letters 30(20) (2003).
- 39.Verron, J. & Le Provost, C. A numerical study of quasi-geostrophic flow over isolated topography. Journal of Fluid Mechanics.154, 231–252 (1985). [Google Scholar]
- 40.Pirro, A. et al. New insights on the formation and breaking mechanism of convective cyclonic cones in the South Adriatic Pit during winter 2018. Journal of Physical Oceanography52(9), 2049–2068 (2022). [Google Scholar]
- 41.Laxenaire, R. et al. Anticyclonic eddies connecting the western boundaries of Indian and Atlantic Oceans. Journal of Geophysical Research: Oceans123(11), 7651–7677 (2018). [Google Scholar]
- 42.Notarstefano, G., Menna, M., & Legeais, J. F. Reversal of the Northern Ionian circulation in 2017. Journal of Operational Oceanography. 12, S108-+ (2019).
- 43.Shabrang, L. et al. Long-term variability of the southern Adriatic circulation in relation to North Atlantic Oscillation. Ocean Science.12(1), 233–241 (2016). [Google Scholar]
- 44.Kontoyiannis, H., Velaoras, D., Papadopoulos, V., & Kioroglou, S. Current structures and topographic Rossby waves in the Levantine basin south of Crete revealed by snapshot and time series current measurements. Deep Sea Research Part II: Topical Studies in Oceanography. 171, 104620 (2020).
- 45.Cushman-Roisin, B., & Beckers, J. M. Introduction to geophysical fluid dynamics: physical and numerical aspects 258–259 (Academic press, 2009).
- 46.Sous, D., Sommeria, J., & Boyer, D. Friction law and turbulent properties in a laboratory Ekman boundary layer. Physics of Fluids.25(4), (2013).
- 47.Hunt, J. C. R., Wray, A. A. & Moin, P. Eddies, stream, and convergence zones in turbulent flows. Center for Turbulence Research Report CTR.S88, 193–208 (1988). [Google Scholar]
- 48.Kolář, V. Vortex identification: New requirements and limitations. International journal of heat and fluid flow.28(4), 638–652 (2007). [Google Scholar]
- 49.Gill, Adrian E. Atmosphere-ocean dynamics 562 (Academic press, 1982).
- 50.Chapman, D. C., & Haidvogel, D. B.. Formation of Taylor caps over a tall isolated seamount in a stratified ocean. Geophysical & Astrophysical Fluid Dynamics, 64(1–4), 31–65 81 (1992).
- 51.Graftieaux, L., Michard, M., & Grosjean, N.Combining. PIV, POD and vortex identification algorithms for the study of unsteady turbulent swirling flows. Measurement Science and technology. 12(9), 1422 (2001).
- 52.Gačić, M., Schroeder, K., Civitarese, G., Cosoli, S., Vetrano, A., & Eusebi Borzelli, G. L. Salinity in the Sicily Channel corroborates the role of the Adriatic–Ionian Bimodal Oscillating System (BiOS) in shaping the decadal variability of the Mediterranean overturning circulation. Ocean Science, 9(1), 83–90, (2013).
- 53.Gačić, M., Borzelli, G. E., Civitarese, G., Cardin, V., & Yari, S. Can internal processes sustain reversals of the ocean upper circulation? The Ionian Sea example. Geophys. Res. Letters, 37(9), (2010).
- 54.Meli, M., Camargo, C. M. L., Olivieri, M., Slangen, A. B. A. & Romagnoli, C. Sealevel trend variability in the Mediterranean during the 1993–2019 period. Frontiers in Marine Science.10, 1150488 (2023). [Google Scholar]
- 55.Ozer, T., Gertman, I., Kress, N., Silverman, J. & Herut, B. Interannual thermohaline (1979–2014) and nutrient (2002–2014) dynamics in the Levantine surface and intermediate water masses, SE Mediterranean Sea. Global and Planetary Change151, 60–67 (2017). [Google Scholar]
- 56.Pinardi, N., Cessi, P., Borile, F. & Wolfe, C. L. The Mediterranean sea overturning circulation. Journal of Physical Oceanography49(7), 1699–1721 (2019). [Google Scholar]
- 57.Killworth, P. D. Barotropic and baroclinic instability in rotating stratified fluids. Dyn. Atmos. Oceans.4(3), 143–184 (1980). [Google Scholar]
- 58.Colella, S., Falcini, F., Rinaldi, E., Sammartino, M. & Santoleri, R. Mediterranean ocean colour chlorophyll trends. PloS one.11(6), e0155756 (2016). [DOI] [PMC free article] [PubMed] [Google Scholar]
- 59.Le Vu, B., Stegner, A. & Arsouze, T. Angular Momentum Eddy Detection and tracking Algorithm (AMEDA) and its application to coastal eddy formation. Journal of Atmospheric and Oceanic Technology35(4), 739–762 (2018). [Google Scholar]
- 60.Testor, P. et al. OceanGliders: a component of the integrated GOOS. Frontiers in Marine Science.6, 422 (2019). [Google Scholar]
- 61.Rudnick, D. L., Sherman, J. T. & Wu, A. P. Depth-average velocity from Spray underwater gliders. Journal of Atmospheric and Oceanic Technology.35(8), 1665–1673 (2018). [Google Scholar]
- 62.Bosse, A., Testor, P., Mortier, L., Prieur, L., Taillandier, V., d'Ortenzio, F., & Coppola, L. (2015). Spreading of Levantine Intermediate Waters by submesoscale coherent vortices in the northwestern M editerranean Sea as observed with gliders. Journal of Geophysical Research Oceans. 120(3), 1599–1622 (2015).
- 63.Hayes, D. R., et al. Glider transects in the Levantine Sea: Characteristics of the warm core Cyprus eddy. OCEANS IEEE. 1–9 (2011).
- 64.Bosse, A., Fer, I., Lilly, J. M. & Søiland, H. Dynamical controls on the longevity of a non-linear vortex: The case of the Lofoten Basin Eddy. Sci. Rep.9(1), 13448 (2019). [DOI] [PMC free article] [PubMed] [Google Scholar]
Associated Data
This section collects any data citations, data availability statements, or supplementary materials included in this article.
Supplementary Materials
Data Availability Statement
Reanalysis and satellite data are freely downloadable for research purposes from the CMS website (https://data.marine.copernicus.eu/products): ADT: 10.48670/moi-00141; Uo u,v, and potential density: 10.25423/CMCC/MEDSEA_MULTIYEAR_PHY_006_004_E3R1; Chlorophyll: 10.48670/moi-00300; Glider data are available at the Coriolis Global Data Assembly Center: 10.17882/56509; Argo float data: 10.17882/42182. Experimental data are available upon request: Eletta.Negretti@legi.cnrs.fr.