

SUMMARY
One of the most important goals in biomedical sciences is understanding the causal mechanisms of neurodegeneration. A prevalent hypothesis relates to impaired waste clearance mechanisms from the brain due to reported waste aggregation in the brains of Alzheimer patients, including amyloid‐β plaques and neurofibrillary tau tangles. Currently, our understanding of the mechanisms by which waste is removed from the brain is only fragmentary. Here we provide compelling evidence that waste clearance from brain tissue is highly conserved in arachnids and humans. Utilizing RNAscope in situ hybridization, immunohistochemical, ultrastructural, and histological approaches, we demonstrate that cellular debris in spider neurons is engulfed by myelin‐forming ependymal glial cells that transect into neuronal somata and form myelin‐derived waste‐internalizing receptacles. These canal systems channel this debris into the lymphatic system likely in an aquaporin‐4 (AQP4) water channel‐dependent manner. We provide robust evidence that a similar process may be true in human hippocampus where vast numbers of myelinated AQP4‐immunoreactive ependymal glial cells send cellular projections into the somata of neurons and glial cells where they differentiate into waste internalizing receptacles. In the brains of Alzheimer decedents, hypertrophic impairment of these myelinated glial cells leads to the catastrophic obstruction and depletion of neuronal cytoplasm into the ependymal glial cells. At the cellular level, the structural impairment of macroglia leads to swelling myelin protrusions that appear as electron‐lucent circular profiles, explaining spongiform abnormalities associated with the neurodegenerative diseases described here. We propose to term this novel type of macroglia‐mediated cell death “gliaptosis.”
Keywords: Alzheimer disease, Cupiennius salei, glymphatic system, tanycyte, waste clearance
We provide evidence that myelinated tanycytes likely remove cellular waste from the human hippocampus in an aquaporin‐4‐dependent manner for disposal from the brain. We propose that amyloid beta may play an important role in the differentiation and proliferation of these receptacles.
1. Introduction
The prevalent causative hypothesis for Alzheimer disease is the proposed accumulation of cellular waste particularly in the form of intracellular hyperphosphorylated tau tangles and extracellular amyloid‐β plaques. These waste products, which have been shown to accumulate in the human cortex, are thought to induce neurodegeneration (Askenazi et al. 2023; Blas Gil 2019; Congdon and Sigurdsson 2018; Fernando 2018; Kiani 2023; Perry and Press 2013, 2018; Philippe 2013). One mechanism by which waste may be cleared from the brain parenchyma in mammals is the “Glymphatic system” first proposed by Iliff et al. (2012). This system is thought to facilitate waste clearance from the brain through: (a) the release of neuronal waste into extracellular spaces, (b) the existence of a convective (bulk) flow of cerebrospinal fluid along para‐arterial spaces (Cserr and Ostrach 1974), and (c) the formation of an aquaporin‐4 (AQP4) water channel‐mediated bulk flow of fluid into the brain tissue that is believed to flush cellular debris toward para‐venous spaces for clearance from the brain (Iliff and Nedergaard 2013; Iliff et al. 2012; Nedergaard 2013; Nedergaard and Goldman 2016). Impairment of this system resulting in a reduced bulk flow would thus result in the failure to clear metabolites and explain waste accumulation within the brain. The proposed role of AQP4 for the formation of this convective flow has been postulated on the basis of two‐photon microscopy studies in mouse brains of wild type compared to AQP4 null mice. The authors observed a significantly decreased flow of fluorescently traced cerebrospinal fluid into the brain parenchyma (Mestre et al. 2018). This proposed mechanism has been challenged, predominantly regarding the proposed bulk flow (Hladky and Barrand 2022; Smith et al. 2017) and the postulated mechanism by which AQP4‐containing astrocytic endfeet contribute to the formation of this convective flow (Abbott et al. 2018). Smith et al. (2017) demonstrated the existence of this bulk flow in the absence of AQP4, suggesting that diffusion may be the underlying mechanism by which cerebrospinal fluid enters the brain tissue. Our main objection regarding the glymphatic system is the proposed mechanism of cellular waste disposal. The postulation that neuronal debris is freely released into extracellular spaces by millions of metabolically active neurons is highly questionable as both hydrophobic and hydrophilic waste particles would likely form larger aggregates that would block narrow interstitial spaces.
Here, we have investigated waste disposal from neurons and show the likely function of myelinated glial cells in the invertebrate model system Cupiennius salei. Although myelination is predominantly associated with the mammalian nervous system, in the Central American, wandering spider C. salei myelinated glial cells form a highly specialized “glial‐canal system” that clears cellular waste from neurons. Interestingly, C. salei develops similar neurodegenerative pathologies to humans that are likely linked to impaired, macroglia‐mediated waste clearance from the brain (Fabian‐Fine et al. 2023). We provide strong evidence that a similar glial‐canal system may remove cellular waste from the human and rodent brain. We postulate that in both spider and human brain degeneration onset is likely linked to the structural failure of the canal‐forming macroglia, which consist of myelin and AQP4‐expressing tanycyte‐like cells. We demonstrate that this structural failure results in excessive depletion of neuronal cytoplasm resulting in cell death.
2. Materials and Methods
2.1. Experimental Models and Study Participant Details
2.1.1. Spiders
All procedures relating to spider care and experimental treatments conformed to NIH and Institutional guidelines and were conducted with the approval of the Saint Michael's College Institutional Animal Care and Use Committee (IACUC). Female spiders of the species C. salei were used for this study as the life expectancy of male spiders is usually below 24 months. The arachnids were bred under laboratory conditions (Fabian‐Fine et al. 2023). Healthy animals were selected on the basis of their age, their ability to maintain a perfectly aligned posture on a vertical surface, and appropriate hunting behavior that is typical for young healthy animals. Old, degenerating animals were 24+ months of age, showed an inability to maintain their vertical resting position, and showed a decline in their hunting behavior.
2.1.2. Rats
The hippocampal tissue used in this study originated from healthy 3‐month‐old male Sprague Dawley control rats.
2.1.3. Humans
Ethics Statement. This research complies with Health and Human Services Regulation 45 CFR 46.102(e) and The University of Vermont regulations regarding human subjects research. All human brain tissue was fully consented for the purposes of diagnosis, research, and teaching in accordance with Vermont state law.
The brain samples were obtained from the brains of four Caucasian decedents undergoing autopsy examination at the University of Vermont Medical Center. Tissue samples were not selected on the basis of race, ethnicity, or gender. Identifying gender, ancestry, and socioeconomic status were not obtained from the next of kin. Human brains originated from two decedents with confirmed Alzheimer disease neuropathologic change (ADNC) consisting of an 86‐year‐old female and 86‐year‐old male. The control subjects were 33‐ and 38‐year‐old male and female, respectively.
3. Method Details
3.1. Tissue Preparation for Histology and Electron Microscopy (EM)
3.1.1. Spider Brain
We examined the brains of two 6‐month‐old juvenile animals, two 13‐month‐old healthy adults, and three 24‐ or 36‐month‐old spiders that showed mild (24 month) or severe (36 month) behavioral signs of degeneration. To achieve optimal tissue preservation at both light‐ and ultrastructural levels, the animals were deeply anesthetized with CO2. After removal of the tarsal leg segments, the animals were perfused with freshly prepared ice cold 4% paraformaldehyde (EMS 15710) and 2.5% glutaraldehyde (EMS 16019) in phosphate buffered saline (PBS; pH 7.4, 0.1 M). All procedures were in accordance with IACUC protocols.
3.1.2. Tissue Processing for EM
Spider, rat, and human tissue processed for EM were embedded in 4% agarose (Sigma # A 9539), sectioned into 70–300 µm vibratome sections using a Leica S 1000 vibratome, washed in PBS, and postfixed for 20 min in 1.0% osmium tetroxide (Electron Microscopic Sciences 19150). After washing in PBS (2 × 5 min), the specimens were dehydrated in a graded series of ethanol according to standard EM protocols. The preparations were transferred into propylene oxide (Electron Microscopic Sciences 20401), slowly infiltrated with araldite (Electron Microscopic Sciences 13900), and polymerized overnight at 60°C, according to manufacturer's instructions.
3.1.3. Human Brain Tissue
Samples were obtained promptly following brain removal. Tissue from the decedents with a clinical history of Alzheimer dementia was obtained 15–45 h postmortem. Preparation of human brain tissue for both light and electron microscopic approaches was carried out as described for spider tissue. Diagnostic neuropathologic examination of these brains revealed ADNC with an ABC score of A3B3C2 (female; consistent with a high burden of ADNC) and A2B2C1 (male; consistent with an intermediate burden of ADNC). Significant amyloid plaques and phosphorylated tau tangles were present in the hippocampus and cortex. The control subject tissues were obtained 6‐ and 14‐h postmortem.
3.2. Semi‐ and Ultrathin Sectioning
Araldite‐embedded tissue samples were cut with an 8 mm Diatome histo‐knife altering between 1 µm semithin and 50 nm serial ultrathin sections using a Leica Ultracut E. Sections were stretched with chloroform (Electron Microscopic Sciences 12540).
Semi‐thin sections were collected in distilled water on glass slides and dried on a hot plate at 80°C until completely dry. Staining was performed with 2% aqueous toluidine blue (Sigma 6586‐04‐5) stain for ∼2 min at 80°C and rinsed with distilled water. For this staining to be successful, it is essential that the tissue is not kept in fixative for more than 24 h. On the basis of our experience, the toluidine blue staining does not work as well on tissue that has been kept in paraformaldehyde/glutaraldehyde fixative for longer time periods. The sections were examined and imaged using a Zeiss AxioImager MZ with apotome.
Ultrathin sections were cut at a thickness of 50 nm and collected on pioloform‐coated single‐slot copper or nickel grids (EMS G2010CU). Grids were contrasted with aqueous 1.5% uranyl acetate (6 min) and Reynold's lead citrate (6 min). Electron microscopic examination was conducted using a JOEL 1400 electron microscope operated at 80 kV.
3.3. Light Microscopic Immunohistochemistry
For anti‐AQP4 immunolabeling, three healthy 19‐month‐old female spiders were anesthetized and perfused with 4% freshly made paraformaldehyde as described above. After ∼1 min of perfusion, the legs, pedipalps, cheliceres, and opisthosoma were removed, and the brain was submerged under fixative overnight. The sections were washed in PBS for 4 × 5 min, and unspecific binding sites were blocked with blocking medium containing 0.25% bovine serum albumin (Sigma A4503) and 5% normal goat serum (Sigma G9023) in 1% Triton‐X/PBS for 20 min. The sections were incubated overnight at 6°C within primary rabbit anti‐AQP4 antiserum (BiCell 20104) at a dilution of 1:100 in PBS containing 10% blocking medium. The next day, sections were washed in PBS 3 × 2 and 4 × 5 min and transferred into blocking medium for 20 min prior to incubation with the light‐sensitive secondary antibody (Cy3 goat anti‐rabbit, Jackson ImmunoResearch Laboratories 111‐165‐003; 1:600 in PBS containing 10% blocking medium overnight at 6°C). The immunolabeled sections were washed in PBS (3 × 2 min), stained with Hoechst Blue (Sigma H6024; 1:3000 in PBS for 20 min). After washing in PBS (5 × 5 min), the sections were mounted on glass slides using Mowiol (Sigma 81381). All steps were conducted under minimum illumination to avoid tissue damage and bleaching of the fluorochromes. Anti‐GABA and glutamate immunolabeling was carried out as described previously (Fabian‐Fine et al. 2015). Immunolabeling on human tissue was carried out as described above, except that brain sections were immersed in fixative following post‐mortem autopsy. For anti‐presenilin 1 and anti‐amyloid precursor protein double labeling, anti‐presenilin 1, Sigma # ZRB 1614 and anti‐APP‐C99, Sigma # MABN380 antibodies were used at dilutions of 1:100.
The sections were analyzed using a confocal Zeiss AxioImager with Apotome. For the anti‐AQP4 pre‐absorption controls, the antiserum was pre‐absorbed with an equal volume of blocking peptide for 1 h at room temperature prior to tissue incubation.
3.3.1. Immunoperoxidase Stain for Amyloid Beta and Tau Protein
Beta Amyloid 1–42 (mOC 64, AbCam # 1ab201060) immunostaining was performed on the Leica Bond‐3 autostaining system, heat‐based antigen retrieval, a low pH buffer solution (AR9961; Leica, Bond Epitope Retrieval Solution 1, 10 min), 15 min primary incubation time, and a polymer detection system (DS9800: Leica, Bond Polymer Refine Detection). Tau AT8 (AT8, Thermo Scientific # MN1020) immunostaining was performed on the Leica Bond‐3 autostaining system, heat‐based antigen retrieval, a low pH buffer solution (AR9961; Leica, Bond Epitope Retrieval Solution 1, 10 min), 15 min primary incubation time—at a 1:1600 dilution, and a polymer detection system (DS9800: Leica, Bond Polymer Refine Detection).
3.3.2. Toluidine Blue Stain of Vibratome Sections for Light Microscopic Investigations
Vibratome sections from 4% paraformaldehyde‐fixed tissue were washed in PBS for four wash cycles. Staining with toluidine blue was conducted under visual control by slowly dripping a 2% toluidine blue solution into a petri dish containing brain sections in PBS. The staining was terminated when the neurons appeared appropriately stained for light microscopic investigation without overstaining the preparations. Overstaining will result in the inability to distinguish individual structures in the section. The sections were embedded in Mowiol and examined promptly using an Olympus microscope with differential phase contrast and digital image‐capturing capabilities. The embedding medium will slowly destain the cells; however, cellular debris within the cells remains clearly visible in form of brown deposits.
3.3.3. Luxol H&E Staining of Autopsy Tissue
Brains were immersed in 10% neutral buffered formalin and incubated for at least 1 week at room temperature. Hippocampal tissue was removed from the brains, dehydrated in a graded series of ethanol, infiltrated with 100% xylene (3 × 40 min), and embedded in paraffin (25 min). Sections were cut at 10 µm thickness and mounted on glass slides.
Slides were rinsed in xylene (2×), 100%, and 95% EtOH (1× each) prior to immersion in 0.1% Luxol fast blue solution (Alfa Aesar, A15395) at 60°C overnight. Excess stain was removed with 95% EtOH. Slides were rinsed in distilled water and placed in a 0.05% lithium carbonate solution (2 min) followed by 70% EtOH (2 min). After additional incubation in 0.05% lithium carbonate (1 min), preparations were rinsed in 70% EtOH (1 min) and distilled water. Slides were then stained with hematoxylin (Leica 3801571) for 1 min. Sections were washed (1 min) in water, immersed in defining solution (1 min, Leica 3803598), and rinsed in water (1 min). To enhance staining quality, preparations were suspended in blue buffer (1 min, Leica 3802918) and washed in distilled water (1 min) and 95% EtOH (1 min). Sections were immersed in eosin (2 min, Leica 3801619) and rinsed in 95% EtOH (1 × 30 s and 1 × 1 min). For permanent storage, water was removed by rinsing in sections in 100% EtOH and xylene (2 × 1.5 min each). Sections were permanently mounted using Permaslip Mounting Medium and Liquid Coverslip (Alban Scientific Inc.).
3.4. RNAscope In Situ RNA Hybridization
Detection of AQP4 and glial fibrillary acid protein (GFAP) gene expression was carried out using in situ RNA hybridization. Formalin‐fixed paraffin embedded human hippocampal sections (5 µm) were treated with Bio‐Techne designed complementary probes to both tested proteins. Enzyme‐linked amplifier probes coupled to both probes allowed visualization of target‐specific signal through use of tandem scaffolds. For control purposes, RNA integrity in the tissue sections was tested using in situ hybridization for human peptidylpropyl isomerase B, a low‐level expressed “housekeeping” gene which allowed for the assessment of overall RNA integrity in the stained sections. For negative controls, we utilized the bacterial gene dapB. We assessed RNA integrity (PPIB‐positive and dapB‐negative) for all samples. Visualization of the AQP4 RNA will be achieved via laser scanning confocal microscopy at 40× magnification. The labeling procedure was carried out using a Leica Bond RxM (Leica Biosystems, Deer Park, IL) using protocol ACD Multiplex 2 Plex and all RNAscope 2.5 LSx supporting protocols. Sample preparation consisted of 20 min of bake and dewax followed by a 20 min antigen retrieval in epitope retrieval 2 and a 15 min protease treatment at 95°C. AQP4 was labeled with OPAL 570, and GFAP was labeled with OPAL 650. Samples were counter stained with DAPI.
3.5. Western Blot Analysis
The CNS of a healthy 8‐month‐old spider was dissected in cold PBS and placed in a glass homogenizer containing 1 mL of RIPA lysis buffer (R0278) and 1 part protease inhibitor (Sigma S‐8830) per 10 parts of RIPA buffer. The tissue was manually homogenized for ∼2 min and sonicated for 2 × 5 s to extract transmembrane proteins. The homogenate was centrifuged for 20 min at 6000 × g at 4°C. The supernatant was diluted with an equal volume of 2× Laemmli sample buffer (BioRad 1610737) and denatured at 95°C for 5 min. Proteins were separated using a Mini‐PROTEAN TGX precast polyacrylamide gel (BioRad 456‐1083). Wells were loaded with 30 µL of supernatant and 20 µL of protein standard (BioRad 1610399) ranging from 5 to 250 kDa. The gel was run at 200 V for ∼30 min. Subsequently, the gel was washed in distilled water for 3 × 5 min and incubated in blotting buffer for 5 min. Loading of the blotting chamber and transfer of the proteins into nitrocellulose were performed according to the manufacturer's instructions. For antibody staining, the nitrocellulose membrane containing the transferred proteins was immersed in blocking solution (Tris buffered saline containing 1% Tween 20 [TBS‐T], 0.2% bovine serum albumin, and 5% normal goat serum) for 15 min. Incubation with the rabbit anti‐AQP4 antiserum was carried out overnight at a dilution of 1:10,000 in TBS containing 10% blocking solution at 4°C. After subsequent washing in TBS‐T (4 × 5 min), the secondary antibody (peroxidase‐conjugated goat anti‐rabbit) was used to detect the primary anti‐AQP4 antibody (BioRad 1705046). The secondary antibody was applied for 1 h at a dilution of 1:10,000 in the same blocking solution used for primary antibody dilution under gentle agitation. After renewed washing 4 × 5 min in TBS‐T, immunoreactive protein bands were visualized using the Opti‐4CN Substrate Kit (BioRad 1708235). The nitrocellulose was submerged in a solution of one part diluent with nine parts of purified distilled water. After adding 0.02% of substrate, the blots were agitated under visual control for ∼5 min. Upon visibility of the labeled protein bands, the nitrocellulose was washed in TBS‐T and photographed immediately.
3.6. Light Microscopic Image Acquisition
Toluidine blue‐stained sections were examined and captured using a ZEISS AxioImager. Images were exported using the ZEN‐Blue program. Figures were created using Adobe Photoshop and Illustrator.
3.7. Microscopic Image and Statistical Analysis
Collected images from the two healthy 12‐month‐old adult female spiders and three degenerating 36‐month‐old spiders were analyzed in ImageJ/Fiji for all measurements (Schindelin et al. 2012). Briefly, images were appropriately scaled, median filtered to remove noise, contrast enhanced, aqua‐canals were manually selected with the multi‐point tool, and the interactive morphological reconstruction function in the MorphoLib ImageJ plugin was used to fill the area of the aqua canals (Legland, Arganda‐Carreras, and Andrey 2016). Then, the canals’ areas were thresholded to remove non‐canal areas, and the binary masks were cleaned up manually to match the original images, and the analyze particles ImageJ function was used to measure each canal's area and longest axis. Finally, each canal was classified as being present in either degenerating or healthy tissue areas based on the intactness and regularity of the glial and neuronal membranes.
Unpaired, two‐tailed Student's t‐tests with Welch's correction were used to perform comparisons of the areas and maximum length of glial and neuronal aqua canals (NACs) across degenerating and healthy tissues in the same preparation. All statistical parameters and results are reported in the relevant figure legend. To the best of our knowledge, all assumptions of these tests were met. Statistics were calculated, and graphs were created using Prism 10.0.2 (GraphPad Software).
4. Results
4.1. The Role of Glial‐Canals for Removal of Cellular Debris From Spider Neurons
Healthy neurons in the spider CNS are surrounded by macroglia with large chromatin‐rich nuclei up to 50 µm in diameter (Figure 1A,B). Each macroglia forms numerous lobes that surround several adjacent neurons like the proposed function of mammalian oligodendrocytes. We will thus refer to this spider equivalent as spider‐oligodendroglia (sODG). A specialized characteristic of sODG is the formation of finger‐like myelin processes that project into the neuronal cytoplasm and form glial‐canals of varying shapes and sizes that engulf cellular debris (Figure 1; Figure S1). Both toluidine blue‐stained serial semithin sections and vibratome sections show that these glial‐canals channel cellular waste into lymphatic canals that drain cellular debris from the brain (Figure S1).
FIGURE 1.
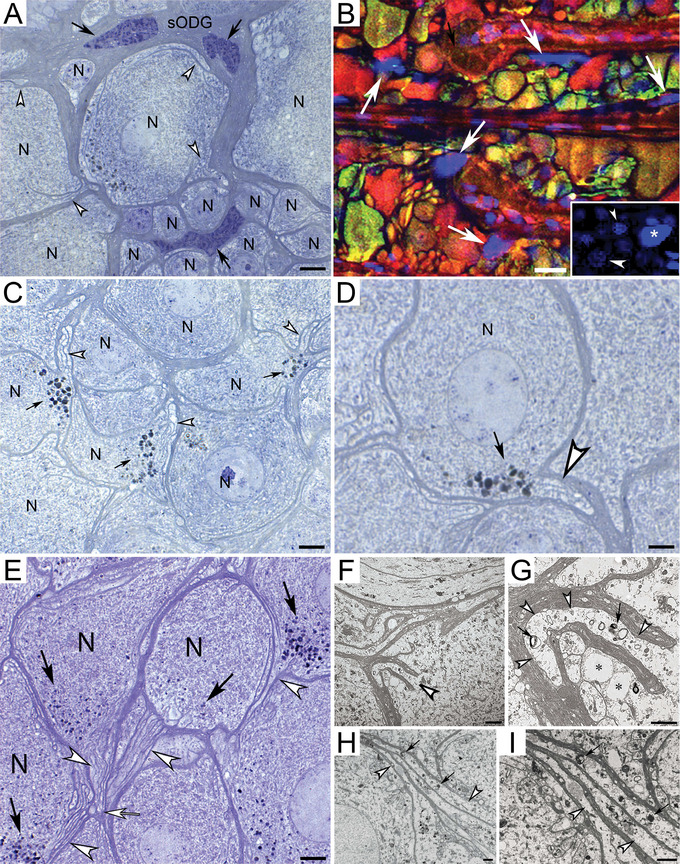
Neurons and sODG in leg and opisthosomal ganglia of Cupiennius salei. (A) sODG with large nuclei (black arrows) is closely associated with neuronal somata (N) and form finger‐like projections into the neuronal cytoplasm (open arrowheads). (B) Confocal image of neurons labeled for Hoechst blue nuclear stain, glutamate (red), and gamma‐aminobutyric acid (green) demonstrates the large size of the chromatin‐rich glial nuclei (white arrows) in comparison to neuronal nuclei (inset; small arrowhead: nucleus of small neuron, large arrowhead: nucleus of large neuron, asterisk: nucleus of sODG). Unstained glial membranes can be observed around neurons. (C and D) Cellular waste (black arrows) accumulates near glial‐canals (open arrowheads). (E) Longitudinal section through extra‐neuronal glial‐canals (open arrowheads) that project from neuronal somata (N) to a common central canal (open arrow), Black arrows: Cellular waste particles. (F–I) Electron micrographs showing large glial‐canals (open arrowheads) in close proximity to each other (black arrows: cellular waste within the canals). Images G and I depict higher magnifications of images F and H, respectively. Asterisks in G: Neuronal glial‐canals. Scale bars: (A) 10 µm, (B) 20 µm, (C) 7 µm, (D and F) 4 µm, (E) 6 µm, (G) 2.5 µm, and (H and I) 2 µm. sODG, spider‐oligodendroglia.
4.2. Ultrastructural Features of sODG That Lead to Glial‐Canal Formation
Ultrastructural examinations show that sODG forms two “lobe” types (Figure 2A–C). The first type called “forming lobes” consists of a circular central sODG‐arm around which gradually expanding circular glial membranes form (Figure 2A,J). These forming lobes were present in all spiders observed here, indicative of regenerative abilities of sODG. The second lobe type referred to as “mature lobes” consists of numerous glial rings that are compacted laterally and take on an elongated appearance whereby the membranes of individual glial rings appear linearly aligned (Figure 2B,C,J). During this compaction, glial cytoplasm and organelles are pushed toward the lateral boundaries (Figure 2C). Besides mitochondria, glial lobes contain two conspicuous structures. First, circular canal‐like profiles (∼250 nm in diameter), recognizable by their clear, unstructured lumina in the following referred to as “glial aqua canals” (GACs; Figure 2C).
FIGURE 2.
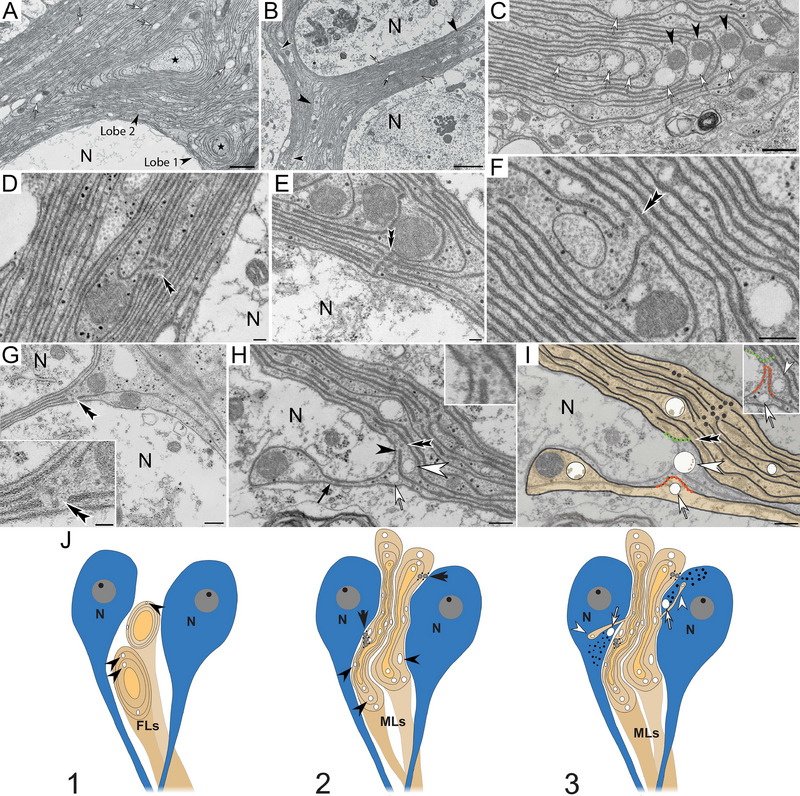
Ultrastructure of spider‐oligodendroglia in leg ganglia. (A) Forming lobes (FLs; Lobes 1 and 2) comprised glial‐arms (star symbol) surrounded by membrane rings. Glial aqua canals (GACs; open arrow). (B) Mature lobes (MLs, open arrow) with linearly arranged membranes (gray arrowhead). Cytoplasm‐rich lobe endings (black arrowheads: ML 1; open arrowheads: ML 2). (C) Glial lobe containing GACs (open arrow) and mitochondria (arrowhead). (D–G) MLs with microtubule‐associated break points (MAB's, double arrowheads). Inset in G: Higher zoom of MAB. (H) Partially detached glial membrane (black arrow). MAB at the attachment site of the glial membrane (double arrowhead; inset). Open arrow: GACs. White arrowhead: neuronal aqua canal. Black arrowhead: microtubule‐associated membrane. (I) Illustration of proposed glial‐canal formation and translocation of GACs into the neuronal cytoplasm. Dissociation of the microtubule (double arrowhead in H) causes the associated membrane (black arrowhead in H) to fuse with the glial membranes indicated by orange and green dotted lines (inset in I), resulting in glia‐canal formation that contains a GAC (open arrow) and a neuronal aqua canal (white arrowhead). (J) Schematic depiction of the proposed myelin lobe maturation. (1) Forming sODG processes (FLs) that contain glial aqua canals (black arrowheads) grow toward neurons (N). (2) the maturing lobes (MLs) elongate, causing adjacent myelin sheaths to arrange in a linear fashion. The myelin is cleaved and the free ends are attached to microtubules (black arrows). (3) Individual myelin sheaths are uncoupled from their microtubule anchors and translocte into the neuronal cytoplasm (white arrowheads) together with the aqua canals (white arrowheads) that swell and create a proposed convective bulk flow into the canals. Black dots: cellular debris. Scale bars: (A) 1 µm, (B) 2 µm, (C) 500 nm, (D) 70 nm, (E) 60 nm, (F) 100 nm, (G) 120 nm, (inset) 60 nm (H and I) 250 nm.
The second structural feature in the following referred to as “microtubule‐associated break points” (MABs) consists of varying numbers of cleaved myelin membranes that are in close association with one or more microtubules (Figure 2D–H). Linear glial membranes in mature lobes that border on neuronal cytoplasm partially detach along MABs and form processes of diverse sizes and shapes that project into the neuronal cytoplasm (Figures 2H and 3). This partial detachment of glial membranes from mature glial lobes likely causes the translocation of GACs into the neuronal cytoplasm (schematic illustration in Figure 2I). We refer to these translocated canals as neuronal aqua canals (NACs). Forming large glial‐canals (Figures 1F–I and 3) are associated with the smaller, electron‐lucent GACs and NACs. These large glial‐canals accumulate waste clusters in or around their lumina commonly referred to as “lipofuscin” (see Section 5) that may be > 2 µm in diameter (Figure 3). Lipofuscin particles appear dark blue in toluidine blue‐stained semithin sections likely consisting of a variety of acidic cellular components. The internalization of waste into glial cells is likely either through phagocytosis (Figure 3F) or through engulfment by one or more glial membranes (Figure 3B,C,F). The distal tips of canal‐forming glial membranes often appear bulbous and contain GAC profiles that form openings into the neuronal cytoplasm (Figure 3J). Networks of membrane cisternae are located around these distal tips (Figure 3C,F,J). The formation of debris‐containing glial‐canals was observed in animals of all ages suggesting that their formation is a normal process by which macroglia ensure controlled waste removal from neurons. Investigation of 6‐month‐old female spiders revealed that larger glial‐canals that are closely associated with GACs, NACs, and MAPs were also present in juvenile brain tissue. The animals usually undergo their final molting stage at the age of 9 months.
FIGURE 3.
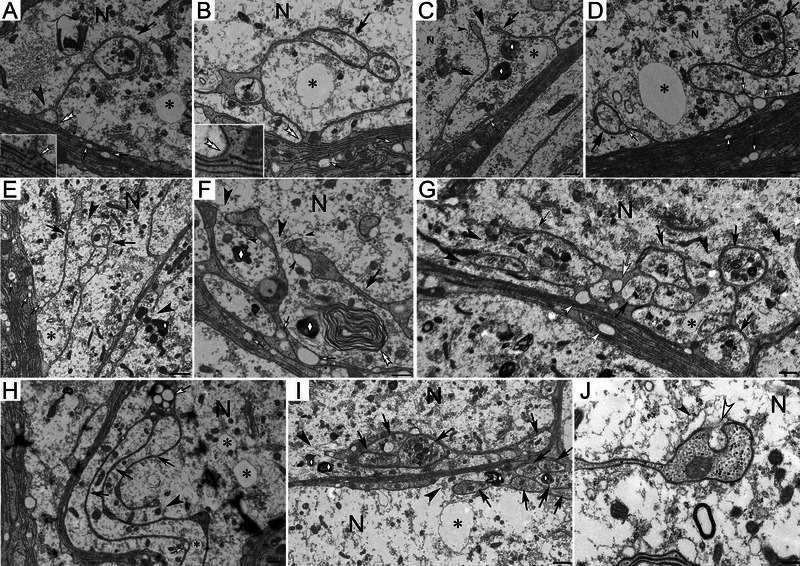
Ultrastructure of spider glial‐canals. (A) Glial process with debris‐filled distal tip (black arrow). MAB with associated microtubule at the attachment site to the glial lobe (double open arrowhead, higher zoom in inset). Glial aqua canal (GAC) devoid of cellular debris (gray arrowhead). (B) Glial process (black arrow) with neuronal aqua canal (NAC; asterisk). MAB lacking a visible microtubule (white double arrowhead). (C–G) Anatomically diverse glial extensions form canals that engulf cytoplasmic organelles and debris (diamond). (H) Unraveling glial processes during detachment stage. Detaching glial membranes (black arrow) form multiple glial‐canals (open arrow). (I) Debris containing glial‐canals (arrow). Open glial‐canals in the neuronal cytoplasm (black arrowhead). Open diamond: cellular waste. (J) Fenestration (open arrowhead) in the distal tip of a glial projection. Symbols: black arrow: canal‐forming glial processes; open arrow: GACs; large black arrowhead: canal openings; small black arrowhead: membrane cisternae near the distal tips of glial processes; asterisk: NACs. (N) Neuronal cytoplasm. Scale bars: (A, B, D, G) 500 nm, (C) 550 nm, (E) 800 nm, (F) 400 nm, (H) 400 nm, (I) 800 nm, and (J) 280 nm.
4.3. Glial‐Canal Systems Show AQP4‐Like Immunoreactivity (AQP4‐LIR)
To investigate our hypothesis that the functional significance of NACs and GACs is to create an aquaporin‐mediated cytoplasmic bulk flow toward glial‐canals to draw cellular waste into the canals, we utilized AQP4‐immunolabeling. Strong AQP4‐LIR was observed within myelinated glial‐canals of varying diameters that are located alongside or within neuronal somata and are distinguishable by their unstructured lumina (Figure 4). We refer to these structures as “glial‐canals.” AQP4‐LIR profiles within the neuronal somata were consistent with the location, shape, and size of both NACs and GACs (Figure 4). Interestingly, the AQP4‐LIR appeared restricted to the canal structures; the cytoplasm of both sODG and neurons appeared unlabeled (Figure 4B,C). Longitudinal AQP4‐immunofluorescent profiles (Figure 4D) are indicative of their canal‐like nature. Western blot analysis revealed specific bands around 25, 125, and 300 kDa, which is within the range of reported molecular weights for AQP4 monomers and polymers (Figure 4E) (Agre et al. 2002; Verkman and Mitra 2000). To identify the cells that give rise to the AQP4‐LIR glial‐canals, we have investigated serial coronal sections through the spider brain and surrounding tissue. We detected AQP4‐LIR in cells lining a tubular system that borders dorsally onto the CNS and is continuous with the gastrointestinal tract (Figure 4F). One cell type that showed strong AQP4‐LIR forms characteristic long tubular processes that contain varying numbers of fluorescent particles (Figure 4G,H). The processes of these cells were observed projecting into the brain tissue.
FIGURE 4.
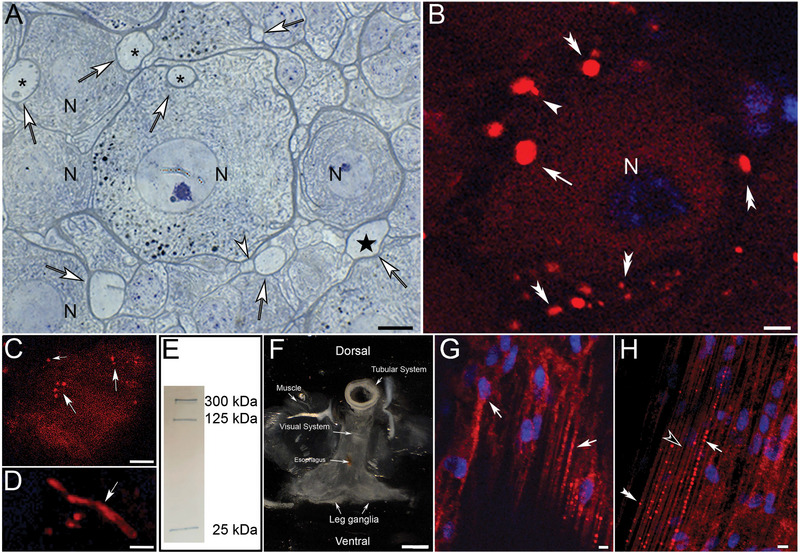
Aquaporin‐4‐immunolabeled cell projections in leg ganglia of Cupiennius salei. (A) Toluidine blue‐stained semithin section through neuronal somata (N) shows numerous glial‐canals with distinct, unstructured lumina (open arrow). Although some canals are present on the outer edges of neuronal somata (star), others send their projections into the neuronal cytoplasm (asterisk). Arrowhead: Glial‐canals in close contact indicative of branching profiles. (B and C) AQP4‐immunoreactive glial‐canals within healthy neurons (white arrows) and surrounding spider oligodendroglia (double arrowheads). Note that the cytoplasm of the oligodendroglia and neurons appear immunoS‐negative. (D) Longitudinal section through aquaporin‐immunoreactive glial‐canals (arrow). (E) Western blot analysis reveals specific bands around 25, 125, and 300 kDa, which is within the range of reported molecular weights for AQP4 monomers and polymers. (F) Coronal section with attached structures shows the proximity of the CNS to the dorsal canal system that is continuous with the gastric tract of the animals. (G) Strongly immunoreactive spider tanycytes (arrows) in the lining of the tubular tract form slender projections that contain fluorescent particles. (H) Spider tanycytes with varying amounts of fluorescent particles (arrowhead: devoid, double arrowhead: few particles; arrow: numerous particles). Hoechst blue: cell nuclei. Scale bars: (A) 10 µm, (B) 5 µm, (C) 10 µm, (D) 5 µm, (F) ∼3 mm, (G) 5 µm, and (H) 6 µm.
4.4. Cellular Hallmarks of Progressive Neurodegeneration
To identify cellular changes during neurodegeneration onset, we have investigated the CNS of adult spiders with mild behavioral signs of neurodegeneration (Fabian‐Fine et al. 2023). The brain tissue appeared predominantly healthy; however, individual neurons showed localized areas with abnormal changes in both sODG and adjacent neuronal cytoplasm (Figure 5A,B). The underlying cause for localized neuronal abnormalities is the excessive unraveling of mature sODG lobes leading to increased formation of glial‐canals each engulfing neuronal cytoplasmic content (Figure 5). Membranes in healthy sODG are regularly aligned and contain numerous microtubules (Figure 5C). Glial membranes in degenerating sODG are less regularly aligned, contain more cytoplasmic content, and appear curved with few visible microtubules (Figure 5C,D). Both diameter and area of individual GACs are significantly larger in degenerating sODG (0.342 and 0.084 µm2, respectively) compared to healthy sODG (0.240 and 0.033 µm2; Figure 5G,H), indicative of swelling GACs. These observations are consistent with the hypertrophic appearance of degenerating sODG. At the ultrastructural level, the neuronal perimeter shows large numbers of partially detached glial membranes that project into the neuronal cytoplasm engulfing cytoplasmic content (Figure 5E,F). This process coincides with the formation of numerous swelling NACs that originate at the neuron glial border in areas where sODG unravel (Figure S2; Figure 6A,C).
FIGURE 5.
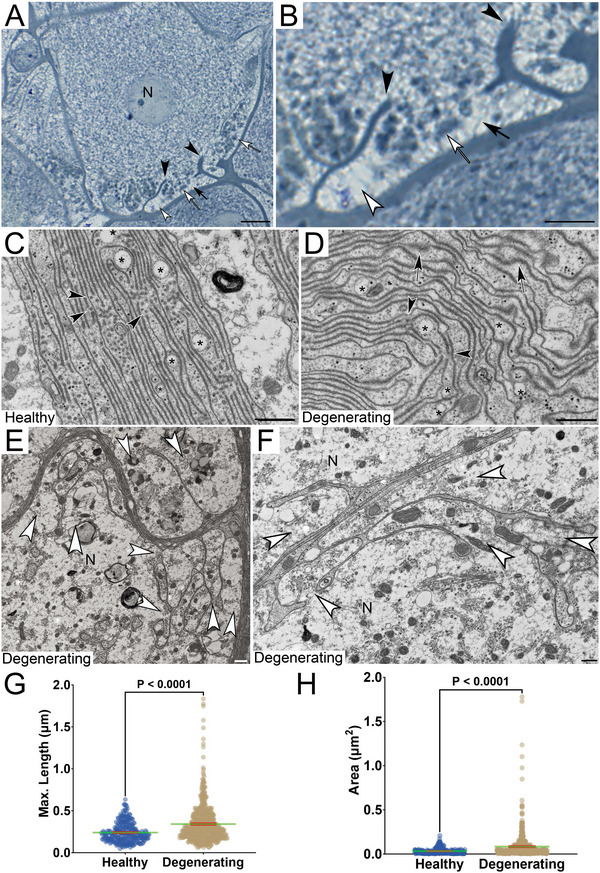
Degeneration onset in spider leg ganglion. (A and B) Neuron with largely intact cytoplasm (N) shows localized unraveling oligodendroglia whose membranes project into neuronal cytoplasm (black arrow) and engulf cytoplasmic content (open arrow). Translocated NACs increase in diameter, causing a translucent appearance of the cytoplasm (open arrowhead). (C and D) Ultrastructure of healthy (C) and degenerating oligodendrocytes (D). Membranes in healthy spider‐oligodendroglia (sODG) are regularly aligned and contain numerous MABs (black arrowheads) compared to degenerating cells that show signs of structural disintegration (black arrows). Asterisks: GACs. (E and F) Ultrastructural depiction of area shown in B reveals numerous glial‐canals (white arrowheads) in the neuronal cytoplasm (N) engulfing cytoplasmic content. (G) Average maximum diameter of the GACs originating from two 12‐month‐old healthy spiders and three 36‐month‐old degenerating animals is significantly larger in degenerating (0.342 µm) compared to healthy tissue (0.240 µm; t(841.2) = 8.555, p = 5.546 × 10⁻¹⁷, unpaired t‐test). (H) The average area of the GACs is significantly larger in degenerating (0.084 µm2) compared to healthy tissue (0.033 µm2; t(697.8) = 7.650, p = 6.691 × 10⁻¹⁴, unpaired t‐test). Scale bars: (A) 10 µm, (B) 5 µm, (C–F) 500 nm.
FIGURE 6.
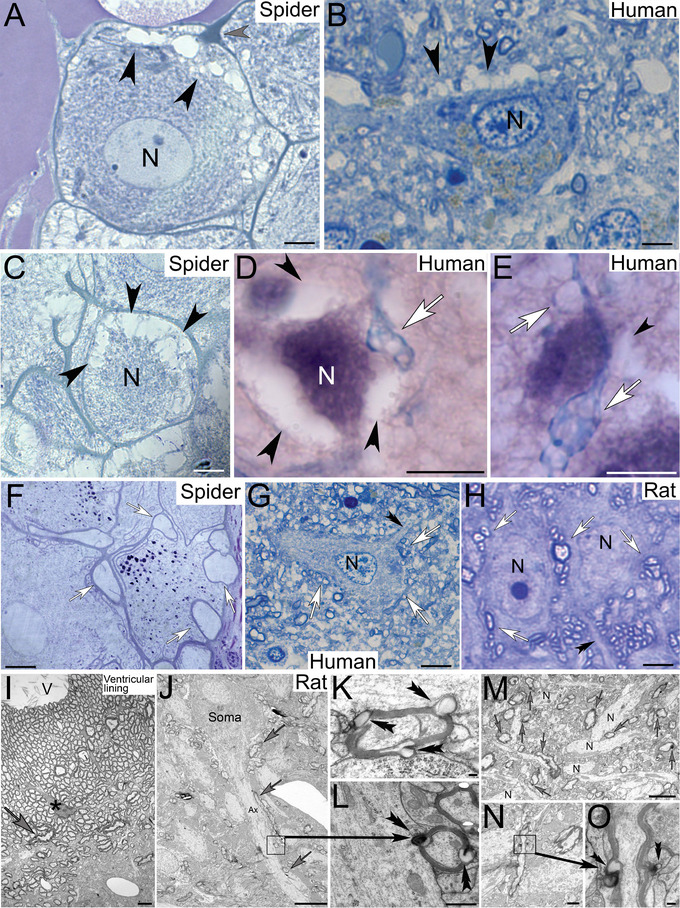
Healthy and degenerating neurons in (a) spider leg ganglia, (b) human motor cortex and hippocampus from patients with Alzheimer disease neuropathologic change, and (c) healthy rat hippocampus. (A) Spider neuron with swelling NACs (black arrowheads) at the cell cortex near hypertrophic sODG (gray arrowhead). (B) Motor cortex neuron (N) with spongiform abnormalities (black arrowheads). (C) Progressing degeneration of a spider neuron (N) shows advanced cytoplasmic depletion around the cellular cortex (black arrowheads). (D and E) Similar peripheral cytoplasmic depletion (black arrowheads) around degenerating hippocampal neurons originates from hypertrophic Luxol blue‐stained ependymal cell processes (white arrows). (F–H) Healthy spider (F), human (G), and rat (H) neurons are closely associated with glial cell profiles whose inner lumina appear clear (open arrows) in comparison with the cytoplasmic appearance of neurites (double arrowheads). (I) Ultrastructural appearance of myelinated glial cell projections in rat hippocampus. Varicose myelinated cell processes (gray arrow) are formed by ependymal glial cells (asterisk) in the ependymal lining. (J) Rat hippocampal pyramidal cell is contacted by myelinated glial cells including along the axon hillock (ax) adjacent to the neuronal soma (gray arrows) and more distal axonal areas. Although the glial cells are myelinated, the clearly identifiable neuronal axon lacks myelination. (K and L) Higher magnification of varicosity‐forming myelinated glial projections that project into adjacent cell profiles (double arrowheads). The glial profile in L contacts the neuronal axon shown in J (arrow) and contains electron‐dense material in the forming varicosity indicative of cellular waste. (M) Lower magnification of rat hippocampus demonstrates the consistency by which myelinated glial cells form varicose protrusions (gray arrows) onto adjacent neuronal processes (N). (N and O) Longitudinal section through a myelinated glial cell process that forms varicose protrusions (box) into adjacent cell profiles (double arrowheads in O). Scale bars: (A) 7 µm, (B) 5 µm (C) 9 µm, (D–G) 10 µm, (H) 4 µm, (I) 2 µm, (J) 5 µm, (K) 2 µm, (L) 0.8 µm, (M and N) 100 nm, and (O) 500 nm.
Interestingly, degeneration onset most often appeared adjacent to glial‐canals where larger glial lobes detach, unravel, and deplete the surrounding cytoplasmic content (Figure S2). Compared to healthy brain tissue (Figure S2A,B), the hypertrophic and darker appearance of the toluidine blue‐stained glial‐canals is consistent with increased uptake of cellular debris (Figure S2D,E). Progressive swelling of NACs accompanied by depletion of neuronal cytoplasm explains the spongiform and increasingly “hollow” appearance of affected neurons that originates around the neuronal perimeter (Figure S2D,G). In advanced neurodegeneration, only centrally located cytoplasmic structures, including the neuronal nucleus, remain (Figure S2D,G). Advanced degeneration results in the rupture of sODG lobes that separate the neuronal cytoplasm from adjacent glial‐canals (Figure S2F) facilitating the complete cytoplasmic evacuation from neurons. We propose the term “gliaptosis” to describe this glial‐induced neuronal cell death via evacuation of cytoplasmic content by adjacent myelinated macroglia.
4.5. Similarities of Degenerating Human and Spider Neurons
Investigation of hippocampus from human Alzheimer decedents (AD) shows that cellular changes in degenerating neurons are strikingly similar to those in affected spider neurons. This includes (a) spongiform appearance of neuronal somata that originates at the outer perimeter of affected neurons (Figure 6A,B) and (b) gradual depletion of cytoplasm that progresses toward the center (Figure 6C–E). Luxol H&E‐stain, in which myelinated structures appear blue, demonstrates that spongiform pathologies in human AD‐affected neurons are also associated with myelinated cell profiles that project into neuronal somata (Figure 6D,E). Although mammalian neurons investigated here lack the thick myelination around their somata observed in spiders, they are contacted by myelinated cell processes that show striking resemblance to myelinated glial‐canals observed in spider nervous tissue (Figure 6F–H).
4.6. Mammalian Ependymal Glial Cells Project Varicose, Myelinated Processes From the Ventricular Lining Into the Brain
Until now we assumed that myelinated cell profiles in the hippocampal formation are myelinated axonal profiles. However, following these cell processes at both light‐ and electron microscopic levels in both human and rodent brain revealed that they form within the somata of ependymal glial cells in the temporal horn of the lateral ventricle (Figures 6, 7, 8). Their multinucleated (syncytial) nature (Figure 8D) suggests that these glial cells form a vast network of myelinated tanycyte‐like cells whose long varicose processes project into the hippocampal formation (see Section 5). In our ultrastructural investigations in human, mouse, and rat hippocampal tissue, we observed myelination of glial, but not axonal processes. Using serial section analysis of the hippocampus, axonal processes were unmyelinated but were consistently paralleled and contacted by varicose myelinated glial cell processes, possibly representing a hitherto unforeseen role for myelination in the brain.
FIGURE 7.
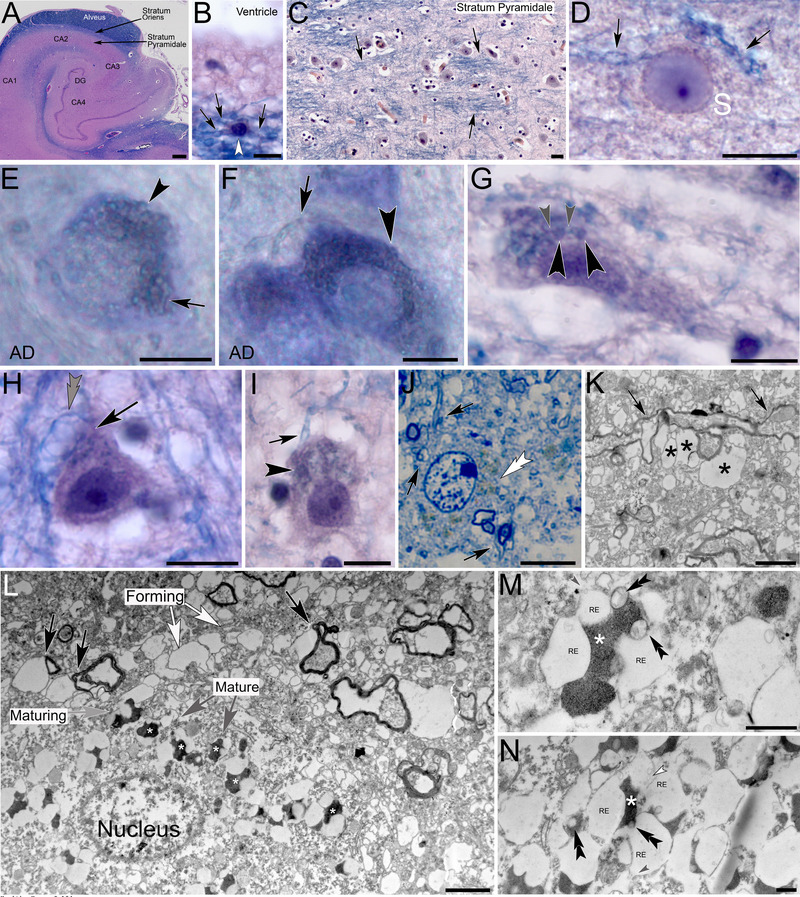
Myelinated ependymal cell processes in human hippocampus form varicose protrusions that give rise to waste internalizing receptacles. (A) Luxol H&E‐stained hippocampus shows the abundance of (blue‐stained) myelin within the alveus. (B) Ependymal cell soma in the alveus (white arrowhead) with slender varicose processes that appear strongly stained for Luxol blue indicative of the myelinated nature (black arrows). (C) Vast numbers of myelinated glia processes transect into the stratum pyramidale (black arrows). (D) Glia processes (black arrows) transect into a neuronal soma (S) and give rise to circular protrusions. The blue appearance of the protrusions is indicative of their myelin‐derived nature. (E and F) Toluidine blue‐stained vibratome sections show neuronal somata in the brain of an Alzheimer decedent (AD) that are densely obstructed with myelin‐derived protrusions (black arrowheads) Black arrows: glia processes. (G–I) Luxol H&E‐stained sections through cell somata of an AD decedent show the formation of numerous myelin‐derived varicose protrusions (black arrowheads). Black arrows: glial processes; gray arrowheads: fine processes that connect adjacent protrusions. Please note the spongiform glial process adjacent to the neuron in H (gray double arrowhead). (J) Toluidine blue‐stained 1‐µm semithin section through a neuronal soma with myelin‐derived receptacles that appear light brown in coloration (white double arrowhead). Black arrows: myelinated glial processes. (K) Electron micrograph of myelinated, varicose glial process (black arrows) that forms peripheral myelin‐derived protrusions (asterisks). (L) Electron micrograph of myelin‐derived protrusions that emanate from glial processes (black arrows) and transect into a neuronal soma (nucleus). Electron‐lucent forming protrusions (forming) differentiate (maturing) into waste internalizing (mature) receptacles that internalize cellular debris (white asterisks). (M and N) Higher magnification of mature waste receptacles. Central compartments are filled with electron‐dense material (white asterisks). Openings that contain vesicular structures (black double arrowheads in M) connect central compartments with electron‐lucent interconnected (gray arrowhead) receptacles (RE) that contain membranous and vesicular structures (white arrowhead). Scale bars: (A) 1 mm, (B–J) 10 µm, (K and L) 2 µm, (M and N) 500 nm.
FIGURE 8.
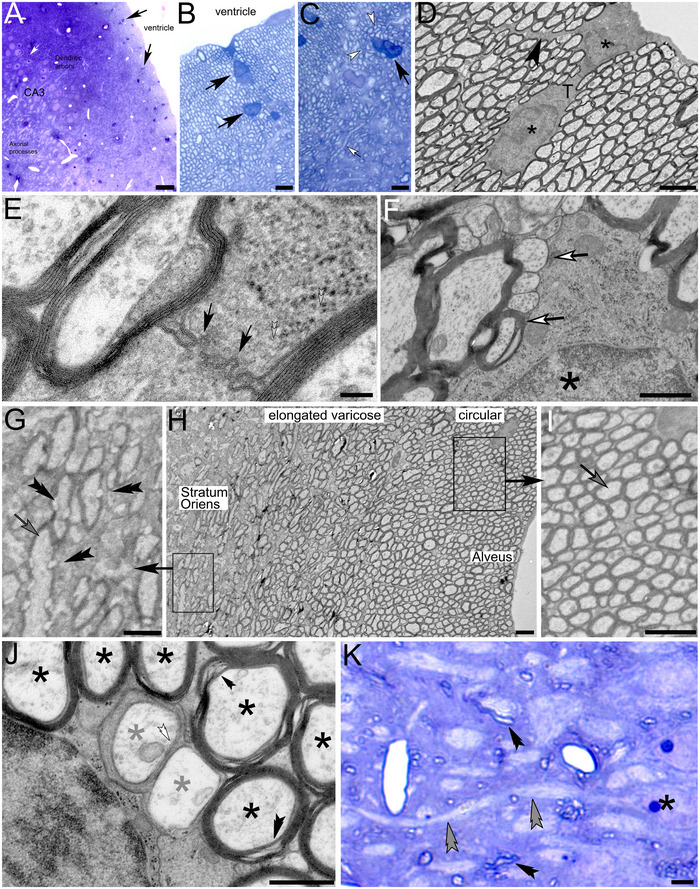
Myelinated ependymal cells in the ventricular lining near the CA3 region of rat hippocampus. (A–C) Toluidine blue semithin sections show scattered somata with characteristic large nuclei in the alveus adjacent to the lateral ventricle (black arrows). Numerous myelinated circular processes (white arrowheads) emanate from the ependymal cells. Increasing elongation can be observed in dark‐blue‐stained myelinated processes that pull into the stratum oriens (white arrow in C). (D) Two nuclei (asterisks) within connected cytoplasm demonstrate the syncytial and reticular nature of these cells (black arrowhead). (E) Myelin‐projects from the cytoplasm of a glial cell toward forming myelinated processes. (F) Forming cell processes at varying stages of myelination (white arrows). Asterisk: glial nucleus. (G–I) Lower magnification images of the alveus demonstrate the gradual formation of protrusions (double arrowheads in G) along myelinated glial processes that pull into the stratum oriens. Ventricle‐facing processes appear circular with fewer protrusions (arrow in I). (J) Cross sections through forming (gray asterisks), unmyelinated profiles (white double arrowhead), and myelinated glial profiles (black asterisks) with prominent myelination that is transected by canal‐like structures (black double arrowheads). (K) Toluidine blue‐stained semithin section through the stratum pyramidale containing narrow glial processes whose myelin sheath appears dark blue (black arrowheads). Double arrowhead: Axon projecting from the soma of a pyramidal cell (asterisk). Please note the absence of dark myelination around the axon in both proximal and distal areas relative to the neuronal soma. Scale bars: (A) 20 µm, (B and C) 3 µm, inset in (B) 8 µm, (D) 2 µm, (E) 100 nm, (F) 500 nm, (G) 1 µm, (H) 2 µm, (I) 1 µm, (J) 500 nm, (K) 4 µm.
4.7. Formation of Varicose Myelin‐Derived Waste Receptacles by Ependymal Glial Cells
The consistency by which myelinated glial processes form varicose structures that project into the cytoplasm of adjacent neurons and glial cells becomes apparent at the ultrastructural level (Figure 6I–N). Please note that the perfused rat tissue shows well‐preserved axonal processes, mitochondria, synaptic profiles, myelin, and cell membranes. Numerous varicosities were filled with electron‐dense material consistent with our hypothesis of waste internalization (Figure 6L). In the human brain serial section, analysis of semithin and ultrathin sections demonstrates that these myelin‐derived protrusions differentiate into specialized waste‐internalizing receptacles, previously described as “lipofuscin granules” (Figure 7). Vast numbers of long myelinated cell profiles originated from ependymal tanycyte‐like glial cells and consistently formed varicose projections into adjacent cells at both light an electron microscopic level in both human and rodent tissue (Figures 6, 7, 8). Particularly in human brain the consistently narrow myelinated, blue‐stained cell processes can clearly be seen to project into neuronal somata where they give rise to circular protrusions consistent with our observations in 70‐µm thick vibratome sections, 1‐µm thick semithin sections and ultrastructural observations of human brain (Figure 7). Ultrastructural investigations demonstrate that individual receptacles consist of a centrally located waste‐internalizing canal that forms openings into adjacent electron‐lucent receptacles (Figure 7M,N). The latter form openings to the neuronal cytoplasm and contain vesicular structures (Figure 7M). In the brains of AD decedents, these receptacles appeared more abundant and hypertrophic, explaining the dense cytoplasmic obstructions in neuronal somata of affected tissue (Figure 7E,F). Hypertrophic swelling was also observed in the somata and cell processes of these ependymal glial cells, indicative of structural abnormalities.
4.8. Glial Cell Processes That Project Into Neuronal and Glial Somata and Differentiate Into Waste Receptacles Appear Aβ‐Immunoreactive
Amyloid β 42 immunolabeling of brain tissue from non‐AD decedents demonstrates that immunoreactivity is first observed in form of small circular puncta around the cellular cortex in areas where glial processes enter the cell somata, gradually proliferating toward the center (Figure 9A–C). Neurons with signs of early degeneration are densely obstructed with Aβ‐labeled circular structures whose appearance is consistent with the appearance of waste receptacles (Figure 9D,E).
FIGURE 9.
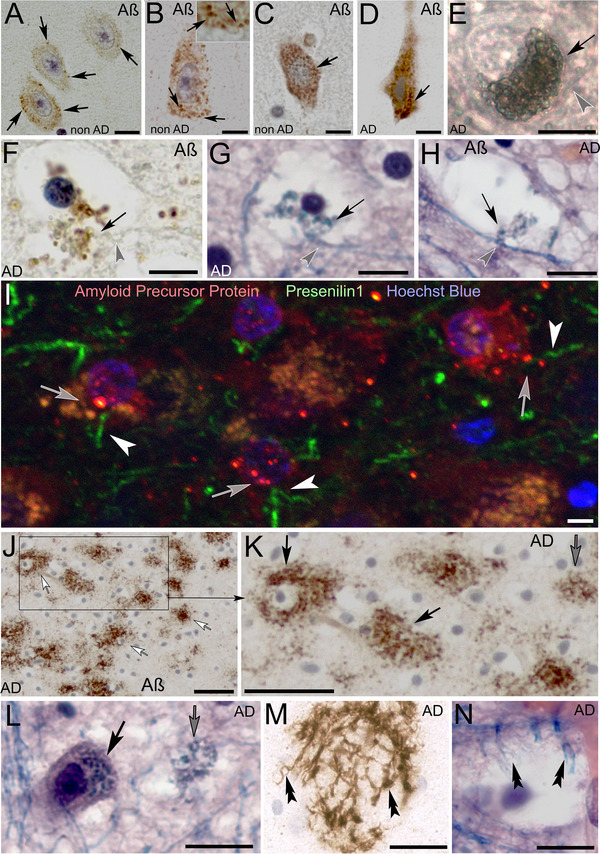
Amyloid β labeling in neurons of non‐Alzheimer (non‐AD) and Alzheimer‐affected (AD) human brain. (A–C) Amyloid β immunolabeling within neurons in AD‐unaffected brain tissue demonstrates the initial formation of few Aβ‐immunoreactivity sites around the cellular cortex (arrows in A–C) resembling differentiating waste receptacles in the neuronal cytoplasm (arrows and inset in B). (D) Neuron in the early stage of degeneration is densely obstructed with swelling Aβ‐immunolabeled waste receptacles (black arrow). (E) Vibratome section containing a glial cell soma that is densely obstructed with swelling waste receptacles. Gray arrowhead: varicose cell process that pulls toward the soma. (F and G) Glial cell profile with cell processes (Aβ‐labeled in F and Luxol H&E‐stained in G) that proliferate into waste receptacles as as they (gray arrowheads in F, G) enter the cell (arrows). Please note the absence of Aβ‐staining along the tanycyte process prior to entering the cell in F (gray arrowhead). (H) Cell profile with waste receptacles (arrow) that protrude from a Luxol H&E‐stained glial process (gray arrowhead). (I) Presenilin 1 (green), amyloid precursor protein (red) double labeled vibratome section of the CA2 region of a non‐AD decedent. In areas where varicose presenilin 1 immunoreactive glial processes (arrowheads) penetrate into cell somata (Hoechst blue‐stained nuclei), circular amyloid precursor protein labeled circular profiles can be observed (arrows). (J and K) Structures in the CA2 stratum pyramidale commonly described as Aβ plaques (white arrows in J) resemble degenerating neurons that are densely obstructed with Luxol H&E‐stained tanycyte receptacles (compare black arrows in K and L). Smaller plaques resemble remaining waste receptacles in degenerated neurons (compare gray arrows in K and L). (M and N) Amyloid β plaque and Luxol H&E‐stained tanycyte‐like profiles with varicose protrusions are remaining in advanced degeneration. Scale bars: (A–D) 10 µm, (E) 16 µm, (F and G) 12 µm, (H) 25 µm, (I) 5 µm, (J and K) 50 µm, (L) 25 µm, (M and N) 30 µm.
The presence of Aβ‐labeled glial protrusions is clearly visible in advanced stages of degeneration, where cell somata are largely depleted of their cytoplasmic content (Figure 9F). The appearance of Luxol H&E‐stained glial protrusions that project into neurons and glial cell somata is consistent with those observed in Aβ‐immunolabeled preparations (Figure 9F–H). Interestingly, the glial processes that penetrate adjacent cell somata are void of Aβ labeling prior to entering the somata. In contrast, the intracellular glial processes that differentiate and proliferate into waste receptacles are Aβ‐immunoreactive. Immunolabeling demonstrates that the glial projections are immunoreactive for presenilin 1 and co‐localize with amyloid precursor protein in areas where the glial processes first enter cell somata and from circular protrusions that resemble waste receptacles (Figure 9I). Closer investigation of Aβ‐plaques in the brains of AD decedents demonstrates their resemblance to neuronal and glial cell somata that are obstructed with hypertrophic, Aβ‐immunoreactive waste receptacles (Figure 9J,K) and are consistent with glial cell protrusions in Luxol H&E‐stained neuronal profiles (Figure 9L). We observed similar glial projections that proliferate into waste receptacles associated with brain capillaries in both Luxol H&E‐stained and Aβ‐labeled preparations.
4.9. Evidence That Tau Tangles May Represent Myelinated Waste‐Internalizing Ependymal Glial Cell Projections
To test our hypothesis that anti‐tau immunoreactive neurofibrillary structures may not only represent tau accumulation within neurons (Figure 10J,M–O,Q), but also within AQP4‐expressing waste‐internalizing glial cells, we have carried out (a) serial section analysis from the brain of an AD decedent in which subsequent sections were processed in an alternating fashion for anti‐tau immunolabeling (e.g., Section 1) followed by a Luxol‐blue‐stained section (Section 2, etc.) and (b) AQP4 immunolabeling and RNAscope in situ hybridization. Our findings demonstrate that myelinated AQP4‐IR glial cells in the alveus form numerous protrusions and circular structures along their slender processes (Figure 10A). Similar protrusions were observed in Luxol‐blue‐stained glial processes (Figure 10E,G), anti‐tau immunolabeled preparations (Figure 10F,H), in toluidine blue‐stained vibratome sections (Figure 10L), and at the ultrastructural level (Figure 10T). Anti‐tau immunolabeled glial processes and somata were also observed in the alveus, further supporting our hypothesis that myelinated AQP4‐expressing ependymal cell processes may internalize tau‐protein for removal from the brain via the ventricular areas (Figure 10C,D).
FIGURE 10.

Myelinated ependymal glial cells in the human hippocampus of an AD‐decedent transect into neurons and form myelin‐derived waste internalizing receptacles. (A) Strongly AQP4 immunoreactive tanycyte processes that emanate from the alveus form numerous varicosities (arrows) and circular processes (arrowheads, insets). Blues stain: Hoechst Blue nuclear stain. (B) Ependymal glia soma (asterisk) in the alveus forms myelinated cell processes indicated by Luxol blue stain (arrows). (C and D) Glial somata in the alveus (asterisks) and their varicose processes (arrows) are immunoreactive for tau protein. (E–H) Myelinated tanycyte processes that project from the alveus into the stratum pyramidale show Luxol myelin stain (E and G) and anti‐tau immunolabeling (F and H). Electron‐lucent varicosities that form along the slender glia cell processes are void of both myelin and anti‐tau stain (arrows). (I) Luxol H&E‐stained soma is transected by a myelinated glia cell process (arrow) that gives rise to spherical myelin‐derived receptacles within the soma (arrowhead). (J) Anti‐tau‐stained neuronal soma with spherical inclusions (arrowhead) is transected by a varicose anti‐tau immunolabeled glial process (arrow). (K) Luxol H&E‐stained neuronal soma is transected by myelinated glial process (arrow) that gives rise to numerous spherical inclusions (arrowhead) indicative of their myelin‐derived origin. (L) Toluidine blue‐stained neuronal soma that is transected by varicose glial processes (arrow) that give rise to intraneuronal spherical protrusions (arrowheads). (M–O) Different focal planes through an anti‐tau labeled neuronal soma that is transected by a varicose glial process (arrow) that transects into the neuron where it forms numerous varicose protrusions (arrowheads). (P) Luxol H&E‐stained tanycyte process (gray arrowheads) transects into neuronal soma where it branches into three projections (arrows). (Q) Anti‐tau immunolabeled neuron is transected by a varicose glial process (arrowhead) that is visible within the neuronal soma (arrows). (R) Typical varicose appearance of an ependymal glia process consisting of bulging electron‐lucent areas (small arrows) and anti‐tau immunolabeled areas (large arrows). (S and T) Ultrastructural depiction of myelinated glial processes shows the characteristic compartmentalization into bulging electron‐lucent (small arrows) and electron‐dense (large arrows) compartments. AQP4, aquaporin‐4; N, neuronal nuclei. Scale bars: (A and B) 5 µm, (C–Q) 10 µm, (R) 5 µm, (S) 500 nm, (T) 2 µm.
4.10. Evidence That Waste Uptake Into Ependymal Glial Processes May Be Both Myelin and AQP4 Mediated
AQP4‐immunolabeling of human hippocampus shows that the ependymal glial processes that project from the alveus into the stratum pyramidale are strongly AQP4‐LIR (Figures 10A and 11B). These findings are consistent with gene expression using RNAscope in situ hybridization where AQP4 RNA is detected in a subpopulation of cells in the ependymal lining. To investigate whether AQP4‐gene expression is restricted to astrocytes, which are currently assumed to be the main AQP4‐expressing cells in the mammalian brain, we have utilized double labeling for AQP4 and GFAP, a protein expressed in mammalian astrocytes that is a commonly utilized astrocyte marker. On the basis of staining patterns, we were able to distinguish at least four different cell populations: (a) AQP4‐expressing ependymal cells whose somata were approximately 10 µm in diameter (Figure 11C,E,G), (b) AQP4/GFAP co‐expressing cells (Figure 11G), (c) cells with large round nuclei and somata (> 10 µm) that show GFAP expression only (Figure 11G), and (d) cells that do not express AQP4 or GFAP (Figure 11E–G). These observations pose the question whether all GFAP‐expressing astrocytes express AQP4. Immunolabeling demonstrates that somata of astrocytes are often void of AQP4‐LIR like neuronal somata (Figure 11H–J), consistent with the lack of AQP4 RNA in some GFAP‐expressing cells. Interestingly, myelinated cell profiles can be observed projecting alongside and into astrocytes at the ultrastructural level (Figure 11K–M). The strong signal for AQP4 in our RNA‐scope experiments suggests high gene expression levels within AQP4‐expressing ependymal cells. We propose that myelin‐derived receptacles with narrow openings to the neuronal cytoplasm form around a central AQP4‐expressing glia canal that creates a convective bulk flow into the glial cell.
FIGURE 11.
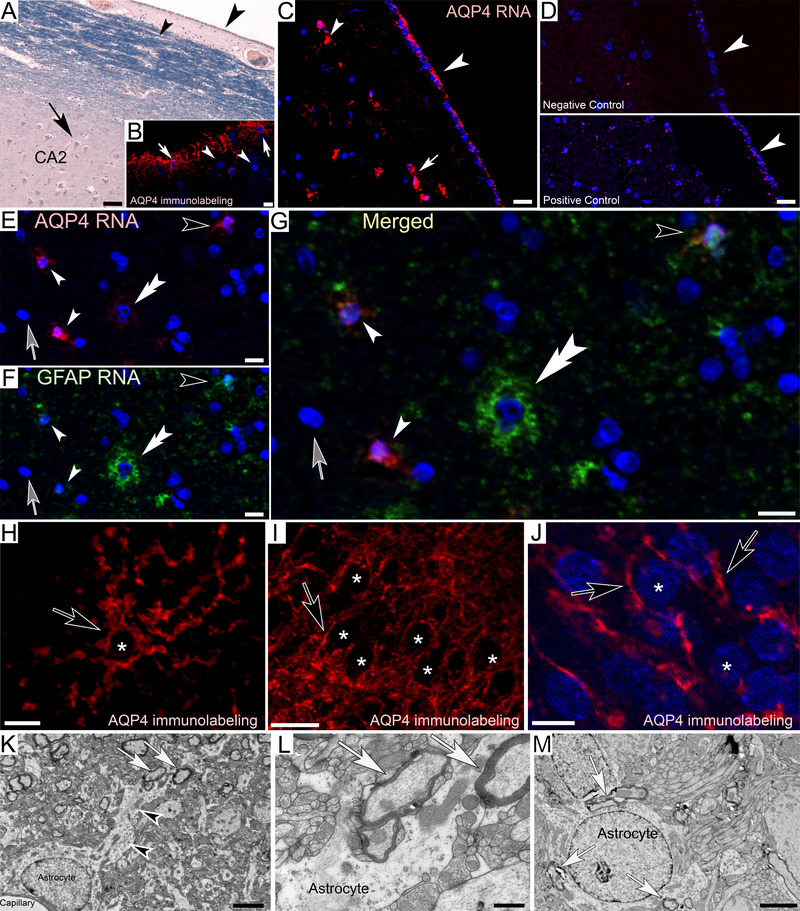
Aquaporin‐4 (AQP4) and glial fibrillary acid protein (GFAP) expression in human hippocampus. (A) Luxol H&E‐stained section adjacent to the ventricular lining in the temporal horn of the lateral ventricle. Somata of ependymal cells can be observed lining the ventricular border (large arrowhead) and in the adjacent Luxol blue‐stained alveus (small arrowhead). Arrow: CA 2 stratum pyramidale. (B) AQP4‐immunolabeling in the alveus shows abundant immunolabeling in ependymal cells and their long, slender processes (white arrows) that project into the stratum pyramidale. Other cells whose Hoechst blue‐stained nuclei are clearly visible lack immunolabeling (white arrowheads). (C) AQP4 RNA in situ hybridization (RNAscope) shows strong AQP4 expression in a subpopulation of ependymal cells of the outer ependymal lining (large arrowhead) and in the alveus (small arrowhead) consistent with AQP4‐immunolabeling. Fluorescent processes of neighboring somata appear connected via fluorescent processes (white arrow). (D) Negative controls show only random background labeling (white arrowhead in top panel). Positive controls for the housekeeping gene Peptidylpropyl isomerase B show RNA staining at expected levels (white arrowhead bottom panel). (E–G) RNA co‐expression for AQP4 and GFAP reveals at least four differently stained cell groups. (a) AQP4‐expressing ependymal cells whose somata are ∼10 µm (small white arrowheads), (b) co‐expressing ependymal cells (black arrowheads), (c) cells with somata > 10 µm that show GFAP expression only (white double arrowhead), (d) cells that do not express either gene (Hoechst blue nuclei, gray arrows). (H–J) AQP4‐immunolabeling of astrocyte (H) and neuronal (I and J) cell profiles demonstrate the lack of immunoreactivity within their somata (asterisks). Varicose, immunoreactive cell processes can be observed along the outside of the somata (black arrows). (K–M) Ultrastructural depiction of astrocyte somata and their processes (black arrowheads) that are closely associated with varicose, myelinated cell profiles (white arrows). Scale bars: (A) 35 µm, (B) 10 µm (C) 20 µm, (D) 40 µm, (E) 20 µm, (F–I) 10 µm, (J) 16 µm, (K) 2 µm, (L) 500 nm, (M) 2 µm.
On the basis of our findings, we postulate that both healthy spider and mammalian neurons are contacted by myelinated AQP4‐expressing ependymal glial cells (Figure 12). We propose that these glial processes create an AQP4‐mediated bulk flow toward the tanycyte. We hypothesize that the main purpose of human myelin‐derived outer receptacles with their narrow openings is the controlled intake of size‐appropriate waste particles to prevent blockage of narrow glia canals. We postulate that this reticular cell network is formed by ependymal tanycytes due to (a) their syncytial nature, (b) their AQP4‐expression, and (c) our observations that they form vast numbers of long slender processes that project into the brain parenchyma (see Section 5). We propose that the structural impairment and hypertrophy of these cells may cause excessive formation and swelling of protrusions observed in neurons of Alzheimer patients resulting in glia‐mediated neuronal cell death, a process we term “gliaptosis” (Figure 12).
FIGURE 12.

Schematic illustration of proposed waste removal glial‐canals in healthy and degenerating spider (A and B) and human (C and D) neurons. (A) Spider neuron (blue) and surrounding sODG (beige) are transected by aquaporin‐LIR tanycyte‐like glial processes (green). Both types of glial cells contribute to the formation of glial‐canals that channel cellular debris from the neuron into the lymphatic system and out of the CNS. Large black arrowheads: glial‐canal openings; black arrows: canal‐forming glial membranes; small black arrowheads: membrane cisternae; black double arrowhead: microtubule‐associated break point; white arrowhead: closed glial‐canal; open arrow: neuronal aqua canal (B) sODG with hypertrophic abnormalities lead to uncontrolled formation of glial‐canals and excessive depletion of neuronal cytoplasm resulting in gliaptosis. (C) Human hippocampal pyramidal cell (blue) is contacted by myelinated AQP4‐IR ependymal glial cells (beige, insets 1, 2, 3, 6, 11) that form varicose projections into the neuron for removal of cellular debris (inset 9), arrows indicate postulated flow of debris toward the alveus. (D) Degenerating neurons are contacted by tau‐protein immunoreactive glial processes (insets 4, 5, 7, 8, 12). Numerous hypertrophic myelin‐derived receptacles obstruct and deplete the neuronal cytoplasm of affected neurons (insets 10, 13, 14). Schematics not drawn to scale.
5. Discussion
Here, we provide evidence that myelinated, AQP4‐expressing ependymal glial cells likely play a pivotal role in waste removal from the brain parenchyma in both spider and mammalian central nervous system. In mammalian hippocampus myelinated ependymal, glial cells emanate from the temporal horn of the lateral ventricle and form a vast interconnected reticulum. We postulate that presenilin 1, amyloid precursor protein, and Aβ may play an important role in the differentiation and proliferation of waste receptacles in healthy neurons. We postulate that debris is likely flushed toward varicose myelin‐derived glial receptacles via the formation of an AQP4‐mediated bulk flow. We propose that cellular waste is internalized into central glial‐canals that drain into cerebrospinal fluid. We provide strong evidence that the functional and structural failure of this canal system results in catastrophic swelling of myelin‐derived glial protrusions and pathological depletion of cytoplasmic content from affected neurons into glial cells. We propose that blockage‐induced hypertrophy and the resulting impairment of waste removal through this glial‐canal system should be investigated as one possible underlying cause for neurodegeneration in Alzheimer patients and other neurodegenerative diseases that show similar spongiform abnormalities of neuronal tissue.
5.1. Oligodendrocytes vs. Myelinated Ependymal Tanycytes
Currently, the formation of myelin in the CNS is solely attributed to oligodendrocytes that ensheathe neuronal axons (Dimou et al. 2008; Seeker and Williams 2022; Simons and Nave 2015). However, the findings presented here suggest that a second myelin‐forming cell type may exist, the function of which may be waste removal from the brain. As demonstrated here, the ependymal myelin‐forming cells in the hippocampal alveus differ from oligodendrocytes in functional, biochemical, and anatomical characteristics. (a) Although oligodendrocytes are individual cells, the ependymal glial cells described here form multinucleated syncytia. (b) The processes of myelinated ependymal glial cells shown here are not axonal processes but are glial cell processes that are formed and myelinated in the somata of the ependymal cells in the alveus and contact neurons and glial cells in form of varicose protrusions. (c) The ependymal glial cells shown here form numerous varicosities, which have not been reported for oligodendroglia. Due to the electron‐lucent appearance of these varicosities, we postulate that these varicose structures may be caused by AQP4‐mediated water influx into the glial cells. We postulate that the convective flow created by this water influx draws cellular waste into the glial cells explaining the electron‐dense nature observed in numerous protrusions demonstrated here. We postulate that this internalized “waste‐fluid” is drained from the glial cells via specialized apical drainage canals similar to those observed in spider CNS. (d) Oligodendrocytes have been reported to lack AQP4 expression (Amiry‐Moghaddam and Ottersen 2003) unlike the ependymal glial cells investigated here. (e) As demonstrated here, the cell processes of myelinated ependymal glial cells resemble those of tanycytes that send long slender processes into the brain parenchyma. Our observations support previous findings by Pasquettaz et al. (2021) who have demonstrated the formation of intraneuronal tanycyte protrusions in mouse brain. Due to these observations, we propose that the ependymal glial cells described here represent the tanycytes described by Pasquettaz et al. In the following, we will thus refer to the myelinated ependymal glial cells as (hippocampal) “myelinated tanycytes.”
5.2. Myelinated Tanycytes and Their Role in AQP4‐Mediated Waste Clearance and Neurodegeneration
To our knowledge, the identity and significance of vast numbers of heavily myelinated tanycyte processes within the hippocampal formation have not been described. Until now, myelination in the CNS is thought to be exclusively associated with oligodendrocytes with its main purposes being attributed to myelination of axonal processes for rapid signal transduction along axons and metabolic support (Seifert and Steinhäuser 2018; Simons and Nave 2015; Stadelmann et al. 2019). Our observations demonstrate that (a) myelination may not be a sufficient criterion to identify axonal processes in the absence of other identifying criteria or serial section analysis and (b) that imperfections in myelin may not be due to fixation artifacts or disease (Möbius et al. 2010; Möbius, Nave, and Werner 2016) but may indeed be due to functional characteristics. Current knowledge regarding the functional significance, types, and regenerative potential of tanycytes is fragmentary. Mammalian tanycytes have been described in the lining of the third ventricle and have been shown to send long slender processes into surrounding brain parenchyma. Among their proposed roles are energy and nutrient supply to neurons, regulatory functions at the brain–blood barrier and neurohormonal secretion (Dali, Estrada‐Meza, and Langlet 2023). Electrophysiological investigations on cultured tanycytes indicate that their long processes do not propagate electrical impulses (De Francesco et al. 2017). Currently, four types of tanycytes are distinguished: α‐1 and ‐2, ß‐1 and ‐2 (Ebling and Lewis 2018). However, on the basis of their immunohistochemical and ultrastructural investigations, Pasquettaz et al. (2021) proposed that additional types may exist, which is supported by our observations (Bolborea and Dale 2013; Dali, Estrada‐Meza, and Langlet 2023; Doetsch, Garcıa‐Verdugo, and Alvarez‐Buylla 1997; Pasquettaz et al. 2021; Prevot et al. 2018). The strong AQP4 gene expression in our in situ experiments is consistent with our hypothesis that these ependymal cells form a vast network of AQP4 containing myelinated fibers that form a convective flow into the ependymal cell process for the internalization of cellular waste products from adjacent tissue. The lack of AQP4 expression in some GFAP‐expressing astrocyte‐like glial cells highlights the importance to revisit their proposed AQP4‐expression. If astrocytes indeed synthesize large numbers of AQP4, we would expect strongly immunoreactive somata, reflective of the place of protein synthesis. Our observations suggest that different types of astroglia may exist. Our ultrastructural observation of tanycyte processes projecting alongside and into astrocytes may explain the AQP4‐immunoreactivity observed along astrocyte processes whose somata lack AQP4 expression similar to our observations along neuronal profiles. Controversies regarding diverse astrocyte types have been reported earlier (Walz 2000). We postulate that tanycytes eliminate potentially harmful noxious chemicals from astroglia at the brain–blood barrier.
5.3. Tau Tangles and Aβ Plaques in AD‐Affected Brain Tissue
The uptake of cellular waste from neurons into myelinated tanycytes would explain the observation of tau protein within tanycyte projections in degenerating brain tissue shown here. The observed distribution of Aβ within neurons in AD‐unaffected tissue is consistent with earlier findings by Kobro‐Flatmoen, Hormann, and Gouras (2023). The punctate Aβ signal in close association with tanycyte projections that transect into neuronal somata poses the question whether Aβ is part of the structural architecture of differentiating waste receptacles and forms due to interactions between tanycyte‐derived (e.g., presenilin 1) and neuron‐derived (e.g., β‐secretase) proteins as tanycytes transect into the neuronal cytoplasm. We are currently investigating the hypothesis that these interactions induce sprouting and maturation of tanycyte receptacles similar to previously reported secretase‐mediated vascular sprouting (Durrant et al. 2020). Such a pathway would govern the space‐ and time‐appropriate formation of waste receptacles.
5.4. Potential Pathologies Associated With AQP4‐Mediated Bulk Flow
The AQP4‐mediated bulk flow proposed by Iliff et al. (2012) provides a compelling mechanism by which cellular waste may be flushed toward drainage canals.We propose that such a bulk flow may cause the accumulation of cellular debris within the AQP4‐IR tanycyte protrusions shown here. Our observations of hypertrophic tanycyte protrusions that cause the obstruction and likely depletion of cytoplasmic content from neurons and glial cells demonstrate vulnerabilities of AQP4‐mediated bulk flow. To ensure that intracellular waste is effectively drawn toward the receptacles, appropriate regulation of flow strength is critical. Insufficient flow strength may result in the accumulation of cellular waste within neurons. In contrast, excessive flow strength may lead to the uncontrolled obstruction and depletion of neuronal somata shown here. We propose that the structural impairment and resulting hypertrophy of tanycytes may be one of the main causes for neurodegeneration. Such swelling may be explained by obstruction of drainage canals within tanycytes. We postulate that obstruction of this canal system may cause an imbalance whereby waste uptake exceeds waste drainage. The resulting increase in turgor within affected tanycytes would explain the hypertrophic swelling of myelin protrusions and spongiform pathologies in the brains of AD decedents described here. Aquaporin‐mediated swelling of cells has been described in Xenopus laevis oocytes that were injected with AQP1‐water channel cRNA. Resulting water flow into the oocytes resulted in significant swelling and ultimate bursting of the cells (Preston et al. 1992). The swelling pattern of aquaporin‐expressing cells is well known and utilized in the investigation of aquaporin blockers (Wang, Solenov, and Yang 2023). We stress that such patterns are consistent with our observation of hypertrophic AQP4‐expressing tanycytes whose somata, projections, and protrusions appear to swell in AD‐affected brain tissue. Such swelling may be explained by insufficiently catabolized waste that blocks narrow tanycyte processes. Interestingly, the linkage between infections and neurodegeneration has been suggested (Bruno et al. 2023; Mancuso et al. 2019; Sait, Angeli, Doig, and Day 2021; Sigurdson, Bartz, and Glatzel 2019). Of particular interest are reported fungal infections in context with neurodegeneration. It is conceivable that exogenous fungal proteins may not be catabolized as efficiently as endogenous cellular waste and thus block narrow tanycyte processes. Such evidence is provided in a study by Alfonso et al. who show the presence of fungal proteins in structures that resemble tanycyte processes (see Fig. 4 in Alonso et al. 2015). We would like to highlight the importance to investigate ependymal glial cells and the degree to which they express AQP4 and possibly isoforms of aquaporin channels. We further propose to investigate the ultrastructural distribution and the extent of myelinated cell profiles that express AQP4 and can thus be distinguished from neuronal axon profiles, which lack AQP4 expression. For this purpose, we propose to utilize serial‐section immuno EM.
5.5. Myelin‐Mediated Waste Removal in Spider Compared to Mammalian CNS
Although the proposed myelin and AQP4‐mediated waste removal mechanisms postulated in this study share compelling similarities between arachnids and mammals, it is currently unknown whether these mechanisms are homologous or analogs in origin. Myelination in invertebrate neurons is considered unusual (Boullerne 2016; Hartline and Colman 2007; Roots 1984); however, the presence of myelin has previously been reported in a variety of invertebrate organisms (Hartline and Colman 2007), including crustaceans that are closely related to arachnids (Davis et al. 1999). We argue that the anatomical foundation for the glial‐canal system proposed here—although structurally altered—appears highly conserved between arachnids and mammals and alludes to the vital importance of this system for the functional integrity and survival of neurons. Compared to arachnids, the mammalian brain has evolved favoring increased numbers of (a) neurons, (b) dendritic arbors, and (c) synaptic connectivity in exchange for structurally smaller neurons and glial cells. It is likely due to this evolutionary trend and spatial limitations that waste clearance mechanisms in mammals have been reduced to myelinated tanycyte projections along neuronal somata and neurites compared to the space‐occupying perisomatic myelination in spiders. In both the proposed arachnid and mammalian glial‐canal systems, the three key components that form the structural and functional foundation for these proposed “waste canals” are (a) long slender cell processes that contain waste‐internalizing compartments shown here. (b) myelin‐derived waste receptacles by which cellular debris is internalized into tanycytes, and (c) AQP4‐mediated bulk flow that draws cellular waste toward the receptacles. We propose that the role of myelin is the formation of renewable waste receptacles intraneuronal projections and membrane cisternae that are important for continued waste uptake.
5.6. Quality of Tissue Preservation
The ultrastructural methodologies used here have previously been utilized successfully in both mammalian (Chandler et al. 2003; Reid, Fabian‐Fine, and Fine 2001; Ruiz et al. 2003, 2004) and spider brain tissue (Fabian‐Fine et al. 2023; Fabian‐Fine, Meinertzhagen, and Seyfarth 2000). As in each of the experiments, both healthy and degenerating brain samples were processed together, it is unlikely that the consistently observed unraveling of glia cells in degenerating brain tissue demonstrated here is due to differences in tissue preservation. To assess whether tanycyte protrusions observed in human tissue may be due to fixation artifacts caused by comparatively long postmortem intervals, we have processed perfused rat brain. The consistency by which tanycytes form peripheral myelin protrusions in both systems suggests that they are not due to fixation artifacts.
5.7. Lipofuscin vs. Tanycyte Receptacles
The presence of tanycyte protrusions in mammalian and human neurons has been described previously; however, these structures have been identified as “lipofuscin” rather than tanycyte receptacles (Boellaard, Harzer, and Schlote 2006; Nahirney and Tremblay 2021; Schildge et al. 2013). Most (but not all) lipofuscin particles described in C. salei appear as a heterogenous population of blue‐stained particles in toluidine blue semithin sections (Fabian‐Fine et al. 2023). In contrast, waste receptacles in human brain appear yellowish brown as demonstrated here, see also Gray and Woulfe (2005). We therefore suggest not to use the word lipofuscin interchangeably. The structural appearance of mammalian waste receptacles described here is likely specialized to prevent larger debris particles from blocking the long and narrow tanycyte processes. Larger waste particles likely must be catabolized prior to removal from the brain. We propose to investigate the role of proteolytic enzymes such as caspases in tanycyte‐mediated waste metabolism.
5.8. The Role of Microtubules and MAB Points in Glial‐Canal Formation, Waste Clearance, and Neurodegeneration in C. salei
To our knowledge, MABs have not been described previously, and it is unclear whether they exist in the mammalian system. We postulate that MABs provide a sustainable mechanism for controlled glial‐canal formation by anchoring cleaved glial membranes to glial‐derived microtubules. On the basis of our findings, we further propose that selective severance of these microtubule/membrane anchors by regulatory proteins ensures the controlled release of glial membranes into the neuronal cytoplasm and provides a tightly regulated and sustainable formation of glial‐canals for waste clearance in healthy spider brain. This would explain the chromatin‐rich appearance of sODG as this mechanism would require the continued formation of glial lobes and thus coincide with high levels of gene expression. The dynamic instability of microtubules that consist of heteromeric alpha and beta tubulin dimers (Goodson and Jonasson 2018; Kirschner and Mitchison 1986) makes them uniquely suitable for such regulatory processes. Three main characteristics of microtubules provide the basis for our hypothesis: (a) the interactions of microtubules with a large variety of proteins and other cellular structures, (b) the existence of numerous regulatory proteins that govern the dynamic instability of microtubules, and (c) the stability of polymerized microtubules and their ability to securely anchor cellular components that critically rely on their structural integrity for survival of the system.
Close interactions of microtubules with a variety of cellular structures are largely mediated through microtubule‐associated proteins (Goodson and Jonasson 2018). Such interactions include motor proteins (Sweeney and Holzbaur 2018), membrane‐bound organelles (Kanfer et al. 2017; Lomakin et al. 2011), chromosomes (Gudimchuk and McIntosh 2021), syncytial nuclei (Eckerle et al. 2018; Solnica‐Krezel and Driever 1994), and cell adhesion molecules (Ligon et al. 2001). Particularly considering our ultrastructural evidence, it is thus reasonable to postulate that microtubules anchor cleaved glial membranes to provide a readily available membrane pool for the formation of glial‐canals to ensure reliable waste removal. A large variety of known microtubule‐regulating proteins have been described to modulate the dynamic of microtubules, including controlled formation, stabilization, and dissociation (Baas et al. 2016; Goodson and Jonasson 2018). Among the large variety of regulatory proteins are severases, a family of microtubule‐cleaving AAA‐ATPases, including spastin, katanin, and fidgetin (Hartman and Vale 1999; Kuo and Howard 2021). It is feasible that the abnormal upregulation of severases in sODG may lead to uncontrolled severance of MAB's explaining the catastrophic unraveling of glial membranes described here. Another hypothesis to explain the catastrophic dissociation of microtubules builds on a possible downregulation or posttranslational modification of microtubule stabilizing proteins such as tau‐protein, which has long been implicated as an underlying cause for multiple neurodegenerative conditions (Askenazi et al. 2023; Blas Gil 2019; Congdon and Sigurdsson 2018; Fernando 2018; Kiani 2023; Perry and Press 2013, 2018; Philippe 2013). Our observations that sODG around degenerating neurons contains fewer visible microtubules and appears less regularly aligned support our hypothesis that the cause for the catastrophic unraveling of glial membranes from degenerating sODG may be due to pathologies of microtubule‐regulating proteins. As this dissociation predominantly originates around spider tanycytes, we propose that these regulatory processes may be controlled by spider tanycytes and that their structural impairment may trigger the pathological processes described here.
6. Conclusion
We have utilized gene expression, immunohistochemical, ultrastructural, and light microscopic methods to investigate the structural foundation of neurodegeneration in human brain and acknowledge the current limitations of this study due to low sample numbers and the lack of functional studies. However, the significance of our findings is profound and opens new approaches to investigate the underlying causes for neurodegeneration. Our failure to recognize myelinated tanycytes in the brain parenchyma may be due to our prevailing perception that myelination in the brain is exclusively associated with axonal profiles and that protrusions are likely due to fixation artifacts. This study demonstrates the importance to revisit anatomical characteristics of the nervous system utilizing modern imaging technology. To investigate the underlying mechanisms by which myelinated glial cells internalize cellular debris in both invertebrates and vertebrates, it is imperative to conduct both functional studies using multiphoton microscopy and serial section analysis of these canal systems together with three‐dimensional reconstructions.
Author Contributions
Ruth Fabian‐Fine: conceptualization. Ruth Fabian‐Fine, Adam L. Weaver: funding acquisition. Ruth Fabian‐Fine: methodology. Ruth Fabian‐Fine: project administration. Ruth Fabian‐Fine: supervision. Ruth Fabian‐Fine, John C. DeWitt, Melanie J. Winters, Abigail G. Roman: investigation. Ruth Fabian‐Fine and Adam L. Weaver: visualization. Adam L. Weaver: formal analysis. Ruth Fabian‐Fine, Adam L. Weaver and John C. DeWitt: resources. Ruth Fabian‐Fine: validation. Ruth Fabian‐Fine: writing–original draft. Ruth Fabian‐Fine, Adam L. Weaver, John C. DeWitt: writing–review and editing.
Conflicts of Interest
Together with Saint Michael's College, R.F.‐F. holds a provisional patent to assess AQP4 activity in context with neurodegeneration.
Peer Review
The peer review history for this article is available at https://publons.com/publon/10.1002/cne.70000.
Supporting information
Figure S1 Glial‐canals in leg ganglion neurons originating from adult female spiders.
Figure S2 Neurodegenerative progression in spider leg ganglia.
Acknowledgments
The authors would like to thank Nathaniel Fabian‐Fine for conducting the AQP4 pre‐absorption control experiments, and capturing the light microscopic images used in Figure S1. We are grateful to Taylor Galgay and Kaitlyn Folsom for spider care. We thank Drs. Christopher Francklyn, Mark Nelson, Mark Lubkowitz, Douglas Taatjes, Heather Driscoll, and Gary Mawe for support and helpful feedback on this work. We thank Ann and Dr. David MacLaughlin for their generous donation to fund the Zeiss confocal microscope used here. Electron Microscopic work was performed at the Microscopy Imaging Center at the University of Vermont (RRID: SCR_018821). We thank Timothy Connolly, Nicole Bouffard, Laura Crowley, Kyra Lee, and Brad Vietje for technical support. Research reported in this publication was supported by an Institutional Development Award (IDeA) from the National Institute of General Medical Sciences of the National Institutes of Health under grant number P20GM103449. Its contents are solely the responsibility of the authors and do not necessarily represent the official views of NIGMS or NIH.
Funding: Research reported in this publication was supported by an Institutional Development Award (IDeA) from the National Institute of General Medical Sciences of the National Institutes of Health (Grant P20GM103449).
Data Availability Statement
The data that support the findings of this study are available from the corresponding author upon reasonable request.
References
- Abbott, N. J. , Pizzo M. E., Preston J. E., Janigro D., and Thorne R. G.. 2018. “The Role of Brain Barriers in Fluid Movement in the CNS: Is There a ‘Glymphatic’ System?.” Acta Neuropathologica 135, no. 3: 387–407. 10.1007/s00401-018-1812-4. [DOI] [PubMed] [Google Scholar]
- Agre, P. , King L. S., Yasui M., et al. 2002. “Aquaporin Water Channels—From Atomic Structure to Clinical Medicine.” Journal of Physiology 542, no. 1: 3–16. 10.1113/jphysiol.2002.020818. [DOI] [PMC free article] [PubMed] [Google Scholar]
- Alonso, R. , Pisa D., Marina A. I., et al. 2015. “Evidence for Fungal Infection in Cerebrospinal Fluid and Brain Tissue From Patients With Amyotrophic Lateral Sclerosis.” International Journal of Biological Sciences 11, no. 5: 546–558. [DOI] [PMC free article] [PubMed] [Google Scholar]
- Amiry‐Moghaddam, M. , and Ottersen O. P.. 2003. “The Molecular Basis of Water Transport in the Brain.” Nature Reviews Neuroscience 4, no. 12: 991–1001. [DOI] [PubMed] [Google Scholar]
- Askenazi, M. , Kavanagh T., Pires G., Ueberheide B., Wisniewski T., and Drummond E.. 2023. “Compilation of Reported Protein Changes in the Brain in Alzheimer's Disease.” Nature Communications 14, no. 1: 4466. 10.1038/s41467-023-40208-x. [DOI] [PMC free article] [PubMed] [Google Scholar]
- Baas, P. W. , Rao A. N., Matamoros A. J., and Leo L.. 2016. “Stability Properties of Neuronal Microtubules.” Cytoskeleton 73, no. 9: 442–460. [DOI] [PMC free article] [PubMed] [Google Scholar]
- Blas Gil, E. 2019. Alzheimer's Disease: Pathological and Clinical Findings. Sharjah: Bentham Science Publishers Ltd. [Google Scholar]
- Boellaard, J. W. , Harzer K., and Schlote W.. 2006. “Variations of the Ultrastructure of Neuronal Lipofuscin During Childhood and Adolescence in the Human Ammon's Horn.” Ultrastructural Pathology 30, no. 5: 387–391. 10.1080/01913120600854137. [DOI] [PubMed] [Google Scholar]
- Bolborea, M. , and Dale N.. 2013. “Hypothalamic Tanycytes: Potential Roles in the Control of Feeding and Energy Balance.” Trends in Neurosciences 36, no. 2: 91–100. 10.1016/j.tins.2012.12.008. [DOI] [PMC free article] [PubMed] [Google Scholar]
- Boullerne, A. I. 2016. “The History of Myelin.” Experimental Neurology 283, no. pt. B: 431–445. 10.1016/j.expneurol.2016.06.005. [DOI] [PMC free article] [PubMed] [Google Scholar]
- Bruno, F. , Abondio P., Bruno R., et al. 2023. “Alzheimer's Disease as a Viral Disease: Revisiting the Infectious Hypothesis.” Ageing Research Reviews 91: 102068. 10.1016/j.arr.2023.102068. [DOI] [PubMed] [Google Scholar]
- Chandler, K. E. , Princivalle A. P., Fabian‐Fine R., Bowery N. G., Kullmann D. M., and Walker M. C.. 2003. “Plasticity of GABA(B) Receptor‐Mediated Heterosynaptic Interactions at Mossy Fibers After Status Epilepticus.” Journal of Neuroscience 23, no. 36: 11382–11391. [DOI] [PMC free article] [PubMed] [Google Scholar]
- Congdon, E. E. , and Sigurdsson E. M.. 2018. “Tau‐Targeting Therapies for Alzheimer Disease.” Nature Reviews Neurology 14, no. 7: 399–415. 10.1038/s41582-018-0013-z. [DOI] [PMC free article] [PubMed] [Google Scholar]
- Cserr, H. F. , and Ostrach L. H.. 1974. “Bulk Flow of Interstitial Fluid After Intracranial Injection of Blue Dextran 2000.” Experimental Neurology 45, no. 1: 50–60. 10.1016/0014-4886(74)90099-5. [DOI] [PubMed] [Google Scholar]
- Dali, R. , Estrada‐Meza J., and Langlet F.. 2023. “Tanycyte, the Neuron Whisperer.” Physiology & Behavior 263: 114108. [DOI] [PubMed] [Google Scholar]
- Davis, A. D. , Weatherby T. M., Hartline D. K., and Lenz P. H.. 1999. “Myelin‐Like Sheaths in Copepod Axons.” Nature 398, no. 6728: 571. 10.1038/19212. [DOI] [PubMed] [Google Scholar]
- De Francesco, P. N. , Castrogiovanni D., Uriarte M., et al. 2017. “A Simple Strategy for Culturing Morphologically‐Conserved Rat Hypothalamic Tanycytes.” Cell and Tissue Research 369: 369–380. [DOI] [PubMed] [Google Scholar]
- Dimou, L. , Simon C., Kirchhoff F., Takebayashi H., and Götz M.. 2008. “Progeny of Olig2‐Expressing Progenitors in the Gray and White Matter of the Adult Mouse Cerebral Cortex.” Journal of Neuroscience 28, no. 41: 10434–10442. [DOI] [PMC free article] [PubMed] [Google Scholar]
- Doetsch, F. , Garcıa‐Verdugo J. M., and Alvarez‐Buylla A.. 1997. “Cellular Composition and Three‐Dimensional Organization of the Subventricular Germinal Zone in the Adult Mammalian Brain.” Journal of Neuroscience 17, no. 13: 5046–5061. 10.1523/JNEUROSCI.17-13-05046.1997. [DOI] [PMC free article] [PubMed] [Google Scholar]
- Durrant, C. S. , Ruscher K., Sheppard O., Coleman M. P., and Özen I.. 2020. “Beta Secretase 1‐Dependent Amyloid Precursor Protein Processing Promotes Excessive Vascular Sprouting Through NOTCH3 Signalling.” Cell Death & Disease 11, no. 2: 98. [DOI] [PMC free article] [PubMed] [Google Scholar]
- Ebling, F. J. , and Lewis J. E.. 2018. “Tanycytes and Hypothalamic Control of Energy Metabolism.” Glia 66, no. 6: 1176–1184. [DOI] [PubMed] [Google Scholar]
- Eckerle, S. , Ringler M., Lecaudey V., Nitschke R., and Driever W.. 2018. “Progesterone Modulates Microtubule Dynamics and Epiboly Progression During Zebrafish Gastrulation.” Developmental Biology 434, no. 2: 249–266. [DOI] [PubMed] [Google Scholar]
- Fabian‐Fine, R. , Aiken A. M., Aug J. R., et al. 2023. “Neurodegeneration in a Novel Invertebrate Model System: Failed Microtubule‐Mediated Cell Adhesion and Unraveling of Macroglia.” Journal of Comparative Neurology 531, no. 5: 618–638. 10.1002/cne.25450. [DOI] [PMC free article] [PubMed] [Google Scholar]
- Fabian‐Fine, R. , Meinertzhagen I. A., and Seyfarth E. A.. 2000. “Organization of Efferent Peripheral Synapses at Mechanosensory Neurons in Spiders.” Journal of Comparative Neurology 420, no. 2: 195–210. . [DOI] [PubMed] [Google Scholar]
- Fabian‐Fine, R. , Meisner S., Torkkeli P. H., and Meinertzhagen I. A.. 2015. “Co‐Localization of Gamma‐Aminobutyric Acid and Glutamate in Neurons of the Spider Central Nervous System.” Cell and Tissue Research 362, no. 3: 461–479. 10.1007/s00441-015-2241-5. [DOI] [PubMed] [Google Scholar]
- Fernando, A. O. 2018. Cellular Mechanisms in Alzheimer's Disease. Sharjah: Bentham Science Publishers Ltd. [Google Scholar]
- Goodson, H. V. , and Jonasson E. M.. 2018. “Microtubules and Microtubule‐Associated Proteins.” Cold Spring Harbor Perspectives in Biology 10, no. 6: a022608. [DOI] [PMC free article] [PubMed] [Google Scholar]
- Gray, D. A. , and Woulfe J.. 2005. “Lipofuscin and Aging: A Matter of Toxic Waste.” Science of Aging Knowledge Environment 2005, no. 5: re1. [DOI] [PubMed] [Google Scholar]
- Gudimchuk, N. B. , and McIntosh J. R.. 2021. “Regulation of Microtubule Dynamics, Mechanics and Function Through the Growing Tip.” Nature Reviews Molecular Cell Biology 22, no. 12: 777–795. [DOI] [PubMed] [Google Scholar]
- Hartline, D. K. , and Colman D. R.. 2007. “Rapid Conduction and the Evolution of Giant Axons and Myelinated Fibers.” Current Biology 17, no. 1: R29–R35. 10.1016/j.cub.2006.11.042. [DOI] [PubMed] [Google Scholar]
- Hartman, J. J. , and Vale R. D.. 1999. “Microtubule Disassembly by ATP‐Dependent Oligomerization of the AAA Enzyme Katanin.” Science 286, no. 5440: 782–785. [DOI] [PubMed] [Google Scholar]
- Hladky, S. B. , and Barrand M. A.. 2022. “The Glymphatic Hypothesis: The Theory and the Evidence.” Fluids and Barriers of the CNS 19, no. 1: 1–33. [DOI] [PMC free article] [PubMed] [Google Scholar]
- Iliff, J. J. , and Nedergaard M.. 2013. “Is There a Cerebral Lymphatic System?.” Stroke; A Journal of Cerebral Circulation 44, no. 6 S1: S93–S95. 10.1161/STROKEAHA.112.678698. [DOI] [PMC free article] [PubMed] [Google Scholar]
- Iliff, J. J. , Wang M., Liao Y., et al. 2012. “A Paravascular Pathway Facilitates CSF Flow Through the Brain Parenchyma and the Clearance of Interstitial Solutes, Including Amyloid β.” Science Translational Medicine 4, no. 147: 147ra111. 10.1126/scitranslmed.3003748. [DOI] [PMC free article] [PubMed] [Google Scholar]
- Kanfer, G. , Peterka M., Arzhanik V. K., et al. 2017. “CENP‐F Couples Cargo to Growing and Shortening Microtubule Ends.” Molecular Biology of the Cell 28, no. 18: 2400–2409. [DOI] [PMC free article] [PubMed] [Google Scholar]
- Kiani, L. 2023. “Disease‐Specific Modifications of Tau Protein.” Nature Reviews Neurology 19, no. 8: 459–459. 10.1038/s41582-023-00851-w. [DOI] [PubMed] [Google Scholar]
- Kirschner, M. , and Mitchison T.. 1986. “Beyond Self‐Assembly: From Microtubules to Morphogenesis.” Cell 45, no. 3: 329–342. [DOI] [PubMed] [Google Scholar]
- Kobro‐Flatmoen, A. , Hormann T. M., and Gouras G.. 2023. “Intracellular Amyloid‐β in the Normal Rat Brain and Human Subjects and Its Relevance for Alzheimer's Disease.” Journal of Alzheimer's Disease 95: 719–733. [DOI] [PMC free article] [PubMed] [Google Scholar]
- Kuo, Y.‐W. , and Howard J.. 2021. “Cutting, Amplifying, and Aligning Microtubules With Severing Enzymes.” Trends in Cell Biology 31, no. 1: 50–61. [DOI] [PMC free article] [PubMed] [Google Scholar]
- Legland, D. , Arganda‐Carreras I., and Andrey P.. 2016. “MorphoLibJ: Integrated Library and Plugins for Mathematical Morphology With ImageJ.” Bioinformatics (Oxford, England) 32, no. 22: 3532–3534. 10.1093/bioinformatics/btw413. [DOI] [PubMed] [Google Scholar]
- Ligon, L. A. , Karki S., Tokito M., and Holzbaur E. L.. 2001. “Dynein Binds to β‐Catenin and May Tether Microtubules at Adherens Junctions.” Nature Cell Biology 3, no. 10: 913–917. [DOI] [PubMed] [Google Scholar]
- Lomakin, A. J. , Kraikivski P., Semenova I., et al. 2011. “Stimulation of the CLIP‐170–Dependent Capture of Membrane Organelles by Microtubules Through Fine Tuning of Microtubule Assembly Dynamics.” Molecular Biology of the Cell 22, no. 21: 4029–4037. [DOI] [PMC free article] [PubMed] [Google Scholar]
- Mancuso, R. , Sicurella M., Agostini S., Marconi P., and Clerici M.. 2019. “Herpes Simplex Virus Type 1 and Alzheimer's Disease: Link and Potential Impact on Treatment.” Expert Review of Anti‐infective Therapy 17, no. 9: 715–731. 10.1080/14787210.2019.1656064. [DOI] [PubMed] [Google Scholar]
- Mestre, H. , Hablitz L. M., Xavier A. L. R., et al. 2018. “Aquaporin‐4‐Dependent Glymphatic Solute Transport in the Rodent Brain.” Elife 7: e40070. 10.7554/eLife.40070. [DOI] [PMC free article] [PubMed] [Google Scholar]
- Möbius, W. , Cooper B., Kaufmann W. A., et al. 2010. “Electron Microscopy of the Mouse Central Nervous System.” In Methods in Cell Biology, 475–512. Amsterdam, the Netherlands: Elsevier. [DOI] [PubMed] [Google Scholar]
- Möbius, W. , Nave K.‐A., and Werner H. B.. 2016. “Electron Microscopy of Myelin: Structure Preservation by High‐Pressure Freezing.” Brain Research 1641, no. pt. A: 92–100. 10.1016/j.brainres.2016.02.027. [DOI] [PubMed] [Google Scholar]
- Nahirney, P. C. , and Tremblay M.‐E.. 2021. “Brain Ultrastructure: Putting the Pieces Together.” Frontiers in Cell and Developmental Biology 9: 629503. [DOI] [PMC free article] [PubMed] [Google Scholar]
- Nedergaard, M. 2013. “Neuroscience. Garbage Truck of the Brain.” Science 340, no. 6140: 1529–1530. 10.1126/science.1240514. [DOI] [PMC free article] [PubMed] [Google Scholar]
- Nedergaard, M. , and Goldman S. A.. 2016. “Brain Drain.” Scientific American 314, no. 3: 44–49. [DOI] [PMC free article] [PubMed] [Google Scholar]
- Pasquettaz, R. , Kolotuev I., Rohrbach A., Gouelle C., Pellerin L., and Langlet F.. 2021. “Peculiar Protrusions Along Tanycyte Processes Face Diverse Neural and Nonneural Cell Types in the Hypothalamic Parenchyma.” Journal of Comparative Neurology 529, no. 3: 553–575. 10.1002/cne.24965. [DOI] [PMC free article] [PubMed] [Google Scholar]
- Perry, G. , and Press I. O. S. 2018. Alzheimer's Disease: New Beginnings. Amsterdam, the Netherlands: IOS Press. [Google Scholar]
- Perry, G. , and Press I. O. S.. 2013. Alzheimer's Disease: Advances for a New Century. Amsterdam, the Netherlands: IOS Press. [Google Scholar]
- Philippe, D. 2013. Alzheimer's Disease: Insights Into Low Molecular Weight and Cytotoxic Aggregates From In Vitro and Computer Experiments—Molecular Basis of Amyloid‐Beta Protein Aggregation and Fibril Formation. Singapore: Imperial College Press. [Google Scholar]
- Preston, G. M. , Carroll T. P., Guggino W. B., and Agre P.. 1992. “Appearance of Water Channels in Xenopus Oocytes Expressing Red Cell CHIP28 Protein.” Science 256, no. 5055: 385–387. [DOI] [PubMed] [Google Scholar]
- Prevot, V. , Dehouck B., Sharif A., Ciofi P., Giacobini P., and Clasadonte J.. 2018. “The Versatile Tanycyte: A Hypothalamic Integrator of Reproduction and Energy Metabolism.” Endocrine Reviews 39, no. 3: 333–368. 10.1210/er.2017-00235. [DOI] [PubMed] [Google Scholar]
- Reid, C. A. , Fabian‐Fine R., and Fine A.. 2001. “Postsynaptic Calcium Transients Evoked by Activation of Individual Hippocampal Mossy Fiber Synapses.” Journal of Neuroscience 21, no. 7: 2206–2214. [DOI] [PMC free article] [PubMed] [Google Scholar]
- Roots, B. I. 1984. “Evolutional Aspects of the Structure and Function of the Nodes of Ranvier.” In The Node of Ranvier, 1–29. New York: Academic Press. 10.1016/B978-0-12-775230-3.50006-6. [DOI] [Google Scholar]
- Ruiz, A. , Fabian‐Fine R., Scott R., Walker M. C., Rusakov D. A., and Kullmann D. M.. 2003. “GABAA Receptors at Hippocampal Mossy Fibers.” Neuron 39, no. 6: 961–973. 10.1016/s0896-6273(03)00559-2. [DOI] [PMC free article] [PubMed] [Google Scholar]
- Ruiz, A. , Walker M. C., Fabian‐Fine R., and Kullmann D. M.. 2004. “Endogenous Zinc Inhibits GABA(A) Receptors in a Hippocampal Pathway.” Journal of Neurophysiology 91, no. 2: 1091–1096. 10.1152/jn.00755.2003. [DOI] [PubMed] [Google Scholar]
- Sait, A. , Angeli C., Doig A. J., and Day P. J. R.. 2021. “Viral Involvement in Alzheimer's Disease.” ACS Chemical Neuroscience 12, no. 7: 1049–1060. 10.1021/acschemneuro.0c00719. [DOI] [PMC free article] [PubMed] [Google Scholar]
- Schildge, S. , Bohrer C., Beck K., and Schachtrup C.. 2013. “Isolation and Culture of Mouse Cortical Astrocytes.” Journal of Visualized Experiments: JoVE 71: 50079. 10.3791/50079. [DOI] [PMC free article] [PubMed] [Google Scholar]
- Schindelin, J. , Arganda‐Carreras I., Frise E., et al. 2012. “Fiji: An Open‐Source Platform for Biological‐Image Analysis.” Nature Methods 9, no. 7: 676–682. 10.1038/nmeth.2019. [DOI] [PMC free article] [PubMed] [Google Scholar]
- Seeker, L. A. , and Williams A.. 2022. “Oligodendroglia Heterogeneity in the Human Central Nervous System.” Acta Neuropathologica 143, no. 2: 143–157. [DOI] [PMC free article] [PubMed] [Google Scholar]
- Seifert, G. , and Steinhäuser C.. 2018. “Heterogeneity and Function of Hippocampal Macroglia.” Cell and Tissue Research 373: 653–670. [DOI] [PubMed] [Google Scholar]
- Sigurdson, C. J. , Bartz J. C., and Glatzel M.. 2019. “Cellular and Molecular Mechanisms of Prion Disease.” Annual Review of Pathology 14: 497–516. 10.1146/annurev-pathmechdis-012418-013109. [DOI] [PMC free article] [PubMed] [Google Scholar]
- Simons, M. , and Nave K.‐A.. 2015. “Oligodendrocytes: Myelination and Axonal Support.” Cold Spring Harbor Perspectives in Biology 8, no. 1: a020479. 10.1101/cshperspect.a020479. [DOI] [PMC free article] [PubMed] [Google Scholar]
- Smith, A. J. , Yao X., Dix J. A., Jin B.‐J., and Verkman A. S.. 2017. “Test of the ‘Glymphatic’ Hypothesis Demonstrates Diffusive and Aquaporin‐4‐Independent Solute Transport in Rodent Brain Parenchyma.” Elife 6: e27679. 10.7554/eLife.27679. [DOI] [PMC free article] [PubMed] [Google Scholar]
- Solnica‐Krezel, L. , and Driever W.. 1994. “Microtubule Arrays of the Zebrafish Yolk Cell: Organization and Function During Epiboly.” Development (Cambridge, England) 120, no. 9: 2443–2455. [DOI] [PubMed] [Google Scholar]
- Stadelmann, C. , Timmler S., Barrantes‐Freer A., and Simons M.. 2019. “Myelin in the Central Nervous System: Structure, Function, and Pathology.” Physiological Reviews 99, no. 3: 1381–1431. [DOI] [PubMed] [Google Scholar]
- Sweeney, H. L. , and Holzbaur E. L.. 2018. “Motor Proteins.” Cold Spring Harbor Perspectives in Biology 10, no. 5: a021931. [DOI] [PMC free article] [PubMed] [Google Scholar]
- Verkman, A. , and Mitra A. K.. 2000. “Structure and Function of Aquaporin Water Channels.” American Journal of Physiology‐Renal Physiology 278, no. 1: F13–F28. 10.1152/ajprenal.2000.278.1.F13. [DOI] [PubMed] [Google Scholar]
- Walz, W. 2000. “Controversy Surrounding the Existence of Discrete Functional Classes of Astrocytes in Adult Gray Matter.” Glia 31, no. 2: 95–103. [DOI] [PubMed] [Google Scholar]
- Wang, S. , Solenov E. I., and Yang B.. 2023. “Aquaporin Inhibitors.” In Aquaporins, edited by Yang B., 317–330. Singapore: Springer. [Google Scholar]
Associated Data
This section collects any data citations, data availability statements, or supplementary materials included in this article.
Supplementary Materials
Figure S1 Glial‐canals in leg ganglion neurons originating from adult female spiders.
Figure S2 Neurodegenerative progression in spider leg ganglia.
Data Availability Statement
The data that support the findings of this study are available from the corresponding author upon reasonable request.