Abstract
Acoustics is most effective in undersea detection, localization, and communication. Establishment of a global climatological dataset of undersea acoustic parameters becomes urgent. In building such a dataset, first we use the Thermodynamic Equation of Seawater-2010 (TEOS-10) to calculate the sound speed (SS) from the gridded temperature and salinity fields of the NOAA/NCEI World Ocean Atlas 2023. Second, we determine the depth of overall minimum from SS profile as the deep sound channel (DSC) axis depth, the depth of overall maximum between the surface and DSC axis as the sonic layer depth (SLD), the depth of the local minimum between SLD and DSC axis as the second sound channel (SSC) depth, and the depth with the SS equalling the maximum SS as the critical depth. Third, we obtain the SS at the surface, SLD, DSC axis, and SSC axis. Fourth, we determine the other acoustic parameters such as In-layer gradient, below layer gradient, DSC strength, SSC strength, depth excess, and surface duct cut-off frequency. The dataset is publicly available.
Subject terms: Ocean sciences, Physical oceanography
Background & Summary
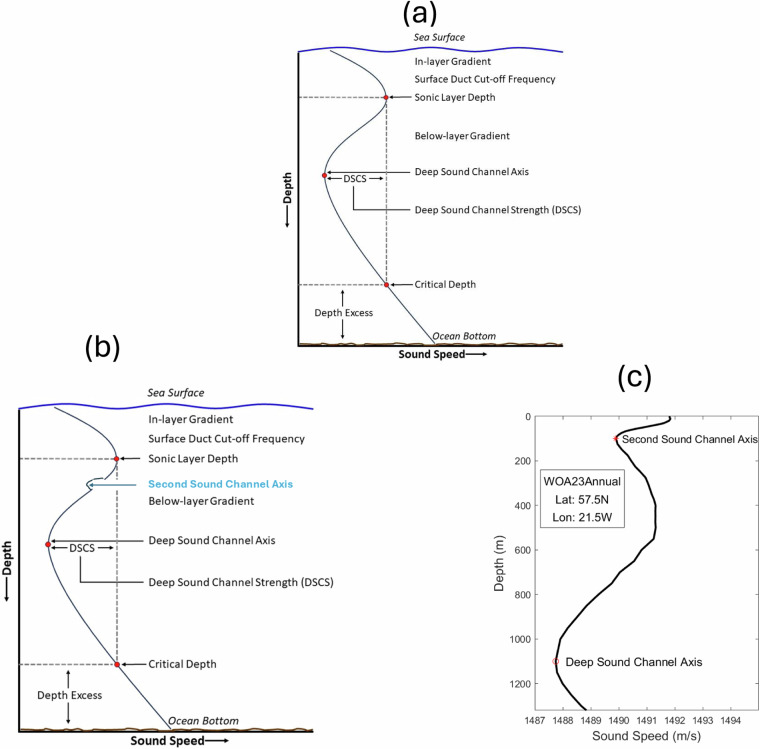
Undersea acoustic parameters such as deep sound channel (DSC) axis depth, sonic layer depth (SLD), second (local) sound channel axis depth, critical depth, depth excess are fully determined from a typical sound speed profile (Fig. 1a). They are crucial to affect acoustic transmission and in turn impact acoustic detection, localization, and communication1. Sound speed depends on temperature, salinity, and depth. With given temperature and salinity profiles, the sound speed changes with depth. Let c(z) be the sound speed profile with z ≥ 0 (downward increasing), representing the vertical with z = 0 for the ocean surface and z = H for the bottom topography. The depth of overall minimum of c(z),
| 1 |
is defined as the DSC axis depth (Ddsc). The depth of overall maximum of c(z) between z = 0 and z = Ddsc,
| 2 |
is defined as the sonic layer depth (Dsl). The layer between z = 0 and z = Dsl is called the sonic layer (SL). If local minimum exists in c(z) between Dsl and Ddsc (Fig. 1b,c),
| 3 |
which is obtained by,
| 4 |
Fig. 1.
Illustration of a sound speed profile and definition of Ddsc, Dsl, Dcrit, Dexcess, in-layer gradient, below layer gradient, and DSC strength: (a) without second sound channel (typical), (b) with second sound channel (occasional), and (c) located at (21.5°W, 57.5° N) from the WOA23 annual data. These depths are defined in the Fleet Oceanographic and Acoustic Reference Manual by the Naval Oceanographic Office (2020). If a local minimum of the sound speed exists (not always exists) between Ddsc and Dsl, the depth of the local minimum is defined as the second sound channel axis depth (Dssc).
The depth of the local minimum (Dssc) is the second (or local) sound channel axis depth. The second sound channel occurs occasionally; however, it enhances the acoustic transmission. Below z = Ddsc, the depth with the sound speed equals cmax is called the critical depth (Dcrit),
| 5 |
The difference between the bottom topography and the critical depth,
| 6 |
is called the depth excess (Dexcess).
With these depths and corresponding sound speeds at the depths, other acoustic parameters such as the deep sound channel strength, in layer gradient, below layer gradient, and surface duct cutoff frequency can be determined.
There is no publicly available climatological dataset for these acoustic parameters despite they are important for undersea acoustic detection, localization, and communication and no matter the climatological sound speed data can be calculated from the climatological (T, S) datasets. To fill the gap, we compute the climatological annual and seasonal mean world ocean sound speed using the NOAA/National Centers for Environmental Information (NCEI) ‘s World Ocean Atlas (WOA) 2023 (T, S) data2–4 and then obtain the world ocean climatological annual and seasonal mean 13 undersea acoustic parameters dataset with 5°, 1°, and 0.25° horizontal resolutions which has been published at the NOAA/NCEI website for public use (https://www.ncei.noaa.gov/archive/accession/0290599).
Methods
Use of existing dataset
We produce this dataset based on the existing data. The NOAA/NCEI WOA 2023 (WOA23) annual and seasonal mean temperature and salinity profiles2–4 at regular 102 vertical levels (Table 1) are used to calculate the sound speed c(z) at the WOA23 horizontal grid points with the Thermodynamic Equation of Saewater-2010 (TEOS-10) (https://www.teos-10.org/). Here, the MATLAB code gsw_sound_speed.m is used.
Table 1.
Standard vertical depths of WOA23 data.
| Standard Level | Standard Depth (m) | Standard Level | Standard Depth (m) | Standard Level | Standard Depth (m) | Standard Level | Standard Depth (m) |
|---|---|---|---|---|---|---|---|
| 1 | 0 | 27 | 250 | 53 | 1300 | 79 | 3200 |
| 2 | 5 | 28 | 275 | 54 | 1350 | 80 | 3300 |
| 3 | 10 | 29 | 300 | 55 | 1400 | 81 | 3400 |
| 4 | 15 | 30 | 325 | 56 | 1450 | 82 | 3500 |
| 5 | 20 | 31 | 350 | 57 | 1500 | 83 | 3600 |
| 6 | 25 | 32 | 375 | 58 | 1550 | 84 | 3700 |
| 7 | 30 | 33 | 400 | 59 | 1600 | 85 | 3800 |
| 8 | 35 | 34 | 425 | 60 | 1650 | 86 | 3900 |
| 9 | 40 | 35 | 450 | 61 | 1700 | 87 | 4000 |
| 10 | 45 | 36 | 475 | 62 | 1750 | 88 | 4100 |
| 11 | 50 | 37 | 500 | 63 | 1800 | 89 | 4200 |
| 12 | 55 | 38 | 550 | 64 | 1850 | 90 | 4300 |
| 13 | 60 | 39 | 600 | 65 | 1900 | 91 | 4400 |
| 14 | 65 | 40 | 650 | 66 | 1950 | 92 | 4500 |
| 15 | 70 | 41 | 700 | 67 | 2000 | 93 | 4600 |
| 16 | 75 | 42 | 750 | 68 | 2100 | 94 | 4700 |
| 17 | 80 | 43 | 800 | 69 | 2200 | 95 | 4800 |
| 18 | 85 | 44 | 850 | 70 | 2300 | 96 | 4900 |
| 19 | 90 | 45 | 900 | 71 | 2400 | 97 | 5000 |
| 20 | 95 | 46 | 950 | 72 | 2500 | 98 | 5100 |
| 21 | 100 | 47 | 1000 | 73 | 2600 | 99 | 5200 |
| 22 | 125 | 48 | 1050 | 74 | 2700 | 100 | 5300 |
| 23 | 150 | 49 | 1100 | 75 | 2800 | 101 | 5400 |
| 24 | 175 | 50 | 1150 | 76 | 2900 | 102 | 5500 |
| 25 | 200 | 51 | 1200 | 77 | 3000 | ||
| 26 | 225 | 52 | 1250 | 78 | 3100 |
Global climatological (annual mean and seasonal mean) data of undersea acoustic parameters can be established through two approaches: (1) analyzing climatological sound speed profiles, and (2) analyzing observational sound speed profiles to get synoptic under water acoustic parameters and then using the optimal interpolation5, Kalmen filter6, or optimal spectral decomposition7 to produce gridded climatological underwater acoustic parameters. At present, we cannot estimate how big the difference is between using these two approaches. We can estimate only after taking the two approaches. In this study, we take the first approach to derive climatological underwater acoustic parameter data from the climatological sound speed profiles calculated from the NOAA/NCEI World Ocean Atlas 2023 (WOA23)2–4 annual and seasonal mean temperature and salinity (S) profiles with regular 102 vertical levels (Table 1).
Determination of five depths (Ddsc, Dsl, Dssc, Dcrit, Dexcess)
Let a sound speed profile at the WOA23 horizontal grid point starting from z1 at the surface to any depth zk (shown in Table 1) be represented by c(zk). Here, k = 1, 2, …, K, with zK the bottom of the profile. The depth of overall minimum of c(zk) is obtained from Eq. (1) to identify the DSC axis depth (Ddsc). The DSC is often referred to as Sound Fixing and Ranging (SOFAR) channel, where the sound waves are effectively confined and trace a path that oscillates across the DSC axis. The DSC allows sound to carry great distance8.
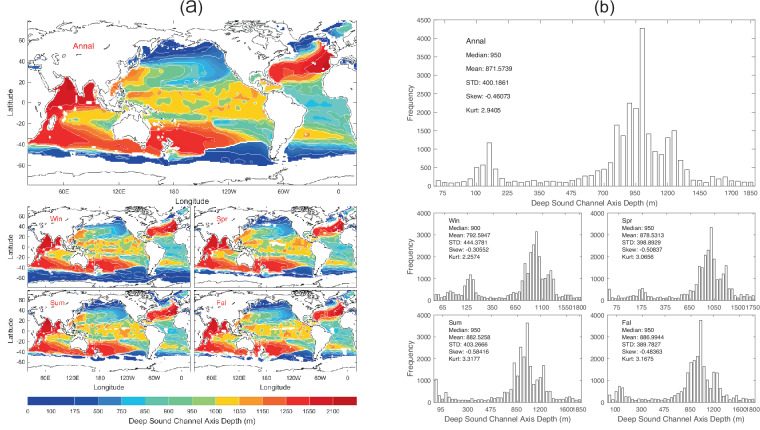
The climatological sound speed profiles calculated from the WOA23 temperature and salinity profiles are not exactly follow the conceptual profile described in Fig. 1a. Therefore, the dataset of 13 undersea acoustic parameters does not appear to be global. It lacks coverage for the Arctic Ocean, the southern part of the Southern Ocean, and coastal seas. This is because that these sound speed profiles do not follow the profile depicted in Fig. 1a. After the 13 undersea acoustic parameters were identified, the statistical characteristics such as mean, standard deviation, skewness, and kurtosis were calculated using the MATLAB functions for each acoustic parameter over the global oceans. Data of Ddsc with 1° horizontal resolution are presented with annual and seasonal mean maps (Fig. 2a) and histograms (Fig. 2b). Ddsc has evident spatial variability but minor seasonal variation (Fig. 2a) with median (950 m), mean (871.6 m), and standard deviation (400.2 m) of the annual mean data (Fig. 2b).
Fig. 2.
(a) Maps and (b) histograms of global climatological annual and seasonal mean data with 1° resolution of Ddsc (unit: m).
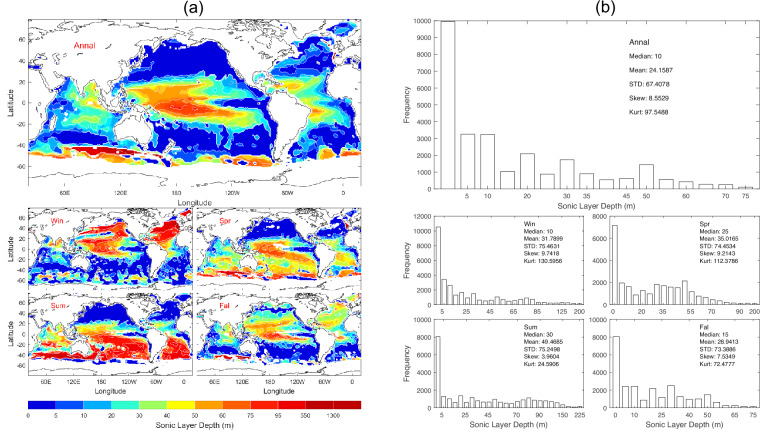
The depth of overall maximum of c(zk) between z1 and Ddsc is identified as the SLD (Dsl) [see Eq. (2)], which represents the bottom limit of the surface duct9, a layer where sound waves are refracted back towards the surface, facilitating longer horizontal travel. The SLD also marks the upper boundary of the DSC. Understanding the SLD is crucial for effective sonar operation, undersea communication, and acoustic propagation. Data of Dsl with 1° horizontal resolution are presented with annual and seasonal mean maps (Fig. 3a) and histograms (Fig. 3b). Dsl has evident spatial variability and seasonal variation (Fig. 3a) with median (10 m), mean (24.2 m), and standard deviation (67.4 m) of the annual mean data (Fig. 3b).
Fig. 3.
(a) Maps and (b) histograms of global climatological annual and seasonal mean data with 1° resolution of Dsl (unit: m).
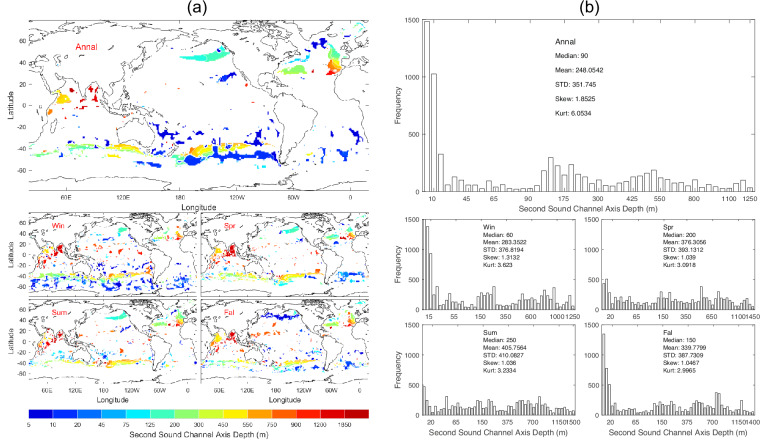
The second sound channel (SSC) axis depth (Dssc) is identified by the existence of local minimum in c(zk) between Dsl and Ddsc [see Eq. (4)]. Data of Dssc with 1° horizontal resolution are presented with annual and seasonal mean maps (Fig. 4a) and histograms (Fig. 4b). The SSC exists sporadically (rare occurrence) and varies seasonally (Fig. 4a) with median (125 m), mean (216.8 m), and standard deviation (231.2 m) of the annual mean data (Fig. 4b).
Fig. 4.
(a) Maps and (b) histograms of global climatological annual and seasonal mean data with 1° resolution of Dssc (unit: m).
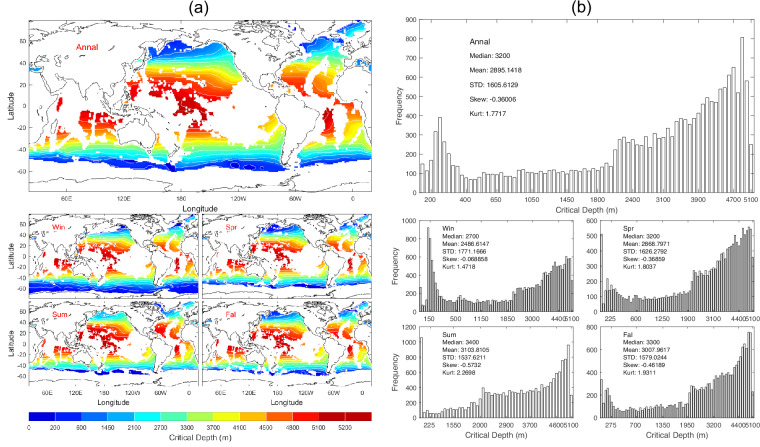
The critical depth (Dcrit) is identified as the specific depth beneath the DSC axis where the sound speed equals that at Ds1 [see Eqs. 1, 5]. This depth is pivotal as it signifies the lower boundary of the DSC. As one moves deeper past the DSC axis, the sound speed begins to increase and eventually to match the sound speed at the SLD. It marks a significant transition in the undersea acoustic environment, indicating a change in sound propagation beyond Dcrit. Data of Dcrit with 1° horizontal resolution are presented with annual and seasonal mean maps (Fig. 5a) and histograms (Fig. 5b). Dcrit has evident spatial variability but minor seasonal variation (Fig. 5a) with median (3200 m), mean (2895.1 m), and standard deviation (1605.6 m) of the annual mean data (Fig. 5b).
Fig. 5.
(a) Maps and (b) histograms of global climatological annual and seasonal mean data with 1° resolution of Dcrit (unit: m).
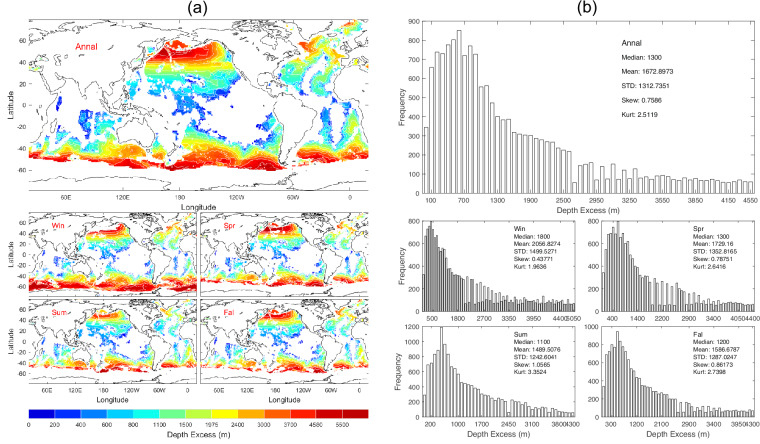
Correspondingly, the depth excess (Dexcess) is obtained using Eq. (6). Data of Dexcess with 1° horizontal resolution are presented with annual and seasonal mean maps (Fig. 6a) and histograms (Fig. 6b). Dexcess has evident spatial variability but minor seasonal variation (Fig. 6a) with median (1300 m), mean (1672.9 m), and standard deviation (1312.7 m) of the annual mean data (Fig. 6b).
Fig. 6.
(a) Maps and (b) histograms of global climatological annual and seasonal mean data with 1° resolution of Dexcess (unit: m).
Sound speeds at surface and (Ds, Ddsc, Dssc,)
The sound speed at the ocean surface is represented by,
| 7 |
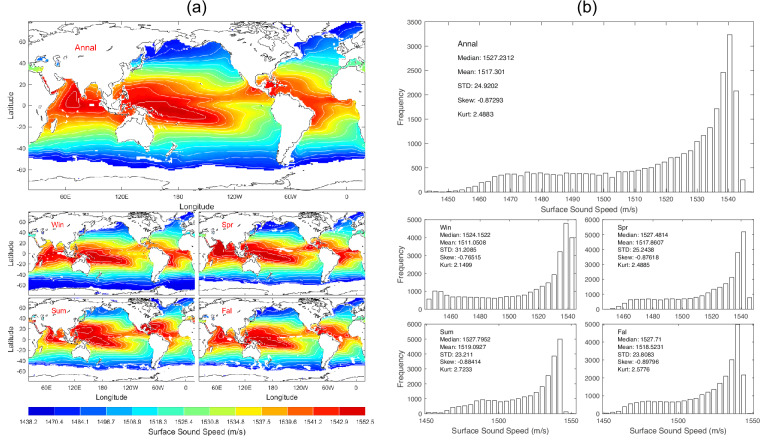
Data of c0 with 1° horizontal resolution are presented with annual and seasonal mean maps (Fig. 7a) and histograms (Fig. 7b). c0 has evident spatial variability but minor seasonal variation (Fig. 7a) with median (1527.2 m/s), mean (1517.3 m/s), and standard deviation (24.92 m/s) of the annual mean data (Fig. 7b).
Fig. 7.
(a) Maps and (b) histograms of global climatological annual and seasonal mean data with 1° resolution of c0 (unit: m s−1).
The sound speed at the SLD is given by,
| 8 |
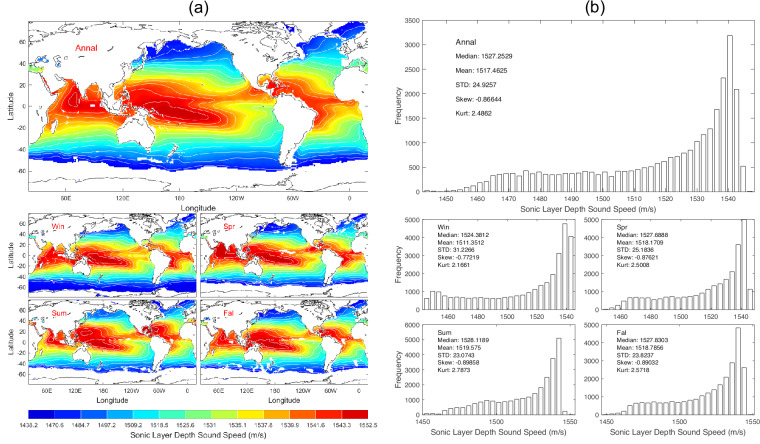
Data of csld with 1° horizontal resolution are presented with annual and seasonal mean maps (Fig. 8a) and histograms (Fig. 8b). csld has evident spatial variability but minor seasonal variation (Fig. 8a) with median (1527.3 m/s), mean (1517.5 m/s), and standard deviation (24.93 m/s) of the annual mean data (Fig. 8b).
Fig. 8.
(a) Maps and (b) histograms of global climatological annual and seasonal mean data with 1° resolution of csld (unit: m s−1).
The sound speed at the DSC axis is defined by,
| 9 |
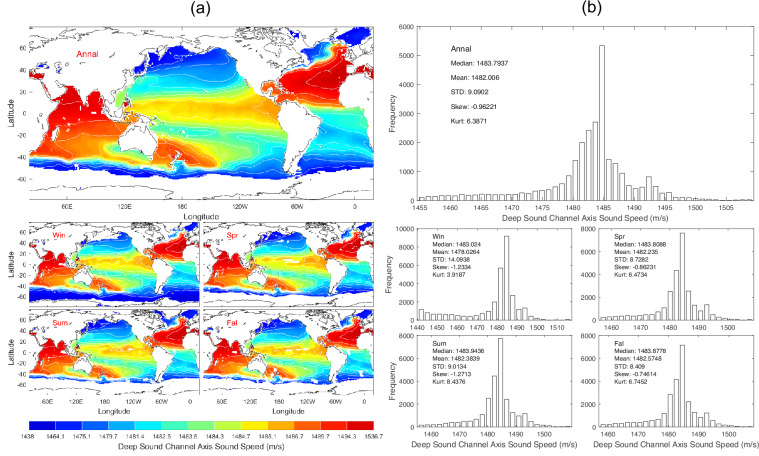
Data of cdsc with 1° horizontal resolution are presented with annual and seasonal mean maps (Fig. 9a) and histograms (Fig. 9b). cdsc has evident spatial variability but minor seasonal variation (Fig. 9a) with median (1483.8 m/s), mean (1482.0 m/s), and standard deviation (9.09 m/s) of the annual mean data (Fig. 9b).
Fig. 9.
(a) Maps and (b) histograms of global climatological annual and seasonal mean data with 1° resolution of cdsc (unit: m s−1).
DSC and SSC strengths
The deep sound channel strength (Sdsc) is defined by,
| 10 |
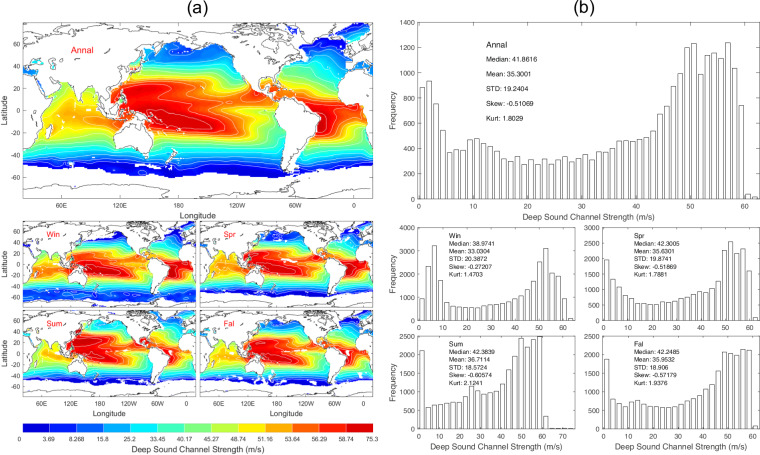
Data of Sdsc with 1° horizontal resolution are presented with annual and seasonal mean maps (Fig. 10a) and histograms (Fig. 10b). Sdsc has evident spatial variability but minor seasonal variation (Fig. 10a) with median (41.86 m/s), mean (35.30 m/s), and standard deviation (19.24 m/s) of the annual mean data (Fig. 10b).
Fig. 10.
(a) Maps and (b) histograms of global climatological annual and seasonal mean data with 1° resolution of Sdsc (unit: m s−1).
The SSC strength (Sssc) is defined by,
| 11 |
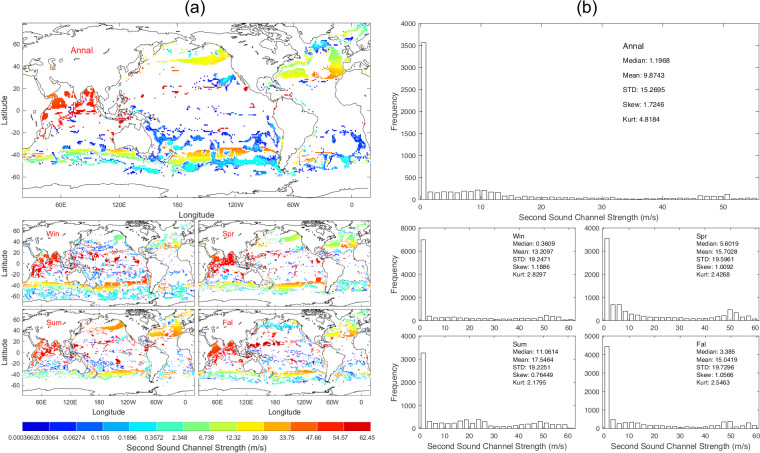
Data of Sssc with 1° horizontal resolution are presented with annual and seasonal mean maps (Fig. 11a) and histograms (Fig. 11b). The Sssc exists sporadically and varies seasonally (Fig. 11a) with median (6.51 m/s), mean (9.70 m/s), and standard deviation (11.75 m/s) of the annual mean data (Fig. 11b).
Fig. 11.
(a) Maps and (b) histograms of global climatological annual and seasonal mean data with 1° resolution of Sssc (unit: m s−1).
In-layer and below layer gradients
The in-layer gradient is defined by,
| 12 |
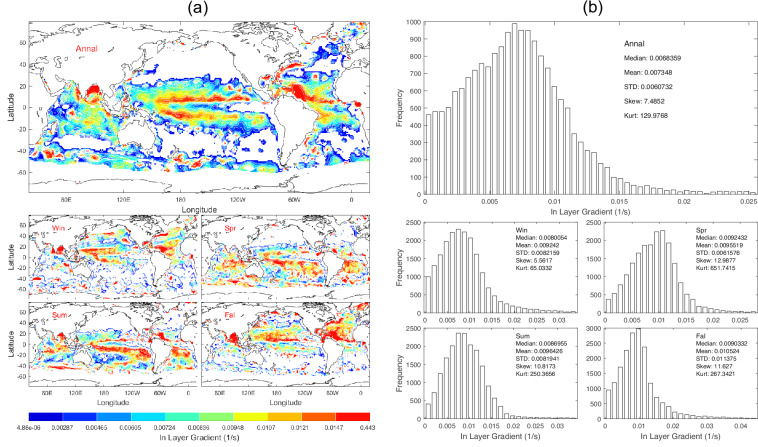
Data of Gin with 1° horizontal resolution are presented with annual and seasonal mean maps (Fig. 12a) and histograms (Fig. 12b). Gin has evident spatial variability and seasonal variation (Fig. 12a) with median (6.836 × 10⁻³ s−1), mean (7.348 × 10⁻³ s−1), and standard deviation (6.073 × 10⁻³ s−1) of the annual mean data (Fig. 12b).
Fig. 12.
(a) Maps and (b) histograms of global climatological annual and seasonal mean data with 1° resolution of Gin (unit: s−1).
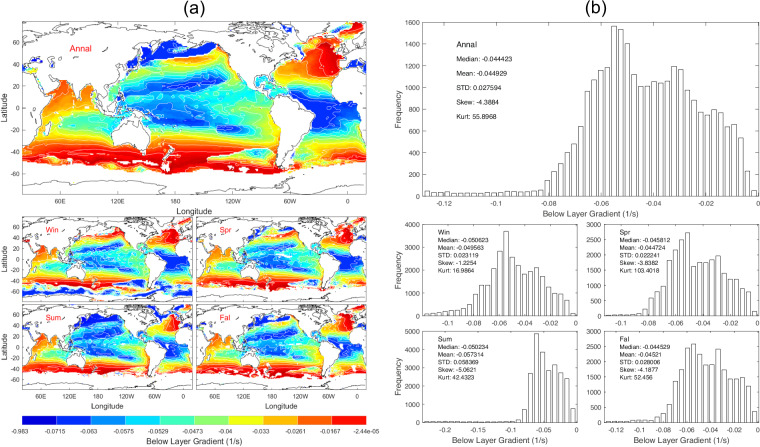
The below layer gradient (Gbelow) is the mean vertical gradient between Dsl and Ddsc. Data of Gbelow with 1° horizontal resolution are presented with annual and seasonal mean maps (Fig. 13a) and histograms (Fig. 13b). Gbelow has evident spatial variability and seasonal variation (Fig. 13a) with median (−44.42 × 10⁻³ s−1), mean (−44.93 × 10⁻³ s−1), and standard deviation (27.59 × 10⁻³ s−1) of the annual mean data (Fig. 13b).
Fig. 13.
(a) Maps and (b) histograms of global climatological annual and seasonal mean data with 1° resolution of Gbelow (unit: s−1).
Surface duct cutoff frequency
At very low frequencies, sound ceases to be trapped in the mixed layer or, in any sound channels. This occurs when the frequency for the first mode of normal mode theory, when, in a sense, the wavelength has become too large to ‘fit’ in the duct. This maximum wavelength (λmax) for duct transmission may be found from the theory of radio propagation in ground-based radio ducts. Using values of sound speed and in-layer gradient for sound transmission in the isothermal layer, the maximum trapped wavelength λmax is represented by9,
| 13 |
where D is the isothermal layer depth (in meter). For D = 30.48 m (100 ft), the maximum trapped wavelength λmax is 1.43 m (4.7 ft). The surface duct cutoff frequency (fcutoff) is represented by,
| 14 |
Substitution of Eqs. (13, 14) leads to
| 15 |
The isothermal layer depth (D) was identified from WOA23 temperature data using the exponential leap-forward gradient method described in the reference10 and published at the NOAA/NCEI website11,12.
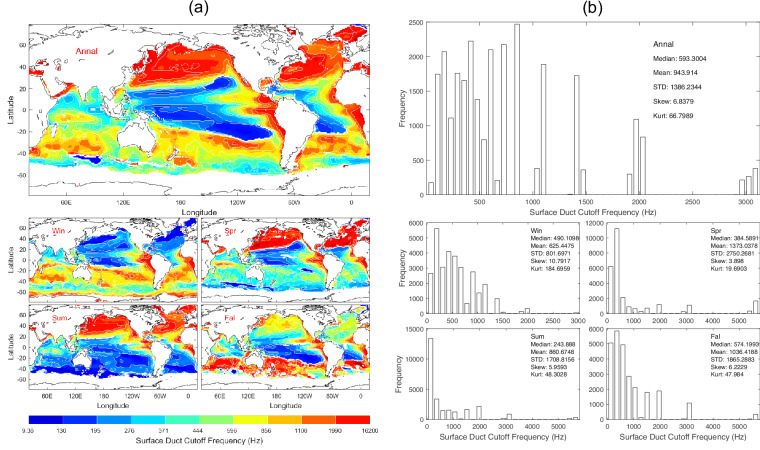
Figure 14 shows the annual and seasonal means of the surface duct cutoff frequency. Data of fcutoff with 1° horizontal resolution are presented with annual and seasonal mean maps (Fig. 14a) and histograms (Fig. 14b). fcutoff has evident spatial variability and seasonal variation (Fig. 14a) with median (593 Hz), mean (944 Hz), and standard deviation (1386 Hz) of the annual mean data (Fig. 14b). Since in Eq.(15) the isothermal layer depth (D) identified from WOA23 temperature data takes discrete WOA23 standard depths12 as shown in Table 1, and the surface sound speed varies from 1,517 m s−1 mildly, fcutoff may take discrete values. This causes gaps in the histograms of fcutoff as shown in Fig. 14b.
Fig. 14.
(a) Maps and (b) histograms of global climatological annual and seasonal mean data with 1° resolution of fcutoff (unit: Hz).
Statistical characteristics
We calculated the median, mean, standard deviation, skewness, and kurtosis of the thirteen parameters for the annual mean (Table 2), winter (Table 3), spring (Table 4), summer (Table 5), and fall (Table 6). These values can also be found in Figs. 2b, 14b.
Table 2.
Median, mean, and standard deviation the global annual mean undersea acoustic parameters.
| Parameter | Median | Mean | Standard Deviation | Skewness | Kurtosis |
|---|---|---|---|---|---|
| Deep Sound Channel Axis Depth (m) | 950.0 | 871.6 | 400.2 | −0.46 | 2.94 |
| Sonic Layer Depth (m) | 10.0 | 24.2 | 67.4 | 8.55 | 97.55 |
| Second Sound Channel Axis Depth (m) | 125.0 | 216.8 | 231.2 | 1.36 | 4.83 |
| Critical Depth (m) | 3200.0 | 2895.1 | 1605.6 | −0.36 | 1.77 |
| Depth Excess (m) | 1300.0 | 1672.9 | 1312.7 | 0.76 | 2.51 |
| Surface Sound Speed (m/s) | 1527.2 | 1517.3 | 24.9 | −0.87 | 2.49 |
| Sonic Layer Depth Sound Speed (m/s) | 1527.3 | 1517.5 | 24.9 | −0.87 | 2.49 |
| Deep Sound Channel Axis Sound Speed (m/s) | 1483.8 | 1482.0 | 9.1 | −0.96 | 6.39 |
| Deep Sound Channel Strength (m/s) | 41.86 | 35.30 | 19.24 | −0.51 | 1.80 |
| Second Sound Channel Strength (m/s) | 6.51 | 9.70 | 11.75 | 1.66 | 5.48 |
| In-Layer Gradient (10−3 1/s) | 6.836 | 7.348 | 6.073 | 7.49 | 129.98 |
| Below Layer Gradient (10−3 1/s) | −44.42 | −44.93 | 27.59 | −4.39 | 55.90 |
| Surface Duct Cutoff Frequency (Hz) | 593 | 944 | 1386 | 6.84 | 66.80 |
Table 3.
Median, mean, and standard deviation the global winter mean undersea acoustic parameters.
| Parameter | Median | Mean | Standard Deviation | Skewness | Kurtosis |
|---|---|---|---|---|---|
| Deep Sound Channel Axis Depth (m) | 900.0 | 792.6 | 444.4 | −0.31 | 2.26 |
| Sonic Layer Depth (m) | 10.0 | 31.8 | 75.5 | 9.74 | 130.6 |
| Second Sound Channel Axis Depth (m) | 45.0 | 172.9 | 233.6 | 1.95 | 7.60 |
| Critical Depth (m) | 2700.0 | 2486.6 | 1771.2 | −0.07 | 1.47 |
| Depth Excess (m) | 1800.0 | 2056.8 | 1499.5 | 0.44 | 1.96 |
| Surface Sound Speed (m/s) | 1524.2 | 1511.1 | 31.21 | −0.77 | 2.15 |
| Sonic Layer Depth Sound Speed (m/s) | 1524.4 | 1511.4 | 31.20 | −0.77 | 2.17 |
| Deep Sound Channel Axis Sound Speed (m/s) | 1483.0 | 1478.0 | 14.10 | −1.23 | 3.92 |
| Deep Sound Channel Strength (m/s) | 38.97 | 33.03 | 20.39 | −0.27 | 1.47 |
| Second Sound Channel Strength (m/s) | 0.56 | 9.43 | 14.00 | 1.56 | 4.36 |
| In-Layer Gradient (10−3 1/s) | 8.005 | 9.242 | 8.216 | 5.56 | 65.03 |
| Below Layer Gradient (10−3 1/s) | −50.62 | −49.56 | 23.12 | −1.23 | 16.99 |
| Surface Duct Cutoff Frequency (Hz) | 490 | 625 | 802 | 10.79 | 184.70 |
Table 4.
Median, mean, and standard deviation the global spring mean undersea acoustic parameters.
| Parameter | Median | Mean | Standard Deviation | Skewness | Kurtosis |
|---|---|---|---|---|---|
| Deep Sound Channel Axis Depth (m) | 950.0 | 878.5 | 398.9 | −0.51 | 3.07 |
| Sonic Layer Depth (m) | 25.0 | 35.0 | 74.5 | 9.21 | 112.4 |
| Second Sound Channel Axis Depth (m) | 95.0 | 182.3 | 249.7 | 2.44 | 9.20 |
| Critical Depth (m) | 3200.0 | 2868.8 | 1626.3 | −0.37 | 1.80 |
| Depth Excess (m) | 1300.0 | 1729.2 | 1352.8 | 0.79 | 2.64 |
| Surface Sound Speed (m/s) | 1527.5 | 1517.9 | 25.2 | −0.88 | 2.49 |
| Sonic Layer Depth Sound Speed (m/s) | 1527.7 | 1518.2 | 25.2 | −0.88 | 2.50 |
| Deep Sound Channel Axis Sound Speed (m/s) | 1483.8 | 1482.2 | 8.73 | −0.86 | 6.47 |
| Deep Sound Channel Strength (m/s) | 42.30 | 35.63 | 19.87 | −0.52 | 1.79 |
| Second Sound Channel Strength (m/s) | 3.50 | 8.92 | 13.39 | 1.94 | 5.88 |
| In-Layer Gradient (10−3 1/s) | 9.243 | 9.552 | 6.158 | 12.99 | 651.74 |
| Below Layer Gradient (10−3 1/s) | −45.81 | −44.72 | 22.24 | −3.84 | 103.40 |
| Surface Duct Cutoff Frequency (Hz) | 385 | 1373 | 2750 | 3.90 | 19.69 |
Table 5.
Median, mean, and standard deviation the global summer mean undersea acoustic parameters.
| Parameter | Median | Mean | Standard Deviation | Skewness | Kurtosis |
|---|---|---|---|---|---|
| Deep Sound Channel Axis Depth (m) | 950.0 | 882.5 | 403.3 | −0.58 | 3.32 |
| Sonic Layer Depth (m) | 30.0 | 49.5 | 75.2 | 3.96 | 24.6 |
| Second Sound Channel Axis Depth (m) | 90.0 | 180.2 | 265.0 | 2.45 | 8.95 |
| Critical Depth (m) | 3400.0 | 3103.8 | 1537.6 | −0.57 | 2.27 |
| Depth Excess (m) | 1100.0 | 1489.5 | 1242.6 | 1.06 | 3.35 |
| Surface Sound Speed (m/s) | 1527.8 | 1519.1 | 23.2 | −0.88 | 2.72 |
| Sonic Layer Depth Sound Speed (m/s) | 1528.1 | 1519.6 | 23.1 | −0.90 | 2.79 |
| Deep Sound Channel Axis Sound Speed (m/s) | 1483.9 | 1482.4 | 9.0 | −1.27 | 8.44 |
| Deep Sound Channel Strength (m/s) | 42.38 | 36.71 | 18.57 | −0.61 | 2.12 |
| Second Sound Channel Strength (m/s) | 1.32 | 11.40 | 14.53 | 1.10 | 3.17 |
| In-Layer Gradient (10−3 1/s) | 8.696 | 9.643 | 8.194 | 10.82 | 250.37 |
| Below Layer Gradient (10−3 1/s) | −50.23 | −57.31 | 58.37 | −5.06 | 42.43 |
| Surface Duct Cutoff Frequency (Hz) | 244 | 861 | 1709 | 5.96 | 48.30 |
Table 6.
Median, mean, and standard deviation the global fall mean undersea acoustic parameters.
| Parameter | Median | Mean | Standard Deviation | Skewness | Kurtosis |
|---|---|---|---|---|---|
| Deep Sound Channel Axis Depth (m) | 950.0 | 887.0 | 389.8 | −0.48 | 3.17 |
| Sonic Layer Depth (m) | 15.0 | 28.9 | 73.4 | 7.53 | 72.48 |
| Second Sound Channel Axis Depth (m) | 100.0 | 230.8 | 265.5 | 1.62 | 6.26 |
| Critical Depth (m) | 3300.0 | 3008.0 | 1579.0 | −0.46 | 1.93 |
| Depth Excess (m) | 1200.0 | 1586.7 | 1287.0 | 0.86 | 2.74 |
| Surface Sound Speed (m/s) | 1527.7 | 1518.5 | 23.8 | −0.90 | 2.58 |
| Sonic Layer Depth Sound Speed (m/s) | 1527.8 | 1518.8 | 23.8 | −0.89 | 2.57 |
| Deep Sound Channel Axis Sound Speed (m/s) | 1483.9 | 1482.6 | 8.4 | −0.75 | 6.75 |
| Deep Sound Channel Strength (m/s) | 42.25 | 35.95 | 18.91 | −0.57 | 1.94 |
| Second Sound Channel Strength (m/s) | 4.33 | 10.31 | 13.62 | 1.59 | 4.66 |
| In-Layer Gradient (10−3 1/s) | 9.033 | 10.524 | 11.375 | 11.63 | 267.34 |
| Below Layer Gradient (10−3 1/s) | −44.53 | −45.21 | 28.01 | −4.19 | 52.46 |
| Surface Duct Cutoff Frequency (Hz) | 574 | 1036 | 1865 | 6.22 | 47.98 |
Data Records
This global dataset for climatological annual and seasonal mean undersea acoustic parameters such as the sonic layer depth (SLD), deep sound channel (DSC) axis depth, second sound channel (SSC) axis depth, sound speed at the surface, sound speed at the SLD, sound speed at the DSC axis, sound speed at the SSC axis, in-layer gradient, below-layer gradient, surface duct cut-off frequency, deep sound channel strength, critical depth of the DSC, depth excess, and second sound channel strength has been established using the NOAA/NCEI WOA23 temperature and salinity data2–4 and derived isothermal layer depth (D) data12 (for surface duct cutoff frequency). This dataset13 is publicly available at the NOAA/NCEI data repository 10.25921/fe7c-5f76 as a NetCDF file, which includes data citation, dataset identifiers, metadata, and ordering instructions.
Technical Validation
The uncertainty in determining the undersea acoustic parameters from a sound speed profile comes not only from the temperature data but also from the depth (pressure). This is because an observational temperature profile data has errors in the depth such as the XBT, MBT, and XCTD temperature profiles. The uncertainty in depth is caused by the not fully accurate drop-rate equation, which converts time since drop to depth in the ocean. After the drop-rate correction, WOA23 produces temperature profile data at 102 standard levels shown in Table 1 with uncertainty only from the temperature and salinity data and not from the depth2,3.
The thirteen undersea acoustic parameters are calculated from the WOA23 temperature and salinity profile data (i.e., sound speed profile data) using the analytical formulae (1)–(15). The uncertainty of the undersea acoustic parameter data is caused by the uncertainty in temperature and salinity data. The uncertainty of the WOA23 temperature is ±0.003 °C2. The effect of temperature on the undersea sound speed is much more than salinity. A random noise with intensity of 0.003 °C is added to each grid point of WOA23 temperature field. The perturbed undersea sound speed field and in turn the 13 perturbed undersea acoustic parameters are calculated. Let the unperturbed and perturbed acoustic parameters be represented by ψ0 and ψ. The root mean square of (ψ- ψ0) divided by the standard deviation of ψ0, (i.e., relative root-mean square error),
| 16 |
is used to represent the uncertainty of the derived undersea acoustic parameter dataset. The random noise (±0.003 °C) has negligible effect on sound speed at the surface (μ = 2.07 × 10⁻⁴), sonic layer depth (μ = 3.81 × 10⁻⁴), deep sound channel axis depth (μ = 7.85 × 10⁻⁴), deep sound channel strength (μ = 4.57 × 10⁻⁴), and small effect on sonic layer depth (μ = 0.042), deep sound channel axis depth (μ = 0.037), second sound channel strength (μ = 0.076).
In addition, the uncertainty in the isothermal depth (D) may also introduce uncertainty in the surface duct cutoff frequency (fcutoff). The global climatological isothermal layer depth (D) data were produced using the exponential leap-forward gradient method10, which was developed on the base of several earlier schemes14–16. The relative error of the isothermal depth (D) using the exponential leap-forward gradient method is given by (see Table 3 in ref. 10)
| 17 |
Use of (15) and (17) leads to the relative error of the global surface duct frequency,
| 18 |
Acknowledgements
The authors thank Dr. Alexandra Grodsky for the outstanding efforts to publish the dataset at the NOAA/NCEI website and DoD Strategic Environmental Research and Development Program (SERDP) for financial support.
Author contributions
P.C.C. developed the method, designed the project, conducted the data quality control, and prepared the Data Descriptor. C.W.F. developed the code and helped prepare the Data Descriptor.
Code availability
We use the MATLAB code gsw_sound_speed.m located at the website https://www.teos-10.org/ to compute sound speed profiles from the WOA23 annual and seasonal mean temperature and salinity profiles; and use the basic MATLAB functions related to Eqs. (1)–(15) to produce global climatological dataset of 13 acoustic parameters13. It is not necessary to present the code.
Competing interests
The authors declare no competing interests.
Footnotes
Publisher’s note Springer Nature remains neutral with regard to jurisdictional claims in published maps and institutional affiliations.
References
- 1.Naval Oceanographic Office. Fleet Oceanographic and Acoustic Reference Manual. Reference Publication PR33 (2020).
- 2.Locarnini, R. A. et al. World Ocean Atlas 2023, Volume 1: Temperature. A. Mishonov Tech. Ed., NOAA Atlas NESDIS 89, 52 pp, 10.25923/54bh-1613 (2024).
- 3.Reagan, J. R. et al. World Ocean Atlas 2023 Volume 2: Salinity. A. Mishonov, Tech. Ed., NOAA Atlas NESDIS 90, 51pp. 10.25923/70qt-9574 (2024).
- 4.NOAA National Centers for Environmental Information. World Ocean Atlas 202310.25923/54bh-1613 and 10.25923/70qt-9574 (2024).
- 5.Bretherton, F. P., Davis, R. E. & Fandry, C. B. A technique for objective analysis and design of oceanographic experiments applied to MODE-73. Deep-Sea Research23, 559–582, 10.1016/0011-7471(76)90001-2 (1976). [Google Scholar]
- 6.Evensen, G. The ensemble Kalman filter: theoretical formulation and practical implementation. Ocean Dynamics53, 343–367 (2003). [Google Scholar]
- 7.Chu, P. C., Fan, C. W. & Margolina, T. Ocean spectral data assimilation without background error covariance matrix. Ocean Dynamics66, 1143–1163, 10.1007/s10236-016-0971-x (2016). [Google Scholar]
- 8.Ewing, M. & Worzel, J. L. Long range sound transmission. Geol. Soc. Am. Memo27 (1948).
- 9.Urick, R. J. Principles of Underwater Sound. Peninsula Publishing, Page 151 (1983).
- 10.Chu, P. C. & Fan, C. W. Exponential leap-forward gradient scheme for determining the isothermal layer depth from profile data. Journal of Oceanography,73, 503–526 (2017). [Google Scholar]
- 11.Chu, P. C. & Fan, C. W. Global climatological data of ocean thermohaline parameters derived from WOA18. Scientific Data10.1038/s41597-023-02308-7 (2023). [DOI] [PMC free article] [PubMed] [Google Scholar]
- 12.Chu, P. C. & Fan, C. W. Global Ocean Climatological Dataset of 17 Thermohaline Parameters Derived from the World Ocean Atlas 2023. NOAA National Centers for Environmental Information10.25921/j3v2-jy50 (2024).
- 13.Chu, P. C. & Fan, C. W. Global climatology of 13 underwater acoustic parameters derived from WOA-2023. NOAA National Centers for Environmental Information10.25921/fe7c-5f76 (2024).
- 14.Chu, P. C. & Fan, C. W. A conserved minimal adjustment scheme for stabilization of hydrographic profiles. Journal of Atmospheric and Oceanic Technology27, 1072–1083 (2010). [Google Scholar]
- 15.Chu, P. C. & Fan, C. W. Optimal linear fitting for objective determination of ocean mixed layer depth from glider profiles. Journal of Atmospheric and Oceanic Technology27, 1893–1898 (2010). [Google Scholar]
- 16.Chu, P. C. & Fan, C. W. Maximum angle method for determining mixed layer depth from seaglider data. Journal of Oceanography,67, 219–230 (2011). [Google Scholar]
Associated Data
This section collects any data citations, data availability statements, or supplementary materials included in this article.
Data Citations
- Chu, P. C. & Fan, C. W. Global Ocean Climatological Dataset of 17 Thermohaline Parameters Derived from the World Ocean Atlas 2023. NOAA National Centers for Environmental Information10.25921/j3v2-jy50 (2024).
- Chu, P. C. & Fan, C. W. Global climatology of 13 underwater acoustic parameters derived from WOA-2023. NOAA National Centers for Environmental Information10.25921/fe7c-5f76 (2024).
Data Availability Statement
We use the MATLAB code gsw_sound_speed.m located at the website https://www.teos-10.org/ to compute sound speed profiles from the WOA23 annual and seasonal mean temperature and salinity profiles; and use the basic MATLAB functions related to Eqs. (1)–(15) to produce global climatological dataset of 13 acoustic parameters13. It is not necessary to present the code.


