Abstract
Purpose
Nano-engineering techniques have significantly enhanced the various aspects of dentistry, with notable advancements, especially in dental implant surface modification. Dental implants are among the most significant and highly successful developments in contemporary dentistry. The use of nanotechnology for surface modification of zirconia ceramic implant increases interaction with surrounding bone cells, and ultimately leading to increase osseointegration.
Materials and Methods
Glow discharge plasma was utilized to graft allylamine and fibronectin nanoproteins onto the surface of zirconia implants. A total of 18 implants were placed in right and left femurs of nine New Zealand rabbits. Implant stability test (IST), 3D bone reconstruction and micro-CT (µCT) analysis, bone-implant contact (BIC) from histomorphometry analysis, and osteogenic gene expression were analyzed after scarification at 4, 8, and 12 weeks.
Results
IST results demonstrated a significant secondary stability gain at the end of 12 weeks. The surface-treated group obtained a gradual increase in marginal bone level. Reverse transcription-quantitative polymerase chain reaction (RT-qPCR) analysis revealed increased expression of osteogenic genes of alkaline phosphatase (ALP) and transcription factor SP7 (SP7) biomarkers at 4 weeks. Osteoprotegerin (OPG) expression increased at 8 weeks, while runt-related transcription factor 2 (RUNX2), collagen 1A1 (COL1), bone sialoprotein (BSP), and receptor activator of nuclear factor κ B (RANK) exhibited the highest expression at 12 weeks. Importantly, histomorphometric analysis of BIC indicated that new bone formation was significantly higher in the A50F10 group compared to the control group at 12 weeks (P < 0.001).
Conclusion
Based on the above findings, we conclude that the nanorough zirconia implant surface grafted with fibronectin nanoproteins prominently stimulated cellular activity and improved osseointegration properties. These results evidence its potential for future applications in dental implant surface modifications.
Keywords: nano-roughness, surface modification, glow discharge plasma, zirconia implants, osseointegration, fibronectin
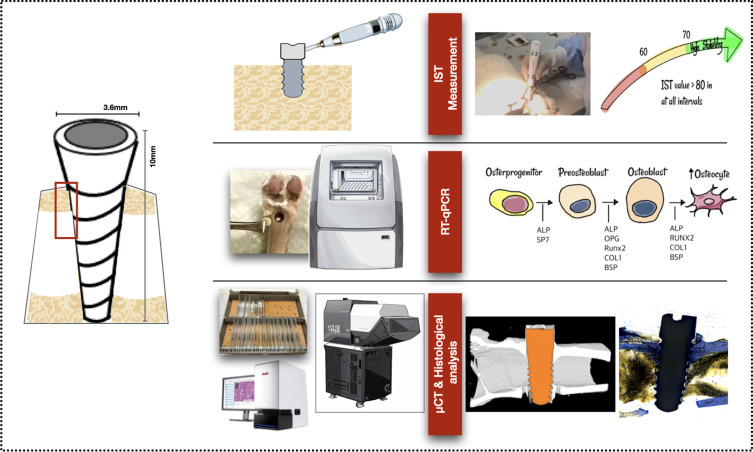
Graphical Abstract
Introduction
Nanomedicine and nanotechnology have transformed numerous healthcare sectors, including dentistry.1 With the introduction of nanoscale materials and techniques, there have been substantial advancements in enhancing dental treatments and improving patient outcomes. The development of innovative diagnostic instruments has given rise to earlier and more precise detection of dental diseases due to advancements in nanotechnology.2 In addition, incorporating nanoparticles into dental materials has resulted in restorations that are more durable and have superior aesthetics, as well as antibacterial properties.3,4 In implant dentistry, nanotechnology facilitates the precise modification of surfaces, thereby reducing the risk of infection and improving osseointegration.
Recently, new paradigms regarding the characteristics of biomaterials have emerged, and zirconia (Zr) continues to be a biomaterial of considerable interest in medicine and dental applications. It has been proposed as a possible alternative to titanium (Ti), and has demonstrated excellent long-term outcomes in clinical studies. Zirconia implants show a five-year survival rate of approximately 97.2%, which is comparable to that of titanium implants. Clinical assessments provide similar outcomes for the health of the peri-implant tissue, with indicators such as probing depth (PD) and marginal bone loss (MBL) showing good integration with the surrounding tissues.5 Moreover, Zr implants have several advantages, such as reduced bacterial adhesion and the risk of peri-implantitis.6 However, it has one major drawback of its bioinert surfaces, which impede contact with neighboring osteoblasts. This surface topography limits the potential osseointegration of Zr implants with the surrounding bone.7 This is where nanotechnology comes into play. Scientists have attempted to improve the surface characteristics of Zr implants and their interaction with nearby bone cells by developing nano-surface designs. The nano-topography of dental implants is believed to affect cell-implant contacts at both cellular and structural levels.8,9
Various types of nano-surface modification modalities include laser structuring, plasma treatment, electrochemical anodization, nanoparticle spraying, and ion-beam assisted deposition. These methods are used to improve surface energy and interaction between bone cells and implant surfaces.10,11 Moreover, it has been shown that the nano-hydroxyapatite and chitosan modified scaffolds in calvarial defects of rat models provide an effective space and improves the new bone regeneration from histological and histomorphometric analysis.12 Among them, a recent advancement includes the use of glow discharge plasma (GDP) to graft biologically active nanoproteins onto the surface of dental implants to mimic a biological environment. GDP is a versatile tool that can graft proteins at the nanoscale, providing precise surface modifications essential for advanced biomedical applications. It can activate surfaces by introducing functional groups, such as hydroxyl, carboxyl, or amine groups, that can chemically bond with proteins.13
GDP treatment typically involves generating a low-temperature, non-thermal plasma in a controlled atmosphere, which modifies the surface with functional proteins and grafts these nanoparticles onto the surface of biomaterials without altering the bulk material.14 Most importantly, the GDP technique combined with bioactive amine and fibronectin nanoproteins has been proven to improve surface hydrophilicity, create a nano-rough surface, and ultimately facilitate osteogenic properties of Zr disks in in vitro study.15 In addition, research on the effects of glow discharge plasma surface modification on zirconia implants have shown that GDP-treated surfaces facilitate osteoblastic cell differentiation and promote greater integration with bone tissue. Studies indicates that GDP-treated surfaces also reduce bacterial adhesion, notably decreasing the colonization of Porphyromonas gingivalis, a primary pathogen associated with peri-implantitis. Therefore, GDP treatment provides a more favorable environment for bone cell proliferation while simultaneously reducing the risk of bacterial attachment, compared to conventional modifications such as acid etching or sandblasting.16,17
Fibronectin (FN) is a high-molecular weight (~500-~600 kDa) glycoprotein consists of two identical strands with the capability to bind integrins and various matrix components.18 FN proteins (length 61 nm, diameter about 2 nm) have been pronounced as nano-proteins and extracellular glue since they have the ability to bind molecules from the extracellular matrix, signaling molecules, and cell adhesion molecules.18,19 Grafting fibronectin nano-proteins by utilizing GDP obtains the surface roughness at a nano-scale level and enhances the biological interactions between the implant and the surrounding tissue, leading to better clinical outcomes.15 Despite the benefits of grafting fibronectin proteins at the nanoscale level on Zr implant surfaces, it is important to recognize the lack of clinical and in vivo investigations. Therefore, this research highlights the use of GDP nanotechnology to graft fibronectin nanoproteins and aims to validate the improved osseointegration properties of Zr dental implants in animal models.
Materials and Methods
Zirconia Implant Sample Preparation
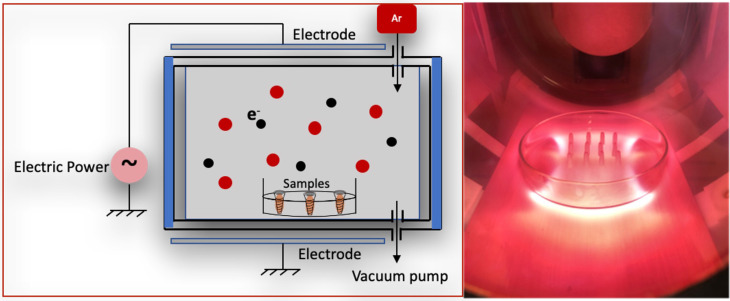
Pure Zr screw-shaped tetragonal yttria-stabilized zirconia (Y-TZP) implants having high corrosion resistance and high fracture resistance and toughness values of 13.8 MPa (by ZiBone® Coho Technology Co. Ltd., Taipei, Taiwan) with 3.6 mm diameter, 10 mm length, and 2.5 mm smooth collar were used in this study. The samples were subjected to ultrasonic cleaning, followed by sterilization using an autoclave at 121°C for 30 minutes. The samples obtained in the step are termed as control. Following low thermal plasma treatment with argon at 85 watts for 30 minutes, the samples underwent exposure to the amine organic compound in a plasma reactor (Figure 1) at 50 watts with 13.56 MHz and 100 millitorrs pressure parameters for 30 minutes. The samples were named as A50.
Figure 1.
Illustration of glow discharge plasma reactor.
Abbreviation: Ar, argon.
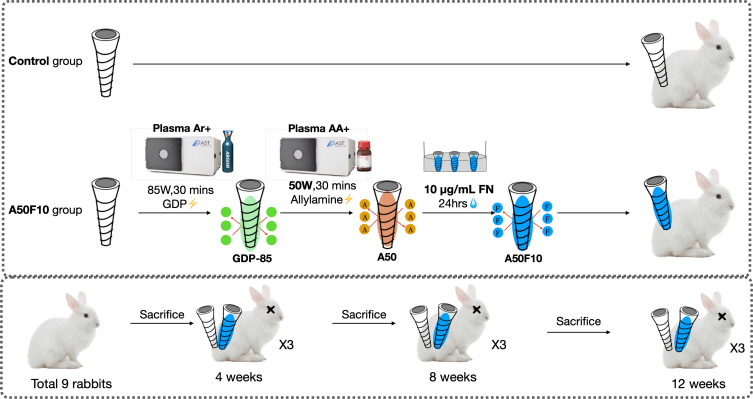
The samples were subsequently submerged in a 3% glutaraldehyde solution for 30 minutes to promote a chemical chain reaction between allylamine (A) and fibronectin (FN). Following rinsing with phosphate-buffered saline (PBS), the Zr implants were immersed in fibronectin solutions at a concentration of 10 μg/mL (Sigma-Aldrich, MA, USA) for 24 hours to graft the fibronectin proteins onto the Zr surface. Ultimately, the samples were immersed in a Tris buffer solution (Wako Pure, Osaka, Japan) with pH 7.4 for 30 minutes. The final Zr implants were labeled as A50F10 (Figure 2). Before animal surgery, all implants underwent a 12-hour sterilization process using ultraviolet irradiation.
Figure 2.
Flowchart of samples preparation procedures and experimental design.
Abbreviation: Ar, argon; GDP, glow discharge plasma; AA, allylamine; A50, allylamine 50 watts; A50F10, allylamine 50 watts, and fibronectin 10 µg/mL; FN, fibronectin.
Animal Model and Surgical Procedure
The animals received humane care following the Principles of Laboratory Animal Care as mandated by the Institutional Animal Care and Use Committee (IACUC) of Taipei Medical University (TMU) and Master Laboratory Co., Ltd., (Taiwan) and in compliance with ARRIVE guidelines (IACUC number: LAC-2020–0124). Nine adult male New Zealand rabbits (mean age: 12 weeks, mean weight: 2.2 kg) were carefully selected as experimental subjects. The animals were housed in individual cages with a humidity level of 55% and a temperature of 19 °C. They were provided with standard rabbit chow and had continuous access to water ad libitum throughout the study. Animals were taken for the surgery procedures by two experienced operators. Anesthesia was administered with the uttermost caution to assure the safety and welfare of the animals. In the gluteal region, an intramuscular injection of 50 mg/mL Zoletil 50 (Virbac Inc, Carros Cedex, France) was administered at a dosage of 15 mg/kg. A ten-minute interval elapsed after anesthesia was allowed to ensure that the animals were sufficiently sedated prior to the commencement of surgical procedures.
The surgical procedure was conducted as follows: after establishing aseptic conditions, the surgical sites, including the femur, knee, and tibia on both hind legs, were prepared with shaving, draping, and iodine sterilization. A 20 mm straight midline incision was made, starting at the knee and exposing the femur and femoral line through tissue dissection and saline irrigation. Implant placement preparations were executed on the coronal aspect of the left and right femurs using drills, starting with 2.0-mm pilot drills and progressing to 3.5-mm surgical drills. Control pure Zr implants and experimental A50F10 implants were installed at the top side of each femur. All Zr dental implants were inserted by a blinded operator with an insertion torque of 35 Newtons/cm (Ncm) until the smooth implant surface reached bone level. At 4, 8, and 12 weeks post-surgery, nine rabbits were randomly selected for sacrifice using CO2 asphyxiation following an intramuscular injection of Zoletil 50 (50 mg/mL) at 15 mg/kg into the gluteal region.
Implant Stability Test (IST)
A modified damping capacity analysis device (Anycheck, Neobiotech, Korea) which measures implant stability on a scale of 1 to 99 was used. The tapping motion was set to sequences of six taps and ceasing tapping if implant stability was deemed inadequate. High stability is indicated by an IST score greater than 65, while moderate stability is indicated by an IST score between 60 and 64. The IST was determined by aligning the instrument parallel to the ground and 90° to the long axis of the implant. When the angle between the device and the ground exceeds 30°, the control function of the device terminates the percussion test, thereby minimizing measurement errors caused by exceeding the allowable measurement angle.
Reverse Transcription-Quantitative Polymerase Chain Reaction (RT-qPCR)
Total RNA was extracted with TRIzol reagent (Thermo Fisher Scientific, USA), and then reverse transcribed into cDNA using the Reverse Transcription Kit (Thermo Fisher Scientific, USA). Total RNA concentrations were determined by nanodrop (Implen Nanophotometer, Germany). Quantitative PCR was performed with SYBR Green PCR Master Mix (Thermo Fisher Scientific, USA) on a Roche LightCycler 480 system (Roche Molecular Systems, Inc., Pleasanton, CA, USA). Gene expression of alkaline phosphatase (ALP), transcription factor SP7 (SP7/Osterix), osteoprotegerin (OPG), receptor activator of nuclear factor κ B (RANK), runt-related transcription factor 2 (RUNX2), collagen 1A1 (COL1), and bone sialoprotein (BSP) were measured. The list of forward and reverse primers is shown in Table 1.
Table 1.
Forward and Reverse Primer Sequences
| Gene Symbol | Forward primer sequence (5′-3′) | Reverse primer sequence (5′-3′) |
|---|---|---|
| GAPDH | AAA AAC CTG CCA AAT ATG AT | CAG TGA GGG TCT CTC TCT TC |
| ALP | CTT GTG CCT GGA CGG ACC CT | TGG TGC ACC CCA AGA CCT GC |
| SP7/Osterix | TGG CGT CCT CCC TGC TTG | TGC TTT GCC CAG AGT TGT TG |
| OPG | GAA GGG CGC TAC CTT GAG AT | GCA AAC TGT ATT TCG CTC TGG |
| RANK | TGT GGC ACT GGA TCA ATG AG | GTC TTG CTG ACC AAT GAG AG |
| RUNX2 | ATG CTT CAT TCG CCT CAC | ACT GCT TGC AGC CTT AAA T |
| COL1 | AGG GTC CCA ACG AGA TCG AGA TCG | TAC AGG AAG CAG ACA GGG CCA ACG TCG |
| BSP | ATG TTT TTG TGG GGT TGT AGG GT | CTA ACC GAA ACC AAT CAA CAA CCA |
Micro-Computed Tomography (µct)
Within 4-,8- and 12-week timeframes, sample blocks were first fixed in 10% buffered formalin (Dow Chemical Company, MI, USA) for 48 hours. Subsequently, micro-computed tomography (µCT) scanning analysis (SkyScan 1176, Bruker Micro-CT, Kontich, Belgium) were conducted at TMU Laboratory Animal Centre. An extensive series of three-dimensional (3D) morphological analysis was initiated in order to conduct a thorough assessment of bone morphology. During this stage, samples were selected with great care based on their grayscale density, paying specific attention on units with densities between 20 to 80. By employing this criterion for selection, we ensured that our analysis was concentrated on the pertinent data.
Morphometric analyses were conducted using data viewer software (Billerica, MA, USA), with acquisition parameters determined by the pixel within 3, 6 to 9 μm; rotation angles of 0.3°-0.45°-0.7° (for 600 or 400 projections), maintaining a constant 180°; and filter selection altered according to the degree of the structure’s X-ray absorbance.
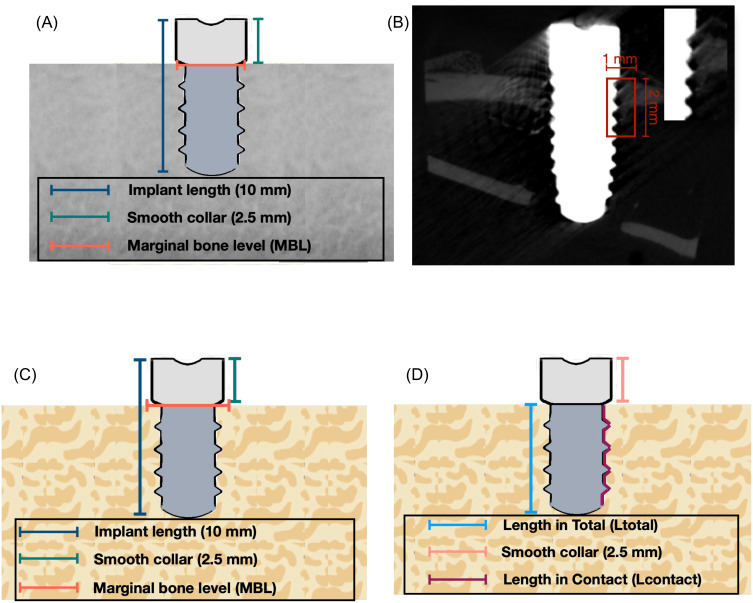
After that, 3D reconstruction was performed by CTAn, Bruker Micro CT analyzer (Billerica, MA, USA) software to identify conditions of bone resorption, deposition, and reconstruction. Region of interest (ROI) was defined as a rectangular box from the first thread of the implant, 1 mm in width and 2 mm in length (Figure 3A and B). Indices related to osteogenesis, such as the percentage of bone volume, trabecular number, thickness, and separation, were quantitatively analyzed. Finally, µCT volume rendering software (Bruker CTVox, Billerica, MA, USA) was used to visualize and analyze 3D data obtained from CTAn, creating detailed 3D visualizations, including volume rendering of the interior structures of scanned objects.
Figure 3.
Illustration of (A) Dimension of the implant, (B) Micro CT (µCT) analysis measurement indicating region of interest (ROI) with 1mm in width and 2mm in length, (C) Histological measurement, and (D) Bone implant contact (BIC) measurement of implants.
Histological Tissue Processing and Histomorphometry Evaluation
A meticulous procedure was followed to examine histological alterations within the bone. To ensure tissue preservation, specimens were submerged in 10% buffered formalin (Dow Chemical Company, MI, USA) for 48 hours for fixation. After fixation, specimens were decalcified using 10% formic acid (BASF Inc, Ludwigshafen, Germany) for 30 days to remove mineral deposits and then dehydrated in gradual ethanol solutions. The dehydrated specimens were then encapsulated in paraffin to reinforce their structure during sectioning. For microscopic examination, narrow sections, approximately 15 μm thick, were extracted from the central region of each Zr dental implant, showing the interface between the implant and adjacent bone tissue. All paraffin-embedded tissues were subjected to Masson’s Trichrome staining (St. Louis, MO, USA) in order to discern tissue structures and components. This staining technique is extensively acknowledged for its ability to emphasize a wide range of tissue constituents, such as muscle, collagen, and cell nuclei, thereby facilitating a thorough histological evaluation.
Thereafter, the bone around the implant’s neck was histomorphometrically evaluated to detect the following: (1) marginal bone level in the mesial and distal side, (2) combined marginal bone level in the coronal section, and (3) bone-to-implant contact (BIC), as shown in Figure 3C and D. The marginal bone level is calculated as “Marginal bone level = -(VMBL-2.5) mm”, while bone-to-implant contact (BIC) is defined as “BIC = (Lcontact/Ltotal) x 100%”, where Lcontact = length in contact and Ltotal = length of the implant thread.
Statistical Analysis
All experiments were conducted in triplicate to ensure the robustness of the findings. Statistical analyses were performed by GraphPad Prism (San Diego, CA, USA), with verification of normality and variance homogeneity assumptions prior to the analyses. A Student’s T-test and two-way ANOVA were performed to assess statistical significance among the groups, followed by Tukey’s HSD test for pairwise comparisons. Results are presented as mean values ± standard deviations (SDs).
Results
Implant Stability Analysis
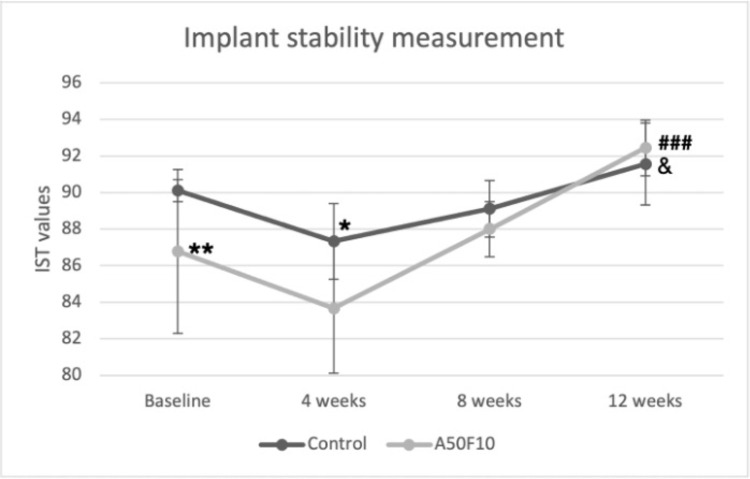
The mean IST value immediately after implant placement was 90.11 ± 0.60 for the control group and 86.77 ± 4.49 for the A50F10 group. The implant stability decreased at 4 weeks after implantation in both groups, with IST scores of 87.33 ± 2.06 and 83.66 ± 3.53 for the control group and the A50F10 group, respectively. The mean IST values of A50F10 were significantly lower at 4 weeks than control at baseline (P < 0.05) (Figure 4). Stability then gradually raised at 8 weeks, with IST scores of 89.22 ± 1.53 for the control group and 88.00 ± 1.50 for the A50F10 group. At the end of 12 weeks, the IST scores reached the highest, with 91.55 ± 2.24 for the control group and 92.44 ± 1.50 for the A50F10 group. There is a statistically significant difference for the A50F10 group at 12 weeks when compared to its baseline (P < 0.001) and compared with the control at 12 weeks (P < 0.05).
Figure 4.
Implant stability test (IST) result indicating improved implant stability of A50F10 sample group at the end of 12 weeks.
Notes: Significant difference compared with control is indicated with *P < 0.05, **P < 0.01, while for comparing with baseline A50F10 is shown with ###P < 0.001, and, &Symbol which indicate P < 0.05 for comparing with A50F10 at 12 weeks.
Osteogenic Gene Expression Analysis by RT-qPCR
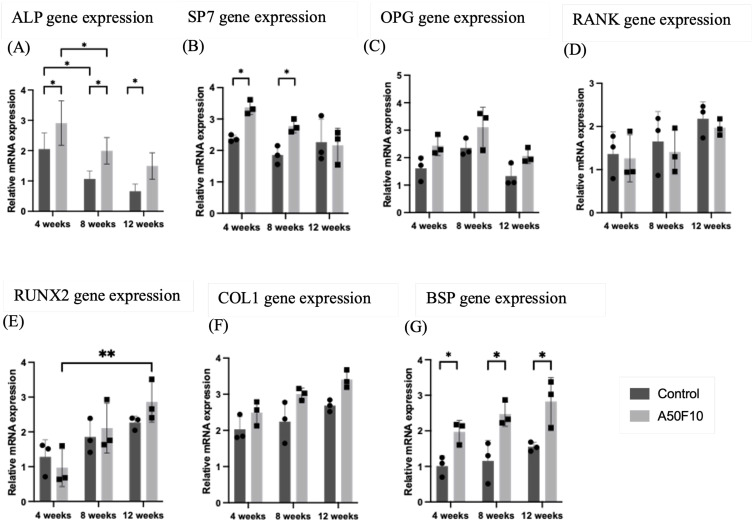
Relative expression of osteogenic gene markers, including OPG, RANK, RUNX2, COL1, and BSP, were gradually elevated with time (Figure 5A–G). The A50F10 group exhibited the highest up-regulation for early osteoblast markers, with a relative mRNA expression value of 2.90 ± 0.73 for ALP, and 3.36 ± 0.22 for SP7 at 4 weeks. There was a statistically significant difference (P < 0.05) in ALP gene expression between the control group and the A50F10 group at each time interval, while SP7 marker showed significance only at 4 weeks and 8 weeks. The highest expression of the OPG gene was 3.10 ± 0.73 at 8 weeks, and its then down-regulated to 2.06 ± 0.27 towards 12 weeks in the A50F10 group. The control group had a relative expression level of 1.65 ± 0.69 for the RANK gene at 8 weeks, while the A50F10 group had 1.40 ± 0.51; they reached the highest with values of 2.17 ± 0.39 and 1.97 ± 0.19 at the end of 12 weeks, respectively.
Figure 5.
Relative gene expression analysis by reverse transcription-quantitative polymerase chain reaction (RT-qPCR) indicating (A) Alkaline phosphatase (ALP), (B) Transcription factor SP7 (SP7), (C) Osteoprotegerin (OPG), (D) Receptor activator of nuclear factor κ B (RANK), (E) Runt-related transcription factor 2 (RUNX2), (F) Collagen 1A1 (COL1), and (G) Bone sialoprotein (BSP).
Notes: *P < 0.05, **P < 0.01, and ***P < 0.001.
At 8 weeks, the A50F10 group showed increased mRNA expressions of RUNX2, COL1, and BSP, with values of 2.10 ± 0.71, 3.00 ± 0.16, and 2.47 ± 0.34, respectively. In comparison, the control group showed the relative expression levels of 1.85 ± 0.49, 2.24 ± 0.57, and 1.15 ± 0.58. Finally, these three gene markers reached peak expression levels at end of 12 weeks. Moreover, BSP gene marker in the A50F10 group showed statistically significant results when compared to the control group at each time point.
Micro-Computed Tomography (µct) Analysis
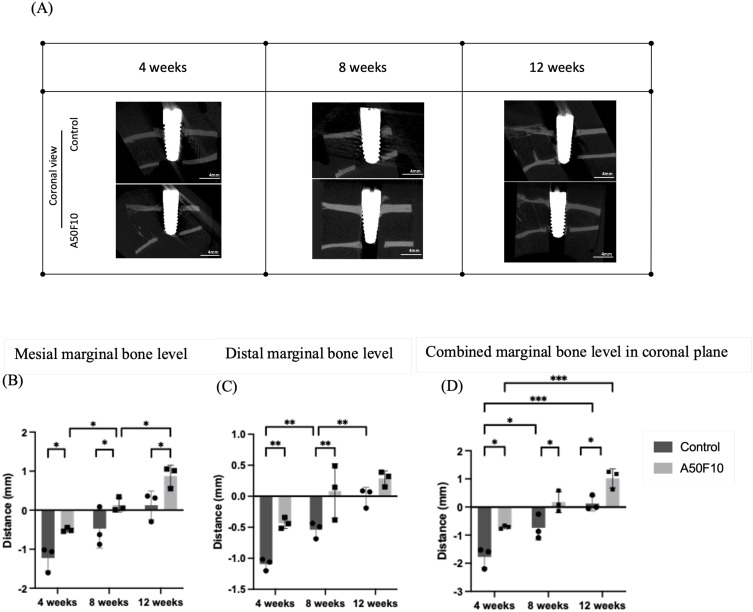
Marginal bone levels were measured, and micro-CT images of both groups were shown in Figure 6A (coronal view) and Figure 7A (sagittal view). At 4 weeks, the coronal measurement (Figure 6B) revealed a mesial marginal bone level of −1.22 ± 0.32 mm for the control group and −0.49 ± 0.05 mm for the A50F10 group, while the distal marginal bone level (Figure 6C) were −1.09 ± 0.09 mm and −0.43 ±0.08 mm for groups, respectively. At the end of 12 weeks, the A50F10 group showed the highest combined marginal bone level compared to the control (P < 0.05), with measurements of 0.87 ± 0.27 mm and 0.12 ± 0.36 mm on the mesial side and 0.28 ± 0.12mm and −0.01 ± 0.15mm on the distal side. There was a statistical significance (P < 0.05) at each different time point in mesial side, while the distal side showed a significant difference (P < 0.01) only at 4 weeks and 8 weeks between control and A50F10. The overall combined marginal bone level in the coronal section (Figure 6D) at 12 weeks demonstrated 1.01 ± 0.34 mm for the A50F10 group and 0.12 ± 0.27 mm for the control group, with statistical significance (P < 0.05) at each time interval.
Figure 6.
(A) Micro-CT 3D bone reconstructed images of implant and bone in coronal section view. Histograms illustrating the (B) Mesial, (C) Distal bone level data, and (D) Combined marginal bone level in coronal plane.
Notes: *P < 0.05, **P < 0.01, and ***P < 0.001.
Figure 7.
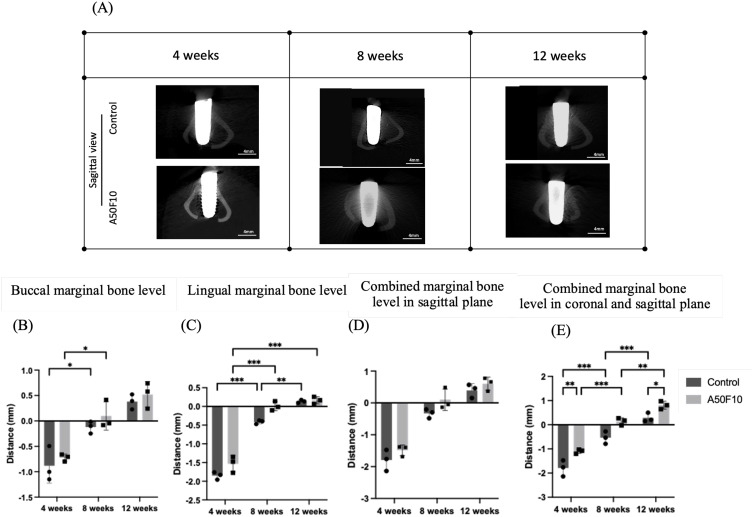
(A) Micro-CT images 3D bone reconstructed images of implant and bone in sagittal section view, Histograms illustrating the (B) Buccal, (C) Lingual bone level data, and (D) Combined marginal bone level in sagittal plane, (E) Combined marginal bone level of coronal and sagittal plane.
Notes: *P < 0.05, **P < 0.01, and ***P < 0.001.
The buccal (Figure 7B) and lingual (Figure 7C) marginal bone level indicated the A50F10 group had higher bone gain at both sides although there was no statistically significant difference. In addition, combined sagittal marginal bone level (Figure 7D) illustrated marginal bone gain of about 0.60 ± 0.20 mm for the A50F10 group and 0.44 ± 0.12 mm for the control group at the end of 12 weeks. In addition, the overall combined coronal and sagittal levels (as shown in Figure 7E) indicated at 4 weeks, the control group had −1.79 ± 0.33 mm, while the A50F10 group had −1.10 ± 0.08 mm; at 8 weeks, the control group had −0.53 ± 0.25 mm, and the A50F10 group had 0.13 ± 0.15 mm; at 12 weeks, the control group had 0.28 ± 0.18 mm, and the A50F10 group had 0.80 ± 0.16 mm. There was a statistically significant difference between the control and A50F10 groups at 4 weeks (P < 0.01) and at 12 weeks (P < 0.05).
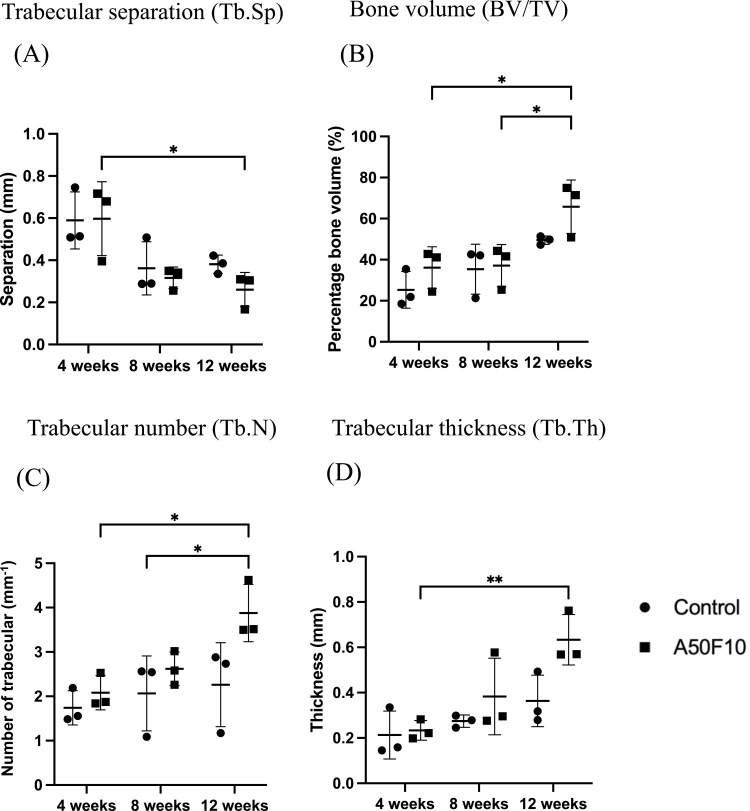
In the region of interest (ROI), trabecular separation (Tb, SP) for the A50F10 group (Figure 8A) was slightly higher initially, however, at 8 and 12 weeks, the control group showed higher values than the A50F10 group. For the bone volume (BV/TV), the control group had 25.29 ± 8.96%, and the A50F10 group had 36.11 ± 10.15% at 4 weeks. By 12 weeks, the bone volume increased, with the control group reaching 49.50 ± 2.0% and the A50F10 group reaching 65.76 ± 13.01%. There was a statistically significant difference in BV/TV between 12 weeks and both 4 and 8 weeks (P < 0.05) in the A50F10 group, as shown in Figure 8B.
Figure 8.
Illustration of micro-CT analysis of (A) Tb.Sp, (B) BV/TV, (C) Tb.N, and (D) Tb.Th data.
Notes: *P < 0.05, and **P < 0.01.
In addition, trabecular number (Tb.N) analysis (Figure 8C) showed that at 4 weeks, the control group had 1.74 ± 0.38 mm−1 and the A50F10 group had 2.08 ± 0.39 mm−1. By the end of 12 weeks, values of Tb, and N increased to 2.26 ± 0.94 mm-1 in the control group and 3.87 ± 0.64 mm-1 in the A50F10 group. There was a statistically significant increase in trabecular number for the A50F10 group at 12 weeks compared to the baseline (P < 0.05). For the trabecular thickness (Tb.Th), the results (Figure 8D) showed a similar tend to BV/TV and Tb.N analysis. At 4 weeks, the control group exhibited 0.21 ± 0.10 mm and the A50F10 group had 0.23 ± 0.04 mm. At 12 weeks, the control group increased to 0.36 ± 0.11 mm, while the A50F10 group increased to 0.63 ± 0.11 mm. Both groups began to increase at 8 weeks, and with a significant rise at 12 weeks (P < 0.05) for A50F10 group when compared to the baseline.
Histological and Histomorphometric Analysis
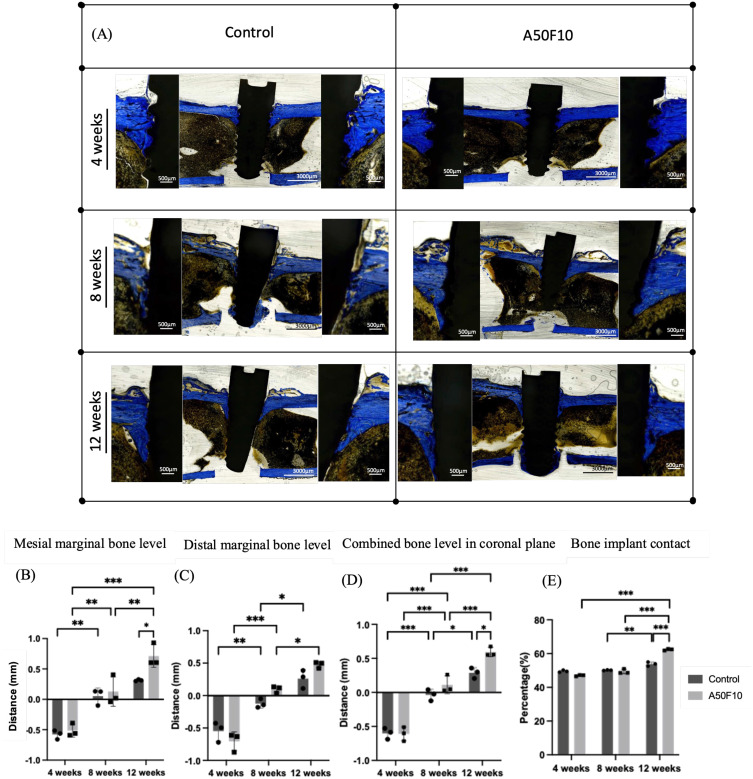
Bone level histological measurements after remodeling for the control and A50F10 groups at 4 weeks were −0.65 ± 0.09 mm and −0.51 ± 0.10 mm in the mesial side, and −0.54 ± 0.15 mm and −0.70 ± 0.14 mm in the distal side, respectively (Figure 9B and C). These measurements gradually increased to 0.05 ± 0.13 mm for the control, and 0.12 ± 0.24 mm for the A50F10 group in the mesial side, and −0.12 ± 0.06 mm and 0.09 ± 0.05 mm in the distal side at 8 weeks. At 12 weeks, the control group had 0.31 ± 0.01 mm, and the A50F10 group reached 0.26 ± 0.10 mm in the mesial side, and 0.71 ± 0.18 mm and 0.47 ± 0.04 mm in the distal side. There was a statistical significance between the control and the A50F10 groups in the mesial side at 12 weeks (P < 0.05).
Figure 9.
(A) Histological sections of control and A50F10 group demonstrating increase marginal bone level. Histomorphometric analysis data indicating (B) Mesial, (C) Distal and (D) Combined bone level in coronal section, and (E) Illustrating percentage of bone implant contact.
Notes: *P < 0.05, **P < 0.01, and ***P < 0.001.
When combining mesial and distal bone margins in the coronal section (Figure 9D), measurements at 4 weeks showed the control group was −0.60 ± 0.08 mm and the A50F10 group was −0.61 ± 0.10 mm. At 8 weeks, the control group exhibited −0.03 ± 0.08 mm while the A50F10 group showed 0.11 ± 0.13mm. By the end of 12 weeks, the control group showed 0.28 ± 0.07 mm and the A50F10 group showed 0.59 ± 0.07 mm. Statistical significance was observed between the control and A50F10 groups at 12 weeks (P < 0.05).
From the histological and histomorphometrical studies, the A50F10 group demonstrated higher bone-to-implant contact (BIC) compared to the control group at 12 weeks (P < 0.001, Figure 9A–E). At 4 weeks, the control group had slightly more bone formation, with osteocytes were observed near the threads, and woven bone had formed (Figure 9A). The A50F10 group had nearly matched the control group at 8 weeks, from about a 2% difference initially to almost less than a 1% difference by 8 weeks. However, there was no statistical significance between the two groups at 4 weeks and 8 weeks. By 12 weeks, osteoblasts were absent in almost all fields, with mature bone in direct contact with the implant surface, as indicated by the results of BIC and the ROI. All the Zr implants in both the non-plasma control and experimental groups showed improved osseointegration. The control group had a BIC of 53.79 ± 1.20%, which was lower than the A50F10 group’s 62.35 ± 2.66% at 12 weeks (Figure 9E).
Discussion
Nanotechnology is becoming more prevalent in various facets of dentistry, significantly impacting various fields. In restorative dentistry, nanocomposites are used to enhance their strength and reduce shrinkage.4 In endodontics, nano-filled sealers help effectively reduce the likelihood of reinfection, and in orthodontics, nanoparticle-coated brackets are used to minimize the risk of white spot lesions and other complications. Consequently, nanotechnology is revolutionizing the field of dentistry by introducing novel materials, methods, and tools that improve the safety, efficacy, and aesthetics of dental procedures.20,21
In periodontal therapy, nanoscaffolds are used to mimic the natural extracellular matrix, thereby promoting the attachment, proliferation, and differentiation of cells that are essential for tissue regeneration.22 Likewise, in implant surface modification, fibronectin nanoproteins grafted onto surfaces not only improve the activity of osteoblast-like cells in in vitro study23 but also enhance the initial stability and integration of dental implants, as demonstrated in this study. Osteoblasts have a key function in the osseointegration interface.24 The presence of extracellular matrix nanoproteins, such as fibronectin, can further enhance the osteogenic properties, differentiation, and proliferation of osteoblast-like cells on the bioinert surface of Zr ceramic. Surface physical and chemical analyses were thoroughly conducted to confirm the attachment of fibronectin nanoproteins, followed by biological characteristics testing in the previous in vitro study.15 Therefore, this animal study was conducted to validate in vivo whether the Zr implant surface can be functionalized with allylamine molecules under the specific plasma conditions (50 Watts, 13.56 MHz frequency, pressure of 100 millitorrs) and immersion in fibronectin nanoproteins solution (10 µg/mL) for 24 hours could result in better osseointegration compared to untreated Zr implants.
A stable IST result was obtained immediately after implant placement due to primary implant stability. The implant healing tendency values in this study indicate a decrease in stability value at 4 weeks due to a typical loss in primary implant stability caused by the bone modeling. According to Wafa and co-authors, they concluded that only implants with a high level of initial stability experienced a decline in stability during the early healing period. This finding demonstrates the significant gain in primary stability observed in the sample groups of this investigation.25 Bone remodeling generally happens between 2 to 4 weeks, with woven bone formation is mainly recognized at 4 weeks.26 This claim is consistent with the histological observation in this study, which also indicated the presence of woven bone at 4 weeks. Notably, at 4 weeks, the decrease in IST value for the control group compared to baseline (P < 0.05) was greater than the IST values loss observed for the surface-treated Zr implants, clearly indicating when implants treated with fibronectin nanoproteins exhibited higher stability.
RT-qPCR analysis detected gene expression of OPG, RANK, SP7/Osterix, RUNX2, ALP, COL1, and BSP genes (Figure 5A–G). The data matched with the previous in vitro study results, indicating an upregulation trend in the A50F10 group compared to the untreated samples.15 ALP, an early osteoblast marker, indicating for osteoblast differentiation.27 SP7 had an initial uprise at 4 weeks but later downregulated by 12 weeks, reflecting its role as an early osteogenic differentiation marker.28 OPG and RANK work together to regulate osteoclast development, activation, and bone remodeling.29 In a prior investigation conducted by Yunyi Kang et al found that increased expression of RUNX2 and OCN in stem cells stimulated by fibronectin on days 3 and 5.23 During the transformation of osteoprogenitor cells into pre-osteoblasts, there is an apparent increase in the expression of COL1.30 Therefore, the continued uprising expression of COL1 and BSP gene from baseline to 12 weeks exhibited prominently increased osteogenic transformation and differentiation in the protein-grafted group compared to the control group (P < 0.05) (Figure 5F–G).
In order to evaluate the efficacy and longevity of Zr dental implants in clinical environments, it is imperative to conduct in vivo studies of marginal bone level measurements.31 In the coronal section, the control had less marginal bone gain than the surface-treated group (P < 0.05); however, in the sagittal plane, there was no statistically significant difference between the two groups. When combining data from both the coronal and sagittal planes, the A50F10 group demonstrated significantly higher marginal bone level gain at the end of 12 weeks (P < 0.05). Delgado-Ruiz’s study reported minimal marginal crestal bone loss of 0.22 ± 0.02 mm at 3 months for sand-blasted and micro-grooved Zr implants in dog models.32 The greater marginal bone gain observed in this study, compared to Delgado-Ruiz’s findings, may be attributed to the bioactive implant surface used in this study, which promotes the expression of osteogenic gene markers and contributes to improved marginal bone gain at the end of 12 weeks.
The presence of bone growth on the implant’s surface is crucial for ensuring the long-term effectiveness of prostheses supported by implants.33 The pace at which dental implants integrate with the bone is influenced by the surface roughness and surface wettability. The majority of studies have utilized 3Y-TZP implants with surface treated by sandblasting and/or acid-etching. However, there is limited research have examined the osseointegration of Zr implants that have been machined or treated with nanoproteins grafting. The findings of this study are consistent with previous research by Canullo et al, which also concluded that plasma-treated implants exhibit increased bone-to-implant contact compared to untreated implants.
The histomorphometric analysis also supported the IST results in which fibronectin grafted Zr implants obtained a gradual increase in BIC with time. Similar to our findings, Karazisis et al showed that adding nanotopography to microrough, screw-shaped titanium implants significantly enhances bone growth and implant stability during osseointegration.34 Interestingly, in a previous in vitro study, the original smooth Zr surface had approximately 100 nm roughness. After grafting with allylamine molecules and fibronectin nanoproteins, the surface roughness increased to around 300 to 400 nm roughness.15 Strictly speaking, although 300 to 400 nm is technically above the nanometer scale, it is still significantly smaller than typical microscale roughness. In some contexts, this range might still be referred to as “nanorough”, especially if the intention is to emphasize features smaller than 500 nm. Importantly, it has been proved that bioactive fibronectin nanoproteins and allylamine-grafted Zr implants can promote cellular adhesion, proliferation, differentiation, and, ultimately, osteogenesis.35 This in vivo study proves that these nanoproteins coating can obtain increased implant stability and bone implant integration, providing evidence for its potential clinical use in the future.
The nanorough surface of fibronectin-grafted bioactive zirconia dental implants enhances osseointegration properties due to the factors that it promotes the osteoblast attachment, proliferation, and differentiation in in vitro study.15,36 Besides, the nano-roughness increases surface area and mimics the natural extracellular matrix, that encourage cell adhesion and bone growth.37 Furthermore, fibronectin’s integrin-binding properties improve cell signaling, while the nanorough texture enhances osteoconductivity, both critical for stable and rapid implant integration.38,39
The integration of nanotechnology into implant surface modification is a game-changer in dentistry. Nano-biomaterials have emerged as a promising solution for bone regeneration due to their unique properties that closely mimic the natural bone environment. These materials, including nano-hydroxyapatite, nanocomposites, and other nanostructured scaffolds, offer enhanced biocompatibility, mechanical strength, and bioactivity, making them ideal candidates for bone tissue engineering. For example, nano-hydroxyapatite (nHA) is widely used due to its chemical and structural similarity to bone minerals. It has shown potential in promoting bone regeneration with minimal toxicity or inflammatory response.40,41 Besides, polymeric nanocomposites (eg, chitosan, collagen) and synthetic polymers (eg, PLGA, PCL) reinforced with nanofillers like nHA, nano silica, and graphene oxide improve mechanical strength, cell adhesion, and proliferation, making them suitable for bone tissue regeneration.42,43 Furthermore, it has been shown that the nano-hydroxyapatite and chitosan modified scaffolds in calvarial defects of rat models provide an effective space and improves the new bone regeneration from histological and histomorphometric analysis.12
The use of fibronectin treatment on Zr implants represents a promising intersection between traditional implantology and nanomedicine. This approach not only improves the initial stability and integration of dental implants but also exhibits more conducive to bone growth, contributing to the broader field of regenerative medicine and improving patient outcomes in dental implant therapy.44 The role of nanotechnology in dentistry is anticipated to expand as research and development continue, resulting in even more innovative solutions for dental professionals and their patients. Additionally, this bioactive nano-protein grafted ceramic implant utilizes only a plasma reactor and commercially available allylamine organic compound and fibronectin proteins, which contributes to a cost-effective production process. The plasma reactor’s ability to be used repeatedly makes this approach both efficient and economically sustainable.
By leveraging the principles of nanotechnology, surface functionalization treatment of ZrO2 implants was performed under specific plasma conditions (50 watts, 13.56 MHz frequency, and 100 millitorrs pressure), leading to better osseointegration properties. The clinical implications of using fibronectin-grafted zirconia dental implants are significant, particularly will be enhancing in early osseointegration, which is crucial for implant stability and success. By leveraging a bioactive surface that integrates nano fibronectin proteins which promotes cell adhesion and osteoblast activity, these implants create a more favorable environment for bone cells to attach and proliferate leading to accelerated healing times and may reduce the risk of implant failure by supporting stronger and more immediate bone-implant contact.45,46 However, further investigation is needed to evaluate the long-term bonding efficacy of surface treatment beyond 3 months, as well as additional clinical trials to confirm the stability and osseointegration properties of fibronectin nanoproteins grafted Zr implant.
Conclusion
In this in vivo study, the implant surface was modified using plasma nanotechnology treatment combined with organic allylamine at 50 watts, 13.56 MHz frequency, and a pressure of 100 millitorrs, along with a fibronectin nanoproteins concentration of 10 µg/mL. This treatment resulted in improved osseointegration of Zr dental implants, as evidenced by satisfactory initial and late implant stability, with up-regulation of osteogenic-related gene expressions, enhanced cell-material interactions, better bone-to-implant contact, and increased marginal bone level observed from µCT and histomorphometric analyses. The use of fibronectin nanoproteins grafted by GDP nanotechnology has proven to be highly effective and holds significant research value for enhancing the performance of Zr implants in future treatments. Further investigations are required to validate these findings and optimize the treatment parameters for maximum clinical efficacy.
Funding Statement
This research was funded by the National Science and Technology Council of Taiwan (NSTC 112-2221-E-038-006-MY3, MOST110-2314-B-038-065-MY3) and Taipei Medical University-National Taiwan University of Science and Technology Joint Research Program (TMU-NTUST-113-05).
Disclosure
The authors report no conflicts of interest in this work.
References
- 1.Dakhale R, Paul P, Achanta A, Ahuja KP, Meshram M. Nanotechnology innovations transforming oral health care and dentistry: a review. Cureus. 2023;15:1. [DOI] [PMC free article] [PubMed] [Google Scholar]
- 2.Praveena C, Chaughule RS, Satyanarayana K. Nanotechnology in implant dentistry. In: Advances in Dental Implantology Using Nanomaterials and Allied Technology Applications. Springer; 2021:1–23. [Google Scholar]
- 3.Jandt KD, Watts DC. Nanotechnology in dentistry: present and future perspectives on dental nanomaterials. Dent Mater. 2020;36:1365–1378. doi: 10.1016/j.dental.2020.08.006 [DOI] [PMC free article] [PubMed] [Google Scholar]
- 4.Husseina AA, Mutar MA, Ficai A. The influence of the nature and functionalization of the nanoparticuled fillers on the performances of the dental nanocomposite. J Ceram Processing Res. 2024;25:178–191. [Google Scholar]
- 5.Roehling S, Gahlert M, Bacevic M, Woelfler H, Laleman I. Clinical and radiographic outcomes of zirconia dental implants—a systematic review and meta-analysis. Clin Oral Implants Res. 2023;34:112–124. doi: 10.1111/clr.14133 [DOI] [PubMed] [Google Scholar]
- 6.Zhang Y, Lawn BR. Novel zirconia materials in dentistry. J Dent Res. 2018;97:140–147. doi: 10.1177/0022034517737483 [DOI] [PMC free article] [PubMed] [Google Scholar]
- 7.Hanawa T. Zirconia versus titanium in dentistry: a review. Dent Mater J. 2020;39:24–36. doi: 10.4012/dmj.2019-172 [DOI] [PubMed] [Google Scholar]
- 8.Kasai H, Bergamo ET, de Fátima Balderrama Í, et al. The effect of nano hydroxyapatite coating implant surfaces on gene expression and osseointegration. Med Oral Patol Oral Cir Bucal. 2024;29:e326. doi: 10.4317/medoral.26303 [DOI] [PMC free article] [PubMed] [Google Scholar]
- 9.Alamoudi A. Nanoengineering and surface modifications of dental implants. Cureus. 2024;16. [DOI] [PMC free article] [PubMed] [Google Scholar]
- 10.Pieralli S, Kohal RJ, Lopez Hernandez E, Doerken S, Spies BC. Osseointegration of zirconia dental implants in animal investigations: a systematic review and meta-analysis. Dent Mater. 2018;34:171–182. doi: 10.1016/j.dental.2017.10.008 [DOI] [PubMed] [Google Scholar]
- 11.Gulati K, Maher S, Findlay DM, Losic D. Titania nanotubes for orchestrating osteogenesis at the bone-implant interface. Nanomedicine. 2016;11:1847–1864. doi: 10.2217/nnm-2016-0169 [DOI] [PubMed] [Google Scholar]
- 12.Chatzipetros E, Damaskos S, Tosios KI, et al. The effect of nano-hydroxyapatite/chitosan scaffolds on rat calvarial defects for bone regeneration. Int J Implant Dent. 2021;7:1–11. doi: 10.1186/s40729-021-00327-w [DOI] [PMC free article] [PubMed] [Google Scholar]
- 13.Kyzioł A, Kyzioł K. Surface functionalization with biopolymers via plasma-assisted surface grafting and plasma-induced graft polymerization—materials for biomedical applications. Biopolymer Graft Elsevier. Elsevier; 2018;115–151. [Google Scholar]
- 14.Kolenovic B, Mafla C, Richards K, et al. Plasma-induced graft polymerization for the in situ synthesis of cross-linked nanocoatings. ACS Appl Eng Mater. 2024;2:563–573. doi: 10.1021/acsaenm.3c00536 [DOI] [PMC free article] [PubMed] [Google Scholar]
- 15.Aung LM, Lin JC, Salamanca E, et al. Functionalization of zirconia ceramic with fibronectin proteins enhanced bioactivity and osteogenic response of osteoblast-like cells. Front Bioeng Biotechnol. 2023;11:1159639. doi: 10.3389/fbioe.2023.1159639 [DOI] [PMC free article] [PubMed] [Google Scholar]
- 16.Schafer S, Swain T, Parra M, et al. Nonthermal atmospheric pressure plasma treatment of endosteal implants for osseointegration and antimicrobial efficacy: a comprehensive review. Bioengineering. 2024;11:320. doi: 10.3390/bioengineering11040320 [DOI] [PMC free article] [PubMed] [Google Scholar]
- 17.Pan YH, Lin JCY, Chen MK, et al. Glow discharge plasma treatment on zirconia surface to enhance osteoblastic-like cell differentiation and antimicrobial effects. Materials. 2020;133771. [DOI] [PMC free article] [PubMed] [Google Scholar]
- 18.Engel J, Odermatt E, Engel A, et al. Shapes, domain organizations and flexibility of laminin and fibronectin, two multifunctional proteins of the extracellular matrix. J Mol Biol. 1981;150:97–120. doi: 10.1016/0022-2836(81)90326-0 [DOI] [PubMed] [Google Scholar]
- 19.Zollinger AJ, Smith ML. Fibronectin, the extracellular glue. Matrix Biol. 2017;60:27–37. doi: 10.1016/j.matbio.2016.07.011 [DOI] [PubMed] [Google Scholar]
- 20.He L, Zhang W, Liu J, Pan Y, Li S, Xie Y. Applications of nanotechnology in orthodontics: a comprehensive review of tooth movement, antibacterial properties, friction reduction, and corrosion resistance. Biomed Eng Online. 2024;23:72. doi: 10.1186/s12938-024-01261-9 [DOI] [PMC free article] [PubMed] [Google Scholar]
- 21.Aiuto R, Villani FA, Lipani E, et al. The application of nanomaterials for the rescue of a single compromised tooth with a multidisciplinary approach: case report and scoping review. Open Dent J. 2024;18. [Google Scholar]
- 22.Wang D, Li Q, Xiao C, Wang H, Dong S. Nanoparticles in periodontitis therapy: a review of the current situation. Int J Nanomed. 2024;Volume 19:6857–6893. doi: 10.2147/IJN.S465089 [DOI] [PMC free article] [PubMed] [Google Scholar]
- 23.Kang Y, Georgiou AI, MacFarlane RJ, et al. Fibronectin stimulates the osteogenic differentiation of murine embryonic stem cells. J Tissue Eng Regen Med. 2017;11:1929–1940. doi: 10.1002/term.2090 [DOI] [PubMed] [Google Scholar]
- 24.Cao X, Wang C, Yuan D, Chen S, Wang X. The effect of implants loaded with stem cells from human exfoliated deciduous teeth on early osseointegration in a canine model. BMC Oral Health. 2022;22:238. doi: 10.1186/s12903-022-02264-5 [DOI] [PMC free article] [PubMed] [Google Scholar]
- 25.Wafa’a R, Swelem AA, Radi IA. The effect of 2 versus 4 implants on implant stability in mandibular overdentures: a randomized controlled trial. J Prosthetic Dent. 2017;118:725–731. doi: 10.1016/j.prosdent.2016.12.008 [DOI] [PubMed] [Google Scholar]
- 26.Bosshardt DD, Chappuis V, Buser D. Osseointegration of titanium, titanium alloy and zirconia dental implants: current knowledge and open questions. Periodontol. 2017;73:22–40. doi: 10.1111/prd.12179 [DOI] [PubMed] [Google Scholar]
- 27.Rutkovskiy A, Stensløkken KO, Vaage IJ. Osteoblast differentiation at a glance. Med Sci Monit Basic Res. 2016;22:95–106. doi: 10.12659/MSMBR.901142 [DOI] [PMC free article] [PubMed] [Google Scholar]
- 28.Jiang Q, Nagano K, Moriishi T, et al. Roles of Sp7 in osteoblasts for the proliferation, differentiation, and osteocyte process formation. J Orthop Transl. 2024;47:161–175. doi: 10.1016/j.jot.2024.06.005 [DOI] [PMC free article] [PubMed] [Google Scholar]
- 29.Walsh MC, Choi Y. Biology of the RANKL–RANK–OPG system in immunity, bone, and beyond. Front Immunol. 2014;5:511. doi: 10.3389/fimmu.2014.00511 [DOI] [PMC free article] [PubMed] [Google Scholar]
- 30.Kannan S, Ghosh J, Dhara SK. Osteogenic differentiation potential of porcine bone marrow mesenchymal stem cell subpopulations selected in different basal media. Biol Open. 2020;9. doi: 10.1242/bio.053280 [DOI] [PMC free article] [PubMed] [Google Scholar]
- 31.Chopra D, Jayasree A, Guo T, Gulati K, Ivanovski S. Advancing dental implants: bioactive and therapeutic modifications of zirconia. Bioact Mater. 2022;13:161–178. doi: 10.1016/j.bioactmat.2021.10.010 [DOI] [PMC free article] [PubMed] [Google Scholar]
- 32.Delgado-Ruiz RA, Marković A, Calvo-Guirado JL, et al. Implant stability and marginal bone level of microgrooved zirconia dental implants: a 3-month experimental study on dogs. Vojnosanit Pregl. 2014;71:451–461. doi: 10.2298/VSP121003034D [DOI] [PubMed] [Google Scholar]
- 33.Donos N, Akcali A, Padhye N, Sculean A, Calciolari E. Bone regeneration in implant dentistry: which are the factors affecting the clinical outcome? Periodontology. 2023;93:26–55. doi: 10.1111/prd.12518 [DOI] [PubMed] [Google Scholar]
- 34.Karazisis D, Rasmusson L, Petronis S, et al. The effects of controlled nanotopography, machined topography and their combination on molecular activities, bone formation and biomechanical stability during osseointegration. Acta Biomater. 2021;136:279–290. doi: 10.1016/j.actbio.2021.10.001 [DOI] [PubMed] [Google Scholar]
- 35.Matsuura T, Komatsu K, Cheng J, Park G, Ogawa T. Beyond microroughness: novel approaches to navigate osteoblast activity on implant surfaces. Int J Implant Dent. 2024;10:35. doi: 10.1186/s40729-024-00554-x [DOI] [PMC free article] [PubMed] [Google Scholar]
- 36.Salamanca E, Wu YF, Aung LM, et al. Allylamine coating on zirconia dental implant surface promotes osteogenic differentiation in vitro and accelerates osseointegration in vivo. Clin Oral Implants Res. 2024. [DOI] [PubMed] [Google Scholar]
- 37.Cai S, Wu C, Yang W, Liang W, Yu H, Liu L. Recent advance in surface modification for regulating cell adhesion and behaviors. Nanotechnol Rev. 2020;9:971–989. doi: 10.1515/ntrev-2020-0076 [DOI] [Google Scholar]
- 38.Zhao C, Wang X, Gao L, Jing L, Zhou Q, Chang J. The role of the micro-pattern and nano-topography of hydroxyapatite bioceramics on stimulating osteogenic differentiation of mesenchymal stem cells. Acta Biomater. 2018;73:509–521. doi: 10.1016/j.actbio.2018.04.030 [DOI] [PubMed] [Google Scholar]
- 39.Dalton CJ, Lemmon CA. Fibronectin: molecular structure, fibrillar structure and mechanochemical signaling. Cells. 2021;10:2443. doi: 10.3390/cells10092443 [DOI] [PMC free article] [PubMed] [Google Scholar]
- 40.Mohd Zaffarin AS, Ng S-F, Ng MH, Hassan H, Alias E. Nano-hydroxyapatite as a delivery system for promoting bone regeneration in vivo: a systematic review. Nanomaterials. 2021;11:2569. doi: 10.3390/nano11102569 [DOI] [PMC free article] [PubMed] [Google Scholar]
- 41.Fu Y, Cui S, Luo D, Liu Y. Novel inorganic nanomaterial-based therapy for bone tissue regeneration. Nanomaterials. 2021;11:789. doi: 10.3390/nano11030789 [DOI] [PMC free article] [PubMed] [Google Scholar]
- 42.Bharadwaz A, Jayasuriya AC. Recent trends in the application of widely used natural and synthetic polymer nanocomposites in bone tissue regeneration. Mater Sci Eng C Mater Biol Appl. 2020;110:110698. doi: 10.1016/j.msec.2020.110698 [DOI] [PMC free article] [PubMed] [Google Scholar]
- 43.Tang G, Liu Z, Liu Y, et al. Recent trends in the development of bone regenerative biomaterials. Front Cell Dev Biol. 2021;9:665813. doi: 10.3389/fcell.2021.665813 [DOI] [PMC free article] [PubMed] [Google Scholar]
- 44.Komatsu K, Matsuura T, Cheng J, Kido D, Park W, Ogawa T. Nanofeatured surfaces in dental implants: contemporary insights and impending challenges. Int J Implant Dent. 2024;10:34. [DOI] [PMC free article] [PubMed] [Google Scholar]
- 45.Shayeb MAL, Elfadil S, Abutayyem H, et al. Bioactive surface modifications on dental implants: a systematic review and meta-analysis of osseointegration and longevity. Clin Oral Investig. 2024;28:592. [DOI] [PMC free article] [PubMed] [Google Scholar]
- 46.Makary C, Menhall A, Lahoud P, et al. Bone-to-implant contact in implants with plasma-treated nanostructured calcium-incorporated surface (XPEEDActive) compared to non-plasma-treated implants (XPEED): a human histologic study at 4 weeks. Materials. 2024;17:2331. doi: 10.3390/ma17102331 [DOI] [PMC free article] [PubMed] [Google Scholar]


