Abstract
Background
Parkinson’s disease (PD) is a prevalent neurodegenerative disorder characterized by the progressive loss of dopaminergic neurons. This study aims to discover potential new genetic biomarkers for PD.
Methods
Transcriptome data from a total of 56 patients with PD and 61 healthy controls were downloaded from the Gene Expression Omnibus (GEO) database. Differential gene expression (DEG) analysis, weighted gene co-expression network analysis (WGCNA), and three machine learning algorithms (LASSO, Random Forest, SVM-RFE) were employed to identify pivotal PD-associated genes. Additionally, RT-qPCR experiments were conducted to validate our findings in clinical specimens. Functional enrichment analysis and Gene Set Enrichment Analysis (GSEA) were performed to explore the functional and pathway mechanisms of the identified genes in PD. Molecular docking studies revealed potential small-molecule drug targets for the key genes.
Results
The results from the three machine learning algorithms identified ELL-Associated Factor 2 (EAF2) as a key gene in PD. Gene expression analysis indicated that EAF2 is significantly downregulated in PD patients, and the receiver operating characteristic (ROC) analysis validated the diagnostic potential of EAF2. The results from RT-qPCR on clinical specimens confirmed the findings from public database analyses. Functional enrichment analysis suggested that EAF2 is involved in dopamine biosynthesis and synaptic transmission for PD pathology. Additionally, EAF2 expression correlated significantly with immune cell infiltration. Furthermore, molecular docking results indicated that Acalabrutinib, Tirabrutinib Hydrochloride, and Ibrutinib are potential targeted therapeutic agents for EAF2.
Conclusion
These findings underscore EAF2 as a novel diagnostic biomarker and potential therapeutic target for PD, warranting further mechanistic studies and clinical validation.
Keywords: Parkinson’s disease, EAF2, transcriptomics, machine learning, immune modulation
Introduction
Parkinson’s disease (PD) is a progressive neurodegenerative disorder characterized by the selective loss of dopaminergic neurons in the substantia nigra, resulting in motor impairments such as tremors, bradykinesia, and postural instability.1 Globally, PD affects approximately 1.2% of individuals aged 65 and older, with a significant portion of cases attributed to familial genetic mutations.2,3 These mutations, which contribute to 5–10% of PD cases, play a crucial role in the pathogenesis by accelerating the aggregation of α-synuclein, a hallmark pathological feature of PD.4,5 Despite extensive research efforts, the molecular mechanisms underlying PD remain incompletely understood, underscoring the need for further investigation into its pathophysiology and targeted therapeutic strategies.
Recent advancements in bioinformatics and genomic technologies have revolutionized the study of PD, particularly through the integration of large-scale transcriptomic datasets available in repositories such as the Gene Expression Omnibus (GEO).6 These datasets have enabled comprehensive analyses of gene expression profiles in PD patients compared to healthy controls, revealing numerous candidate genes and biological pathways implicated in PD progression.7 For instance, genes involved in dopamine biosynthesis (eg, TH),8 synaptic transmission (eg, SNCA),9 and metabolic pathways (eg, PINK1)10 have been identified as critical factors in PD pathogenesis.
However, despite these insights, the comprehensive gene expression landscape in PD remains insufficiently explored, with many PD-associated genes requiring further characterization. To bridge this gap, our study leverages advanced machine learning algorithms alongside GEO transcriptomic data.11 Specifically, we employ techniques including Random Forest, Support Vector Machine Recursive Feature Elimination (SVM-RFE), and LASSO regression to systematically identify novel candidate genes implicated in PD. Initially recognized for its role in cancer biology, ELL-Associated Factor 2 (EAF2) influences cellular processes such as proliferation and apoptosis through interactions with transcriptional machinery.12,13 We hypothesize that EAF2 may similarly influence PD pathology through these mechanisms. Despite its known functions, the specific role of EAF2 in PD and its impact on disease progression remain poorly understood.
Moving forward, our study aims to elucidate the specific roles of EAF2 in PD using comprehensive bioinformatics approaches. By investigating its expression profile and molecular interactions within relevant pathways, we seek to uncover underlying disease mechanisms at the molecular level. This investigation promises not only to enhance our understanding of PD pathophysiology but also to pave the way for future therapeutic strategies targeting these molecular pathways. The integration of machine learning techniques provides a robust framework for identifying key genetic factors and advancing precision medicine in PD research.
Materials and Methods
Data Download and Integration
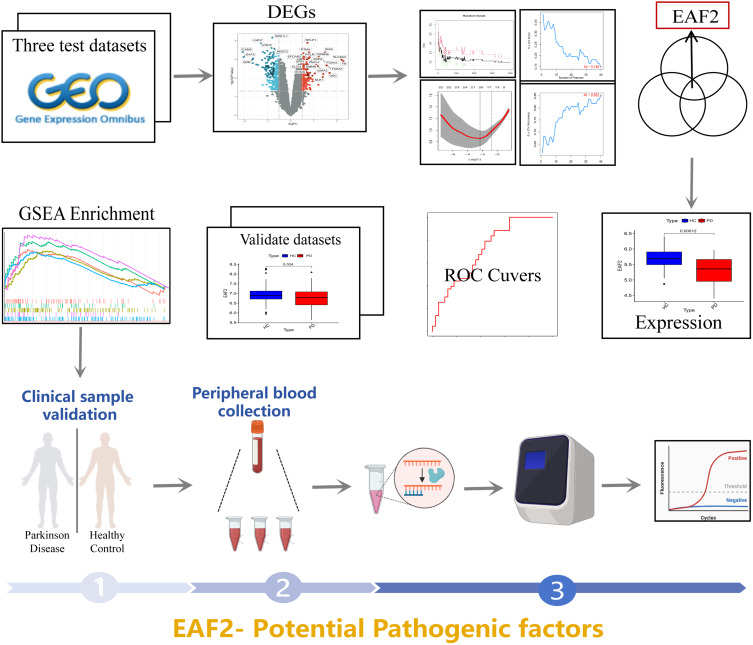
All data used in this study were obtained from the Gene Expression Omnibus (GEO) database (https://www.ncbi.nlm.nih.gov/geo/). Five datasets were downloaded from brain substantia nigra specimens of PD patients and healthy individuals, specifically GSE7621, GSE20163, GSE26927, GSE20164, and GSE20292. Detailed information about these datasets is presented in Table 1. The datasets GSE7621, GSE20163, and GSE26927, comprising 35 PD patients and 36 healthy individuals, were used as experimental datasets. The datasets GSE20164 and GSE20292, consisting of 21 PD patients and 25 healthy controls, served as validation datasets. The complete analytic workflow is illustrated in Figure 1. Batch effect correction on datasets from different platforms was performed using the Combat function in the “sva” package in R to ensure inter-sample consistency.
Table 1.
List of Datasets and Platforms Utilized in This Study
Figure 1.
Flowchart depicting the study design.
Differential Gene Expression Analysis and Weighted Gene Co-Expression Network Analysis
Differentially expressed genes (DEGs) between PD patients and healthy controls were analyzed using the limma package in R (version 4.3.0), with thresholds set at |logFC| > 1 and Padj < 0.05. Significant DEGs were visualized using heatmaps created with the R packages “pheatmap” and “ggplot2”. Significantly upregulated and downregulated genes were visualized using volcano plots and heatmaps. Weighted gene co-expression network analysis (WGCNA) was performed using the R package “WGCNA” to identify potential functional modules characterizing the biological function of PD samples. Genes with similar expression patterns were assigned to co-expression modules. From the adjacency matrix, a topological overlap matrix (TOM) was derived, based on which genes were divided into modules according to the degree of dissimilarity in the TOM. The parameters for ME diss trees, minimal module size, and soft thresholding power were set to 0.25, 50, and 10, respectively. Gene significance (GS) and module membership (MM) were calculated, and the corresponding genes were extracted from the hub module for further analysis.
Machine Learning
To identify optimal feature genes for PD, three machine learning algorithms (LASSO, Random Forest, and SVM-RFE) were employed. LASSO regression was used to address high-dimensional data sparsity, with analyses performed using the “glmnet” package in R. The Random Forest (RF) algorithm, implemented with the “RandomForestSRC” R package, was based on an ensemble of decision trees generated by random feature sets, classifying samples via nonlinear decision boundaries. Recursive Feature Elimination based on Support Vector Machines (SVM-RFE) was implemented using the “cfe” function in the “cfe” package, with cross-validation of the fitted prediction function. The intersection of genes from the three machine learning algorithms was identified as the optimal feature genes for PD.
Functional Enrichment Analysis and Protein-Protein Interaction Network
Gene Ontology (GO) enrichment analysis,14 encompassing molecular function (MF), cellular components (CC), and biological processes (BP), was conducted along with Kyoto Encyclopedia of Genes and Genomes (KEGG)15 enrichment analysis to display functional signaling pathways involved in PD genes. Disease Ontology (DO) enrichment analysis identified diseases related to candidate feature genes. GO, KEGG, and DO enrichment analyses were performed using the “clusterProfiler” and “DOSE” R packages. The protein-protein interaction (PPI) network of overlapping candidate genes was constructed via the STRING database (https://cn.string-db.org/),16 with hub genes identified using Cytoscape software.17
Diagnostic Efficacy of Hub Genes in PD and Repeatability Verification
To evaluate the accuracy of feature genes for PD, receiver operating characteristic (ROC) analyses were conducted using the “pROC” R package. The area under the curve (AUC) values assessed the predictive utility of identified hub genes, with AUC > 70% considered moderately predictive. The GSE20164 and GSE20292 datasets were merged for differential testing and diagnostic function verification of hub feature genes.
Gene Set Enrichment Analysis and Gene Set Variation Analysis
Gene Set Enrichment Analysis (GSEA) was conducted on a gene list sorted by the Spearman correlation coefficient between each gene and the specified hub gene to predict significant biological processes and pathways associated with the hub gene. GSEA was performed using the “DOSE” package in R. Correlations between optimal feature gene expression levels were calculated using Pearson correlation analysis. The ssGSEA algorithm and GSVA algorithm, implemented with the “ssGSEA” and “GSVA” R packages, respectively, were used to calculate progress scores.
Immune Cell Composition
The infiltration of 22 different immune cell subtypes into PD patient tissues was estimated using the CIBERSORT algorithm.18 Analyses with P < 0.05 were considered significant, and the R “corrplot” package was used to visualize immune cell composition. Relative immune cell infiltration between PD and control samples was compared and visualized using the “vioplot” R package. Relationships between hub gene expression levels and immune cell infiltration were examined through Spearman’s rank correlation analyses and visualized using the R “ggpubr” package.
Clinical Sample Collection
From July 2023 to December 2023, 40 PD patients and 40 healthy controls were enrolled from the inpatient population of Henan Provincial People’s Hospital. Selection criteria for PD patients included meeting the diagnostic criteria for PD, UPDRS scores ranging from 20 to 50, and Hoehn-Yahr (HY) stages ranging from 2 to 5. All PD patients underwent separate clinical diagnoses and evaluations by two neurology doctors, while healthy controls were confirmed to have no neurodegenerative diseases, severe systemic illnesses, psychiatric disorders, or a history of head trauma. Peripheral blood samples were collected from patients and controls on an empty stomach in the morning and stored at −80°C until use. This study was approved by the Ethics Committee of Henan Provincial People’s Hospital (Ethics approval number: 2023087), with detailed clinical sample information presented in Supplementary Table 1.
Real-Time Quantitative PCR
Total RNA was extracted using a centrifuge column RNA extraction kit (Beyotime, Shanghai, China). First-strand cDNA was synthesized according to the manufacturer’s protocols (#K1622, Thermo Fisher, Beijing, China), with GAPDH used as an internal reference. PCR amplification was performed with 1 cycle of 30s at 95°C, followed by 40 cycles of 15s at 95°C and 30s at 60°C. All reactions were repeated in triplicate. Gene expression levels were calculated using the delta–delta Ct method (2−ΔΔCt). Primers used are shown in Table 2.
Table 2.
Primer Sequences for GAPDH and EAF2 Used in This Study
| Primer name | Primer sequence (5ʹ-3ʹ) |
|---|---|
| GAPDH-F (internal reference) | GGAAGCTTGTCATCAATGGAAATC |
| GAPDH-R (internal reference) | TGATGACCCTTTTGGCTCCC |
| EAF2-F | CCACACTGTGCGCTATGACT |
| EAF2-R | GTCACCTGTTCACCTTCACCA |
Potential Therapeutic Drugs Prediction and Molecular Docking
Optimal characteristic genes for sepsis were searched in the CTDbase (https://ctdbase.org/) to obtain drug interaction information. Drugs related to these genes were predicted using Enrichr (https://maayanlab.cloud/Enrichr/), providing a gene-drug combined score and p-value. Functional information and structures of drug molecules were obtained from PubChem (https://pubchem.ncbi.nlm.nih.gov/). Molecular docking was performed using AutoDock Vina (version 1.1.2) and visualized using PyMOL (version 2.4) and PLIP (https://plip-tool.biotec).
Statistical Analysis
All data processing, statistical analysis, and plotting were conducted using R software (version 4.3.0) and GraphPad Prism (version 9). The Wilcoxon rank-sum test or Student’s t-test was used to analyze differences between groups. Correlations between variables were determined using Pearson’s or Spearman correlation tests. All statistical P-values were two-sided, with P < 0.05 regarded as statistically significant.
Result
Identification of Differentially Expressed Genes (DEGs) Between PD and Control Tissues
After standardizing data formats, filling in missing values, and removing outliers, normalized gene expression profiles of the training set (GSE7621, GSE20163, and GSE26927) were generated (Supplementary Figure 1a). Following data merging and elimination of batch effects, a combined expression matrix containing 9936 gene symbols was obtained from 35 PD patients and 36 healthy controls. DEG analysis identified 183 upregulated genes and 288 downregulated genes, which were visualized using volcano plots and heatmaps (Supplementary Figure 1b and c), highlighting genes potentially involved in the pathology of PD.
Weighted Gene Co-Expression Network Analysis (WGCNA) for Clinical Trait-Associated DEGs in PD
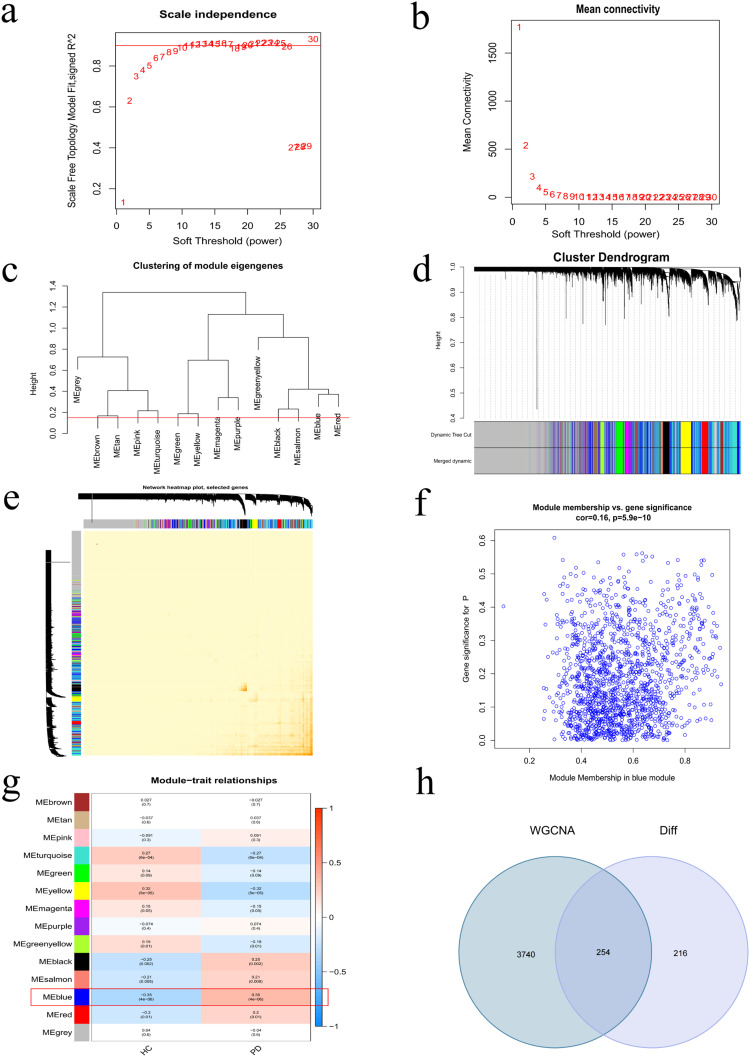
WGCNA was performed on 9939 genes from 36 control and 35 PD samples, resulting in the identification of 14 modules after merging highly correlated ones (Figure 2a–d). The soft thresholding power was set to 20, based on achieving a scale-free R2 = 0.9 and high average connectivity. The blue module, containing 3994 genes, showed a strong correlation with PD (R = 0.35, P < 0.0001) (Figure 2e–g). Out of these, 254 overlapping genes were identified as candidate feature genes, based on their association with both DEGs and hub genes in the blue module (Figure 2h).
Figure 2.
Weighted gene co-expression network analysis (WGCNA). (a) Dendrogram for sample clustering, with tree leaves corresponding to individual samples. (b and c) Selection of soft-thresholding powers (β) and scale-free topology fitting indices (R2); β=10 was chosen for optimal model fit. (d) Dendrogram of modules identified through hierarchical clustering. (e) Sample cluster dendrogram, with colors representing distinct modules. (f) Correlation analysis between modules. (g) Associations between modules and clinical characteristics in normal and PD samples. (h) Interactions among genes within co-expression modules.
Functional Enrichment Analysis of Candidate Feature Genes for PD
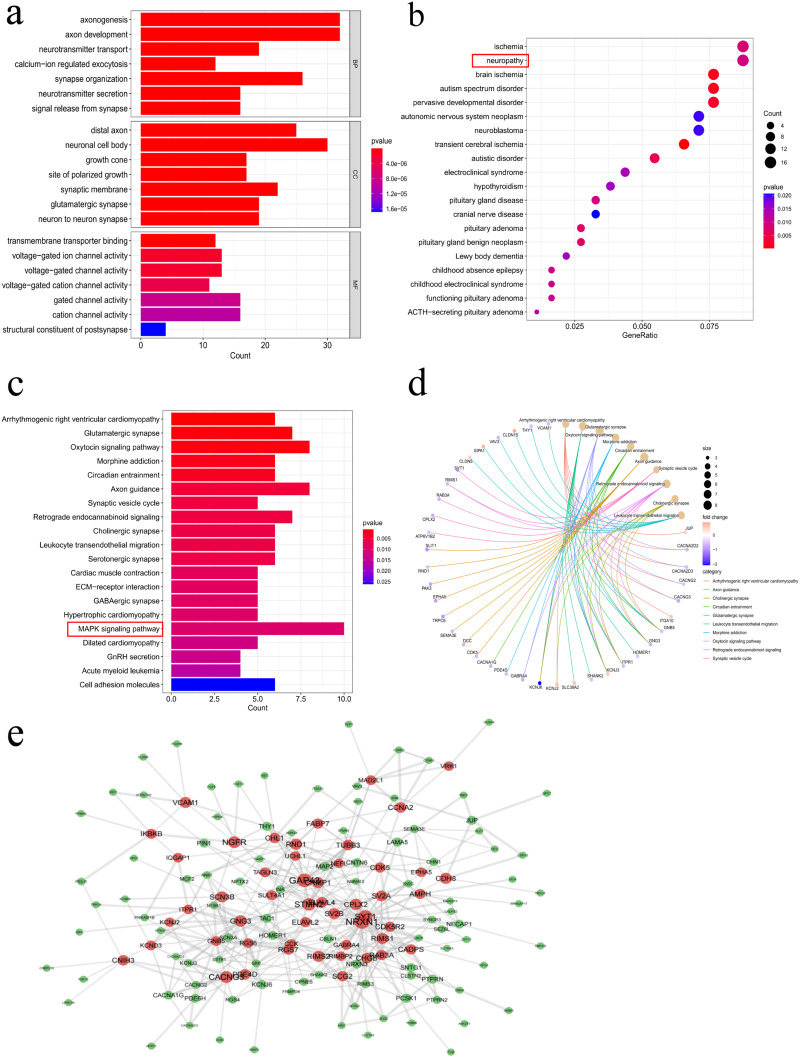
Functional enrichment analysis explored the biological functions and potential pathways associated with PD. GO analysis indicated that candidate feature genes are primarily involved in nervous system development (eg, axon development, neurotransmitter transport), neuron structure (eg, synaptic membrane, glutamatergic synapse), and ion channel activity (eg, voltage-gated ion channels) (Figure 3a). DO analysis highlighted related diseases such as neuropathy and brain ischemia (Figure 3b). KEGG analysis identified the top 15 enriched pathways, with the MAPK signaling pathway being the most significant (Figure 3c). A PPI network was constructed to illustrate the relationships among candidate feature genes (Figure 3d).
Figure 3.
Functional enrichment analysis. (a) Venn diagram showing intersection of DEGs and WGCNA-derived candidate feature genes. (b) Gene Ontology (GO) enrichment analysis of DEGs categorized into biological process (BP), cellular component (CC), and molecular function (MF). (c) Disease Ontology (DO) analysis revealing diseases associated with candidate genes. (d and e) KEGG pathway enrichment analysis highlighting pathways involving candidate feature genes. (f) Protein-protein interaction (PPI) network analysis of candidate feature genes in PD, indicating significant protein interactions.
Identification of Hub Genes Using Machine Learning
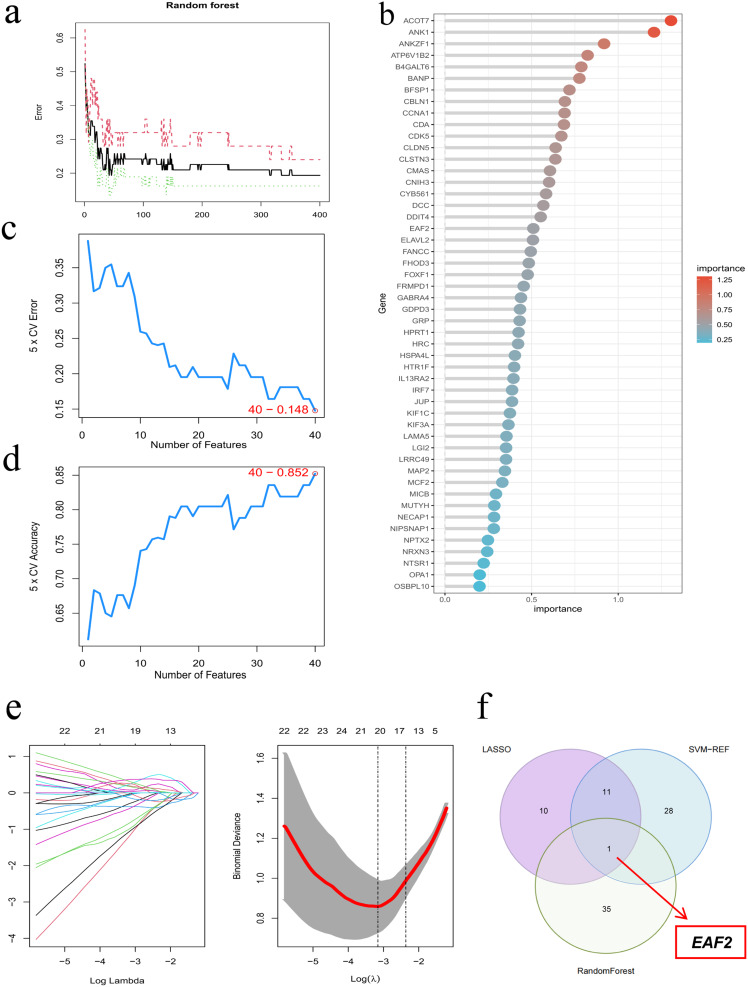
Various machine learning methods were used to identify hub genes for PD. The RF algorithm identified the top 36 genes based on relative importance (Figure 4a and b). SVM-RFE selected 40 genes based on minimal root mean square error from 10-fold cross-validation (Figure 4c and d). The LASSO regression algorithm identified 22 key gene variables at an optimal lambda of 0.037 (Figure 4e and f). EAF2 was identified as the only overlapping gene among the three algorithms, as illustrated in the Venn diagram (Figure 4g).
Figure 4.
Identification of hub genes for PD using machine learning. (a and b) Impact of decision tree numbers on cross-validation error of Random Forest (RF) classifier. (c and d) Optimal error and accuracy rates of Support Vector Machine (SVM) model based on individual genes. (e) Logarithm (Lambda) values of genes in LASSO model and optimal Log values in the LASSO model. (f) Venn diagram illustrating overlapping genes in LASSO, SVM, and RF models.
Diagnostic Value and Validation of EAF2 in PD
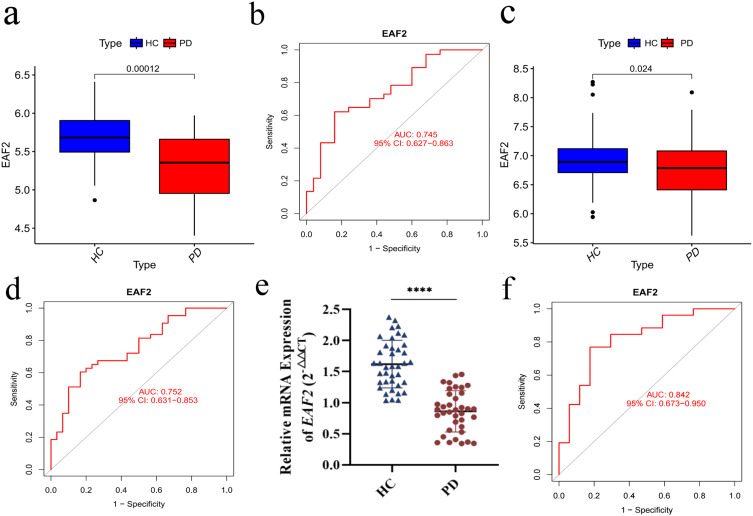
EAF2 expression levels were assessed in PD patients and healthy controls. Analysis of the training dataset revealed reduced EAF2 mRNA levels in PD brain tissues (Figure 5a). ROC curves demonstrated its diagnostic potential with an AUC of 0.745 (Figure 5b). Validation using the GSE20164 and GSE20292 datasets confirmed lower EAF2 expression in PD patients (Figure 5c) with an AUC of 0.752 (Figure 5d). RT-qPCR experiments on peripheral blood samples further confirmed lower EAF2 mRNA levels in PD patients (Figure 5e), with an AUC of 0.842 (Figure 5f). These findings consistently indicate EAF2 downregulation in PD, suggesting its involvement in PD pathology.
Figure 5.
Gene expression and diagnostic efficacy. (a) RT-qPCR results demonstrating reduced EAF2 expression in PD based on experimental dataset. (b) ROC curve showing diagnostic value of EAF2 in PD based on experimental dataset (AUC = 0.745). (c) Decreased EAF2 expression observed in PD validation dataset. (d) Diagnostic performance of EAF2 in validation dataset (AUC = 0.752). (e) Significant downregulation of EAF2 in peripheral blood samples from PD patients compared to healthy controls. (f) Diagnostic efficacy of EAF2 in clinical samples (AUC = 0.842; t-test analysis, ****P < 0.0001).
EAF2 Participation in PD Pathological Progression Through Multiple Pathways
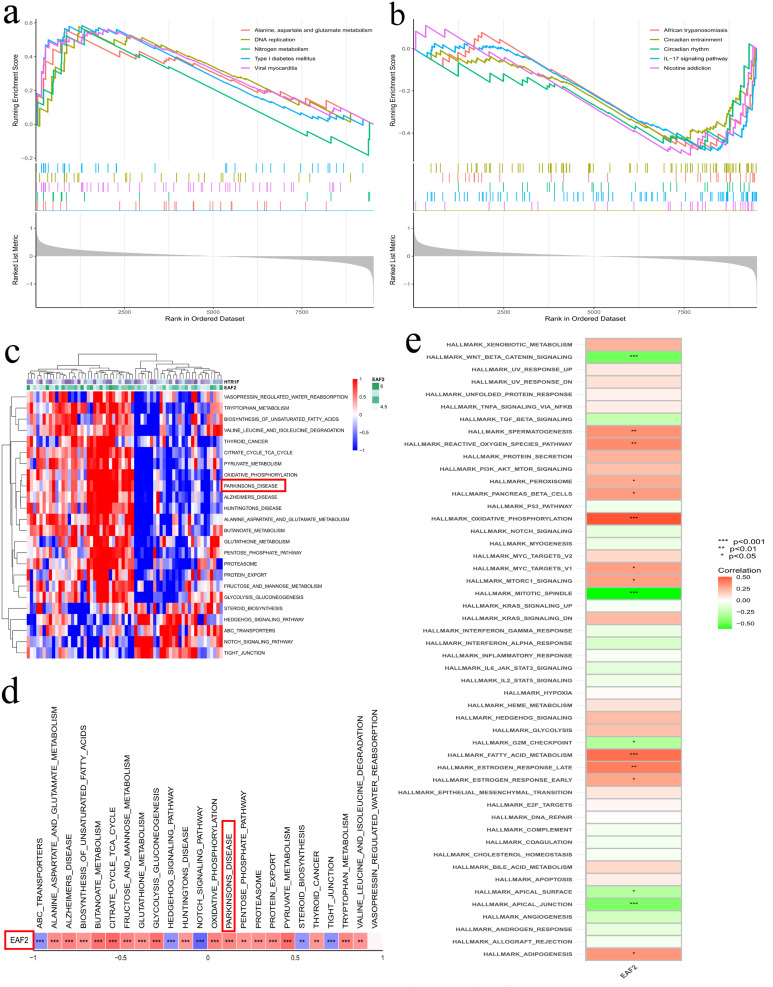
GSEA identified five upregulated pathways (amino acid metabolism, DNA replication, nitrogen metabolism, Type I diabetes mellitus, and viral myocarditis) and five downregulated pathways (circadian entrainment, circadian rhythm, IL-17 signaling pathway, nicotine addiction, and African trypanosomiasis) associated with EAF2 (Figure 6a and b). GSVA indicated differential expression of EAF2-related pathways in PD patients, highlighting PD-related pathways (Figure 6c and d). ssGSEA showed that EAF2 was mainly enriched in MAPK-related pathways in PD (Figure 6e).
Figure 6.
Gene enrichment analysis. (a and b) Gene Set Enrichment Analysis (GSEA) results for top five positively and negatively correlated pathways with EAF2. (c and d) Single-gene GSEA revealing pathways enriched by EAF2 in PD. (e) Gene Set Variation Analysis (GSVA) indicating differential pathway expression of EAF2 in PD patients compared to normal controls.
Correlation Between EAF2 and the Immune Environment of PD
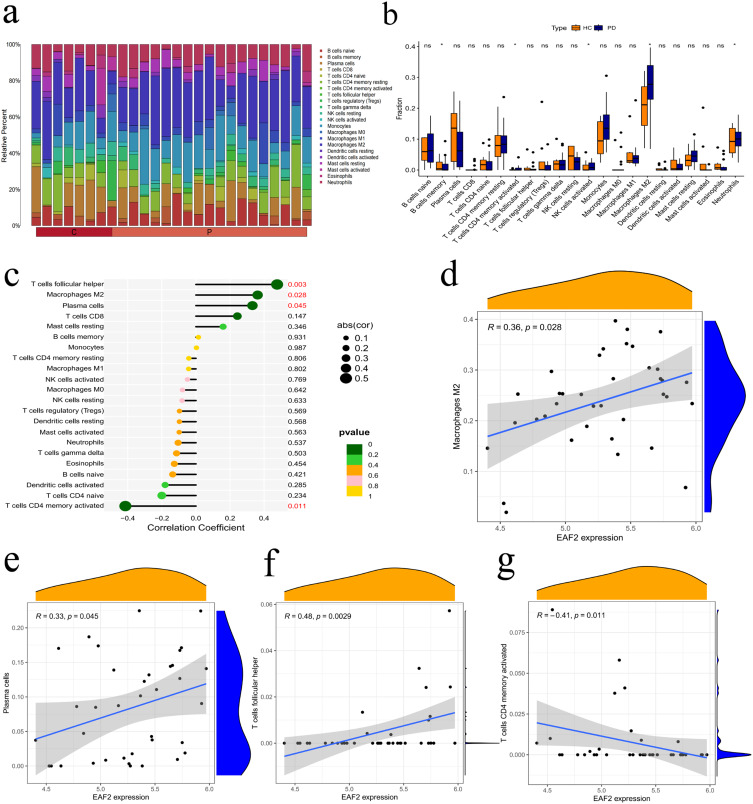
The study explored differences in immune cell expression between PD patients and healthy controls using the CIBERSORT algorithm. Significant differences were observed in T cells, macrophages, and NK cells (Figure 7a). PD samples showed increased levels of B cells, activated memory CD4 T cells, NK cells, and M2 macrophages (Figure 7b). Correlation analysis revealed a significant positive correlation between EAF2 expression and follicular helper T cells, M2 macrophages, and plasma cells, and a significant negative correlation with activated CD4 memory T cells (Figure 7c–g). These findings suggest that EAF2 dysregulation affects immune cell composition in PD, contributing to immune microenvironment instability.
Figure 7.
Correlation between immune-related cells and EAF2 in PD. (a) Stacked bar chart depicting infiltrating immune cells in PD and healthy controls. (b) Violin plot illustrating differences in infiltration levels of 22 immune cell types between PD and normal controls. (c) Lollipop plots showing correlation between EAF2 expression and immune cells. (d–f) Immune cells positively correlated with EAF2. (g) Immune cells negatively correlated with EAF2. (t-test analysis, *P < 0.05).
Drug Target Prediction and Molecular Docking for Sepsis Treatment
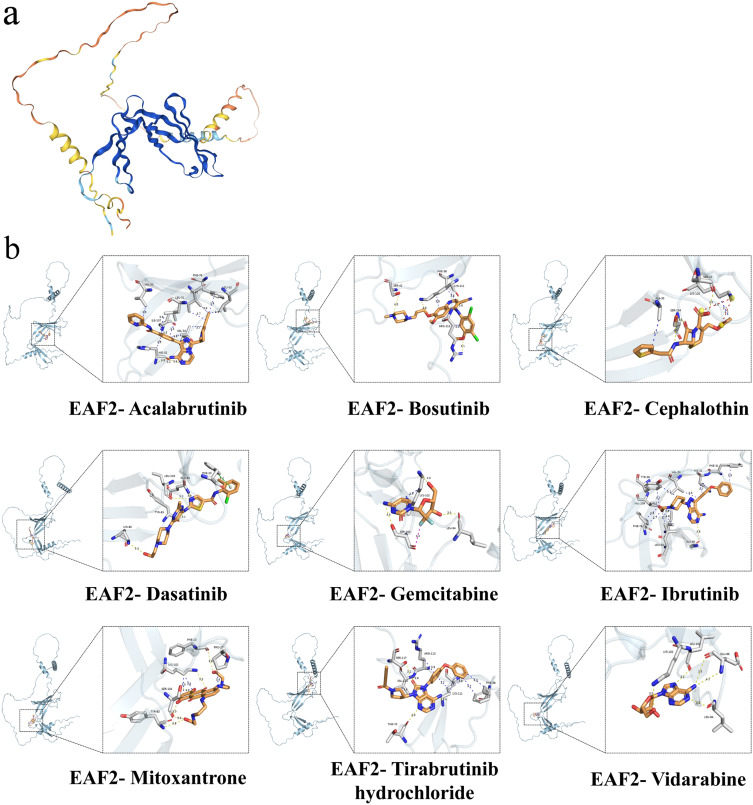
Potential drug targets related to EAF2 were predicted, identifying the top nine drugs with the highest combined scores, including Acalabrutinib, Tirabrutinib Hydrochloride, Ibrutinib, Cefalotin, Dasatinib, Gemcitabine, Vidarabine, Bosutinib, and Mitoxantrone (Table 2). Molecular docking techniques were employed to explore the optimal binding modes between these drugs and EAF2 (Figure 8a). Among the findings, Acalabrutinib and Tirabrutinib hydrochloride showed the best binding effects with EAF2, and the structures of the protein target-small molecule drug docking models are illustrated in Figure 8d–f. This analysis provides potential therapeutic targets and candidate drugs for Parkinson’s disease treatment, offering new avenues for drug development and personalized medicine.
Figure 8.
Molecular docking of EAF2 with potential therapeutic drugs. (a) Three-dimensional structure of the EAF2 protein. (b) Predicted binding modes of EAF2 with top candidate drugs, including Acalabrutinib, Bosutinib, Cephalothin, Dasatinib, Gemcitabine, Ibrutinib, Mitoxantrone, Tirabrutinib Hydrochloride, and Vidarabine.
Discussion
Our study employed an integrated transcriptomic and machine learning to identify EAF2 as a diagnostic biomarker and key pathogenic factor in PD. By analyzing five datasets from the GEO and validating findings through RT-qPCR, we demonstrated that expression of EAF2 is consistently downregulated in PD patients compared to healthy controls. The diagnostic value of EAF2 was confirmed by ROC analysis, showing high AUC values in both training and validation datasets, underscoring its potential as a reliable diagnostic marker for PD. Peripheral blood samples collected for validation also showed similar trends, reinforcing the robustness of our findings across different sample types.
Previous studies have primarily focused on the oncological role of EAF2, particularly in prostate19 and colorectal cancer,12 where it functions as a tumor suppressor. Our research extends the significance of EAF2 to neurodegenerative diseases, specifically PD. Notably, interaction of EAF2 with the von Hippel Lindau protein (p-VHL) and its influence on HIF1-α stabilization may provide a mechanistic link to PD,20,21 as HIF1-α is known to exacerbate motor symptoms of the disease.22,23 In this context, EAF2 may be pivotal in the stabilization of HIF1-α and its downstream signaling pathways, offering new insights into how this protein might exacerbate PD pathology.
Functional enrichment analysis of EAF2-related genes revealed its involvement in critical biological processes tied to PD, such as dopamine biosynthesis and synaptic transmission. These findings align with the current understanding of PD pathophysiology, where degeneration of dopaminergic neurons and synaptic dysfunction play central roles.24,25 The enrichment of candidate genes in dopamine-related pathways suggests that EAF2 could be intricately involved in the regulation of dopaminergic signaling, and disruptions in its expression may contribute to synaptic malfunction, a hallmark of PD.26,27 Moreover, our KEGG analysis identified pathways linked to amino acid metabolism, which may point to underlying metabolic disturbances in PD, with accumulating evidence suggesting that impaired amino acid metabolism can contribute to neuronal damage and disease progression.28 Thus, these findings offer a fresh perspective on the metabolic aspects of PD and opens new avenues for understanding the disease’s molecular underpinnings.
The observed dysregulation of immune cell composition suggests that EAF2 could play a modulatory role in immune responses within the PD microenvironment. Immune cell infiltration is a hallmark of PD pathology, contributing to neuronal death and central nervous system damage through inflammatory cascades.29,30 Our study found significant correlations between expression of EAF2 and various immune cell types, including T cells, NK cells, and macrophages. Increased T cell infiltration in the substantia nigra of PD patients and the associated loss of dopaminergic neurons have been well-documented.31,32 Similarly, macrophage dysfunction and increased blood-brain barrier permeability exacerbate neuroinflammation in PD.33,34 Our results are consistent with these findings, suggesting that EAF2 modulates the immune microenvironment in PD, further implicating its role in disease pathogenesis.
Additionally, drug target prediction and molecular docking analyses identified several compounds that bind to EAF2, indicating that EAF2 also emerges as a promising therapeutic target. Among these compounds, Acalabrutinib and Tirabrutinib hydrochloride showed the most favorable binding interactions. While these drugs are primarily known for their roles in cancer treatment, particularly by inhibiting Bruton’s tyrosine kinase (BTK), recent research suggests that BTK inhibitors may have potential neuroprotective effects by modulating immune responses and reducing neuroinflammation-both of which are critical in the pathology of PD.35 This opens up a novel avenue for drug repurposing in PD, offering a promising new approach to its treatment.
Despite the promising insights provided by our study, several limitations must be acknowledged. First, the sample size, while sufficient for initial analyses, could be expanded in future studies to improve statistical power and generalizability. Second, although we used microarray data for transcriptomic profiling, incorporating next-generation sequencing technologies would provide a more comprehensive understanding of EAF2’s role in PD. Lastly, while our results establish a strong correlation between EAF2 and PD, further mechanistic studies, including in vitro and in vivo experiments, are necessary to elucidate EAF2’s precise role in PD pathogenesis and its potential as a therapeutic target.
Conclusion
To the best of our understanding, this study represents the first comprehensive investigation into the role of EAF2 in PD using transcriptomic analysis and machine learning. Our findings identify EAF2 as a novel diagnostic biomarker for PD and suggest its involvement in multiple pathways affecting neuronal function and metabolism. Correlation of EAF2 expression with immune cell infiltration further highlights its role in the immune dysregulation observed in PD. These discoveries lay a foundation for future research into the molecular mechanisms of EAF2 in PD and its potential as a therapeutic target.
Funding Statement
This work was supported by the 23456 Talent Project of Henan Provincial People’s Hospital to LQ, Research Startup fund of Henan Provincial People’s Hospital to YC, Henan Province Medical Science and Technology Co-construction Project to YC (LHGJ20220028), and the Young Scientists Fund of the National Natural Science Foundation of China to YC (No. 82402529).
Abbreviations
AUC, area under the curve; BP, biological processes; CC, cellular components; EAF2, ELL-Associated Factor 2; ECM, extracellular matrix; GEO, Gene Expression Omnibus; GO, Gene Ontology; GS, Gene significance; GSEA, gene set enrichment analysis; KEGG, Kyoto Encyclopedia of Genes and Genomes; MF, molecular function; MM, module membership; PD, Parkinson’s disease; PPI, protein-protein interaction; ROC, receiver operating characteristic; RT-qPCR, reverse transcription-quantitative polymerase chain reaction; SNCA, Synuclein Alpha; SVM-RFE, Support Vector Machine Recursive Feature Elimination; UPDRS, Unified Parkinson’s Disease Rating Scale; WGCNA, weighted gene co-expression network analysis.
Data Sharing Statement
Publicly available datasets were analyzed in this study. These data can be found here: https://www.ncbi.nlm.nih.gov/geo/, using accession numbers GSE7621, GSE20163, GSE26927, GSE20164, and GSE20292. The datasets used and analysed during the current study are available from the corresponding author on reasonable request.
Ethics Approval and Consent to Participate
Following the Helsinki Declaration, the human participants involved in this study were reviewed and approved by the Ethics Committee of Henan Provincial People’s Hospital (Ethics Approval Number: 2023087). The patients/participants provided their written informed consent to participate in this study.
Author Contributions
All authors made a significant contribution to the work reported, whether that is in the conception, study design, execution, acquisition of data, analysis and interpretation, or in all these areas; took part in drafting, revising or critically reviewing the article; gave final approval of the version to be published; have agreed on the journal to which the article has been submitted; and agree to be accountable for all aspects of the work.
Disclosure
The authors declare that the research was conducted in the absence of any commercial or financial relationships that could be construed as a potential conflict of interest.
References
- 1.Vázquez-Vélez G, Zoghbi H. Parkinson’s disease genetics and pathophysiology. Annual Review of Neuroscience. 2021;44:87–108. doi: 10.1146/annurev-neuro-100720-034518 [DOI] [PubMed] [Google Scholar]
- 2.Day J, Mullin S. The genetics of Parkinson’s disease and implications for clinical practice. Genes. 2021;12(7):1006. doi: 10.3390/genes12071006 [DOI] [PMC free article] [PubMed] [Google Scholar]
- 3.Lunati A, Lesage S, Brice A. The genetic landscape of Parkinson’s disease. Revue neurologique. 2018;174(9):628–643. doi: 10.1016/j.neurol.2018.08.004 [DOI] [PubMed] [Google Scholar]
- 4.Chen Z, Li G, Liu J. Autonomic dysfunction in Parkinson’s disease: implications for pathophysiology, diagnosis, and treatment. Neurobiology of Disease. 2020;134:104700. doi: 10.1016/j.nbd.2019.104700 [DOI] [PubMed] [Google Scholar]
- 5.Santos J, Pallarès I, Ventura S. Is a cure for Parkinson’s disease hiding inside us? Trends in Biochemical Sciences. 2022;47(8):641–644. doi: 10.1016/j.tibs.2022.02.001 [DOI] [PubMed] [Google Scholar]
- 6.Handelman G, Kok H, Chandra R, Razavi A, Lee M, Asadi H. eDoctor: machine learning and the future of medicine. Journal of Internal Medicine. 2018;284(6):603–619. doi: 10.1111/joim.12822 [DOI] [PubMed] [Google Scholar]
- 7.O’Connor LM, O’Connor BA, Zeng J, Lo CH. Data mining of microarray datasets in translational neuroscience. Brain Sciences. 2023;13(9):1318. doi: 10.3390/brainsci13091318 [DOI] [PMC free article] [PubMed] [Google Scholar]
- 8.Kouli A, Horne CB, Williams-Gray CH. Toll-like receptors and their therapeutic potential in Parkinson’s disease and α-synucleinopathies. Brain Behav Immun. 2019;81. doi: 10.1016/j.bbi.2019.06.042 [DOI] [PubMed] [Google Scholar]
- 9.Yajun L, Hongying B, Shuang G, et al. Interaction between SNCA gene polymorphisms and T2DM with Parkinson’s disease. Acta Neurol Scand. 2020;142(5):443–448. [DOI] [PubMed] [Google Scholar]
- 10.Ajith C, Divya KP, Asish V. Parkinson’s disease-genetic cause. Curr Opin Neurol. 2023;36(4):292–301. [DOI] [PubMed] [Google Scholar]
- 11.Aromolaran O, Aromolaran D, Isewon I, Oyelade J. Corrigendum to: machine learning approach to gene essentiality prediction: a review. Briefings in Bioinformatics. 2022;23(1). doi: 10.1093/bib/bbab419 [DOI] [PubMed] [Google Scholar]
- 12.Feng M, Wu C, Zhang H, et al. Overexpression of ELL-associated factor 2 suppresses invasion, migration, and angiogenesis in colorectal cancer. World Journal of Gastrointestinal Oncology. 2022;14(10):1949–1967. doi: 10.4251/wjgo.v14.i10.1949 [DOI] [PMC free article] [PubMed] [Google Scholar]
- 13.Feng M, Sun M, Xu B, Liu M, Zhang H, Wu C. Mechanism of ELL-associated factor 2 and vasohibin 1 regulating invasion, migration, and angiogenesis in colorectal cancer. World Journal of Gastroenterology. 2023;29(24):3770–3792. doi: 10.3748/wjg.v29.i24.3770 [DOI] [PMC free article] [PubMed] [Google Scholar]
- 14.Gene Ontology Consortium. Gene ontology consortium: going forward. J Nucleic Acids Res. 2014;43:D1049–D1056. [DOI] [PMC free article] [PubMed] [Google Scholar]
- 15.Kanehisa M, Furumichi M, Tanabe M, et al. KEGG: new perspectives on genomes, pathways, diseases and drugs. Nucleic Acids Res. 2016;45:D353–D361. doi: 10.1093/nar/gkw1092 [DOI] [PMC free article] [PubMed] [Google Scholar]
- 16.Szklarczyk D, Gable AL, Lyon D, et al. STRING v11: protein-protein association networks with increased coverage, supporting functional discovery in genome-wide experimental datasets. Nucleic Acids Res. 2018;47:D607–D613. [DOI] [PMC free article] [PubMed] [Google Scholar]
- 17.Doncheva NT, Morris JH, Holze H, et al. Cytoscape stringApp 2.0: analysis and visualization of heterogeneous biological networks. J Proteome Res. 2022;22(2):637–646. doi: 10.1021/acs.jproteome.2c00651 [DOI] [PMC free article] [PubMed] [Google Scholar]
- 18.Newman AM, Liu CL, Green MR, et al. Robust enumeration of cell subsets from tissue expression profiles. Nat Methods. 2015;12(5):453–457. doi: 10.1038/nmeth.3337 [DOI] [PMC free article] [PubMed] [Google Scholar]
- 19.Pascal L, Rigatti L, Ai J, et al. EAF2 loss induces prostatic intraepithelial neoplasia from luminal epithelial cells in mice. American Journal of Clinical and Experimental Urology. 2020;8(1):18–27. [PMC free article] [PubMed] [Google Scholar]
- 20.Pascal L, Ai J, Rigatti L, et al. EAF2 loss enhances angiogenic effects of Von Hippel-Lindau heterozygosity on the murine liver and prostate. Angiogenesis. 2011;14(3):331–343. doi: 10.1007/s10456-011-9217-1 [DOI] [PMC free article] [PubMed] [Google Scholar]
- 21.Zhu C, Xing L, Zhichao M, Zhou W, Wuhan X. EAF2 suppresses hypoxia-induced factor 1α transcriptional activity by disrupting its interaction with coactivator CBP/p300. Mol Cell Biol. 2014;34(6):1. [DOI] [PMC free article] [PubMed] [Google Scholar]
- 22.Elena VM, Maria OS, Evgeni P, Maria VV. Hypoxia-Inducible Factor (HIF) in ischemic stroke and neurodegenerative disease. Front Cell Dev Biol. 2021;9;703084. [DOI] [PMC free article] [PubMed] [Google Scholar]
- 23.Elena VM, Maria VV. The role of oxygen homeostasis and the HIF-1 factor in the development of neurodegeneration. Int J Mol Sci. 2024;25(9):4581. [DOI] [PMC free article] [PubMed] [Google Scholar]
- 24.Kaja N, Cecilie M. From synaptic physiology to synaptic pathology: the enigma of α-synuclein. Int J Mol Sci. 2024;25(2):986. [DOI] [PMC free article] [PubMed] [Google Scholar]
- 25.Meewhi K, Ilya B. Potential direct role of synuclein in dopamine transport and its implications for Parkinson’s disease pathogenesis. Biochem Biophys Res Commun. 2023;671:18–25. [DOI] [PubMed] [Google Scholar]
- 26.Hangzhen L, Fancai Z, Cancan H, et al. The potential role of glucose metabolism, lipid metabolism, and amino acid metabolism in the treatment of Parkinson’s disease. CNS Neurosci Ther. 2023;30(2):e14411. [DOI] [PMC free article] [PubMed] [Google Scholar]
- 27.Liuna Y, Kanming M, Honglin Y, Jialong C. Neuroinflammatory responses and Parkinson’ disease: pathogenic mechanisms and therapeutic targets. J Neuroimmune Pharmacol. 2020;15(4):830–837. [DOI] [PubMed] [Google Scholar]
- 28.Li H, Zeng F, Huang C, et al. The potential role of glucose metabolism, lipid metabolism, and amino acid metabolism in the treatment of Parkinson’s disease. CNS Neurosci Ther. 2023;30(2):e14411. [DOI] [PMC free article] [PubMed] [Google Scholar]
- 29.Cintia R, Liliana B, Ozgur O-C, et al. The immune system in Parkinson’s disease: what we know so far. Brain. 2024;147:3306–3324. [DOI] [PMC free article] [PubMed] [Google Scholar]
- 30.Jessica C, Annette M, Kirk DD, et al. Recent research trends in neuroinflammatory and neurodegenerative disorders. Cells. 2024;13(6):511. [DOI] [PMC free article] [PubMed] [Google Scholar]
- 31.Alexa D, Shikhar M, Kumar S, Shahid H. The role of the adaptive immune system and T cell dysfunction in neurodegenerative diseases. J Neuroinflammation. 2022;19(1):251. [DOI] [PMC free article] [PubMed] [Google Scholar]
- 32.Elena C, Luca M, Cristoforo C. T lymphocytes in Parkinson’s disease. Journal of Parkinson’s Disease. 2022;12:S65–S74. [DOI] [PMC free article] [PubMed] [Google Scholar]
- 33.Michael P, Grace H, Yi R. Immune regulatory functions of macrophages and microglia in central nervous system diseases. Int J Mol Sci. 2023;24(6):5925. [DOI] [PMC free article] [PubMed] [Google Scholar]
- 34.Yan J, Runze W, Li L, Lihua S, Yunjuan G, Cheng S. Exosomes from inflamed macrophages promote the progression of Parkinson’s disease by inducing neuroinflammation. Mol Neurobiol. 2023;60(4):1914–1928. [DOI] [PubMed] [Google Scholar]
- 35.Castellani F, Visentin A, Campagnolo M, et al. The Bruton tyrosine kinase inhibitor ibrutinib improves anti-MAG antibody polyneuropathy. Neurology. 2020;7(4). doi: 10.1212/NXI.0000000000000720 [DOI] [PMC free article] [PubMed] [Google Scholar]
Associated Data
This section collects any data citations, data availability statements, or supplementary materials included in this article.
Data Availability Statement
Publicly available datasets were analyzed in this study. These data can be found here: https://www.ncbi.nlm.nih.gov/geo/, using accession numbers GSE7621, GSE20163, GSE26927, GSE20164, and GSE20292. The datasets used and analysed during the current study are available from the corresponding author on reasonable request.


