

Summary
Stevia rebaudiana Bertoni is popular source of plant‐derived low/no‐calorie natural sweeteners (LNCSs), collectively known as steviol glycosides (SGs). Nevertheless, genetic predisposition for targeted biosynthesis of SGs is complex due to multi‐substrate functionality of key uridine diphosphate glycosyltransferases (UGTs). Here, we created a high‐quality monoploid assembly of 1.34 Gb with N50 value of 110 Mb, 55 551 predicted protein‐coding genes, and ~80% repetitive regions in Rebaudioside‐A (Reb‐A) enriched cultivar of S. rebaudiana. Additionally, a haplotype‐based chromosome assembly consisting of haplotype A and haplotype B with an overall genome size of 2.33Gb was resolved, harbouring 639 634 variants including single nucleotide polymorphisms (SNPs), indels and structural variants (SVs). Furthermore, a lineage‐specific whole genome duplication analysis revealed that gene families encoding UGTs and Cytochrome‐P450 (CYPs) were tandemly duplicated. Additionally, expression analysis revealed five tandemly duplicated gene copies of UGT76G1 having significant correlations with Reb‐A content, and identified key residue (leu200val) in the glycosylation of Reb‐A. Furthermore, missense variations identified in the acceptor region of UGT76G1 in haplotype resolve genome, transcriptional and molecular docking analysis were confirmed with resequencing of 10 diverse stevia genotypes (~25X). Gene regulatory network analysis identified key transcription factors (MYB, bHLH, bZIP and AP2‐ERF) as potential regulators of SG biosynthesis. Overall, this study provides haplotype‐resolved chromosome‐level genome assembly for genome editing and enhancing breeding efforts for targeted biosynthesis of SGs in S. rebaudiana.
Keywords: Cytochrome P450, haplotype chromosome, LNCS, phased genome, steviol glycosides, Stevia rebaudiana
Introduction
Recent research evidences support that the consumption of high‐calorie sugar‐rich diets can lead to several metabolic disorders, such as type 2 diabetes mellitus (T2DM) and obesity (Anjana et al., 2023; Johnson et al., 2013). To cater this, plant‐derived low/no‐calorie natural sweeteners (LNCSs) are gaining global attention due to their low glycaemic effects (Yang et al., 2019). Stevia rebaudiana Bertoni (2n = 22) accumulates ent‐kaurene diterpenoid glycosides collectively referred to as steviol glycosides (SGs), and have been commercially exploited as a potential source of plant‐derived natural LNCSs. It was traditionally used by the South American population, and has been approved globally by various food and safety regulatory authorities including the US‐FDA, and Food Safety and Standards Authority of India (FSSAI) as an alternative natural source to sucrose and synthetic sweeteners (Ceunen and Geuns, 2013). It have been cultivated commercially in Central America, China, Brazil, Paraguay, Korea, Thailand and India. It belongs to the tribe Eupatorieae of the Asteraceae family, and represents the only species within the genus that diverged to synthesize more than 60 ent‐kaurene diterpenoid SGs (Vallejo and Warner, 2021), including major [Stevioside (Stv), Rebaudioside‐A (Reb‐A)], and minor (Reb‐C, Reb‐E, Reb‐D and Reb‐M) (Lee et al., 2019). With 250–400 times sweeter than sucrose having a lesser bitter aftertaste and more stability than Stv, Reb‐A is among the commercially popular SGs with a current market share of US$ 50 million, and is estimated to expand up to US$ 400 million by 2030 (https://www.reportsanddata.com/report‐detail/stevia‐market).
The diterpenoid scaffold for SGs biosynthesis is synthesized using the metabolic flux of plastidial methylerythritol phosphate (MEP) pathway, which subsequently undergoes several oxidations, hydroxylations and glycosylations by specific cytochrome‐P450 monooxygenase (CYPs) and UDP‐glycosyltransferases (UGTs). The initial steps of SGs and gibberellic acid (GA) biosynthesis overlap to produce ent‐kaurenoic acid as the last common intermediate, which subsequently utilized by ent‐kaurene hydroxylase (CYP716; KA13H) to generate ent‐13‐hydroxy kaurenoic acid (steviol). Subsequent glycosylations of steviol by four UGTs (UGT74G1, UGT76G1, UGT85C2 and UGT91D2) lead to the formation of a diverse pool of SGs (Liu et al., 2020b; Singh et al., 2022; Zhang et al., 2021). Wherein, UGT74G1 catalyses steviol into stevioside (Stv), which subsequently glycosylated at C3′ by UGT76G1 to form Reb‐A, Reb‐D and Reb‐M (Zhang et al., 2019a). Earlier studies indicated that variations in Reb‐A content have been linked to mutations in UGT76G1 (Zhang et al., 2019a).
The current high‐quality haplotype‐resolved chromosome level genome assembly provides critical information on allelic variations with evolutionary insights and their meaningful biological impacts that will add significant value to the collapsed nature of the genome assembly in S. rebaudiana (Xu et al., 2021). Although the previous genome assembly has laid the foundations for genome‐scale exploration, the more accurate haplotype‐resolved version of genome assembly created here from the Reb‐A rich‐superior cultivar ‘Him Stevia’ of S. rebaudiana also exhibited with high Reb‐A/Stv ratio, biomass and better adaptability to diverse geographical locations (Kumar et al., 2019). This assembly offers additional advantages for enabling allele‐specific gene expression, which would significantly accelerate molecular dissection and genetic improvement of desirable traits in stevia. Furthermore, distribution, classification and functional impact of long terminal repeats (LTRs) on genome size expansion and gene expression provided substantial contribution to genome evolution, gene copy number variations and regulation of SG biosynthesis. Our analysis revealed that whole genome (WGD) and tandem (TD) duplication events promoted the synthesis of sweet diterpenoids in S. rebaudiana. The expanded gene families were mostly amplified by WGD, tandem, proximal, transposed and dispersed duplication events in stevia genome. Moreover, we observed that none of the ancestral chromosome was fully conserved, instead all its chromosomes evolved through several kinds of rearrangements during the course of evolution in S. rebaudiana. Owing to breed elite germplasm with targeted SGs (Reb‐A, Reb‐D and Reb‐M), comparative genomic analysis revealed the expansion of CYPs and UGT families governing the diversification of SGs. The constructed gene regulatory network (GRN) identified potential transcription factors regulating SG biosynthesis. Additionally, UGTs with higher substrate specificity were identified for enhancing the better accumulation of Reb‐A. Therefore, the current phased genome assembly will have greater implications to provide valuable insights for better understanding of the genetic regulation of targeted biosynthesis and genetic improvement of SGs biosynthesis in S. rebaudiana.
Results and discussion
Genome sequencing and assembly
A hybrid sequencing strategy involving Oxford Nanopore Technology (ONT) long‐read and Illumina short‐read sequencing together with high‐throughput chromatin conformation capture (Hi‐C) reads was used to construct a high‐quality haplotype‐resolved genome in S. rebaudiana. ONT sequencing yielded 18.4 million single‐molecule long reads with an average read length of 5.7 kb and genome coverage of 79.61X (Table S1), while Illumina sequencing resulted in 1052.3 million paired‐end reads with 118.5X genome coverage (Table S2). First, de novo hybrid assembly of 1.8 Gb was constructed using the ONT long‐reads and Illumina short‐reads, which consisted of 13 482 contigs with N50 of 841 Kb (Table S3). Subsequent mapping of Hi‐C reads revealed that out of 256 million reads, 232 million reads (90.04%) were mapped to the assembled contigs (Table S6). Hi‐C reads alignment, clustering and ordering the individual contigs and removing redundant sequences, we anchored them into 11 chromosome‐scale pseudomolecules. These pseudomolecules ranged from 145.2 Mb to 78.5 Mb (Table S5), collectively accounting for 96.3% of the entire genome assembly. This S. rebaudiana monoploid genome assembly version 1.0 (SR‐MAv1.0) resulted in N50 and GC content of 110.68 Mb and 36.84%, respectively (Table S4; Figure S2). The estimated genome size (1.35 Gb) is in close agreement with the flow cytometry inferences (1.33 Gb; Yadav et al., 2014), and genome survey analysis (~1.33 Gb; k‐mer: 117 bp) using Illumina short read data (Figure S1). Similar approaches were successfully utilized previously to construct non‐redundant contig genome level assembly in Camellia sinensis (Xia et al., 2020) and Rosa rugosa (Chen et al., 2021). Quality assessment of the SR‐MAv1.0 assembly through read representation analysis revealed that 98.3% of the short reads mapped back to the assembly (Table S6). Furthermore, BUSCO's completeness assessment revealed that out of 2326 core genes queried, 2206 genes were captured in our assembly indicating 94.8% of completeness (Table 1). Moreover, conserved eukaryotic genes (CEGs: 93.95%) and expressed sequence tags (EST: 95%) derived from public databases were successfully mapped with the current assembly (Table S4). Thus, the present assembly revealed better statistics in terms of N50 and BUSCO completeness than previous reports (Xu et al., 2021). Moreover, key attributes including genome assembly completeness and quality comply with earlier genome assembly of Helianthus annuus (Badouin et al., 2017), Artemisia annua (Shen et al., 2018) and Camellia sinensis (Xia et al., 2020). Additionally, we also evaluated the completeness of the repetitive regions through the estimation of the LTR assembly index (LAI), which showed an LAI index value of 18.11, similar to those previously reported in Erianthus fulvus (Kui et al., 2023). Since, LAI index above 12 is suggested as a threshold to meet the reference quality genomes (Ou et al., 2018), therefore, assembly attributes suggest a high‐quality genome assembly created in the present study.
Table 1.
Summary of genome assembly of S. rebaudiana
| SR‐MAv1.0 | |
|---|---|
| Assembly features | Length |
| Genome size assembled (bp) | 1 346 009 412 |
| Contigs | 7063 |
| Largest contig (bp) | 145 279 254 |
| GC (%) | 36.83 |
| N50 (Mb) | 110 204 488 |
| N90 (bp) | 78 629 150 |
| LAI score | 18.11 |
| Complete BUSCOs (C) | 2206 (94.8%) |
| Complete and single‐copy BUSCOs (S) | 1750 (75.2%) |
| Complete and duplicated BUSCOs (D) | 456 (19.6%) |
| Fragmented BUSCOs (F) | 23 (1%) |
| Missing BUSCOs (M) | 97 (4.2%) |
| Total BUSCO group searched | 2326 |
| SR‐HRv1.0 | ||
|---|---|---|
| Haplotype A | Haplotype B | |
| Contig assembly size (Gb) | 1.1 | 1.01 |
| Contig N50 (kb) | 841 kb | 616.85 Kb |
| N50 (Mb) | 124.65 | 110.32 |
| Total N50 (Mb) | 118.93 | |
| Total complete BUSCO ratio (%) | 2243 (96.1%) | |
Owing to its heterozygosity (1.2%) represented by Illumina short reads (Figure S1), and the limitations of collapsed genome assembly to identify allelic variants having the biological impact, the chromosome‐scale genome was resolved into a haplotype‐based allele‐aware assembly, S. rebaudiana haplotype resolved assembly version 1.0 (SR‐HRv1.0). Initially, the ONT long reads were assembled separately using CANU (Koren et al., 2017) followed by Pilon corrections (Walker et al., 2014). The CANU assembly resulted in 41 557 contigs with N50 of 133 Kb. The contig assembled genome size was 2.1 Gb indicating a 65% overestimated genome assembly with 87.5% BUSCO score, and predicted high heterozygous regions in genome assembly. Furthermore, the collapsed and phased contigs were distinguished, which yielded 219 Mb homozygous sequences. Then the phased contigs along with the augmented set of homozygous contigs were subjected to haplotype phasing, which generated a 2.3 Gb haplotype‐resolved genome assembly (SR‐HRv1.0) of 22 pseudo‐chromosomes consisting of haplotype A (11 Chr; N50:124.6 Mb) and haplotype B (11 Chr; N50:110.3 Mb) (Figure 1; Table 1). A similar strategy to resolve haplotypes using the integration of ONT long reads, Illumina short reads and Hi‐C chromatin data was adopted in previous studies in Zingiber officinale genome (Cheng et al., 2021). The syntenic analysis showed a remarkably consistent gene order in both haplotypes of each chromosome. To explore sequence divergence and evolutionary links between haplotype A and B, we rigorously aligned genome sequences within alignment blocks with no gaps or indels allowed, which resulted in 98.3% sequence similarity. The LTR content was also precisely similar in haplotype A (63.80%) and haplotype B (67.81%) (Table S15). Furthermore, reasonable collinearity was observed both in haplotype‐resolved SR‐HRv1.0 and SR‐MAv1.0 genome assembly, thereby validating its quality (Figure 1). The BUSCO quality assessment revealed 96.1% of the conserved BUSCO genes present in SR‐HRv1.0 genome assembly. Furthermore, 43 449 and 52 582 protein‐coding genes were identified in haplotype A and haplotype B, respectively. These attributes suggest that SR‐HRv1.0 genome assembly has resolved structural and functional allelic differences. A substantial haplotypic variants including SNPs (256 374) and indels (376 678), having genome‐wide distribution across 22 haplotype chromosomes were identified. Furthermore, 6582 structural variants (SVs; ≥ 50 bp) were identified between the two haplotypes with inversions affecting the larger genome size (242.28 Mb). These SVs were classified into inversions (341; 127–65 240 826 bp with a median of 30.4 kb), inverted translocation (1647;109–134 786 bp with median of 2 kb), translocation (1614; 201–97 623 bp with a median of 2.1 kb), inverted duplication (2312; 197–81 775 bp with a median of 1.8 kb) and duplications (668; 202–209 544 bp with a median of 1.1 kb) (Table S18). Previous reports indicated a significant impact of SVs on phenotypic trait expression (Alonge et al., 2020; Zhou et al., 2019), therefore, large haplotypic SVs identified in the chromosomal level phased genome may have potential implications in gene expression and function analysis in stevia.
Figure 1.
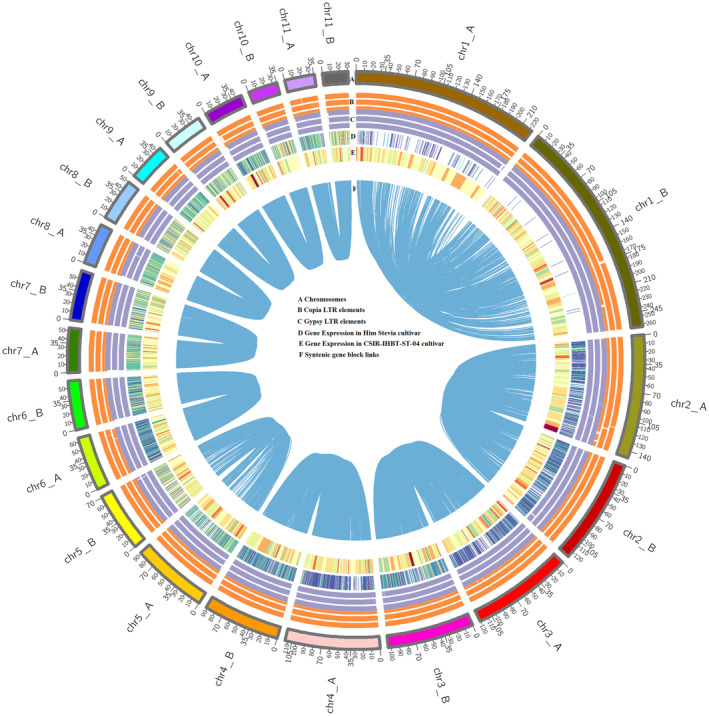
Genome characteristics representing the distribution of genomic features in the haplotype‐resolved genome of S. rebaudiana. From outside to inside; (A) Chromosome number, (B) Copia elements distribution, (C) Gypsy element distribution, (D–F) Gene expression and the links in the centre connect syntenic gene blocks.
Structural and functional annotations
In silco and homology‐based approaches predicted approximately 80% of the repetitive content in the S. rebaudiana genome. Wherein, LTR‐retrotransposons were the largest repetitive class accounting for 69.55% of the genome including Ty3‐Gypsy (39.18%), Ty1‐Copia (13.82%) and repetitive class of unknown category (16.54%). Other repetitive elements including transposon elements (1258), LINEs (3601), SINEs (699), L3/CR1 (1375) and simple sequence repeats (1 578 062) were present (Tables S8 and S9). Moreover, 8190 miRNA, 832 tRNA and 304 rRNA genes were also predicted (Table S7). Additionally, 55 551 protein‐coding genes were identified with an average gene length of 1025 bp using ab‐initio, homology‐based and RNA‐seq guided approaches. In total, 45 740 (82%) of the protein‐coding genes were assigned functions using NCBI‐NR, UNIPROT, TAIR, PlantTFDB and KEGG databases (Figure S3). Further, expression analysis of protein‐coding genes with trait‐specific RNA‐seq data indicated the accuracy of the gene prediction.
LTR‐RT insertion influences genome size expansion and gene expression
In flowering plants, bursts of repetitive sequences are principally responsible for genome expansion (Grover and Wendel, 2010). The representative genome of the Asteraceae family has more abundance of repetitive elements. The majority of the repetitive elements in the sunflower genome (59%) are comprised of LTRs (Badouin et al., 2017), likewise, lettuce also has 74.2% repetitive regions majorly composed of the Gypsy subfamilies (Reyes‐Chin‐Wo et al., 2017). In our study, we discovered ~80% of repetitive sequences in stevia genome, wherein, LTR transposons account for approximately 70%. Furthermore, we found a higher number of intact LTR‐RTs (23 388) than in the previous assembly (Xu et al., 2021), with intact Ty1‐copia (5380) and intact Ty3‐gypsy (14 181). Maximum likelihood (ML) based phylogeny construction using intact copia and gypsy elements resulted in 14 diverse lineages (Wicker et al., 2007) (Figure 2a,b). The gypsy elements were classified into Tekay (29.65%), Retand (10.77%), Athila (2.7%), CRM (1.4%) and Reina (0.4%) (Figure 2a; Table S10), while the copia elements were predominantly represented by SIRE (12.93%), Angela (9.62%), Ale (2.2%), Ivana (1.3%) and Bianca (1%) (Figure 2b; Table S10). Similar results were also reported, wherein, the Tat family was the major contributor to the genome expansion in Camellia sinensis (Zhang et al., 2020). Evaluation of the insertion time revealed that 89.79% of the intact LTR insertion events in the stevia genome occurred recently about <1 million years ago (MYA) (Figure 2a,b). These findings suggest that the recent insertion of LTR‐RT was the primary force behind stevia genome expansion. Interestingly, we found an abundance of the non‐autonomous LTR‐RT elements lacking entire Gag or Pol domains that are responsible for the transposition process. The 5772 non‐autonomous LTR transposons were further divided into three groups corresponding to the Ty3‐gypsy and Ty1‐copia subfamilies. Group I retained 2832 copies with at least one domain present, group II had 2203 copies with only the Gag domain and group III contained 737 non‐autonomous copies that lack both Gag and Pol domains (Figure 2d; Table S11). These observations suggest that the recent upsurge in non‐autonomous LTR‐RT through the utilization of transposing machinery of the autonomous retrotransposons might compromise their efficiency (Zhang and Gao, 2017).
Figure 2.
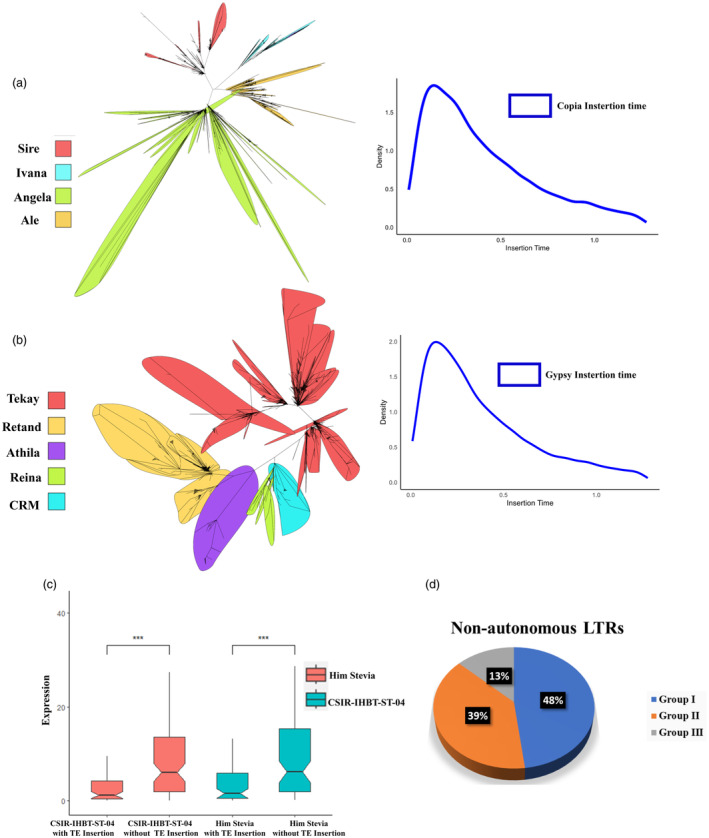
LTR elements classification, insertion and influence on expression divergence. (a) Lineage wise classification and insertion time of Copia elements, (b) Lineage wise classification and insertion time of Gypsy elements, (c) Box plot representing TE insertion affecting the expression of paralogous gene copies with (P < 0.05; paired t‐test), (d) Non‐autonomous LTR elements abundance in S. rebaudiana genome.
Based on our findings, repetitive sequence proliferation is not only responsible for the plant genome size expansion but also for the functional diversification of duplicated paralogous genes in plants (Bennetzen, 2005). We observed that 6.3% of intact LTR‐RTs were identified within the gene bodies, and significantly extended their average intron length compared to Oryzae sativa, Arabidopsis thaliana and Zea mays (Goff et al., 2002; Kaul et al., 2000). To examine the functional impact of these transposable element insertions, evaluating duplicated gene pairs across the stevia genome observed 105 pairs affected by LTR insertions with one copy having insertion, and another copy without insertion. The expression pattern of these duplicated gene pairs was evaluated using RNA‐seq data of two contrasting stevia genotypes, which revealed significant differences in expression between the gene copies with LTR insertion and without LTR insertion (FDR‐adjusted P‐value cutoff ≥0.05; Figure 2c). These results suggest that repeat elements have the potential to affect gene expression. Furthermore, we screened 2 Kb upstream region for each gene for the presence of LTR insertion and found that ~11% of the protein‐coding genes acquired LTR‐RTs within this cis‐region. Based on the expression values of the genes, we used the 20% upper (high expression) and lower (low expression) genes as the two contrasting gene sets. Screening of these data sets for gene duplication revealed 53 gene pairs in the higher expression dataset and 9 gene pairs in the lower expression dataset having LTR insertion in one gene copy of the pair. Further, examining the influence of the LTR insertion on expression showed higher TPM values in the gene copies with LTR insertion, and lower TPM values in gene copies without LTR insertion suggesting that LTR insertion within the cis region might generate novel or modify the existing transcription factor binding sites. Functional annotation of these genes showed their involvement in abiotic stress. Previous studies supported that natural selection favoured the existence of short‐length introns in genes with high expression to reduce transcription costs (Castillo‐Davis et al., 2002), also gene expression was greatly affected because of higher DNA methylation rate in nearby TE‐inserted genes (Hollister and Gaut, 2009).
Stevia genome evolution
We investigated the evolution of the genome by characterizing unique and shared gene families. The 55 551 protein‐coding genes were assigned to 36 549 gene families in S. rebaudiana. Of these, 16 080 gene families were shared among the Asteraceae species, while 1928 gene families were unique to the S. rebaudiana. Gene family expansion and contraction analysis revealed expanded (4952) and contracted (4179) gene families in S. rebaudiana (Figure 3a). GO functional enrichment of these gene families recorded significant abundance in GO functional categories associated with terpenoid biosynthesis (GO:0016114, FDR: 0.02), UDP‐glycosyltransferase activity (GO:0008194, FDR: 0.0003), carbohydrate metabolism (GO:0005975, FDR:0.045), photosynthesis and chlorophyll metabolism (GO:0015979, FDR: 0.000; GO:001599, FDR: 0.0001) and biotic and abiotic stress, particularly in disease resistance (GO:0006952, FDR: 0.0007) (Table S12). Gene duplications were known as major driving forces in plant evolution that resulted in novel genes with potential sub‐functionalization and neo‐functionalization. The lineage‐specific WGD event produced 47 698 duplicated genes with abundance of dispersed (40 224), WGD (4931), transposed (4980), proximal (4667) and tandem (1836) duplications in S. rebaudiana. Further, GO enrichment analysis of duplicate genes within the expanded gene families resulted in abundance of terpenoid metabolism pathways by tandem duplication events. Whereas, the expansions of carbohydrate metabolism, growth and development and response towards stress‐related (abiotic & biotic) gene families mainly by proximal, transposed, dispersed and WGD events in S. rebaudiana. Among these terpenoid metabolism pathways serve as the major backbone of SGs metabolism. Thus, to gain deeper understanding of the contribution of duplicated genes in SGs biosynthesis, we identified the copy number of the Terpene synthase (TPS) gene family. Overall, we identified 118 TPS genes, greater than the previously reported in the S. rebaudiana genome. Therefore, duplication events (tandem, WGD, transposed and dispersed duplicates) might have significant impacts on the increase of TPS gene copy numbers that serve as the backbone for the biosynthesis of SGs.
Figure 3.
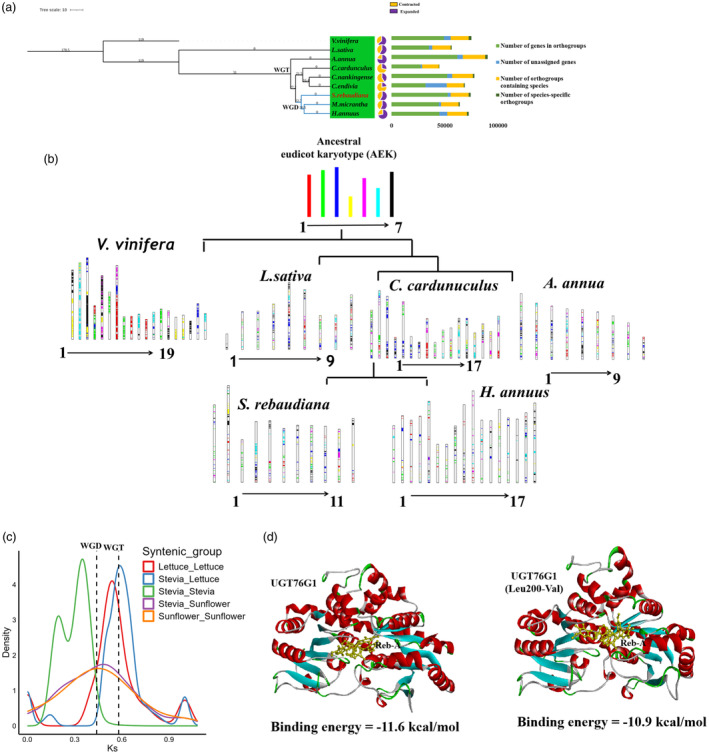
Stevia genome evolution. (a) Phylogeny of S. rebaudiana representing, duplication events and gene families that underwent expansion and contraction, (b) Evolution of chromosomes in S. rebaudiana, (c) 4Dtv plot showing substitution rate and duplication events, (d) Molecular docking analysis of UGT76G1 with Reb‐A.
To construct phylogeny, 128 single‐copy gene families among the 8 Asteraceae species were used, keeping Vitis vinifera as an outgroup. We observed a close phylogenetic relationship of S. rebaudiana with Mikania micrantha and Helianthus annuus. The estimated divergence time of S. rebaudiana from M. micrantha and H. annuus was found to be around 22.7 MYA, whereas, S. rebaudiana and Cynara cardunculus diverged from their most common ancestor around 27.2 MYA. The divergence of S. rebaudiana and Lactuca sativa was 31 MYA (Figure 3a). The WGD events have an important role in shaping plant evolution. We evaluated the fourfold degenerate site transversion (4dTv) between the paralogus gene pairs of S. rebaudiana (Figure 3c). Our analysis revealed two consecutive evolutionary events during the course of S. rebaudiana genome evolution. A whole genome triplication (WGT) event shared with the Asteraceae family was observed, corroborated with the earlier reported genome. Moreover, a lineage‐specific WGD event shared with H. annuus was identified at around 0.35–0.40 4dTv distance (~29 MYA) (Figure 3c). Thus, this analysis showed that stevia experienced WGT event and one WGD event shared with H. annuus and M. micrantha.
Chromosome rearrangements in S. rebaudiana were also investigated using ancestral eudicot karyotype (AEK) genes approach with seven proto chromosomes (Murat et al., 2017). We identified orthologous genes between the S. rebaudiana and grape, coffee and sunflower, as well as paralogous genes within the genome of S. rebaudiana, coffee and sunflower. Based on the AEK genome, we identified paralogous genes in V. vinifera (8784; 25.9%), A. annua (8015; 34.3%), L. sativa (7399; 31.6%), C. cardunculus (9236; 39.5%), H. annuus (4130; 17.6%) and S. rebaudiana (6856; 29.3%). A total of 126 chromosomal fusions and 11 chromosomal fissions occurred to generate the 11 modern chromosomes during S. rebaudiana genome evolution. The Chr2, Chr4, Chr5 Chr6, Chr8 and Chr10 chromosomes of S. rebaudiana showed a higher proportion of ancestral chromosomes, hence considered as less evolved; whereas Chr7 and Chr9 showed a lesser proportion of ancestral chromosomes, therefore represent the more advanced chromosomes of S. rebaudiana (Figure 3b).
Characterization of gene families involved in SG biosynthesis pathway
SGs have been biosynthesized from the tetracyclic diterpene steviol backbone, whereas, the precursors of steviol are synthesized from the MEP pathway consisting of a series of enzymes. RNA‐seq analysis identified the expression of the MEP pathway genes in the leaf tissues. Overall, 26 genes encoding 7 enzymes in the MEP pathway were identified, including 3 gene copies each encoding isopentenyl diphosphate isomerase (IDI), farnesyl diphosphate synthase (FPPS) and 1‐Deoxy‐D‐xylulose 5‐phosphate reductoisomerase (DXR), 9 genes copies encoding geranylgeranyl pyrophosphate synthase (GGPPS), 1 gene 4‐hydroxy‐3‐methylbut‐2‐enyl diphosphate (HDS), 4 gene copies of 4‐hydroxy‐3‐methylbut‐2‐enyl diphosphate reductase (HDR), single gene of ent‐kaurene oxidase (KO) and 2 gene copies of ent‐kaurenoic acid oxidase (KAO). Among the important metabolites, ent‐kauronic acid has played a pivotal role in SG biosynthesis. CYP P450 catalyses the ent‐kauronic acid to generate the first generation of SGs (steviol), followed by glycosylations of steviol backbone by different UGTs leads to the formation of a variety of SGs including Stv and rebaudiosides. Therefore, characterization of CYP P450 and UGTs is important to get insights of SGs biosynthesis in S. rebaudiana (Figure 4a). Owing to the lack of precise knowledge, classification of these gene families into different phylogenetic clades identified key candidates involved in the SGs biosynthesis. The genome‐wide identification revealed 278 putative CYP P450 gene copies (Figure 4d; Table S13). Further, classification identified 31 families segregating into five major clans (CYP72, CYP85, CYP97, CYP86 and CYP71) suggesting a high diversity in CYP P450 genes. Among these, CYP716 (OG0001040: 27 gene copies), CYP71 (OG0000122: 145 gene copies) and CYP89 (OG0006829: 45 gene copies) were the largest gene families in S. rebaudiana. The gene family copy numbers were tandemly duplicated and expanded, wherein, CYP716 consisted of 8 tandemly duplicated gene copies covering approximately 20Kb of genomic region (Figure 4c) is an important enzyme significantly involved in SG diversification (Singh et al., 2017). Interestingly, five gene copies of CYP716 exhibited with differential expression in contrasting stevia genotypes (Figure 4a). UGT‐mediated glycosylations resulted in the diversification of SGs biosynthesis, therefore, identification of the substrate‐specific core UGTs would have significant implications. Our analysis revealed abundance of 436 putative gene copies of the UGT gene family (higher than the previous genome) suggesting a greater expansion including UGT85C2 (29), UGT74G1 (20) and UGT76G1 (35) in the ‘Him Stevia’ genome (Figure 4e; Table S14). Among these, UGT76G1 catalyses the glycosylations of Stv into rebaudioside (Reb‐A, Reb‐D and Reb‐M) (Xue et al., 2018). The tandem gene duplication has been significantly linked to the biosynthesis of key metabolites (Xu et al., 2020b), nevertheless, hindered due to the non‐availability of accurate genome assembly and expression quantification. Therefore, expression analysis of tandemly clustered 5 UGT76G1 gene copies on chromosome 8 covering ~9.4 kb of genomic region (Figure 4c) exhibited higher expression in ‘Him Stevia’ (high Reb‐A content) compared to ‘CSIR‐IHBT‐ST‐04’ (low Reb‐A content) suggests fundamental and translational implications in SGs biosynthesis (Figure 4a). Further, expression analysis revealed a positive correlation (r 2 = 0.87, P‐value = ≤ 0.001) of Reb‐A content, wherein, a weak/ negative correlation with the Stv content (r 2 = −0.20, P‐value = ≤ 0.001) (Figure 4b). Based on the significantly higher correlation between UGT76G1 copy number and Reb‐A content, these UGT76G1 gene copies might be an optimal genetic marker having implications in selective breeding in stevia.
Figure 4.
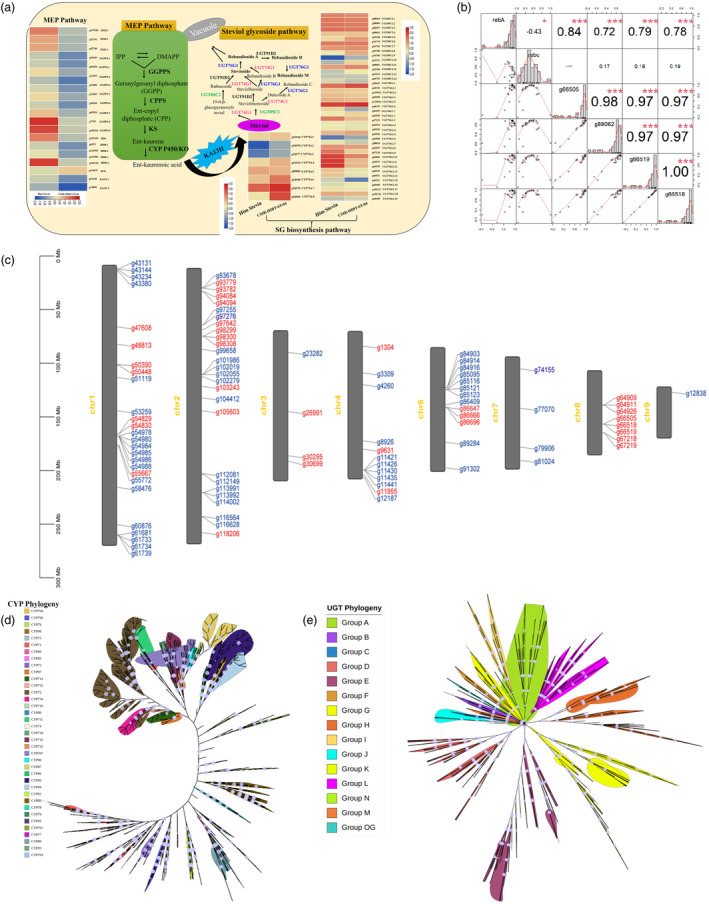
Steviol glycoside pathway and characterization of CYPs and UGTs. (a) Steviol glycoside biosynthesis pathway representing MEP backbone diverging into SG pathway and heatmap illustrating expression pattern of key genes in SGs pathway detected in RNA‐seq data, (b) Significant correlations of gene expression pattern with Reb‐A content, (c) Chromosomal assignment of CYPs and UGTs (Blue label represents CYPs and Red label represents UGTs), (d) Phylogenetic tree of Cytochrome P450 (CYP) gene family, (e) Phylogenetic tree of the Uridine diphosphate glycosyl transferase (UGTs) gene family in S. rebaudiana.
Identification of potential transcription factors involved in SGs biosynthesis
The regulation of secondary metabolite biosynthesis depends on the crosstalk between DNA‐linked mechanisms and transcription factors (TFs) (Liu et al., 1999). Therefore, gene regulatory network (GRN) was successfully constructed using genome‐wide abundance of 2089 TFs belonging to 58 families, and 457 multi‐copy SG biosynthesis pathway‐related genes. The constructed GRN predicted 2187 valid interactions with abundance of MYB (5.21%), WRKY (4.98%), MYB‐related (4.80%), C2C2‐Dof (4.80%), C2H2 (4.80%), C3H (4.75%), HB‐HD‐ZIP (4.75%), NF‐YB (4.61%), Trihelix (4.29%), AP2/ERF (4.29%), HSF (4.25%), bZIP (4.06%), bHLH (3.93%), C2C2‐GATA (3.65%), C2C2‐CO‐like (3.10%), Tify (2.92%), B3‐ARF (2.78%), S1Fa‐like (2.78%), B3 (2.60%) and NF‐YA (2.60%). The number of interactions for each TF ranged from 15 to 114, with a median degree of 61. In total, 26 TFs were identified as hub genes in the GRN (Table S24; Figure 6). We identified five gene copies of CYP716, a key enzyme of SGs diversification, that had valid interactions with 14 TFs including B3, AP2/ERF, B3‐ARF, bHLH, bZIP, C2C2‐CO‐like, C2C2‐Dof, C2C2‐GATA, C2H2, C3H, DBB, HB‐HD‐ZIP, HSF, MYB, MYB‐related, NF‐YA, NF‐YB, S1Fa‐like, Tify and Trihelix. Further analysis of the promoter sequences of CYP716 gene copies identified binding sites for three gene copies (g54980, g54978 and g54984) with specific recognition sequences for the MYB (MYB‐recognition sequence, MYC), bHLH (G‐box) and WRKY (W‐box) TFs. Similarly, 14 gene copies of UGT85C2 exhibited significant interactions with TFs including AP2/ERF, B3, bHLH, bZIP, C2C2‐CO‐like, C2C2‐Dof, C2C2‐GATA, C2H2, C3H, DBB, GRAS, HB‐HD‐ZIP, HSF, LIM, LOB, MYB, MYB‐related, NF‐YA, NF‐YB, S1Fa‐like, Tify, Trihelix and WRKY. Of these, eight gene copies (g49532, g49535, g61244, g83181, g88057, g93783, g93784 and g93795) harboured transcription factor binding sites in their promoter regions, notably for MYB, WRKY and bHLH. Likewise, three gene copies of UGT74G1 significantly interacted with AP2/ERF, B3‐ARF, bHLH, bZIP, C2C2‐CO‐like, C2C2‐Dof, C2C2‐GATA, C2H2, C3H, DBB, HB‐HD‐ZIP, HSF, MYB, MYB‐related, NF‐YA, NF‐YB and S1Fa‐like. Wherein, two UGT74G1 gene copies (g82558 and g44153) had binding sites for MYB and bZIP. Also, 14 gene copies of UGT76G1 exhibited significant interactions with AP2/ERF, B3, bHLH, C2C2‐CO‐like, C2C2‐Dof, C2C2‐GATA, C2H2, C3H, HB‐HD‐ZIP, HSF, MYB, MYB‐related, WRKY, S1Fa‐like, Trihelix, NF‐YB, B3‐ARF, bZIP, GRAS, Tify, DBB, LIM, NF‐YA, OFP and TUB TFs. Interestingly, seven gene copies of UGT76G1 (g67218, g66505, g66507, g66518, g66519, g67219 and g61244) having binding sites for MYB (MYB, MBS and MRE), WRKY (W‐box), bZIP (AS‐1) and bHLH (G‐box) TFs. Additionally, three UGTs (UGT91D1, UGT73E1 and UGT88B1) were also found to be interacting with major transcription factors that might have implications in SG biosynthesis (Figure 6; Figure S9). Considering the important role of WRKY in SGs regulation (Wang et al., 2021), GRNs predicted here have a greater role in the regulation of the biosynthesis of SGs.
Figure 6.
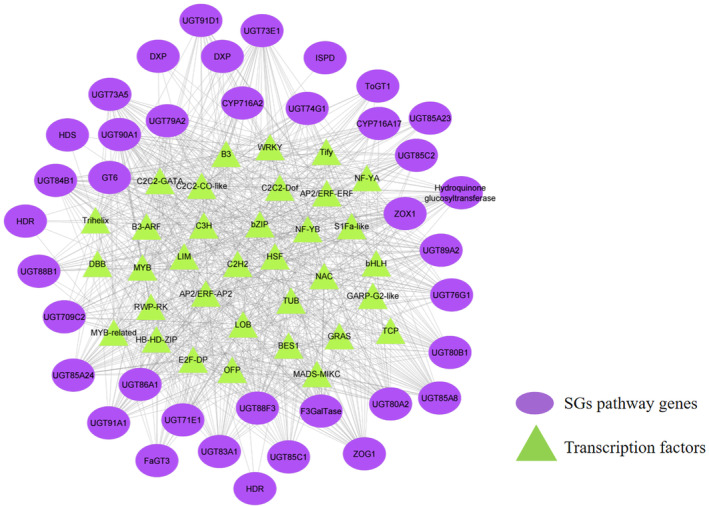
Gene regulatory network representing potential transcription factors regulating SG biosynthesis pathway genes.
qRT‐PCR validations
To complement genome level inferences, the relative expression of 15 key pathway genes (MEP backbone, SGs pathway and TFs) were analysed in the 10 diverse random genotypes with contrasting levels of SGs (high Reb‐A content: 5 nos; low Reb‐A; 5 Nos; Table S21). Key MEP backbone genes including DXR, GGPPS and KO displayed significantly higher expression in cultivars with high Reb‐A compared to those with low Reb‐A content (Figure S7a). Likewise, four copies of the UGT76G1 gene UGT76G1.13 (g66507), UGT76G1.15 (g66505), UGT76G1.17 (g66518), UGT76G1.18 (g66515) and UGT85C2 (g88064) exhibited notably higher expression in the cultivars having ability to accumulate high Reb‐A (Figure S7b). Similarly, key transcription factors (MYB102, MYB73 and BHLH) were also found to be highly expressed in cultivars with high Reb‐A content (Figure S7c). The qRT validation approaches were successfully applied in previous studies in S. rebaudiana (Chen et al., 2014; Pal et al., 2023) and secondary metabolites enriched Angelica glauca (Devi et al., 2022).
Genetic variations influencing the biosynthesis of SGs
The genetic variations can impact the expression of nearby or overlapping genes through multiple mechanisms including modification of the gene's sequence, and copy number, as well as altering the composition or positioning of cis‐regulatory sequences. The UGT76G1 utilizes Stv as substrate for glycosylation to form Reb‐A, and then performs a series of glycosylations on Reb‐A to form other rebaudiosides (Reb‐D, Reb‐M). Previous reports also suggested that UGTs are not specific to a substrate, but rather regioselective or regiospecific, allowing a single UGT to perform glycosylations to generate multiple glycosides (Hansen et al., 2003; Osmani et al., 2009; Liu et al., 2020a). Thus, investigation of the ability of UGT76G1 to carry‐out multiple glycosylations is the major concern to improve SG biosynthesis. In this study, we evaluated the possible structural variations associated with SG biosynthesis pathway genes using transcriptome data of 13 cultivars with inherent ability of varying SGs accumulation. Overall, 11 727 genomic variations were ascertained in 457 gene copies including 210 gene copies related to the SG biosynthesis pathway. Furthermore, 363 missense variants were identified in 40 gene copies corresponding to MEP backbone, CYPs and UGTs having functional impact. Further, expression analysis revealed 37 differentially expressed UGTs gene copies, with 22 harbouring 193 missense variations, possibly impacting glycosylation reactions in SG biosynthesis. Subsequently, 4 missense variations (Phe46Leu, Ala86Ser, Leu200Val and Asn385Thr) were identified within the sequence encoding acceptor region of UGT76G1. The protein homology modelling combined with molecular docking is an effective approach to unveil the catalytic mechanisms and identify key amino residues (Xue et al., 2018). Evaluating the effect of these missense variations on the binding energy of Stv and Reb‐A as substrates with UGT76G1 revealed their influence on SGs biosynthesis. For instance, the UGT76G1 variant with Leu at position 200 in the acceptor site resulted in a lower binding energy (−11.6 kcal/mol) compared to Val200 (−10.9 kcal/mol) when Reb‐A was the ligand (Figure 3d). Conversely, with Stv as the ligand, the binding energy for Leu200 was (−8.6 kcal/mol) and for Val200 (−9.9 kcal/mol). Additionally, the Phe46Leu variant of UGT76G1 exhibited a lower binding energy of −10.4 kcal/mol with Stv as the ligand, compared to −9.9 kcal/mol with Reb‐A. This pattern was also observed for the Ala86Ser and Asn385Thr variants of UGT76G1, which showed lower binding energy for Stv compared to Reb‐A (Table S26). Since low and negative binding energy favours higher binding affinity between the protein‐ligand complex and a stable conformation (Pantsar and Poso, 2018), the Leu200Val variant of UGT76G1 may be more favourable for the conversion of Reb‐A into Reb‐D/M. Similarly, genomic variations that favour Stv binding (Phe46Leu, Ala86Ser and Asn385Thr) may facilitate a relatively higher conversion of Stv into Reb‐A. Thus, the key mutations identified in this study enabled us to better understand the glycosylation mechanism of UGT76G1.
Additionally, we generated resequencing data for 10 diverse stevia genotypes (~ 25X coverage) with variable levels of Reb‐A. This yielded 332.6 Gb of high‐quality sequencing data with a 96.85% average mapping rate to the ‘Him Stevia’ genome (Table S22). Subsequently, this resequencing data was used for identifying genome‐wide high‐quality variants. This resulted in the identification of 1 346 294 SNPs and 115 220 InDels (44 689 insertions; 70 531 deletions) with SNPs having high (14 476), low (80 999) and moderate (92 197) impact on predicted gene functions (Table S23; Figure S8a,b). Furthermore, evaluating the impact on the protein sequence resulted in missense (90 351), nonsense (3832) and silent (77 143) mutations (Figure S8c). Missense variations (Phe46leu, Ala86Ser, leu200Val and Asn385Thr) identified in the acceptor region of UGT76G1 gene copies through haplotype resolved genome, transcriptional and molecular docking analysis are well complemented by resequencing data. Together, these observations shed light on the multi‐substrate complexity of UGT76G1, which will assist upscaling the biosynthesis of desirable glycosides and genetic improvement of SGs.
Additionally, evaluation of allele‐specific expression of 21 477 allelic genes (haplotypes A and B) identified 1418 allelic gene pairs exhibited with differential expression (FC threshold: ≥ 2; P‐adjusted cutoff: 0.05) (Figure 5a–c; Figure S4; Table S16). Functional enrichment revealed response to ethylene (GO:0009723), chlorophyll metabolic process (GO:0015994), porphyrin‐containing compound biosynthesis (GO:0006779), response to absence of light (GO:0009646), terpenoid metabolic process (GO:0006721), glucan metabolic process (GO:0044042), starch metabolic process (GO:0005982), translation (GO:0006412), peptide metabolic process (GO:0006518), nitrogen compound metabolic process (GO:0006807), developmental process (GO:0032502) and protein metabolic process (GO:0019538) were significantly enriched at an FDR cutoff value of 0.05 (Table S20). Moreover, 117 genes with allele‐biased expression were recorded with differences in TE insertion in their upstream flanking regions (2 kb) (Table S19). A deeper investigation of allele‐specific expression analysis revealed an important chlorophyll metabolism gene (LHCB3) having a unique TF binding site in the cis region. Likewise, the insertion of LTR transposons (copia type) into the cis region has an impact on expression in haplotype A possibly responsible for biased expression in haplotype B (Figure S6). Therefore, results suggest that different factors including the variations in TF binding sites, and TE insertions and sequence mutations might be involved in the biased expression of at least these genes. TEs may disturb gene expression and promote sub‐functionalization (Biémont and Vieira, 2006). TEs in close vicinity of genes are less likely to be removed when purifying selection is relaxed. These silent TEs may get activated under certain environmental cues to affect gene expression (Hirsch and Springer, 2017). Among the allelic pairs exhibited with differential expression in haplotypes A and B, six genes corresponded to UGT85C1 (5 gene copies) and UGT76G1 (single gene) suggesting haplotype‐controlled SG biosynthesis in ‘Him Stevia’. Structural analysis of UGT85C1 revealed a large deletion segment in haplotype B (Figure S5), which might be responsible for biases expression between haplotypes A and B. Similarly, multiple deletions UGT76G1 in haplotype B resulted in expression biases in both the haplotypes (Table S16). Further, genotypic level differential expression analysis of six UGT genes between ‘Him Stevia’ and ‘CSIR‐IHBT‐ST‐04’ revealed significantly upregulated expression of UGT76G1 (FC: 4) with haplotype A allele in ‘Him Stevia’. These results suggest that the haplotype A biased allele of UGT76G1 possibly controls the higher accumulation of Reb‐A in ‘Him Stevia’ (Table S16).
Figure 5.
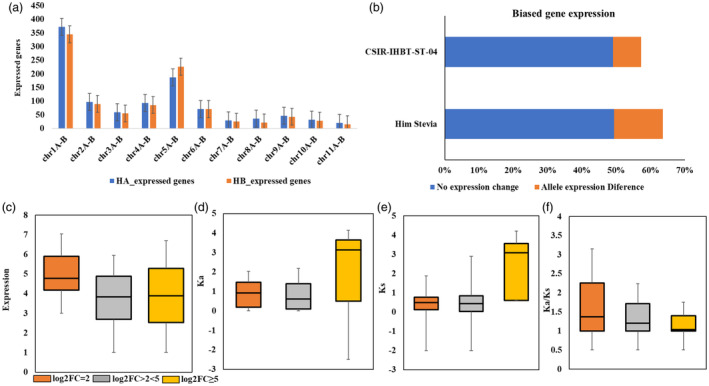
Allelic specific differential gene expression among haplotype chromosomes. (a) Numbers of highly expressed genes on haplotype chromosomes in two genotypes, Graphs display the average numbers of highly expressed genes (± s.d), (b) Proportions of alleles in each category of allelic expression, (c) Absolute TPM expression abundance for the allele expression differences, (d–f) Ka, Ks and Ka/Ks ratios for the genes with allele‐biased expression differences.
In summary, our study provides critical information that enriches limited genetic resources, and will contribute significantly to explicit complexity of SG pathways in stevia, a remarkable source of plant‐derived LNCSs, worldwide. The evolutionary analysis and gene family characterization including expansion and tandem duplication of CYPs and UGTs can assist higher accumulations of SGs, to meet growing industrial demand. Additionally, haplotype resolved genome assembly will provide valuable insights and comprehensive evaluation of allele‐specific gene expression for dissecting desirable traits for breeding superior stevia genotypes. This high‐quality reference genome could offer unprecedented genomic resources for fundamental and translational research in S. rebaudiana.
Experimental procedures
Plant material
Fresh leaves of Reb‐A rich superior cultivar ‘Him Stevia’ (CSIR‐IHBT‐ST‐01; National ID: IC0613966; Registration No. INGR15018, Registering Agency: Plant Germplasm Registration Committee (PGRC), Indian Council of Agricultural Research (ICAR), Govt. of India) of S. rebaudiana developed by CSIR‐Institute of Himalayan Bioresource Technology (CSIR IHBT), Palampur (Himachal Pradesh), India (20.5937°N, 78.9629°E) were selected for whole genome sequencing (Kumar et al., 2019). Furthermore, 10 diverse cultivars exhibited contrasting accumulation of Reb‐A existing at CSIR IHBT were selected for resequencing. The high molecular weight genomic DNA was extracted using the CTAB method (Cota‐Sánchez et al., 2006), and the quality and quantity of genomic DNA was ascertained using QubitTM.
Sequencing and assembly
The long‐read genomic library for Oxford Nanopore Technology (ONT) sequencing was prepared using the ONT 1D ligation sequencing kit (SQK‐LSK109) following three steps with subsequent DNA quantification at the end of each step. Overall, 2.0 μg of high‐quality genomic DNA was used for library preparation using NEBNext FFPE Repair Mix (NEB cat no. M6630) and NEBNext Ultra II End‐Repair/dA‐tailing Module (NEB cat no. E7546). The subsequent adaptor ligation of purified DNA was carried out using adapter mix 1D in an SQK‐LSK109 kit following NEBNext Quick Ligation Module Protocol (E6056). The AMPure XP beads were successively used for clean‐up during ONT library preparation. The library prepared was further sequenced on PromethION flow cell (FLO‐PRO001) followed by fusing protein pore R9.4 1D chemistry for 48 h as directed by the manufacturer. The base calling of FAST5 files was performed using ONT MinKNOW software (ver. 1.18.1) with default parameters. Then the Fastq files generated by the base‐calling process were further combined into a single file and trimmed using Porechop (ver. 0.2.3). The Illumina paired‐end short‐read libraries were used for genome sequencing of ‘Him Stevia’ and resequencing of 10 diverse cultivars using the Illumina novaseq 6000 platforms with an insert size of 300 bp. Additionally, 256 million high throughput chromosome conformation capture (Hi‐C) reads of S. rebaudiana (Xu et al., 2021) were used for pseudomolecule construction. Total RNA was extracted from leaf samples for transcriptome sequencing of ‘Him Stevia’ and diverse random stevia cultivars using the iRIS protocol (Ghawana et al., 2011). RNA quantification and RNA IQ (integrity and quality) were analysed using the QubitTM RNA IQ Assay protocol (Life Technologies, Thermo Fisher Scientific Inc). Four micrograms of total RNA of leaf tissues was utilized to prepare sequencing libraries using the TruSeq Stranded mRNA library preparation kit (Illumina, San Diego, CA). Standard library size distribution and concentration were assessed using Bio‐analyser Chip DNA 1000 Series II (Agilent Technologies USA). The prepared libraries were sequenced over the Illumina NovaSeq 6000 sequencing platform (Illumina, San Diego, CA) to obtain 200 bp paired‐end reads.
The genome size of S. rebaudiana was previously estimated using the flow cytometry technique (Yadav et al., 2014). The Genome Scope software was used for genome size and heterozygosity estimation using a K‐mer‐based approach. The ‘Him Stevia’ cultivar genome assembly was constructed using two approaches; firstly, a hybrid approach was used to create a monoploid assembly (SR‐MAv1.0) combining Nanopore long‐reads and Illumina short‐reads using MaSuRCA 4.0.9 (Zimin et al., 2013). Subsequently, the contig‐level assembly was subjected to HiC read alignment using the Burrows‐Wheeler Aligner (BWA) tool (Jo and Koh, 2015) followed by the construction of 11 pseudochromosomes using AllHiC software (Zhang et al., 2019b). Furthermore, the redundant sequences were filtered using Redudans (Pryszcz and Gabaldón, 2016) and Purge haplotig (Roach et al., 2018) software and gap‐filling of chromosome‐level monoploid assembly (SR‐MAv1.0) was done utilizing TGSgapcloser software (Xu et al., 2020a).
Wherein, to generate a haplotype‐resolved assembly, initially Canu v2.2 (Koren et al., 2017) was used for the assemble ONT sequenced long‐reads, followed by long read assembly refinement using Illumina short‐reads for the creation of contig level assembly using Pilon ver.1.24 (Walker et al., 2014). Subsequently, the contig level assembly produced was subjected to the discovery of primary and secondary contigs using a read depth‐based Purge haplotig (Roach et al., 2018) technique and a k‐mer‐based (KHPER) strategy. Altogether, the primary and secondary contigs were subjected to haplotype phasing by employing Hi‐C reads as successfully utilized in previous reports (Wang et al., 2021). First, the BWA (Jo and Koh, 2015) was used to align the Hi‐C reads to contig level assembly, further the uniquely mapped paired reads were subjected to haplotype phasing using the AllHic pipeline (Wang and Zhang, 2022; Zhang et al., 2019a) and produced haplotype‐resolved assembly (SR‐HRv1.0) with SR‐MAv1.0 serving as a reference to make allele contig table. The chromosome localization and collinearity were evaluated using MCScanX (Wang et al., 2012) and visualized using Cilico software. Three assessment methods were used to evaluate the quality of the ‘Him Stevia’ whole genome assembly, including BUSCO alignment, CEGMA and LAI score.
Genome annotation
Repeat annotations were performed using two approaches including de novo and homology‐based method. Firstly, the de novo repeat library of the ‘Him Stevia’ was constructed using, the Repeat Modeller (v1.08) (Flynn et al., 2020). Subsequently, the de novo library was combined with Repbase's known repeat library to discover repetitive sequences in the ‘Him Stevia’ genome using Repeat Masker (Price et al., 2005). Tandem Repeat Finder (Benson, 1999) was used to annotate tandem repeats. LTR retriever was used to identify the ‘Him Stevia’ genome intact LTR‐RTs and to estimate the timing of insertion. Further TEclass v2.1.3 (Abrusán et al., 2009) was used to classify LTR‐RTs subfamilies employing gydb (https://gydb.org/index.php) and Rexdb (https://dbdb.io/db/rexdb) databases. Likewise, SSR repeats were identified using the MISA tool (https://webblast.ipk‐gatersleben.de/misa/).
The protein‐coding genes were identified using combination of ab initio, homology‐based and RNA‐seq based prediction methods. Repetitive regions were masked first, then Augustus (Stanke et al., 2006), Gene Mark (Brůna et al., 2020) and Braker v2.1.5 (Hoff et al., 2019) were used for de novo prediction. Further, the RNA‐seq reads were mapped to the ‘Him Stevia’ genome using STAR (Dobin et al., 2013). Functional annotation of the protein‐coding genes was predicted by mapping them against the four public protein databases viz; SwissProt, TAIR, KEGG and NCBI‐NR. Further, InterProScan (Quevillon et al., 2005) was used to identify the putative protein domains and GO classification.
To identify the non‐coding tRNA genes tRNAscan‐SE was utilized (Lowe and Eddy, 1996). The microRNA (miRNA) genes were annotated using the Blastn algorithm against the miR‐base database (https://www.mirbase.org/). Further, the Rfam database based Infernal Tool (Nawrocki et al., 2009) was used to identify genes encoding for rRNA. Transcription factor genes were annotated using the iTAK software package (http://itak.feilab.net/cgi‐bin/itak/).
Evaluation of allelic variants of genes
The allelic genes across the two haplotypes of SR‐HRv1.0 were identified using MCScanX (Wang et al., 2012). The genes were compared between the two haplotypes, and only those pairs were considered as allelic that passed the parameters of 1vs1, cscore = 0.99, and localization within the same syntenic block. Briefly, the non‐syntenic genes were aligned back to the SR‐MAv1.0 to identify the gene pairs sharing half of the reference. The resulting pairs were aligned with MAFFT (Katoh et al., 2009), and only those gene pairs having sequence similarity of >0.7 were regarded as allelic. The SNP and InDels were identified to dissect genetic variations and evolutionary inferences between the two haplotypes. Nucmer tool (Kurtz et al., 2004), Assemblytics (Nattestad and Schatz, 2016) and SYRI (Goel et al., 2019) were used to identify structural variations (SVs) between two haplotypes. To determine the allele‐specific expression reference‐guided transcriptome analysis of two contrasting stevia genotypes was used. The high‐quality reads were mapped to evaluate allele‐specific expression using STAR (Dobin et al., 2013). Read counts per gene were estimated through RSEM. The raw count matrix was first normalized using TMM‐based normalization followed by differential gene expression analysis through edgeR (Robinson et al., 2009) using FDR‐adjusted P‐value cutoff value of ≤0.05 and fold change (FC) threshold value of ≥2.
Evolution and phylogeny
To infer orthology in S. rebaudiana, protein sequences derived from public whole genome data of Helianthus annuus (Badouin et al., 2017), Artemisia annua (Shen et al., 2018), Cynara cardunculus (Scaglione et al., 2016), Chrysanthemum nankingense (Song et al., 2018), Lactuca sativa (Reyes‐Chin‐Wo et al., 2017), Cichorium endivia (Zhang et al., 2022), Mikania micrantha (B. Liu et al., 2020a) and Vitis vinifera (Canaguier et al., 2017) were used. The OrthoFinder (Emms and Kelly, 2019) was used to identify orthologous proteins using the Markov chain clustering model. The single‐copy genes were extracted and aligned by MAFFT (Katoh et al., 2009). RAxML (Stamatakis, 2014) was used to construct phylogeny using 1000 bootstraps with the V. vinifera as out‐groups. Cafe Software (De Bie et al., 2006) was utilized to perform the expansion and contraction using a P‐value threshold of ≤0.05. The KEGG and GO enrichment of the gene families was done using the Cluster Profiler (Wu et al., 2021). BlastP was used to identify the homologous pairs of S. rebaudiana proteins using an e‐value cut‐off of 1e‐05. Subsequently, collinear blocks were identified with MCScanX (Wang et al., 2012) using default parameters, further, the synonymous substitution rates per gene (Ks) among the collinear genes were performed using KK4D software. The tandem repeat genes were identified using three criteria including 70% identity between genes with pairwise gene distance less than 100 kb and no more than ten genes positioned between them on a single chromosome.
Characterization of Cytochrome P450 and UGT gene families
The Hidden Markov Model (HMM) files of the CYP P450 (PF00067) and UGT (PF00201) gene families were obtained from the Pfam database (http://pfam.xfam.org/). Subsequently, S. rebaudiana genome was scanned with HMM models for the identification of CYP P450 and UGT genes using the HMMSEARCH option implemented in HMMER v3.2.1 (Finn et al., 2011), followed by their alignment with Arabidopsis CYP P450 and UGT for their sub‐family classification. Further, each of the identified CYP P450 and UGTs was validated for the presence of functional domains using NCBICDD (https://www.ncbi.nlm.nih.gov/Structure/cdd/wrpsb.cgi) databases. Phylogenetic analysis of the CYP P450 and UGTs was then performed firstly by sequence alignment using Muscle (Edgar, 2004), followed by the generation of a maximum Likelihood (ML) tree using Mega7 (Hall, 2013) with 1000 bootstrap replications. Finally, iTOL was used to edit the phylogenetic tree (Letunic and Bork, 2019). Further, the protein sequence of UGT76G1 was subjected to homology modelling using the Phyre2 server (http://www.sbg.bio.ic.ac.uk/~phyre2/html/page.cgi?id=index). Additionally, the molecular structure of UGT76G1 with an induced mutation at the identified site was constructed and energy was minimized using PYMOL v 2.2.0 (https://pymol.org/2/).
Gene regulatory network analysis
The transcription factors were identified using iTAK software (Zheng et al., 2016). Trait‐specific transcriptome sequencing data [in‐house (4); public transcriptome (PRJNA591974, PRJNA260244: 9)] was utilized for expression analysis (Table S25). The expression values of transcription factors and SG pathway genes were subjected to a regulatory gene network (GRN) prediction using GENIE3 software. The network was further visualized using Cytoscape software (Shannon et al., 2003).
qRT‐PCR analysis
Steviol glycoside (SG) biosynthesis‐related key genes were used for quantitative expression validation (Table S13). Primers for these genes were designed using the Batch Primer 3 software (You et al., 2008). RNA samples (2 μg each) from leaf tissues were reverse transcribed into complementary DNA (cDNA) using the Verso cDNA Synthesis Kit (Thermo Fisher Scientific) in a reaction volume of 20 μL. Quantitative real‐time PCR (RT‐qPCR) was performed using 1 μL cDNA template, 5 μL Power SYBR Green mix (Thermo Fisher Scientific), 0.5 μL of forward and reverse primer and 3 μL Nuclease‐free water in a real‐time PCR system (QuantStudio 5, Applied Biosystems, USA) in three independent technical replicates. The thermal cycling protocol comprises 94 °C for 10 min, 40 cycles of denaturation at 94 °C for 30 s, annealing at 57 °C for 30 s and extension at 72 °C for 30 s. Relative gene expression in each tissue was calculated using the 2ΔΔCt method (Livak and Schmittgen, 2001) with actin as an internal reference control.
Variant calling
Resequencing and transcriptome data were utilized for ascertaining genome‐wide genetic variations. First, using the STAR aligner (Dobin et al., 2013), transcriptome data consisting of leaf samples from 13 different diverse genotypes was aligned to the ‘Him Stevia’ genome. Subsequently, resequencing data from 10 stevia cultivars was mapped to the ‘Him Stevia’ genome using the BWA aligner (Jo and Koh, 2015). This process helped to capture a broader range of genetic variations across the genome. After alignment, we used the Genome Analysis Toolkit (GATK) in Genomic VCF (GVCF) (McKenna et al., 2010) mode to call high‐quality single nucleotide polymorphisms (SNPs). To ensure the accuracy and reliability of the identified SNPs, we applied a stringent filtering process to discard variants with (quality score > 30, mapping quality (MQ) >40, quality by depth (QD) > 3 and minor allele frequency >0.05).
Conflicts of interest
All authors declare no conflict of interest.
Author contributions
R.K.S.: conceived, conceptulized, designed, data interpretations and overall coordination of the study; M.M., S.S., S.K., P.P., G.S: performed experiments. M.M. performed the bioinformatic analysis, data interpretations and wrote the manuscript. A.M.: help in manuscript editing. R.K.S.: edited and approved the final version of the manuscript. All authors have read and agreed to the published version of the manuscript.
Funding
The financial support was provided under CSIR‐FBR project MLP0161 and GE‐Crop MMP025301 by the Council of Scientific and Industrial Research, New Delhi, Govt. of India.
Supporting information
Table S1 Statistics of the ONT datasets.
Table S2 Statistics of the Illumina and HiC datasets.
Table S3 Statistics of S. rebaudiana contig level assemblies with different methods.
Table S4 Statistics of S. rebaudiana genome assembly.
Table S5 Chromosome length in the S. rebaudiana genome assembly.
Table S6 Mapping of high quality reads.
Table S7 Non‐coding RNA types in S. rebaudiana genome.
Table S8 Repeat elements in S. rebaudiana genome.
Table S9 LTR abudance in the Stevia Genome.
Table S10 Classification of LTR into subfamilies.
Table S11 Non‐autonomous LTR elements in S. rebaudiana genome.
Table S12 Expanded gene families functional enrichment.
Table S13 Cytochrome P450 gene family.
Table S14 Total Uridine diphosphate glycosyltransferase gene family.
Table S15 Haplotype A and Haplotype B repeat distribution.
Table S16 Allelic Gene Distribution and Functional Annotation.
Table S17 Variation distribution between two haplotypes.
Table S18 Structural Variation ≥50 bp distribution between two haplotypes.
Table S19 LTR in upstream 2Kb region of allelic genes.
Table S20 GO enrichment of allelic genes with biased expression.
Table S21 Gene specific primer sequences for q‐RT PCR analysis Gene‐specific.
Table S22 Resequencig data generated of 10 genotypes.
Table S23 Chromosomal distribution of variants.
Table S24 Transcription factor identified in S. rebaudiana genome.
Table S25 Transcriptome dataset utilised for construction of GRN and variant calling.
Table S26 Molecular docking results consisting of four key mutation with Stv and Reb‐A as ligand.
Figure S1 Predicted heterozygosity and genome size of S. rebaudiana genome.
Figure S2 HiC chromosomal assignment.
Figure S3 Functional annotation of protein‐coding genes.
Figure S4 Allele biased expression difference represented by MA plots utilizing RNA‐seq data of two cultivars of S. rebaudiana.
Figure S5 Multiple alignments of UGT85C1 and UGT76G1 representing mutation in protein sequence resulting in biased expression.
Figure S6 A. Multiple alignments of the protein sequence of LHCB3 representing sequence mutation, B. Transcription factor binding sites in Cis region of haplotype A and haplotype B of LHCB3.
Figure S7 Relative gene expression analysis of SG biosynthesis pathway genes in leaf tissue of 10 potential genotypes using q‐RT PCR analysis (three biological replicates for each sample, Bar represents the mean ± SE). (a) MEP pathway genes consisting of DXR, GGPPS, KO, and KAO, (b) SG biosynthesis pathway genes, comprising CYP716, UGT85C2, UGT74G1, and four gene copies of UGT76G1, (c) Potential transcription factors.
Figure S8 Variants identified from resequencing data analysis of 10 genotypes. (a) Different types of variants identified classified as (SNP, Insertion and Deletions), (b) Classification of variants based on the impact, (c) Categorization of variants based on the functional impact on protein.
Figure S9 Cis‐regulatory motif analysis of potential genes of SG biosynthesis.
Figure S10 Dotplot representation of whole genome synteny analysis using two closely related. (a) H. annuus (Inter‐genomic comparison:12,700 gene pairs), (b) M. micrantha (Inter‐genomic comparison: 14,158 gene pairs) and, (c) S. rebaudiana (Inter‐genomic comparison:8,730 gene pairs; Xu et al., 2021).
Acknowledgements
We wish to acknowledge the Director, CSIR‐Institute of Himalayan Bioresource Technology (IHBT) for providing the resources needed to conduct the research work. The authors are grateful to Dr Ashok Kumar and Dr Sanatsujat Singh, CSIR IHBT for providing plant materials. M.M. acknowledges ICMR New Delhi for a Senior research fellowship. This is CSIR‐IHBT publication no. 5623.
Data availability
Data generated were deposited in the NCBI under project accession number PRJNA988897. Data supporting the findings of this work are available within the paper and its Supplementary Information files. The datasets generated and analysed during the study are available from the corresponding author upon reasonable request.
References
- Abrusán, G. , Grundmann, N. , Demester, L. and Makalowski, W. (2009) TEclass ‐ A tool for automated classification of unknown eukaryotic transposable elements. Bioinformatics 25, 1329–1330. [DOI] [PubMed] [Google Scholar]
- Alonge, M. , Wang, X. , Benoit, M. , Soyk, S. , Pereira, L. , Zhang, L. , Suresh, H. et al. (2020) Major impacts of widespread structural variation on gene expression and crop improvement in tomato. Cell 182, 145–161.e23. [DOI] [PMC free article] [PubMed] [Google Scholar]
- Anjana, R.M. , Unnikrishnan, R. , Deepa, M. , Pradeepa, R. , Tandon, N. , Das, A.K. et al. (2023) Metabolic non‐communicable disease health report of India: The ICMR‐INDIAB national cross‐sectional study (ICMR‐INDIAB‐17). Lancet Diabetes Endocrinol. 11, 474–489. [DOI] [PubMed] [Google Scholar]
- Badouin, H. , Gouzy, J. , Grassa, C.J. , Murat, F. , Staton, S.E. , Cottret, L. , Lelandais‐Brière, C. et al. (2017) The sunflower genome provides insights into oil metabolism, flowering and Asterid evolution. Nature 546, 148–152. [DOI] [PubMed] [Google Scholar]
- Bennetzen, J.L. (2005) Transposable elements, gene creation and genome rearrangement in flowering plants. Curr. Opin. Genet. Dev. 15, 621–627. [DOI] [PubMed] [Google Scholar]
- Benson, G. (1999) Tandem repeats finder: A program to analyze DNA sequences. Nucleic Acids Res. 27, 573–580. [DOI] [PMC free article] [PubMed] [Google Scholar]
- Biémont, C. and Vieira, C. (2006) Genetics: Junk DNA as an evolutionary force. Nature 443, 521–524. [DOI] [PubMed] [Google Scholar]
- Brůna, T. , Lomsadze, A. and Borodovsky, M. (2020) GeneMark‐EP+: Eukaryotic gene prediction with self‐training in the space of genes and proteins. NAR Genom. Bioinform. 2, lqaa026. [DOI] [PMC free article] [PubMed] [Google Scholar]
- Canaguier, A. , Grimplet, J. , Di Gaspero, G. , Scalabrin, S. , Duchêne, E. , Choisne, N. et al. (2017) A new version of the grapevine reference genome assembly (12X.v2) and of its annotation (VCost.v3). Genom Data 14, 56. [DOI] [PMC free article] [PubMed] [Google Scholar]
- Castillo‐Davis, C.I. , Mekhedov, S.L. , Hartl, D.L. , Koonin, E.V. and Kondrashov, F.A. (2002) Selection for short introns in highly expressed genes. Nat. Genet. 31, 415–418. [DOI] [PubMed] [Google Scholar]
- Ceunen, S. and Geuns, J.M.C. (2013) Steviol glycosides: Chemical diversity, metabolism, and function. J. Nat. Prod. 76, 1201–1228. [DOI] [PubMed] [Google Scholar]
- Chen, J. , Hou, K. , Qin, P. , Liu, H. , Yi, B. , Yang, W. and Wu, W. (2014) RNA‐Seq for gene identification and transcript profiling of three Stevia rebaudiana genotypes. BMC Genomics 15, 1–11. [DOI] [PMC free article] [PubMed] [Google Scholar]
- Chen, F. , Su, L. , Hu, S. , Xue, J.‐Y. , Liu, H. , Liu, G. , Jiang, Y. et al. (2021) A chromosome‐level genome assembly of rugged rose (Rosa rugosa) provides insights into its evolution, ecology, and floral characteristics. Hortic. Res. 8, 141. [DOI] [PMC free article] [PubMed] [Google Scholar]
- Cheng, S.P. , Jia, K.H. , Liu, H. , Zhang, R.G. , Li, Z.C. , Zhou, S.S. et al. (2021) Haplotype‐resolved genome assembly and allele‐specific gene expression in cultivated ginger. Hortic. Res. 8, 188. [DOI] [PMC free article] [PubMed] [Google Scholar]
- Cota‐Sánchez, J.H. , Remarchuk, K. and Ubayasena, K. (2006) Ready‐to‐use DNA extracted with a CTAB method adapted for herbarium specimens and mucilaginous plant tissue. Plant Molecular Biology Reporter 24, 161–167. [Google Scholar]
- De Bie, T. , Cristianini, N. , Demuth, J.P. and Hahn, M.W. (2006) CAFE: A computational tool for the study of gene family evolution. Bioinformatics 22, 1269–1271. [DOI] [PubMed] [Google Scholar]
- Devi, A. , Seth, R. , Masand, M. , Singh, G. , Holkar, A. , Sharma, S. et al. (2022) Spatial genomic resource reveals molecular insights into key bioactive‐metabolite biosynthesis in endangered Angelica glauca edgew. Int. J. Mol. Sci. 23, 11064. [DOI] [PMC free article] [PubMed] [Google Scholar]
- Dobin, A. , Davis, C.A. , Schlesinger, F. , Drenkow, J. , Zaleski, C. , Jha, S. , Batut, P. et al. (2013) STAR: Ultrafast universal RNA‐seq aligner. Bioinformatics 29, 15–21. [DOI] [PMC free article] [PubMed] [Google Scholar]
- Edgar, R.C. (2004) MUSCLE: Multiple sequence alignment with high accuracy and high throughput. Nucleic Acids Res. 32, 1792–1797. [DOI] [PMC free article] [PubMed] [Google Scholar]
- Emms, D.M. and Kelly, S. (2019) OrthoFinder: Phylogenetic orthology inference for comparative genomics. Genome Biol. 20, 238. [DOI] [PMC free article] [PubMed] [Google Scholar]
- Finn, R.D. , Clements, J. and Eddy, S.R. (2011) HMMER web server: Interactive sequence similarity searching. Nucleic Acids Res. 39, W29–W37. [DOI] [PMC free article] [PubMed] [Google Scholar]
- Flynn, J.M. , Hubley, R. , Goubert, C. , Rosen, J. , Clark, A.G. , Feschotte, C. and Smit, A.F. (2020) RepeatModeler2 for automated genomic discovery of transposable element families. Proc. Natl. Acad. Sci. U. S. A. 117, 9451–9457. [DOI] [PMC free article] [PubMed] [Google Scholar]
- Ghawana, S. , Paul, A. , Kumar, H. , Kumar, A. , Singh, H. , Bhardwaj, P.K. et al. (2011) An RNA isolation system for plant tissues rich in secondary metabolites. BMC. Res. Notes 4, 85. [DOI] [PMC free article] [PubMed] [Google Scholar]
- Goel, M. , Sun, H. , Jiao, W.B. and Schneeberger, K. (2019) SyRI: Finding genomic rearrangements and local sequence differences from whole‐genome assemblies. Genome Biol. 20, 277. [DOI] [PMC free article] [PubMed] [Google Scholar]
- Goff, S.A. , Ricke, D. , Lan, T.H. , Presting, G. , Wang, R. , Dunn, M. et al. (2002) A draft sequence of the rice genome (Oryza sativa L. ssp. japonica). Science 1979, 296. [DOI] [PubMed] [Google Scholar]
- Grover, C.E. and Wendel, J.F. (2010) Recent insights into mechanisms of genome size change in plants. J. Bot. 2010, 1–8. [Google Scholar]
- Hall, B.G. (2013) Building phylogenetic trees from molecular data with MEGA. Mol. Biol. Evol. 30, 1229–1235. [DOI] [PubMed] [Google Scholar]
- Hansen, K.S. , Kristensen, C. , Tattersall, D.B. , Jones, P.R. , Olsen, C.E. , Bak, S. and Møller, B.L. (2003) The in vitro substrate regiospecificity of recombinant UGT85B1, the cyanohydrin glucosyltransferase from Sorghum bicolor. Phytochemistry 64, 143–151. [DOI] [PubMed] [Google Scholar]
- Hirsch, C.D. and Springer, N.M. (2017) Transposable element influences on gene expression in plants. Biochim Biophys Acta Gene Regul. Mech. 1860, 157–165. [DOI] [PubMed] [Google Scholar]
- Hoff, K.J. , Lomsadze, A. , Borodovsky, M. and Stanke, M. (2019) Whole‐genome annotation with BRAKER. Methods Mol. Biol. 1962, 65–95. [DOI] [PMC free article] [PubMed] [Google Scholar]
- Hollister, J.D. and Gaut, B.S. (2009) Epigenetic silencing of transposable elements: A trade‐off between reduced transposition and deleterious effects on neighboring gene expression. Genome Res. 19, 1419–1428. [DOI] [PMC free article] [PubMed] [Google Scholar]
- Jo, H. and Koh, G. (2015) Faster single‐end alignment generation utilizing multi‐thread for BWA. Biomed. Mater. Eng. 26, S1791–S1796. [DOI] [PubMed] [Google Scholar]
- Johnson, R.J. , Nakagawa, T. , Sanchez‐Lozada, L.G. , Shafiu, M. , Sundaram, S. , Le, M. et al. (2013) Sugar, uric acid, and the etiology of diabetes and obesity. Diabetes 62, 3307–3315. [DOI] [PMC free article] [PubMed] [Google Scholar]
- Katoh, K. , Asimenos, G. and Toh, H. (2009) Multiple alignment of DNA sequences with MAFFT. Methods Mol. Biol. 537, 39–64. [DOI] [PubMed] [Google Scholar]
- Kaul, S. , Koo, H.L. , Jenkins, J. , Rizzo, M. , Rooney, T. , Tallon, L.J. et al. (2000) Analysis of the genome sequence of the flowering plant Arabidopsis thaliana . Nature 408, 796–815. [DOI] [PubMed] [Google Scholar]
- Koren, S. , Walenz, B.P. , Berlin, K. , Miller, J.R. , Bergman, N.H. and Phillippy, A.M. (2017) Canu: Scalable and accurate long‐read assembly via adaptive κ‐mer weighting and repeat separation. Genome Res. 27, 722–736. [DOI] [PMC free article] [PubMed] [Google Scholar]
- Kui, L. , Majeed, A. , Wang, X. , Yang, Z. , Chen, J. , He, L. , Di, Y. et al. (2023) A chromosome‐level genome assembly for Erianthus fulvus provides insights into its biofuel potential and facilitates breeding for improvement of sugarcane. Plant Commun. 4, 100562. [DOI] [PMC free article] [PubMed] [Google Scholar]
- Kumar, A. , Singh, S. , Sharma, R.K. , Singh, B. and Ahuja, P.S. (2019) Him Stevia (CSIR‐IHBT‐ST‐01) (IC0624505; INGR17052), a Stevia (Stevia rebaudiana) Germplasm with Reb‐A/Stevioside ratio=1.25; Rebaudioside‐A content (%)=7.34; Stevioside content (%)=5.87. Indian J Plant Genet Resour 32, 259–260. [Google Scholar]
- Kurtz, S. , Phillippy, A. , Delcher, A.L. , Smoot, M. , Shumway, M. , Antonescu, C. and Salzberg, S.L. (2004) Versatile and open software for comparing large genomes. Genome Biol. 5, R12. [DOI] [PMC free article] [PubMed] [Google Scholar]
- Lee, S.G. , Salomon, E. , Yu, O. and Jez, J.M. (2019) Molecular basis for branched steviol glucoside biosynthesis. Proc. Natl. Acad. Sci. U. S. A. 116, 13131–13136. [DOI] [PMC free article] [PubMed] [Google Scholar]
- Letunic, I. and Bork, P. (2019) Interactive Tree of Life (iTOL) v4: Recent updates and new developments. Nucleic Acids Res. 47, W256–W259. [DOI] [PMC free article] [PubMed] [Google Scholar]
- Liu, L. , White, M.J. and MacRae, T.H. (1999) Transcription factors and their genes in higher plants: Functional domains, evolution and regulation. Eur. J. Biochem. 262, 247–257. [DOI] [PubMed] [Google Scholar]
- Liu, B. , Yan, J. , Li, W. , Yin, L. , Li, P. , Yu, H. , Xing, L. et al. (2020a) Mikania micrantha genome provides insights into the molecular mechanism of rapid growth. Nat. Commun. 11, 340. [DOI] [PMC free article] [PubMed] [Google Scholar]
- Liu, Z. , Li, J. , Sun, Y. , Zhang, P. and Wang, Y. (2020b) Structural insights into the catalytic mechanism of a plant diterpene glycosyltransferase SrUGT76G1. Plant Commun. 1, 100004. [DOI] [PMC free article] [PubMed] [Google Scholar]
- Livak, K.J. and Schmittgen, T.D. (2001) Analysis of relative gene expression data using real‐time quantitative PCR and the 2−ΔΔCT method. Methods 25, 402–408. [DOI] [PubMed] [Google Scholar]
- Lowe, T.M. and Eddy, S.R. (1996) TRNAscan‐SE: A program for improved detection of transfer RNA genes in genomic sequence. Nucleic Acids Res. 25, 955–964. [DOI] [PMC free article] [PubMed] [Google Scholar]
- McKenna, A. , Hanna, M. , Banks, E. , Sivachenko, A. , Cibulskis, K. , Kernytsky, A. et al. (2010) The genome analysis toolkit: A MapReduce framework for analyzing next‐generation DNA sequencing data. Genome Res. 20, 1297–1303. [DOI] [PMC free article] [PubMed] [Google Scholar]
- Murat, F. , Armero, A. , Pont, C. , Klopp, C. and Salse, J. (2017) Reconstructing the genome of the most recent common ancestor of flowering plants. Nat. Genet. 49, 490–496. [DOI] [PubMed] [Google Scholar]
- Nattestad, M. and Schatz, M.C. (2016) Assemblytics: A web analytics tool for the detection of assembly‐based variants. Genome analysis 32, 44925. [DOI] [PMC free article] [PubMed] [Google Scholar]
- Nawrocki, E.P. , Kolbe, D.L. and Eddy, S.R. (2009) Infernal 1.0: Inference of RNA alignments. Bioinformatics 25, 1335–1337. [DOI] [PMC free article] [PubMed] [Google Scholar]
- Osmani, S.A. , Bak, S. and Møller, B.L. (2009) Substrate specificity of plant UDP‐dependent glycosyltransferases predicted from crystal structures and homology modeling. Phytochemistry 70, 325–347. [DOI] [PubMed] [Google Scholar]
- Ou, S. , Chen, J. and Jiang, N. (2018) Assessing genome assembly quality using the LTR Assembly Index (LAI). Nucleic Acids Res. 46, e126. [DOI] [PMC free article] [PubMed] [Google Scholar]
- Pal, P. , Masand, M. , Sharma, S. , Seth, R. , Singh, G. , Singh, S. et al. (2023) Genome‐wide transcriptional profiling and physiological investigation elucidating the molecular mechanism of multiple abiotic stress response in Stevia rebaudiana Bertoni. Sci. Rep. 13, 19853. [DOI] [PMC free article] [PubMed] [Google Scholar]
- Pantsar, T. and Poso, A. (2018) Binding affinity via docking: Fact and fiction. Molecules 23, 1899. [DOI] [PMC free article] [PubMed] [Google Scholar]
- Price, A.L. , Jones, N.C. and Pevzner, P.A. (2005) De novo identification of repeat families in large genomes. Bioinformatics 21, i351–i358. [DOI] [PubMed] [Google Scholar]
- Pryszcz, L.P. and Gabaldón, T. (2016) Redundans: An assembly pipeline for highly heterozygous genomes. Nucleic Acids Res. 44, e113. [DOI] [PMC free article] [PubMed] [Google Scholar]
- Quevillon, E. , Silventoinen, V. , Pillai, S. , Harte, N. , Mulder, N. , Apweiler, R. and Lopez, R. (2005) InterProScan: Protein domains identifier. Nucleic Acids Res. 33, W116–W120. [DOI] [PMC free article] [PubMed] [Google Scholar]
- Reyes‐Chin‐Wo, S. , Wang, Z. , Yang, X. , Kozik, A. , Arikit, S. , Song, C. , Xia, L. et al. (2017) Genome assembly with in vitro proximity ligation data and whole‐genome triplication in lettuce. Nat. Commun. 8, 14953. [DOI] [PMC free article] [PubMed] [Google Scholar]
- Roach, M.J. , Schmidt, S.A. and Borneman, A.R. (2018) Purge Haplotigs: Allelic contig reassignment for third‐gen diploid genome assemblies. BMC Bioinformatics 19, 460. [DOI] [PMC free article] [PubMed] [Google Scholar]
- Robinson, M.D. , McCarthy, D.J. and Smyth, G.K. (2009) edgeR: A bioconductor package for differential expression analysis of digital gene expression data. Bioinformatics 26, 139–140. [DOI] [PMC free article] [PubMed] [Google Scholar]
- Scaglione, D. , Reyes‐Chin‐Wo, S. , Acquadro, A. , Froenicke, L. , Portis, E. , Beitel, C. et al. (2016) Erratum: The genome sequence of the outbreeding globe artichoke constructed de novo incorporating a phase‐aware low‐pass sequencing strategy of F1 progeny. Sci. Rep. 6, 19427. [DOI] [PMC free article] [PubMed] [Google Scholar]
- Shannon, P. , Markiel, A. , Ozier, O. , Baliga, N.S. , Wang, J.T. , Ramage, D. , Amin, N. et al. (2003) Cytoscape: A software Environment for integrated models of biomolecular interaction networks. Genome Res. 13, 2498–2504. [DOI] [PMC free article] [PubMed] [Google Scholar]
- Shen, Q. , Zhang, L. , Liao, Z. , Wang, S. , Yan, T. , Shi, P. , Liu, M. et al. (2018) The genome of Artemisia annua provides insight into the evolution of asteraceae family and artemisinin biosynthesis. Mol. Plant 11, 776–788. [DOI] [PubMed] [Google Scholar]
- Singh, G. , Singh, G. , Singh, P. , Parmar, R. , Paul, N. , Vashist, R. , Swarnkar, M.K. et al. (2017) Molecular dissection of transcriptional reprogramming of steviol glycosides synthesis in leaf tissue during developmental phase transitions in Stevia rebaudiana Bert. Sci. Rep. 7, 11835. [DOI] [PMC free article] [PubMed] [Google Scholar]
- Singh, G. , Sharma, S. , Rawat, S. and Sharma, R.K. (2022) Plant Specialised Glycosides (PSGs): Their biosynthetic enzymatic machinery, physiological functions and commercial potential. Funct. Plant Biol. 49, 1009–1028. [DOI] [PubMed] [Google Scholar]
- Song, C. , Liu, Y. , Song, A. , Dong, G. , Zhao, H. , Sun, W. , Ramakrishnan, S. et al. (2018) The Chrysanthemum nankingense genome provides insights into the evolution and diversification of chrysanthemum flowers and medicinal traits. Mol. Plant 11, 1482–1491. [DOI] [PubMed] [Google Scholar]
- Stamatakis, A. (2014) RAxML version 8: A tool for phylogenetic analysis and post‐analysis of large phylogenies. Bioinformatics 30, 1312–1313. [DOI] [PMC free article] [PubMed] [Google Scholar]
- Stanke, M. , Keller, O. , Gunduz, I. , Hayes, A. , Waack, S. and Morgenstern, B. (2006) AUGUSTUS: A b initio prediction of alternative transcripts. Nucleic Acids Res. 34, W435–W439. [DOI] [PMC free article] [PubMed] [Google Scholar]
- Vallejo, V.A. and Warner, R.M. (2021) Identifying quantitative trait loci for steviol glycoside production in Stevia rebaudiana using transcriptome‐derived SSRs. Ind. Crop Prod. 161, 113176. [Google Scholar]
- Walker, B.J. , Abeel, T. , Shea, T. , Priest, M. , Abouelliel, A. , Sakthikumar, S. , Cuomo, C.A. et al. (2014) Pilon: An integrated tool for comprehensive microbial variant detection and genome assembly improvement. PLoS One 9, e112963. [DOI] [PMC free article] [PubMed] [Google Scholar]
- Wang, Y.‐B. and Zhang, X. (2022) Chromosome scaffolding of diploid genomes using ALLHiC. Bio Protoc 12, e4503. [Google Scholar]
- Wang, Y. , Tang, H. , Debarry, J.D. , Tan, X. , Li, J. , Wang, X. et al. (2012) MCScanX: A toolkit for detection and evolutionary analysis of gene synteny and collinearity. Nucleic Acids Res. 40, e49. [DOI] [PMC free article] [PubMed] [Google Scholar]
- Wang, Y. , Sun, X. , Jia, X. , Zhu, L. and Yin, H. (2021) Comparative transcriptomic of Stevia rebaudiana provides insight into rebaudioside D and rebaudioside M biosynthesis. Plant Physiol. Biochem. 167, 541–549. [DOI] [PubMed] [Google Scholar]
- Wicker, T. , Sabot, F. , Hua‐Van, A. , Bennetzen, J.L. , Capy, P. , Chalhoub, B. et al. (2007) A unified classification system for eukaryotic transposable elements. Nat. Rev. Genet. 8, 973–982. [DOI] [PubMed] [Google Scholar]
- Wu, T. , Hu, E. , Xu, S. , Chen, M. , Guo, P. , Dai, Z. , Feng, T. et al. (2021) clusterProfiler 4.0: A universal enrichment tool for interpreting omics data. Innovations 2, 100141. [DOI] [PMC free article] [PubMed] [Google Scholar]
- Xia, E. , Tong, W. , Hou, Y. , An, Y. , Chen, L. , Wu, Q. , Liu, Y. et al. (2020) The reference genome of tea plant and resequencing of 81 diverse accessions provide insights into its genome evolution and adaptation. Mol. Plant 13, 1013–1026. [DOI] [PubMed] [Google Scholar]
- Xu, M. , Guo, L. , Gu, S. , Wang, O. , Zhang, R. , Peters, B.A. et al. (2020a) TGS‐GapCloser: A fast and accurate gap closer for large genomes with low coverage of error‐prone long reads. GigaScience 9, giaa094. [DOI] [PMC free article] [PubMed] [Google Scholar]
- Xu, Z. , Xu, Z. , Pu, X. , Gao, R. , Demurtas, O.C. , Fleck, S.J. et al. (2020b) Tandem gene duplications drive divergent evolution of caffeine and crocin biosynthetic pathways in plants. BMC Biol. 18, 63. [DOI] [PMC free article] [PubMed] [Google Scholar]
- Xu, X. , Yuan, H. , Yu, X. , Huang, S. , Sun, Y. , Zhang, T. , Liu, Q. et al. (2021) The chromosome‐level Stevia genome provides insights into steviol glycoside biosynthesis. Hortic. Res. 8, 129. [DOI] [PMC free article] [PubMed] [Google Scholar]
- Xue, Z. , Tan, Z. , Huang, A. , Zhou, Y. , Sun, J. , Wang, X. , Thimmappa, R.B. et al. (2018) Identification of key amino acid residues determining product specificity of 2,3‐oxidosqualene cyclase in Oryza species. New Phytol. 218, 1076–1088. [DOI] [PubMed] [Google Scholar]
- Yadav, A.K. , Singh, S. and Bhardwaj, G. (2014) Nuclear DNA content and genome size estimation of Stevia rebaudiana using flow cytometry. Minerva Biotecnol. 26, 143–148. [Google Scholar]
- Yang, T. , Zhang, J. , Ke, D. , Yang, W. , Tang, M. , Jiang, J. et al. (2019) Hydrophobic recognition allows the glycosyltransferase UGT76G1 to catalyze its substrate in two orientations. Nat. Commun. 10, 1–12. [DOI] [PMC free article] [PubMed] [Google Scholar]
- You, F.M. , Huo, N. , Gu, Y.Q. , Luo, M.C. , Ma, Y. , Hane, D. , Lazo, G.R. et al. (2008) BatchPrimer3: A high throughput web application for PCR and sequencing primer design. BMC Bioinformatics 9, 1–13. [DOI] [PMC free article] [PubMed] [Google Scholar]
- Zhang, Q.J. and Gao, L.Z. (2017) Rapid and recent evolution of LTR retrotransposons drives rice genome evolution during the speciation of AA‐genome Oryza Species. G3: Genes, Genomes, Genetics 7, 1875–1885. [DOI] [PMC free article] [PubMed] [Google Scholar]
- Zhang, S.S. , Chen, H. , Xiao, J.Y. , Liu, Q. , Xiao, R.F. and Wu, W. (2019a) Mutations in the uridine diphosphate glucosyltransferase 76G1 gene result in different contents of the major steviol glycosides in Stevia rebaudiana . Phytochemistry 162, 141–147. [DOI] [PubMed] [Google Scholar]
- Zhang, X. , Zhang, S. , Zhao, Q. , Ming, R. and Tang, H. (2019b) Assembly of allele‐aware, chromosomal‐scale autopolyploid genomes based on Hi‐C data. Nat. Plants 5, 833–845. [DOI] [PubMed] [Google Scholar]
- Zhang, Q.J. , Li, W. , Li, K. , Nan, H. , Shi, C. , Zhang, Y. , Dai, Z.Y. et al. (2020) The chromosome‐level reference genome of tea tree unveils recent bursts of non‐autonomous ltr retrotransposons in driving genome size evolution. Mol. Plant 13, 935–938. [DOI] [PubMed] [Google Scholar]
- Zhang, S. , Yang, Y. , Lyu, C. , Chen, J. , Li, D. , Liu, Y. , Zhang, Z. et al. (2021) Identification of the key residues of the uridine diphosphate glycosyltransferase 91D2 and its effect on the accumulation of steviol glycosides in Stevia rebaudiana . J. Agric. Food Chem. 69, 1852–1863. [DOI] [PubMed] [Google Scholar]
- Zhang, B. , Wang, Z. , Han, X. , Liu, X. , Wang, Q. , Zhang, J. , Zhao, H. et al. (2022) The chromosome‐scale assembly of endive (Cichorium endivia) genome provides insights into the sesquiterpenoid biosynthesis. Genomics 114, 110400. [DOI] [PubMed] [Google Scholar]
- Zheng, Y. , Jiao, C. , Sun, H. , Rosli, H.G. , Pombo, M.A. , Zhang, P. , Banf, M. et al. (2016) iTAK: A program for genome‐wide prediction and classification of plant transcription factors, transcriptional regulators, and protein kinases. Mol. Plant 9, 1667–1670. [DOI] [PubMed] [Google Scholar]
- Zhou, Y. , Minio, A. , Massonnet, M. , Solares, E. , Lv, Y. , Beridze, T. , Cantu, D. et al. (2019) The population genetics of structural variants in grapevine domestication. Nat. Plants 5, 965–979. [DOI] [PubMed] [Google Scholar]
- Zimin, A.V. , Marçais, G. , Puiu, D. , Roberts, M. , Salzberg, S.L. and Yorke, J.A. (2013) The MaSuRCA genome assembler. Bioinformatics 29, 2669–2677. [DOI] [PMC free article] [PubMed] [Google Scholar]
Associated Data
This section collects any data citations, data availability statements, or supplementary materials included in this article.
Supplementary Materials
Table S1 Statistics of the ONT datasets.
Table S2 Statistics of the Illumina and HiC datasets.
Table S3 Statistics of S. rebaudiana contig level assemblies with different methods.
Table S4 Statistics of S. rebaudiana genome assembly.
Table S5 Chromosome length in the S. rebaudiana genome assembly.
Table S6 Mapping of high quality reads.
Table S7 Non‐coding RNA types in S. rebaudiana genome.
Table S8 Repeat elements in S. rebaudiana genome.
Table S9 LTR abudance in the Stevia Genome.
Table S10 Classification of LTR into subfamilies.
Table S11 Non‐autonomous LTR elements in S. rebaudiana genome.
Table S12 Expanded gene families functional enrichment.
Table S13 Cytochrome P450 gene family.
Table S14 Total Uridine diphosphate glycosyltransferase gene family.
Table S15 Haplotype A and Haplotype B repeat distribution.
Table S16 Allelic Gene Distribution and Functional Annotation.
Table S17 Variation distribution between two haplotypes.
Table S18 Structural Variation ≥50 bp distribution between two haplotypes.
Table S19 LTR in upstream 2Kb region of allelic genes.
Table S20 GO enrichment of allelic genes with biased expression.
Table S21 Gene specific primer sequences for q‐RT PCR analysis Gene‐specific.
Table S22 Resequencig data generated of 10 genotypes.
Table S23 Chromosomal distribution of variants.
Table S24 Transcription factor identified in S. rebaudiana genome.
Table S25 Transcriptome dataset utilised for construction of GRN and variant calling.
Table S26 Molecular docking results consisting of four key mutation with Stv and Reb‐A as ligand.
Figure S1 Predicted heterozygosity and genome size of S. rebaudiana genome.
Figure S2 HiC chromosomal assignment.
Figure S3 Functional annotation of protein‐coding genes.
Figure S4 Allele biased expression difference represented by MA plots utilizing RNA‐seq data of two cultivars of S. rebaudiana.
Figure S5 Multiple alignments of UGT85C1 and UGT76G1 representing mutation in protein sequence resulting in biased expression.
Figure S6 A. Multiple alignments of the protein sequence of LHCB3 representing sequence mutation, B. Transcription factor binding sites in Cis region of haplotype A and haplotype B of LHCB3.
Figure S7 Relative gene expression analysis of SG biosynthesis pathway genes in leaf tissue of 10 potential genotypes using q‐RT PCR analysis (three biological replicates for each sample, Bar represents the mean ± SE). (a) MEP pathway genes consisting of DXR, GGPPS, KO, and KAO, (b) SG biosynthesis pathway genes, comprising CYP716, UGT85C2, UGT74G1, and four gene copies of UGT76G1, (c) Potential transcription factors.
Figure S8 Variants identified from resequencing data analysis of 10 genotypes. (a) Different types of variants identified classified as (SNP, Insertion and Deletions), (b) Classification of variants based on the impact, (c) Categorization of variants based on the functional impact on protein.
Figure S9 Cis‐regulatory motif analysis of potential genes of SG biosynthesis.
Figure S10 Dotplot representation of whole genome synteny analysis using two closely related. (a) H. annuus (Inter‐genomic comparison:12,700 gene pairs), (b) M. micrantha (Inter‐genomic comparison: 14,158 gene pairs) and, (c) S. rebaudiana (Inter‐genomic comparison:8,730 gene pairs; Xu et al., 2021).
Data Availability Statement
Data generated were deposited in the NCBI under project accession number PRJNA988897. Data supporting the findings of this work are available within the paper and its Supplementary Information files. The datasets generated and analysed during the study are available from the corresponding author upon reasonable request.