

ABSTRACT
We studied a population of large varanid lizards (yellow‐spotted monitors Varanus panoptes ) on a floodplain in tropical Australia. Growth records from radio‐tracked lizards show that despite their large adult body sizes (to > 7 kg in males), these lizards attained sexual maturity at less than 1 year of age and rarely lived for more than 2 years (females) or 4 years (males), even before mortality increased due to the arrival of toxic cane toads ( Rhinella marina ). This is a “faster” life history than has been reported for other species of large monitors. Growth was especially rapid in males during the wet season. The low survivorship prior to toad invasion was due to predation by pythons; communal nesting by female varanids may render them especially vulnerable. The life history of yellow‐spotted monitors requires high feeding rates, favouring the evolution of “risky” tactics such as consuming novel prey items (such as cane toads); and the combination of high abundance (> 20 adult lizards per square kilometre) and high feeding rates (> 9.9 kg of prey per lizard per annum) means that these giant lizards play a critical role in energy and nutrient flow within the floodplain ecosystem. As a result, foodwebs with the yellow‐spotted monitor as an apex predator are more vulnerable to disruption by cane toads than is the case in other parts of the toad's invasive range, where the varanid species affected by toads have “slower” life histories.
Keywords: Bufo marinus , ecological impact, invasive species, pace of life, Varanidae
We show that large floodplain monitors reach sexual maturity surprisingly rapidly, and females rarely live for more than 2 years. This fast life history requires novel reproductive strategies and high feeding rates, favouring the evolution of “risky” tactics such as consuming novel prey items (such as invasive toxic cane toads). As a result, foodwebs with the yellow‐spotted monitor as an apex predator are more vulnerable to disruption by cane toads than is the case in other parts of the toad's invasive range, where the varanid species affected by toads have “slower” life histories.

1. Introduction
Biological invasions are a major cause for biodiversity loss worldwide (e.g., Clavero and García‐Berthou 2005; Gallardo et al. 2019). Most scientific attention has been on the impacts of invaders on specific taxa (e.g., Fukuda et al. 2016; Potgieter et al. 2020), but the effects of invasions also cascade through foodwebs (e.g., O'Loughlin and Green 2017; Feit et al. 2018; Bryant, Beachy, and Boves 2020). Thus, for example, an invader's impact on a keystone predator or ecosystem engineer could have wider effects than would a similar numerical impact on other native species. Increasingly, invasion biology seeks to understand and rectify the nuanced impacts that invaders impose on recipient systems. Instead of focusing solely on the overall abundance or persistence of an impacted native species across their range, we also need to quantify the nature and magnitude of impacts at the population and community level; the loss of ecosystem functions; and the interplay between animal behaviour and vulnerability to threatening processes (Ricciardi et al. 2021; Haubrock et al. 2024). To understand variation in invader impacts, then, we need to consider attributes of the species that are affected, and how changes in abundance of those taxa affect other components of local ecosystems (e.g., Doody et al. 2006).
One trait that might influence the wider impact of an invasion is the life history of taxa that are directly affected. For example, the continuum between “fast” and “slow” demographic tactics is a critical dimension of interspecific variation, termed the “pace of life” (Réale et al. 2010). Individuals of a “fast” species grow rapidly, mature early, breed frequently, and rarely live for long, whereas individuals of a “slow” species grow less rapidly, delay maturation, breed infrequently, and survive to breed many times (e.g., Allen, Street, and Capellini 2017). Indeed, many invaders themselves possess fast life histories, enabling their rapid establishment and flexibility in novel environments (Capellini et al. 2015); but what remains unclear is how the life‐history traits of native species in recipient systems influence their vulnerability to those invaders (Ricciardi et al. 2021).
The “pace of life” theory correlates facets of life history, physiology, and behaviour (Réale et al. 2010) and has been demonstrated in many systems, both within and between species. The selective forces acting on fast life histories favour higher metabolic rates (Auer et al. 2018) and resource acquisition (Nakayama, Rapp, and Arlinghaus 2017). In turn, species can evolve behavioural characteristics such as higher rates of exploration (Rádai, Kiss, and Barta 2017) and taking risks whilst foraging (Sol et al. 2018) – for example, by exploiting more open habitats or by consuming novel (and thus, potentially dangerous) prey items. This constellation of traits associated with “fast” life histories might have two important ecological consequences: (i) the higher feeding rate of a “fast” species may increase its impacts on prey taxa, and (ii) species with “fast” life histories may be at greater risk when a novel toxic prey species invades their habitat. In short, the wider ecological impact of an invasion may depend on the demographic traits of species that are directly affected by the invader.
The spread of cane toads ( Rhinella marina ) through tropical Australia provides an ideal study system with which to explore these ideas. Native predators that cannot tolerate the distinctive defensive chemicals of cane toads are killed if they attempt to ingest a toad, causing massive reductions in abundances of taxa such as varanid lizards, bluetongue skinks, freshwater crocodiles and northern quolls (Letnic, Webb, and Shine 2008; Price‐Rees, Brown, and Shine 2010; Shine 2010). Declines of > 90% in the numbers of formerly abundant varanid lizards may be especially significant, because these giant lizards play critical roles as predators, scavengers and ecosystem engineers in many Australian ecosystems (Doody et al. 2015, 2020; Pettit, Ward‐Fear, and Shine 2021). However, impacts are highly variable; for example, yellow‐spotted monitors ( Varanus panoptes ) across tropical Australia exhibit long‐sustained declines whereas lace monitors ( V. varius ) in eastern Australia exhibit minor and short‐term impacts (Pettit, Crowther, et al. 2021). At least part of that difference in impact might be due to life histories of the varanid species concerned, but detailed information on these traits is scarce. To explore these issues we measured life‐history traits of yellow‐spotted monitors at a floodplain in tropical Australia, both before and after the arrival of toxic cane toads. We then compared the extent of these impacts to those exhibited by other species that have been impacted by toads in Australia. In combination, our results clarify how an animal's “pace of life” can influence both its vulnerability to a toxic invasive species, and the wider ecosystem‐level impacts of population declines wrought by such an invader.
2. Materials and Methods
2.1. Field Site and Study Species
The Kimberley region of tropical Australia experiences a “wet‐dry” climate. Rainfall is concentrated in a brief (4‐month) “wet season” (700 of 835 mm total for Kununurra, Western Australia: Bureau of Meteorology 2023). The annual monsoonal rains create large open floodplains around rivers, fringed by savannah woodland that grades into spinifex grassland in higher drier sites (Payne and Schoknecht 2011). Air temperature is consistently high (mean air temperatures exceeds 35°C in 8 months per annum). We worked across one such floodplain (Oombulgurri: 16,000 ha, 15°08′34S, 127°52′36E), 39 km northwest of Wyndham, where cane toads arrived towards the end of the wet season in April 2014 (see Ward‐Fear et al. 2016 for details). Because the toads caused high mortality in yellow‐spotted monitors, our estimates of lizard abundance and of ages at mortality in the current paper are based only on data from the first year (before toads arrived). Growth rates and ages at maturity of the monitors were apparently unaffected by toads (based on preliminary analyses), so we use the entire dataset for these variables. Our conclusions are qualitatively unaffected by inclusion versus exclusion of data from the second year.
The yellow‐spotted monitor (“goanna”) is tropical Australia's largest lizard species, with males attaining snout‐vent‐lengths (SVLs) of > 600 mm, and body masses of > 7 kg (Pianka and King 2004; see Figure 1). Adult males grow > 3 times heavier than females (Shine 1986). Hatchlings average 140 mm SVL (Pianka and King 2004), and maturation is attained at around 390 mm SVL in males and 310 mm SVL in females (Shine 1986). Yellow‐spotted monitors are active for most of the year, but estivate in burrows during the late dry season (July–November, depending on local conditions: Christian et al. 1995), emerging with the first monsoonal rains. At our study site mating occurs in the mid‐wet season (December to February, but instances recorded in May), with oviposition in May/June and hatching in November to January (GWF, unpublished data). Female yellow‐spotted monitors lay eggs in multi‐chambered communal burrows that can be more than 4 m deep (Doody et al. 2014, 2020). Clutch sizes range from 6 to 14 eggs (Pianka and King 2004); we recorded one clutch of 9 eggs in a female that we dissected after she was consumed then regurgitated by a black‐headed python ( Aspidites melanocephalus ) in April. Yellow‐spotted monitors are generalist predators and have been identified as a keystone species, regulating trophic interactions in floodplain foodwebs (Shine 2010; Brown et al. 2013; Doody et al. 2015; Ward‐Fear et al. 2016).
FIGURE 1.
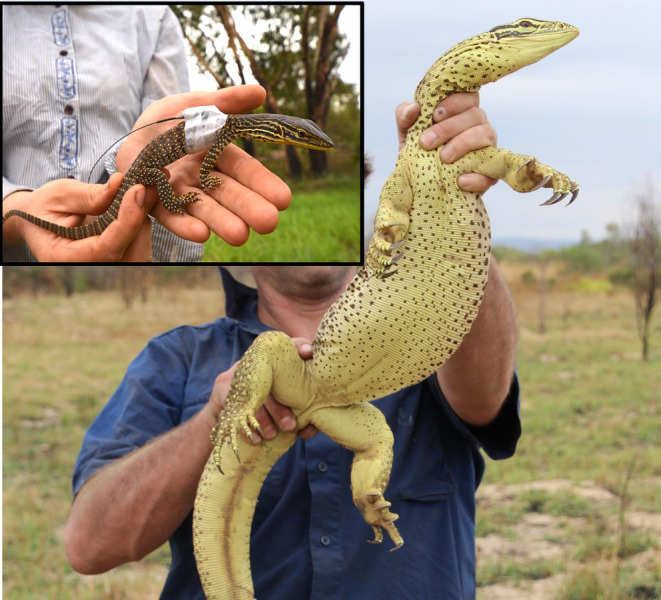
A male yellow‐spotted monitor Varanus panoptes that was first captured as a hatchling in November 2013 (inset), and radio‐tracked as it grew into a large adult over 18 months (pictured later, in May 2015). Photo credit: Georgia Ward‐Fear.
2.2. Radiotelemetry
Between November 2013 and January 2016 we radio‐tracked 110 yellow‐spotted monitors (Female lizards n = 52; Male lizards n = 58). During 15 three‐week‐long field trips, we searched for monitors between 05:00 h and 11:00 h each day; hence, new individuals were recruited to the study through time. By collaborating with indigenous rangers, we were able to collect lizards exhibiting a wide array of behavioural phenotypes (Ward‐Fear et al. 2018, 2019).
Monitors were captured by hand and transported back to the research station where we recorded SVL and body mass and took tissue samples from the tail tip for genetic sex determination (see Appendix S1 for methodology). We attached a Very High Frequency (VHF) radio transmitter to the tail of each monitor (Holohil RI‐2B, 15 g, < 5% total body mass) following the methods of Madsen and Ujvari (2009) and released the lizard back into the field at its point of capture within 6 h; telemetry began 3 days post‐release. We tracked monitors at least twice per field trip (but also opportunistically) for as long as they were alive and could be located (mean number of observations per individual 12.2, range 5–40 observations). Throughout the study we opportunistically recorded information on behaviour, ecology and life‐history attributes of the animals.
2.3. Abundance
We estimated minimum population sizes in the first year of our study (before cane toads arrived) using a combination of lizards captured for telemetry, plus other individuals seen but not captured at the same sites. For the purposes of abundance calculations, we divided the wider floodplain into four segments, each associated with a separate riparian system. Searches for goannas occurred along rivers, where we counted every unmarked individual seen during morning surveys. To avoid counting uncaptured individuals more than once each day, we conservatively scored an animal as “already sighted” if it was similar in size and location to animals previously seen. Our index of minimum abundance per site was the number of yellow‐spotted monitors known to be living in an area at any one time. In addition to the 85 animals that we captured in year one, we made an additional 137 sightings of unmarked individuals. We encountered an average of one unmarked adult monitor per 2 h of search effort, even after most of our known individuals had been caught and were being tracked. Based on weekly encounter rates of unmarked individuals at each site we added an additional 5–10 adult animals in total, to our local count data. This conservative “correction” was designed to compensate for the high numbers of unmarked individuals.
We mapped surface area polygons of the search areas around each riparian system and calculated the minimum density of yellow‐spotted monitors per square kilometre in each of the four sites. We mapped the surface area of wet‐seasonal watersheds based on vegetation imagery, ground truthing and locations of radio‐tracked goannas across the floodplain. Based on these data we calculated the minimum density of adult monitor lizards per square kilometre in each of four sites (subsections of the floodplain).
2.4. Calculation of Growth Rates and Ages
We calculated growth rates using repeated measurements of SVL and body mass (g) taken on 17 males, 11 females and 4 hatchlings (total N = 32). Larger individuals were measured every three to six months, whereas juveniles were measured as often as possible. From the SVL measurements we calculated a von Bertalanffy (1957) curve to estimate growth rates (size vs. age); see Appendix S1.
2.5. Reproduction and Mortality
Over the course of the study we made 1172 observations of radio‐tracked monitors, only 7 of which were opportunistic encounters (i.e., a telemetered lizard was rarely sighted except by following the signal from its transmitter) plus 256 sightings of non‐telemetered animals. We inferred sexual maturity for lizards seen mating or engaged in courtship, or seen at nesting warrens (GWF, unpublished data). Gravid females were readily identifiable by their distended abdomens. We witnessed 27 instances of radio‐telemetered individuals with mates, one full sequence of courtship then mating (lasting at least 4 days), 13 instances of females nesting and an additional 18 instances of individuals thought to be engaging in mating and/or nesting in “warren” burrow systems. We also recorded 25 predation events on yellow‐spotted monitors by pythons (see Figure 2).
FIGURE 2.
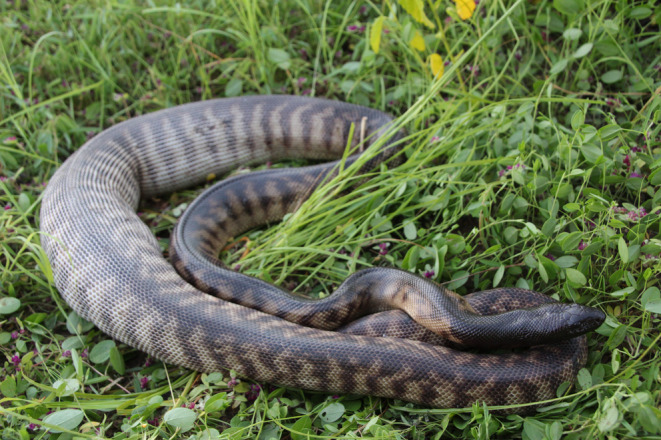
One of our radio‐tracked yellow‐spotted monitors ( Varanus panoptes ) was consumed by this black‐headed python ( Aspidites melanocephalus ). We tracked this python until it passed the transmitter. Photo credit: Georgia Ward‐Fear.
2.6. Energy Requirements and Rates of Prey Consumption
To estimate the annual rate of prey consumption by varanid lizards at Oombulgurri, we created energy budgets both on a per‐individual basis and also for the annual offtake of prey by yellow‐spotted monitors at our study site. Overall energy expenditure by an individual goanna during its annual period of activity (kJ per kg of goanna per day/month) was estimated as the sum of:
metabolic expenditure, from data on body mass (current study) combined with previous studies on mass‐specific metabolic rates of active and inactive V. panoptes in a climatically similar site (Christian et al. 1995);
allocation of energy to biomass growth, from growth rates in mass (calculated in the current study) combined with data on the energetic content of lizard tissue (Peterson et al. 1999); and
(for females only) allocation of energy to a clutch of eggs, based on mean clutch sizes and egg masses (from 6–14 eggs at 30‐80 g each) and caloric content of eggs (5.8 cal/mg–7.2 cal/mg Tinkle and Hadley 1975; Angilletta and Sears 2001).
To simplify our calculations, we averaged energy expenditure across the entire annual period of activity (November–July). For each sex, we created a monthly mean value by averaging the data for all our male and female animals. To calculate total intake of prey per lizard, we used published estimates of gross conversion efficiency for omnivorous lizards of 80% (the percentage of ingested energy that is available for allocation to metabolism, growth, and reproduction: Buffenstein and Louw 1982; Wehrle and German 2023) and caloric content relative to mass for the most common prey species consumed by V. panoptes at our study site (see Ward‐Fear, Shine, and Brown 2020 for dietary data, Grayson et al. 2005 for caloric content relative to mass). Because Varanus panoptes is a generalist predator, consuming multiple types of prey each day, we averaged the values for all prey items to create a standardised value of “gm of mixed prey” required to support the energy budgets of male and female lizards. To calculate total offtake of prey per square kilometre, we multiplied the per‐capita consumption by the estimated upper and lower abundance of yellow‐spotted monitors on the Oombulgurri floodplain.
2.7. Comparison With Sympatric Lace Monitor ( Varanus varius )
We directly compared the life‐history and dietary traits of Varanus panoptes with those of a morphologically similar species, the lace monitor ( Varanus varius ) in eastern tropical Australia (a region where the two large varanid taxa are broadly sympatric). We then looked at the magnitude of cane toad‐induced impact on both species over the long term.
2.8. Statistical Analysis
Normality and homogeneity of variance were confirmed for all variables. All continuous variables (age, number of days tracked, SVL, mass etc.) were transformed with natural log (Ln) prior to analyses.
2.8.1. Seasonal Growth Rates
We ran full factorial ANOVAs with growth rates (i.e., the increase in mass between successive captures, standardised as gm/day) as our dependent variable, and independent variables of sex, season (wet = November to April; dry = May to October) and the interaction between the two.
2.8.2. Reproductive Age and Survivorship
we analysed data on the age of all telemetered individuals that were recorded as mating or nesting during the study. The dependent variable in our ANOVA was the inferred age of the animal at the time of mating (obtained from the von Bertalanffy growth curve at initial capture and adding number of days tracked to that point) and the independent variable was sex (male/female). To explore sex differences in survivorship, we conducted ANOVAs to compare the mean number of days animals were tracked alive and the inferred ages of those animal at their time of death.
We then created a population profile by calculating probable age at first capture from body size (using the von Bertalanffy growth curve then adding the number of days that the animal was tracked until it died). We used ANOVA to compare the average “ages” of males and females within the population, as well as the distribution of age classes between the sexes.
3. Results
3.1. Rates of Growth
Yellow‐spotted monitors grew rapidly with growth rates diverging between the sexes at around 300 mm SVL, when animals were about 160 days old (5.3 months; see Figure 3 and Figure S1). Based on their emergence from natal nests in the early wet season, this sex‐based divergence in rates of growth would occur near the end of the animal's first wet season (March–May). During the wet season, males increased in mass faster than did females (mean 7.4 vs. 3.3 g/day; F 1,31 = 4.59, p = 0.04), and males grew faster in the wet season than in the dry season (mean 7.4 vs. 2.2 g/day; F 1,29 = 4.37, p = 0.046). We do not have data on dry‐season growth rates for females (see Figure 1).
FIGURE 3.
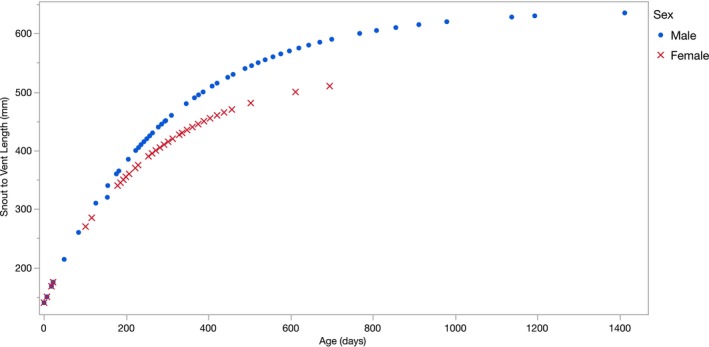
A von Bertalanffy growth curve calculated from rates of increase in snout‐vent length of 32 radio‐tracked yellow‐spotted monitors, Varanus panoptes (M: 17, F: 11, J: 4). Males and females begin to diverge in growth rates at around 160 days of age (5.3 months), when they are about 300 mm SVL. Curves were not extrapolated past the highest SVL measured for each sex in our population.
Noteworthy records of rapid mass increase include an adult male gaining 2.36 kg over 99 days mid‐wet season (increasing his body mass by 145%, from 1.63 kg to 3.99 kg), and a young male gaining 1.28 kg over 150 days in the wet season (increasing his body mass by 312%, from 410 g to 1.69 kg; see Table S1). Fitting these data to a von Bertalanffy curve, we estimate that both sexes attain reproductive size (310 mm females, 390 mm males: Shine 1986) at around 200 days of age (< 7 months; Figure 3).
3.2. Inferred Ages of Reproducing Lizards
We recorded 13 females reproducing within 1 year of birth (i.e., in the wet season following the one in which they were hatched); another nesting female was 2 years old. Of 13 males that we recorded mating, only two were within 1 year of birth; the remaining 11 were 2 years or older (Mean age F 403 days, M 729 days; min F 203 days, M 277 days; Max F 862 days, M 1153 days; sexes differ in mean age at mating: F 1,26 = 12.94, p = 0.001). See Table S2 for summary of morphology and age of sampled lizards.
A review of published data suggests that yellow‐spotted monitors are unusual among large‐bodied varanid lizards in maturing and reproducing at such a young age. Most data for monitors are based on captive lizards, which tend to reproduce at younger ages than do conspecifics in the wild (based on species for which data of both types are available: Auliya and Koch 2020). Nonetheless, most large‐bodied varanids delay reproduction until they are 18–24 months of age (Figure 4). Yellow‐spotted monitors (shown by the square symbol in Figure 4) are an exception in this respect, with one record of reproduction in captive animals at 6.5 months of age (Nabors 1997; see square symbol in Figure 4), the same age as we have inferred for first reproduction in the wild. Other reports, however, suggest longer delays before maturation (Auliya and Koch 2020; Figure 4).
FIGURE 4.
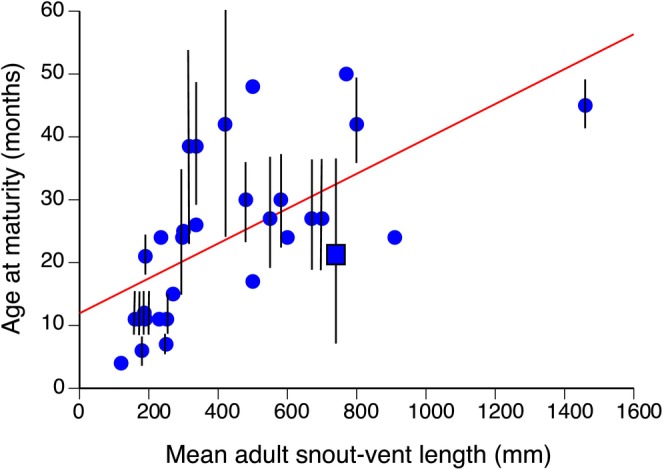
Relationship between mean adult body size and age at maturation in 31 species of varanid lizards, based on data from the review by Auliya and Koch (2020). The graph shows age at maturity (primarily records from captive animals) plotted against mean body size (snout‐vent length, = SVL) per species. Mean body sizes are average of data for males and females, where available, and vertical lines show the range of ages at maturation recorded for each taxon. Dots show mean values, and the square and associated vertical line shows data for yellow‐spotted monitors Varanus panoptes .
3.3. Survivorship
The interval between capture and death averaged shorter for female lizards than for males during our radio‐tracking study (mean days tracked alive: F 108 days; M 200 days; F 1,51 = 4.56, p = 0.038).
Prior to the arrival of cane toads, all 14 deaths that we recorded of adult radio‐tracked yellow‐spotted monitors were due to predation by black‐headed pythons ( Aspidites melanocephalus , N = 5) or olive pythons (Lialis olivaceus, N = 2) with a further seven deaths due to unknown python species (i.e., transmitters were found in python faeces rather than inside a python). On average, female monitors killed by pythons were younger than were the males (Mean F 433 days; M 735 days; F 1,14 = 13.5, p = 0.003) and all seven females were close to warren burrows when killed (and hence, likely were nesting). Another nine telemetered monitors died due to python predation later in this study, but we excluded these animals from the above analyses because toad‐induced mortality modified sex and size distributions within the monitor population (Ward‐Fear, Brown, and Shine 2024).
3.4. Age Profile of the Population
Mean ages were greater for males than for females (Mean F 263 days; M 465 days; F 1,112 = 22.97, p < 0.0001) and males had a wider spread in age classes (Figure 5). Most females were < 18 months old, with only four individuals in older classes. In contrast, several males were 3 years old, and one was estimated to be 4 years old when it died (Figure 5).
FIGURE 5.
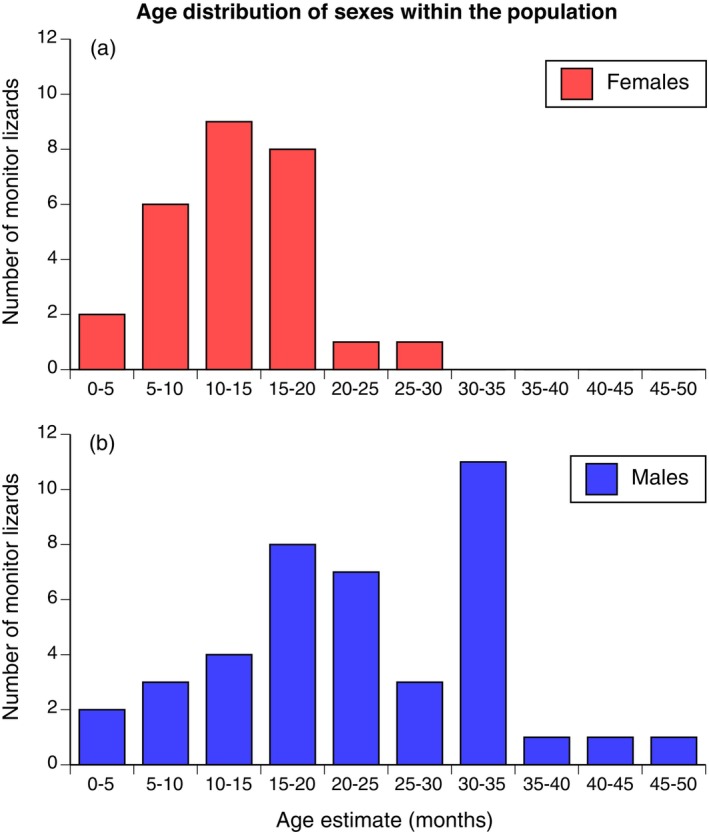
The frequency distribution of age groups (as inferred from body sizes and growth rates) of yellow‐spotted monitors. To obtain this age estimate we calculated probable age at first capture from body size (using the von Bertalanffy growth curve, Figure 3) then added the number of days that the animal was tracked until it died.
3.5. Abundance
Radiotelemetry showed that yellow‐spotted monitors had strong site fidelity (Ward‐Fear, Shine, and Brown 2020). The minimum number of adult yellow‐spotted monitors known to be present in each river system at the same time was as follows: Dorrimon 15 monitors per sq. km; Allison River 20 per sq. km; Larramon 22 per sq. km; Patrick River 33 per sq. km. From our watershed polygons (i.e., ground‐truthed areas of complex and resource‐rich habitat favoured by these monitors) we calculated that the Oombulgurri floodplain contains 76.4 km2 of high‐quality habitat. Based on the lowest and highest density records of adult yellow‐spotted monitors present concurrently at sites, we estimate that the floodplain supported between 1146 and 2521 adult yellow‐spotted monitors at any one time during our study.
3.6. Energy Requirements and Rates of Prey Consumption
To sustain maintenance, growth and reproduction, female lizards would need an average FMR of 183.04 kJ/day (range 38.12–310.73 [1.4 kg lizard]; see Appendix S1). Females would need to increase their metabolism by 45%–52% to produce an annual clutch of eggs. For male lizards, we estimated an average FMR of 272.3 kJ/day (range: 66.87–503.82 [3.9 kg lizard]). The largest and fastest‐growing males had nearly double the energy requirements (approx. 500 kJ/day).
To support these energy expenditures, an average‐sized adult female monitor (1.08 kg) would need to consume 37 g of mixed prey per day, and a male (2.14 kg) would need to consume 55 g per day. A large male monitor (> 3.5 kg) would need 100 g of prey per day. Across the nine‐month annual activity period of these monitors at our field site, an average‐sized female monitor would require 9.9 kg of prey per annum, an average‐sized male would require 14.8 kg and a large male would require 27 kg (see Table 1). Based on the mass and caloric content of prey species, the daily prey intake of an average‐sized female yellow‐spotted monitor would translate into approximately 17 spiders, 7 beetles, 2 frogs, 1 lizard or 0.25 rats, an average‐sized male would eat approximately 25 spiders, 10 beetles, 3 frogs, 1.3 lizard or 0.35 rats, and a large male would require approximately 46 spiders, 19 beetles, 5 frogs, 2.4 lizards or 1 rat (see Table S3 for monthly totals per individual lizard).
TABLE 1.
Estimates of biomass consumption by the population of yellow‐spotted monitors ( Varanus panoptes ) at our field site, the Oombulgurri floodplain. We calculated and averaged monthly energy budgets for average‐sized males and females (and for larger males) based on growth rates measured in our study animals. Using site‐specific dietary information for this generalist predator, we calculated how many grams of “mixed prey” would be required to support an average male, female and large male lizard over three timescales: per day, per month, and throughout their annual activity period (provided in kilograms, shown in bold). We then modelled the collective biomass consumption of the adult goanna population each year (in tonnes, shown in bold), at the lower (1146 animals) and upper (2521 animals) population estimates.
| Calculation | Time period | Female (5491.4 kJ/month) | Male (8170.2 kJ/month) | Larger male (15,100 kJ/month) |
|---|---|---|---|---|
| Biomass of mixed prey required | Per day | 37 g | 55 g | 100 g |
| Per month | 1098 g | 1634 g | 3019 g | |
| Per year | 9991 g | 14,865 g | 27,473 g | |
| 9.99 kg | 14.87 kg | 27.47 kg | ||
| Population of average adult lizards with 50/50 sex ratio | Annual activity period | Lower pop. estimate | 14.25 t | Prey biomass offtake collectively |
| Upper pop. estimate | 31.31 t |
Multiplying these individual rates of annual prey consumption by population estimates (with a 50/50 sex ratio) for our field site, we calculate that prior to toad invasion the yellow‐spotted monitors at our study site consumed between 14.3 t of prey per annum (at the lower population estimate of 1146 adult lizards) and 31.3 t per annum (at the higher estimate of 2521 adult lizards). This population estimate does not include juvenile lizards. Rates of prey consumption are based on the caloric requirements of average‐sized males and females at our study site.
3.7. Comparison With Sympatric Lace Monitors ( Varanus varius )
Despite their similar sizes and diets, the two varanid species differ in multiple life‐history traits as well as in their resilience to cane toad invasion (Table 2). Toad invasion has resulted in a much greater population decline, and less recovery, in the species with a “faster” life history ( V. panoptes ) than in the congener with a “slower” life history ( V. varius ).
TABLE 2.
Comparison of life history, behaviour and cane toad impact between the yellow‐spotted monitor ( Varanus panoptes ) and the lace monitor ( Varanus varius ). Despite attaining similar sizes, and living sympatrically in northeastern Australia, yellow‐spotted monitors exhibit a faster pace of life than do lace monitors, and exhibit greater long‐term population impacts from invasive cane toads. SVL, snout‐vent length.
| Species | Yellow‐spotted monitor ( Varanus panoptes ) | Lace monitor ( Varanus varius ) | References |
|---|---|---|---|
| Diet specialisation | Seasonal generalist | Seasonal generalist | Losos and Greene (1988); Ward‐Fear, Shine and Brown (2020) |
| Maximum size | 650 mm (SVL); 8 kg (avg 5 kg) | 760 mm (SVL); 14 kg (avg 8 kg) | Thompson, Pianka, and JMcEachran (2001) |
| Age at sexual maturity | < 1 year | 4–8 years | Ward‐Fear, Shine, and Brown (2024); Carter (1992) |
| Mean clutch size (wild) | 11 | 8 | Thompson, Pianka, and JMcEachran (2001) |
| Average longevity (wild) | 3–8 years | > 20 years | This paper; Auliya and Koch (2020) |
| Field metabolism CO(2) g(−1) h(−1) | 0.24 (early wet season) | 0.05 (spring) | Christian et al. (1995), Guarino et al. (2002) |
| Pace of Life | Fast | Slow | This paper |
| Habitat use | Open | Wooded | Lei and Booth (2018) |
| Impact of cane toads | Major impact, no recovery | Low‐medium impact, rapid recovery | Jolly, Shine, and Greenlees (2016), Pettit, Crowther, et al. (2021) |
4. Discussion
Intuition suggests that a giant lizard is likely to be old (because it will take a long time to attain that size), and that large predators will occur at low population densities (because their energy needs are too great to sustain high numbers: Colinvaux 1979). Those predictions are met by many species, but not all. For example, most diverse phylogenetic lineages include species with life histories that are much “faster” than those of similar‐sized related taxa (e.g., Miles and Dunham 1992; Webb, Christian, and Fisher 2002; FitzGibbon 2015); and even large predators sometimes occur at high population densities (e.g., Madsen et al. 2006; Ajtić et al. 2013). In the case of the yellow‐spotted monitor, our data show that these large lizards grow rapidly, generally die early, and can occur at high population densities. In turn, those attributes may exacerbate the assemblage‐level ecological impacts of invasive cane toads.
Compared to other large‐bodied species of lizards, yellow‐spotted monitors appear to be unusual in their “fast” growth and maturation. Of the few studies that have quantified rates of maturation in free‐ranging varanids, most have concluded that individuals of large‐bodied taxa delay maturation until they are at least 2 years old (e.g., Varanus bengalensis [> 3 years]: Auffenberg 1994; V. komodoensis [8–11 years]: Laver et al. 2012; V. olivaceous [2–3 years]: Auffenberg 1988; V. niloticus [> 2 years]: de Buffrénil and Hemery 2002; V. salvator [> 2 years]: Andrews 1995; V. varius [4–8 years]: Carter 1992). Only small‐bodied varanid taxa mature less than a year after hatching (as we have recorded for yellow‐spotted monitors), even in well‐fed captives under conditions that accelerate growth and maturation (see data in Auliya and Koch 2020; and see Figure 4). This correlation between life‐history pace and body size conforms to general patterns within the pace of life continuum (Dobson and Oli 2008). We note, however, that age at maturity may vary among populations within a species. Although Nabors (1997) reported maturation at around 6 months in yellow‐spotted monitors (Nabors 1997), as in our field populations, other sources have reported maturation at two to three years of age (Auliya and Koch 2020). Inter‐population variation in age to maturation and longevity is widespread in lizards (e.g., Wapstra, Swain, and O'Reilly 2001), including varanids (de Buffrénil and Castanet 2000; de Buffrénil and Hémery 2002). Female varanids tend to have shorter lifespans than conspecific males even in captivity, hinting at high costs of egg production and oviposition (Frýdlová et al. 2013). More generally, individuals of most lizard taxa appear to mature at one to two years of age, with age at maturity increasing with adult body size (e.g., Dunham and Miles 1985; Miles and Dunham 1992). Hence, the combination of large body size and rapid maturation in yellow‐spotted monitors is unusual.
Why do yellow‐spotted monitors have such “fast” life histories? The answer likely involves both phenotypic plasticity and adaptation. Age at maturation is highly plastic in reptiles, such that increased temperature and food supply accelerate growth and hence, maturity (e.g., Sorci, Clobert, and Belichon 1996). Riparian habitats on the Oombulgurri floodplain offer diverse and abundant prey (Ward‐Fear, Shine, and Brown 2020) and a consistently hot climate (Bureau of Meteorology 2023). Those conditions increase growth rates and thus decrease the time needed to achieve adult body size. In keeping with that proximate effect, many tropical reptiles exhibit faster growth and earlier maturation than do related taxa from cooler regions (e.g., Oxyuranus Shine and Covacevich 1983; Malayopython Shine, Harlow, and Keogh 1998; Chlamydosaurus Griffiths 1999; Acanthophis Webb, Christian, and Fisher 2002; Tropidonophis Brown and Shine 2002).
Local thermal conditions also can affect ages at maturation via selection (Adolph and Porter 1996). Life‐history theory predicts that stochastic variation in resource availability may increase the fitness advantages to early maturation (Engen and Sæther 2016); and that early maturation enhances individual fitness (lifetime reproductive output) under conditions that facilitate rapid growth but impose high levels of extrinsic mortality (e.g., Hutchings 1993). The Oombulgurri population of yellow‐spotted monitors satisfies these conditions. First, annual variation in the timing and amount of wet‐seasonal rainfall creates stochasticity of resource levels (e.g., Madsen et al. 2006). Second, rapid growth is possible because food is abundant and temperatures are high. Third, extrinsic mortality is frequent, with many of our radio‐tracked lizards (up to 650 mm SVL) being killed and consumed by pythons. The vulnerability of these giant lizards is surprising, but their burrows provide little opportunity for escape from an incoming python. Communal nesting in deep burrows may exacerbate that vulnerability, because the location of these nest‐sites is consistent across years (Doody et al. 2020; GWF, unpublished data) and hence is predictable. It would be interesting to study longevity of V. panoptes in other areas. For example, in sites where predatory pythons are less abundant, we expect that some individual monitors will live much longer than was the case at our Oombulgurri site.
High mortality rates mean that many female yellow‐spotted monitors reproduce in only a single season (Figure 5). That situation may help to explain the remarkable nesting ecology of this species, whereby females dig very deep (to > 4 m) burrows that provide stable moisture levels (Doody et al. 2020). Because adult female yellow‐spotted monitors are unlikely to survive to another nesting season, selection to maximise survival rates of embryos likely is intense: a female's fitness depends upon the offspring from her first clutch. The optimal life‐history tactic for a reproducing female with high exposure to extrinsic mortality (predation) may be to increase reproductive effort into activities such as nest‐digging, even to the point of compromising her own survival after laying (Frýdlová et al. 2013).
Many male monitors in our study population lived longer than females (Figure 5), and grew to substantially larger sizes. Continued growth in males may reflect a sexually‐selected advantage to large body size. Our data confirm that larger, older males obtained more matings than did their smaller, younger rivals (see Section 3). Consistent use of the same nesting sites may increase access to females for males as well as for predatory pythons, intensifying male–male rivalry (Pianka and King 2004). Thus, rapid maturation may cascade through to affect other aspects of the species' life history, ranging from deep‐nesting to extreme sexual size dimorphism.
The “fast” life history of yellow‐spotted monitors also may increase their vulnerability to cane toad invasion, because a large lizard must feed frequently in order to sustain high costs of metabolism, growth and reproduction. Such high feeding rates of generalist predators, in turn, favour risky foraging tactics, consistent with our comparison between yellow‐spotted monitors and lace monitors ( Varanus varius ) in tropical Australia. Although they are similar in mean body size to V. panoptes , lace monitors exhibit a slower pace of life. For example, they have a lower metabolic rate (Christian et al. 1995), grow more slowly and reach sexual maturity later (Carter 1992), and generally live longer in the wild (Auliya and Koch 2020). Those “slow” traits likely reduce the intensity of selection for early resource acquisition that promotes risky foraging tactics. Another key (and possibly causal) difference between the two large varanid species may lie in their preferred habitats. Yellow‐spotted monitors are found primarily in open habitats (Shine 1986; Ward‐Fear et al. 2018), where active searching for prey during daylight hours exposes animals to predators (Biro et al. 2004); and even their nocturnal burrows may be relatively easy for predators to locate in the open environments utilised by these large lizards. In previous work, we have shown that bolder individual V. panoptes remain closer to resource‐rich riparian zones and (perhaps as a result) experience higher rates of wet season predation (Ward‐Fear et al. 2018). Like yellow‐spotted monitors, lace monitors are large diurnal animals with extensive home ranges, but they predominantly inhabit forested habitats (Lei and Booth 2018) and climb trees when disturbed. Within populations, individual lace monitors that spend time in more open habitats are bolder (Pettit, Brown, et al. 2021). These patterns support the idea that by increasing exposure to predators, open habitats favour distinctive behavioural and life‐history traits in varanid lizards.
Risky foraging tactics may include a preparedness to consume novel prey items. Both yellow‐spotted and lace monitors are generalist species, consuming a similar diversity of prey types (including invertebrates, reptiles, frogs, mammals, eggs, birds, and carrion: Shine 1986; Losos and Greene 1988; Ward‐Fear, Shine, and Brown 2020). At the leading edge of the cane toad invasion, both varanid species have been reported to consume cane toads and to die as a result (e.g., Jolly, Shine, and Greenlees 2016; Ward‐Fear et al. 2016). Nonetheless, long‐term impacts of toad invasion differ between the two varanid species. Yellow‐spotted monitors have been virtually extirpated, whereas lace monitors remain abundant (Pettit, Crowther, et al. 2021). The resilience of lace monitors appears to arise from cautious foraging, whereby novel prey items (such as cane toads) are evaluated before being swallowed (Jolly, Shine, and Greenlees 2016). Bolder individuals of both species are disproportionally at risk from cane toads (at least initially; GWF ref., Pettit, Brown, et al. 2021). Collectively, these comparisons show that the yellow‐spotted monitor is faster lived, less risk‐averse and more heavily impacted by toad invasion than is the lace monitor.
The two large varanid species also differ in the degree to which their extirpation affects sympatric fauna. First, unlike the lace monitor, the yellow‐spotted monitor is an “ecosystem engineer”; it digs extensive burrow systems for nesting (Doody et al. 2014) and frequently excavates shorter burrows for nocturnal refuges (Ward‐Fear et al. 2018). Those burrows offer distinctive abiotic conditions and are exploited by many other species. Second, the high feeding rates, generalised diet and high abundance of yellow‐spotted monitors mean that population collapse of this species (due to cane toad invasion) ramifies through the food web, inducing cascading effects at lower trophic levels (Shine 2010; Brown et al. 2013; Doody et al. 2015; Ward‐Fear et al. 2016; Ward‐Fear, Shine, and Brown 2020). Increased survival rates of species consumed by monitors modify the structure and dynamics of the floodplain faunal assemblage (Ward‐Fear, Shine, and Brown 2020). Lower abundances and feeding rates of lace monitors mean that the ecosystem‐wide effects of their removal (due to poisoning by toads) may be less than for yellow‐spotted monitors (but see Pettit, Ward‐Fear, and Shine 2021).
Another varanid species for which a comparison is possible is a species in a cooler climate. Annual food intake by Varanus rosenbergi on Kangaroo island in South Australia has been estimated at around 4.7 kg per annum for a 1 kg lizard (Green, Dryden, and Dryden 1991), about half that consumed by an average adult female yellow‐spotted monitor (~1 kg at our site also). If we compare more widely, looking at endothermic as well as ectothermic predators, two other taxa with similar generalist diets that occur in Oombulgurri are the dingo (Canis lupis) and the black kite ( Milvus migrans ). An adult dingo requires around 302,400 kJ/month (Tatler et al. 2021) and a black kite requires 12,339 kJ/month (Tarboton 1978). Although energy intake per individual is higher for these endotherms than for monitors (median 8170 kJ/month), population densities are far lower for dingos (0.15 individuals/sq. km: Gabriele‐Rivet et al. 2020) and black kites (0.2/sq. km: Gosper and Holmes 2008) than for yellow‐spotted monitors (median = 25 monitors/sq. km, from our data). Accordingly, the total energy offtake by yellow‐spotted monitors is much higher than for the endotherms. To support their monthly energy requirements, a population of dingos would consume 50 pale field rats ( Rattus tunneyi ) per square kilometre, a population of black kites would consume three rats, and a population of yellow‐spotted monitors would consume 258 rats.
The link between “fast” life histories, vulnerability to invasion, and wider impacts of invasion, is not unique to monitors. Another native predator decimated by cane toad invasion exhibits an even “faster” life history. Once abundant across the wet‐dry tropics (Oakwood 2008), populations of cat‐sized marsupial carnivores (Northern Quolls Dasyurus hallucatus ) have decreased dramatically due to toad invasion (e.g., O'Donnell, Webb, and Shine 2010; Indigo et al. 2023). Quolls of both sexes mature at a year of age, and rarely survive for more than 18 months (Oakwood 2000) and thus, like the monitors, they eat vast amounts of food, of a diverse array of prey types, and even a single year's recruitment failure is devastating for population viability (Moro, Dunlop, and Williams 2019). Hence, many of the arguments we have made about yellow‐spotted monitors apply with equal force to quolls. Other predators fatally poisoned by toads (such as freshwater crocodiles, Crocodylus johnstoni ) have “slower” life histories, potentially reducing both vulnerability to toads (due to lower feeding rates by predators) and the trophic cascades resulting from predator mortality (because mortality is concentrated on only a subset of crocodile size classes: Fukuda et al. 2016; Ward‐Fear et al. 2024).
More generally, a species' life history will influence how it experiences different conservation challenges (Albaladejo‐Robles, Böhm, and Newbold 2023). For example, species with faster life histories often adapt better to anthropogenic habitat degradation (which indirectly changes carrying capacity), but slower‐lived species may deal better with habitat modification than with excessive harvesting, which impacts survival directly (González‐Suárez, Gómez, and Revilla 2013). Furthermore, a species can alter its pace of life in response to environmental stressors (Prabh et al. 2023). “Invasions” are not as easy to categorise, because impacts from invasive species are diverse in nature, and depend upon the unique characteristics of the invaded ecosystems as well as of the invader itself. Overall, we know very little about how an animal's pace of life influences its vulnerability to invader impacts. The native taxa impacted by invasive species encompass an enormous diversity in life‐history traits, and it may often be the case that “faster” life histories:
increase vulnerability of a native species by favouring relatively unselective feeding at high rates (as in the current study) or via other pathways such as high activity levels (increasing exposure to invasive predators) or dependence upon high resource levels (which can be reduced by direct or indirect invader effects: Biro and Stamps 2008); and
magnify downstream impacts of the invader on foodwebs because a native species with a “fast” life‐history requires high rates of resource consumption to sustain rapid growth, early maturation and frequent reproduction (Auer et al. 2018). Such effects may ramify to higher as well as lower trophic levels, because invader impacts on a highly abundant organism or keystone species with high rates of energy throughput likely will have more effect on consumers of that organism than would be the case for slowly‐growing taxa at the same trophic level. These ideas suggest that including information on the life‐history traits of native species directly impacted by a biological invasion might help us to predict both the magnitude of direct impact, and the degree to which such an impact will cascade through foodwebs and hence, modify the broader biotic community.
Author Contributions
Georgia Ward‐Fear: conceptualization (lead), data curation (lead), formal analysis (lead), investigation (lead), methodology (lead), project administration (lead), visualization (lead), writing – original draft (equal), writing – review and editing (equal). Gregory P. Brown: conceptualization (supporting), formal analysis (supporting), methodology (supporting), supervision (equal), writing – review and editing (supporting). Lachlan Pettit: conceptualization (supporting), data curation (supporting), formal analysis (supporting), methodology (supporting). Lee‐Ann Rollins: data curation (supporting), formal analysis (supporting), methodology (supporting), resources (supporting). Richard Shine: conceptualization (supporting), funding acquisition (lead), investigation (supporting), methodology (supporting), resources (equal), supervision (equal), writing – original draft (equal), writing – review and editing (equal).
Conflicts of Interest
The authors declare no conflicts of interest.
Supporting information
Appendix S1
Acknowledgements
We thank the Balanggarra Rangers, D. Pearson, M. Bruny and numerous volunteers for help in the field. We thank M. Elphick for help with manuscript preparation. The work was supported by the Australian Research Council (grant # LP170100013 to R. Shine) and GWF was supported by a Val Street Scholarship. The research was approved by University of Sydney’s Animal Ethics Committee (AEC protocol: 2103/6034; DBCA permit: SF010079) in accordance with the international “Principles of Laboratory Animal Care”. Open access publishing facilitated by Macquarie University, as part of the Wiley ‐ Macquarie University agreement via the Council of Australian University Librarians.
Funding: The work was supported by the Australian Research Council (grant # LP170100013 to R. Shine) and GWF was supported by a Val Street Scholarship.
Data Availability Statement
Data are publicly available via the DRYAD repository at https://doi.org/10.5061/dryad.jwstqjqks.
References
- Adolph, S. C. , and Porter W. P.. 1996. “Growth, Seasonality, and Lizard Life Histories: Age and Size at Maturity.” Oikos 77, no. 2: 267–278. [Google Scholar]
- Ajtić, R. , Tomović L., Sterijovski B., et al. 2013. “Unexpected Life History Traits in a Very Dense Population of Dice Snakes.” Zoologischer Anzeiger – A Journal of Comparative Zoology 252, no. 3: 350–358. [Google Scholar]
- Albaladejo‐Robles, G. , Böhm M., and Newbold T.. 2023. “Species Life‐History Strategies Affect Population Responses to Temperature and Land‐Cover Changes.” Global Change Biology 29: 97–109. [DOI] [PMC free article] [PubMed] [Google Scholar]
- Allen, W. L. , Street S. E., and Capellini I.. 2017. “Fast Life History Traits Promote Invasion Success in Amphibians and Reptiles.” Ecology Letters 20, no. 2: 222–230. [DOI] [PMC free article] [PubMed] [Google Scholar]
- Andrews, H. V. 1995. “Sexual Maturity in Varanus salvator (Laurenti 1768) With Notes on Growth and Reproductive Effort.” Herpetological Journal 5: 189–194. [Google Scholar]
- Angilletta, M. J. , and Sears M. W.. 2001. “The Metabolic Cost of Reproduction in an Oviparous Lizard.” Functional Ecology 14: 39–45. [Google Scholar]
- Auer, S. K. , Dick C. A., Metcalfe N. B., and Reznick D. N.. 2018. “Metabolic Rate Evolves Rapidly and in Parallel With the Pace of Life History.” Nature Communications 9, no. 1: 14. [DOI] [PMC free article] [PubMed] [Google Scholar]
- Auffenberg, W. 1988. Gray's Monitor Lizard. Gainesville: University of Florida Press. [Google Scholar]
- Auffenberg, W. 1994. The Bengal Monitor. Gainesville, FL: University Press of Florida. [Google Scholar]
- Auliya, M. , and Koch A.. 2020. Visual Identification Guide to the Monitor Lizard Species of the World (Genus Varanus). 10.19217/skr552. [DOI]
- Biro, P. A. , Abrahams M. V., Post J. R., and Parkinson E. A.. 2004. “Predators Select Against High Growth Rates and Risk–Taking Behaviour in Domestic Trout Populations.” Proceedings of the Royal Society of London. Series B: Biological Sciences 271, no. 1554: 2233–2237. [DOI] [PMC free article] [PubMed] [Google Scholar]
- Biro, P. A. , and Stamps J. A.. 2008. “Are Animal Personality Traits Linked to Life‐History Productivity?” Trends in Ecology & Evolution 23: 361–368. [DOI] [PubMed] [Google Scholar]
- Brown, G. P. , and Shine R.. 2002. “Reproductive Ecology of a Tropical Natricine Snake, Tropidonophis mairii (Colubridae).” Journal of Zoology 258, no. 1: 63–72. [Google Scholar]
- Brown, G. P. , Ujvari B., Madsen T., and Shine R.. 2013. “Invader Impact Clarifies the Roles of Top‐Down and Bottom‐Up Effects on Tropical Snake Populations.” Functional Ecology 27, no. 2: 351–361. [Google Scholar]
- Bryant, L. C. , Beachy T. A., and Boves T. J.. 2020. “An Invasive Insect, Hemlock Woolly Adelgid, Indirectly Impacts Louisiana Waterthrush Nest Site Selection and Nest Survival in the Southern Appalachians.” Condor 122, no. 3: duaa027. [Google Scholar]
- Buffenstein, R. , and Louw G.. 1982. “Temperature Effects on Bioenergetics of Growth, Assimilaton Efficiency and Thyroid Activity in Juvenile Varanid Lizards.” Journal of Thermal Biology 7, no. 4: 197–200. [Google Scholar]
- Capellini, I. , Baker J., Allen W. L., Street S. E., and Venditti C.. 2015. “The Role of Life History Traits in Mammalian Invasion Success.” Ecology Lettters 18: 1099–1107. [DOI] [PMC free article] [PubMed] [Google Scholar]
- Carter, D. 1992. “Reproductive Ecology of the Lace Monitor Varanus varius in South Eastern Australia.” PhD thesis. Australian National University. 10.25911/5d6f9b8261393. [DOI]
- Christian, K. A. , Corbett L. K., Green B., and Weavers B. W.. 1995. “Seasonal Activity and Energetics of Two Species of Varanid Lizards in Tropical Australia.” Oecologia 103, no. 3: 349–357. [DOI] [PubMed] [Google Scholar]
- Clavero, M. , and García‐Berthou E.. 2005. “Invasive Species Are a Leading Cause of Animal Extinctions.” Trends in Ecology & Evolution 20, no. 3: 110. [DOI] [PubMed] [Google Scholar]
- Colinvaux, P. A. 1979. Why Big Fierce Animals Are Rare: An Ecologist's Perspective. Princeton, NJ: Princeton University Press. [Google Scholar]
- de Buffrénil, V. , and Castanet J.. 2000. “Age Estimation by Skeletochronology in the Nile Monitor ( Varanus niloticus ), a Highly Exploited Species.” Journal of Herpetology 34, no. 3: 414–424. [Google Scholar]
- de Buffrénil, V. , and Hémery G.. 2002. “Variation in Longevity, Growth, and Morphology in Exploited Nile Monitors ( Varanus niloticus ) From Sahelian Africa.” Journal of Herpetology 36, no. 3: 419–426. [Google Scholar]
- Dobson, F. S. , and Oli M. K.. 2008. “The Life Histories of Orders of Mammals: Fast and Slow Breeding.” Current Science 10: 862–865. [Google Scholar]
- Doody, J. S. , Green B., Sims R., Rhind D., West P., and Steer D.. 2006. “Indirect Impacts of Invasive Cane Toads ( Bufo marinus ) on Nest Predation in Pig‐Nosed Turtles ( Carettochelys insculpta ).” Wildlife Research 33, no. 5: 349–354. [Google Scholar]
- Doody, J. S. , James H., Ellis R., et al. 2014. “Cryptic and Complex Nesting in the Yellow‐Spotted Monitor, Varanus panoptes .” Journal of Herpetology 48, no. 3: 363–370. [Google Scholar]
- Doody, J. S. , McGlashan J., Fryer H., et al. 2020. “Plasticity in Nest Site Choice Behavior in Response to Hydric Conditions in a Reptile.” Scientific Reports 10, no. 1: 1–10. [DOI] [PMC free article] [PubMed] [Google Scholar]
- Doody, J. S. , Soanes R., Castellano C. M., et al. 2015. “Invasive Toads Shift Predator–Prey Densities in Animal Communities by Removing Top Predators.” Ecology 96, no. 9: 2544–2554. [DOI] [PubMed] [Google Scholar]
- Dunham, A. E. , and Miles D. B.. 1985. “Patterns of Covariation in Life History Traits of Squamate Reptiles: The Effects of Size and Phylogeny Reconsidered.” American Naturalist 126, no. 2: 231–257. [Google Scholar]
- Engen, S. , and Sæther B. E.. 2016. “Optimal Age of Maturity in Fluctuating Environments Under r‐and K‐Selection.” Oikos 125, no. 11: 1577–1585. [Google Scholar]
- Feit, B. , Gordon C. E., Webb J. K., et al. 2018. “Invasive Cane Toads Might Initiate Cascades of Direct and Indirect Effects in a Terrestrial Ecosystem.” Biological Invasions 20, no. 7: 1833–1847. [Google Scholar]
- FitzGibbon, S. I. 2015. “Reproductive Ecology of the Northern Brown Bandicoot ( Isoodon macrourus ) in Habitat Fragments of Urban Brisbane.” Australian Mammalogy 37, no. 2: 253–259. [Google Scholar]
- Frýdlová, P. , Hnízdo J., Velenský P., et al. 2013. “Easy Life of Males? Indirect Evidence That Growth Is Easier Than Egg Production in Mangrove‐Dwelling Monitor Lizards (Varanus indices).” Acta Herpetologica 8, no. 2: 105–113. [Google Scholar]
- Fukuda, Y. , Tingley R., Crase B., Webb G., and Saalfeld K.. 2016. “Long‐Term Monitoring Reveals Declines in Endemic Australian Freshwater Crocodiles Following Invasion by Exotic Cane Toads.” Animal Conservation 19, no. 1: 105–187. [Google Scholar]
- Gabriele‐Rivet, V. , Arsenault J., Brookes V. J., Fleming P. J. S., Nury C., and Ward M. P.. 2020. “Dingo Density Estimates and Movements in Equatorial Australia: Spatially Explicit Mark‐Resight Models.” Animals 10, no. 5: 865. [DOI] [PMC free article] [PubMed] [Google Scholar]
- Gallardo, B. , Bacher S., Bradley B., et al. 2019. “InvasiBES: Understanding and Managing the Impacts of Invasive Alien Species on Biodiversity and Ecosystem Services.” NeoBiota 50: 109–122. [Google Scholar]
- González‐Suárez, M. , Gómez A., and Revilla E.. 2013. “Which Intrinsic Traits Predict Vulnerability to Extinction Depends on the Actual Threatening Processes.” Ecosphere 4, no. 6: 76. [Google Scholar]
- Gosper, D. , and Holmes G.. 2008. “A Survey of Diurnal Raptors in the Wet‐Dry Tropics of Northern Australia.” Corella 32, no. 3/4: 71–75. [Google Scholar]
- Grayson, K. L. , Cook L. W., Todd M. J., et al. 2005. “Effects of Prey Type on Specific Dynamic Action, Growth, and Mass Conversion Efficiencies in the Horned Frog, Ceratophrys cranwelli .” Comparative Biochemical Physiology 141: 298–304. [DOI] [PubMed] [Google Scholar]
- Green, B. , Dryden G., and Dryden K.. 1991. “Field Energetics of a Large Carnivorous Lizard, Varanus rosenbergi .” Oecologia 88: 547–551. [DOI] [PubMed] [Google Scholar]
- Griffiths, A. D. 1999. “Demography and Home Range of the Frillneck Lizard, Chlamydosaurus kingii (Agamidae), in Northern Australia.” Copeia 4: 1089–1096. [Google Scholar]
- Guarino, F. , Georges A., and Green B.. 2002. “Variation in Energy Metabolism and Water Flux of Free‐Ranging Male Lace Monitors, Varanus varius (Squamata: Varanidae).” Physiological and Biochemical Zoology 75, no. 3: 294–304. [DOI] [PubMed] [Google Scholar]
- Haubrock, P. J. , Soto I., Ahmed D. A., et al. 2024. “Biological Invasions Are a Population‐Level Rather Than a Species‐Level Phenomenon.” Global Change Biology 30: e17312. [DOI] [PubMed] [Google Scholar]
- Hutchings, J. A. 1993. “Adaptive Life Histories Effected by Age‐Specific Survival and Growth Rate.” Ecology 74, no. 3: 673–684. [Google Scholar]
- Indigo, N. L. , Kelly E., Smith J., Webb J. K., and Phillips B. L.. 2023. “Can Conditioned Taste Aversion Be Deployed at a Landscape Level to Mitigate the Impact of Invasive Cane Toads on Northern Quolls?” Wildlife Research 50: 1046–1057. [Google Scholar]
- Jolly, C. J. , Shine R., and Greenlees M. J.. 2016. “The Impacts of a Toxic Invasive Prey Species (The Cane Toad, Rhinella marina ) on a Vulnerable Predator (The Lace Monitor, Varanus varius ).” Biological Invasions 18: 1499–1509. [Google Scholar]
- Laver, R. J. , Purwandana D., Ariefiandy A., et al. 2012. “Life‐History and Spatial Determinants of Somatic Growth Dynamics in Komodo Dragon Populations.” PLoS One 7, no. 9: e45398. [DOI] [PMC free article] [PubMed] [Google Scholar]
- Lei, J. , and Booth D. T.. 2018. “Fine Scale Analysis of Intraspecific and Interspecific Interactions in Two Varanid Lizard Populations Adjacent to a Sea Turtle Nesting Beach.” Austral Ecology 43: 965–972. [Google Scholar]
- Letnic, M. , Webb J. K., and Shine R.. 2008. “Invasive Cane Toads ( Bufo marinus ) Cause Mass Mortality of Freshwater Crocodiles ( Crocodylus johnstoni ) in Tropical Australia.” Biological Conservation 141, no. 7: 1773–1782. [Google Scholar]
- Losos, J. , and Greene H.. 1988. “Ecological and Evolutionary Implications of Diet in Monitor Lizards.” Biological Journal of the Linnean Society 35, no. 4: 379–407. [Google Scholar]
- Madsen, T. , and Ujvari B.. 2009. “Increased Mortality of Naive Varanid Lizards After the Invasion of Non‐Native Cane Toads ( Bufo marinus ).” Herpetological Conservation and Biology 4, no. 2: 248–251. [Google Scholar]
- Madsen, T. , Ujvari B., Shine R., and Olsson M.. 2006. “Rain, Rats and Pythons: Climate‐Driven Population Dynamics of Predators and Prey in Tropical Australia.” Austral Ecology 31, no. 1: 30–37. [Google Scholar]
- Miles, D. B. , and Dunham A. E.. 1992. “Comparative Analyses of Phylogenetic Effects in the Life‐History Patterns of Iguanid Reptiles.” American Naturalist 139, no. 4: 848–869. [Google Scholar]
- Moro, D. , Dunlop J., and Williams M. R.. 2019. “Northern Quoll Persistence Is Most Sensitive to Survivorship of Juveniles.” Wildlife Research 46: 165–175. [Google Scholar]
- Nabors, P. 1997. “Notes on Breeding the Argus Monitor, Varanus panoptes , in Captivity.” Dragon News 1: 3–4. [Google Scholar]
- Nakayama, S. , Rapp T., and Arlinghaus R.. 2017. “Fast–Slow Life History Is Correlated With Individual Differences in Movements and Prey Selection in an Aquatic Predator in the Wild.” Journal of Animal Ecology 86: 192–201. [DOI] [PubMed] [Google Scholar]
- Oakwood, M. 2000. “Reproduction and Demography of the Northern Quoll, Dasyurus hallucatus , in the Lowland Savanna of Northern Australia.” Australian Journal of Zoology 48: 519–539. [Google Scholar]
- Oakwood, M. 2008. “Northern Quoll Dasyurus hallucatus Gould, 1842.” In The Mammals of Australia, edited by Van Dyck S. and Strahan R., 3rd ed., 57–59. Sydney: Reed New Holland. [Google Scholar]
- O'Donnell, S. , Webb J. K., and Shine R.. 2010. “Conditioned Taste Aversion Enhances the Survival of an Endangered Predator Imperilled by a Toxic Invader.” Journal of Applied Ecology 47: 558–565. [Google Scholar]
- O'Loughlin, L. S. , and Green P. T.. 2017. “Secondary Invasion: When Invasion Success Is Contingent on Other Invaders Altering the Properties of Recipient Ecosystems.” Ecology and Evolution 7, no. 19: 7628–7637. [DOI] [PMC free article] [PubMed] [Google Scholar]
- Payne, A. L. , and Schoknecht N.. 2011. Land Systems of the Kimberley Region, Western Australia, Technical Bulletin 98. Western Australia, Perth: Department of Agriculture and Food. [Google Scholar]
- Peterson, C. C. , Walton B. M., and Bennett A. F.. 1999. “Metabolic Costs of Growth in Free‐Living Garter Snakes and the Energy Budgets of Ectotherms.” Functional Ecology 13: 500–507. [Google Scholar]
- Pettit, L. , Brown G. P., Ward‐Fear G., and Shine R.. 2021. “Anthropogenically Modified Habitats Favor Bigger and Bolder Lizards.” Ecology and Evolution 11: 1586–1597. [DOI] [PMC free article] [PubMed] [Google Scholar]
- Pettit, L. , Crowther M. S., Ward‐Fear G., and Shine R.. 2021. “Divergent Long‐Term Impacts of Lethally Toxic Cane Toads ( Rhinella marina ) on Two Species of Apex Predators (Monitor Lizards, Varanus spp.).” PLoS One 16, no. 7: e0254032. [DOI] [PMC free article] [PubMed] [Google Scholar]
- Pettit, L. , Ward‐Fear G., and Shine R.. 2021. “A Biological Invasion Impacts Ecosystem Services: Cane Toads Change the Rate of Scavenging and the Suite of Scavengers.” Ecosphere 12: e03488. [Google Scholar]
- Pianka, E. , and King D., eds. 2004. Varanoid Lizards of the World. Bloomington, IN: Indiana University Press. [Google Scholar]
- Potgieter, L. J. , Douwes E., Gaertner M., Measey J., Paap T., and Richardson D. M.. 2020. “Biological Invasions in South Africa's Urban Ecosystems: Patterns, Processes, Impacts, and Management.” In Biological Invasions in South Africa, 275–309. Cham: Springer. [Google Scholar]
- Prabh, N. , Linnenbrink M., Jovicic M., and Guenther A.. 2023. “Fast Adjustment of Pace‐Of‐Life and Risk‐Taking to Changes in Food Quality by Altered Gene Expression in House Mice.” Ecology Letters 26, no. 1: 99–110. [DOI] [PubMed] [Google Scholar]
- Price‐Rees, S. J. , Brown G. P., and Shine R.. 2010. “Predation on Toxic Cane Toads ( Bufo marinus ) may Imperil Bluetongue Lizards (Tiliqua scincoides Intermedia, Scincidae) in Tropical Australia.” Wildlife Research 37, no. 2: 166–173. [Google Scholar]
- Rádai, Z. , Kiss B., and Barta Z.. 2017. “Pace of Life and Behaviour: Rapid Development Is Linked With Increased Activity and Voracity in the Wolf Spider Pardosa agrestis .” Animal Behaviour 126: 145–151. [Google Scholar]
- Réale, D. , Garant D., Humphries M. M., Bergeron P., Careau V., and Montiglio P. O.. 2010. “Personality and the Emergence of the Pace‐Of‐Life Syndrome Concept at the Population Level.” Philosophical Transactions of the Royal Society, B: Biological Sciences 365, no. 1560: 4051–4063. [DOI] [PMC free article] [PubMed] [Google Scholar]
- Ricciardi, A. , Iacarella J. C., Aldridge D. C., et al. 2021. “Four Priority Areas to Advance Invasion Science in the Face of Rapid Environmental Change.” Environmental Reviews 29, no. 2: 119–141. [Google Scholar]
- Shine, R. 1986. “Food Habits, Habitats and Reproductive Biology of Four Sympatric Species of Varanid Lizards in Tropical Australia.” Herpetologica 42: 346–360. [Google Scholar]
- Shine, R. 2010. “The Ecological Impact of Invasive Cane Toads ( Bufo marinus ) in Australia.” Quarterly Review of Biology 85, no. 3: 253–291. [DOI] [PubMed] [Google Scholar]
- Shine, R. , and Covacevich J.. 1983. “Ecology of Highly Venomous Snakes: The Australian Genus Oxyuranus (Elapidae).” Journal of Herpetology 17: 60–69. [Google Scholar]
- Shine, R. , Harlow P. S., and Keogh J. S.. 1998. “The Allometry of Life‐History Traits: Insights From a Study of Giant Snakes ( Python reticulatus ).” Journal of Zoology 244, no. 3: 405–414. [Google Scholar]
- Sol, D. , Maspons J., Gonzalez‐Voyer A., Morales‐Castilla I., Garamszegi L. Z., and Møller A. P.. 2018. “Risk‐Taking Behavior, Urbanization and the Pace of Life in Birds.” Behavioral Ecology and Sociobiology 72, no. 3: 1–9. [Google Scholar]
- Sorci, G. , Clobert J., and Belichon S.. 1996. “Phenotypic Plasticity of Growth and Survival in the Common Lizard Lacerta vivipara .” Journal of Animal Ecology 65: 781–790. [Google Scholar]
- Tarboton, W. R. 1978. “Hunting and Energy Budget of the Black‐Shouldered Kite.” Condor 80: 88–91. [Google Scholar]
- Tatler, J. , Currie S. E., Cassey P., Scharf A. K., Roshier D. A., and Prowse T. A. A.. 2021. “Accelerometer Informed Time‐Energy Budgets Reveal the Importance of Temperature to the Activity of a Wild, Arid Zone Canid.” Movement Ecology 9: 11. [DOI] [PMC free article] [PubMed] [Google Scholar]
- Thompson, G. , Pianka E., and JMcEachran J. D.. 2001. “Allometry of Clutch and Neonate Sizes in Monitor Lizards (Varanidae: Varanus).” Copeia 2001, no. 2: 443–458. [Google Scholar]
- Tinkle, D. W. , and Hadley N. F.. 1975. “Lizard Reproductive Effort: Caloric Estimates and Comments on Its Evolution.” Ecology 56, no. 2: 427–434. [Google Scholar]
- von Bertalanffy, L. 1957. “Quantitative Laws in Metabolism and Growth.” Quarterly Review of Biology 32, no. 3: 217–231. [DOI] [PubMed] [Google Scholar]
- Wapstra, E. , Swain R., and O'Reilly J. M.. 2001. “Geographic Variation in Age and Size at Maturity in a Small Australian Viviparous Skink.” Copeia 2001, no. 3: 646–655. [Google Scholar]
- Ward‐Fear, G. , Brown G. P., Pearson D. J., West A., Rollins L. A., and Shine R.. 2018. “The Ecological and Life History Correlates of Boldness in Free‐Ranging Lizards.” Ecosphere 9, no. 3: e02125. [Google Scholar]
- Ward‐Fear, G. , Brown G. P., and Shine R.. 2024. “Acute Impacts of Invasive Toads on the Population Demography of a Native Predator in Tropical Australia.” Biological Invasions 26: 3901–3912. [Google Scholar]
- Ward‐Fear, G. , Bruny M., Rangers T. B., Forward C., Cooksey I., and Shine R.. 2024. “Taste Aversion Training Can Educate Free‐Ranging Crocodiles Against Toxic Invaders.” Proceedings of the Royal Society B 291, no. 2028: 20232507. [DOI] [PMC free article] [PubMed] [Google Scholar]
- Ward‐Fear, G. , Pearson D. J., Brown G. P., Rangers B., and Shine R.. 2016. “Ecological Immunization: In Situ Training of Free‐Ranging Predatory Lizards Reduces Their Vulnerability to Invasive Toxic Prey.” Biology Letters 12, no. 1: 20150863. [DOI] [PMC free article] [PubMed] [Google Scholar]
- Ward‐Fear, G. , Rangers B., Bruny M., Everitt C., and Shine R.. 2024. “Teacher Toads: Buffering Apex Predators From Toxic Invaders in a Remote Tropical Landscape.” Conservation Letters 17: e13012. [Google Scholar]
- Ward‐Fear, G. , Rangers B., Pearson D., Bruton M., and Shine R.. 2019. “Sharper Eyes See Shyer Lizards: Collaboration With Indigenous Peoples Can Alter the Outcomes of Conservation Research.” Conservation Letters 12, no. 4: e12643. [Google Scholar]
- Ward‐Fear, G. , Shine R., and Brown G. P.. 2020. “Within‐Population Variation in Dietary Traits: Implications for Vulnerability and Impact of Imperiled Keystone Predators.” Ecosphere 11, no. 10: e03136. [Google Scholar]
- Webb, J. K. , Christian K. A., and Fisher P.. 2002. “Fast Growth and Early Maturation in a Viviparous Sit‐And‐Wait Predator, the Northern Death Adder ( Acanthophis praelongus ), from Tropical Australia.” Journal of Herpetology 36, no. 3: 505–509. [Google Scholar]
- Wehrle, B. A. , and German D. P.. 2023. “Reptilian Digestive Efficiency: Past, Present, and Future.” Comparative Biochemical Physiology 277: 111369. [DOI] [PubMed] [Google Scholar]
Associated Data
This section collects any data citations, data availability statements, or supplementary materials included in this article.
Supplementary Materials
Appendix S1
Data Availability Statement
Data are publicly available via the DRYAD repository at https://doi.org/10.5061/dryad.jwstqjqks.