Abstract
We propose a multi-frame blind deconvolution method using an in-plane rotating sample optimized for X-ray microscopy, where the application of existing deconvolution methods is technically difficult. Untrained neural networks are employed as the reconstruction algorithm to enable robust reconstruction against stage motion errors caused by the in-plane rotation of samples. From demonstration experiments using full-field X-ray microscopy with advanced Kirkpatrick–Baez mirror optics at SPring-8, a spatial resolution of 34 nm (half period) was successfully achieved by removing the wavefront aberration and improving the apparent numerical aperture. This method can contribute to the cost-effective improvement of X-ray microscopes with imperfect lenses as well as the reconstruction of the phase information of samples and lenses.
Supplementary Information
The online version contains supplementary material available at 10.1038/s41598-024-79237-x.
Subject terms: Microscopy, X-rays, Imaging techniques
Introduction
Full-field X-ray microscopy is able to probe the inside of samples with a spatial resolution of an order of sub-100 nm1,2. Through the use of total reflection mirrors, acquisition of high spatial resolution images is enabled with minimal chromatic aberration. Therefore, the microscopy technique is unique in that it can simultaneously perform high-resolution observation and X-ray spectroscopic analysis owing to its wideband and wavelength-variable observation capability3,4. Among mirror imaging optical designs, the advanced Kirkpatrick–Baez (AKB) mirror optics5 proposed in 1996 is an innovative optical system combining the advantages of the relatively straightforward fabrication process of Kirkpatrick–Baez (KB) mirrors6 and the low coma aberration of Wolter mirrors7. As AKB mirror optics comprise two one-dimensional Wolter mirrors to form an image independently in the vertical and horizontal directions, the closely planar mirrors can be fabricated with a shape accuracy of a few nanometers using state-of-the-art machining and measuring techniques8–10. Recent reports have highlighted the observation of ~ 50 nm resolution using full-field X-ray microscopy based on the total reflection AKB mirror optics, and the demonstration of X-ray absorption fine structure (XAFS) imaging, X-ray fluorescence analysis (XRF) imaging, phase imaging, and tomography3,4,11,12.
Owing to these advantages, total-reflection AKB microscopy is used in practical studies, however it still faces challenges to achieve higher spatial resolution. Based on Rayleigh’s quarter-wavelength rule13, mirror reflective surfaces must be fabricated with extremely precise shape accuracy at 1 nm level to achieve diffraction-limited resolution. Thus, a long fabrication time is required, incurring high manufacturing costs. The use of inaccurate and imperfect mirrors results in poor spatial resolution and contrast reduction due to wavefront aberrations. Therefore, a trade-off exists between laborious fabrication and microscope performance.
Such problems have been discussed in various fields, including those in the X-ray region. In the visible light region, which is technically ahead of other regions, a method for removing unknown wavefront aberrations from degraded microscope images using an information science approach (blind deconvolution) has been proposed to solve existing issues14. For example, Fourier ptychography proposed in 201315 is a computational imaging technique that simultaneously improves spatial resolution by aperture synthesis and determines unknown wavefront aberration16. The method aims to change the relationship between sample structure in the frequency domain and pupil function. Therefore, multiple microscope images are acquired at different illumination angles during the actual experimental procedure, allowing the separation of wavefront aberration from sample information. Fourier ptychography in the X-ray region has been experimentally demonstrated using a special method that differs from that in the visible light region because scanning the light source when X-rays are used at large synchrotron radiation facilities is difficult. In 2019, X-ray Fourier ptychography was experimentally demonstrated for the first time by introducing special illumination optics upstream of a sample into an X-ray microscope based on a Fresnel zone plate17. Furthermore, in 2022, demonstrations were performed by tilting an X-ray microscope based on a compound refractive lens18. However, the two methods for demonstrating X-ray Fourier ptychography required additional illumination optics and complex experimental setups, making them expensive and complicated.
In this paper, we propose a new blind deconvolution method to remove wavefront aberrations more easily than existing methods by changing the relative relationship between the frequency information of a sample and pupil function in the rotation direction, that is, by in-plane sample rotation. We named the method as in-plane rotating sample-blind deconvolution (IRS-BD). The proposed method can easily create a situation similar to that of Fourier ptychography by rotating the sample in-plane. Implementation is achieved by attaching a rotating stage to a conventional microscope. However, the in-plane and depth position shifts of the sample caused by the motion error of the rotation stage can significantly affect reconstruction. Therefore, we employ a reconstruction algorithm based on an untrained neural network (UNN)19–24. UNN allows for the optimization of a neural network using a single dataset without correct labels and is classified as a type of unsupervised learning. Thus, a more robust reconstruction is possible because the object function, pupil function, and experimental errors can be estimated. In this study, we develop the IRS-BD reconstruction algorithm based on a UNN that incorporates parts to predict the in-plane and depth position shifts of the sample into a physics-based neural network, enabling robust reconstruction against stage motion errors caused by in-plane sample rotation. Such reconstruction taking into account experimental errors is significantly difficult with conventional iterative approaches.
The remainder of this paper is organized as follows. “Blind deconvolution using microscope images of an in-plane rotating sample (IRS-BD)” describes the IRS-BD principle and reconstruction algorithm. “Numerical simulation of IRS-BD” reports the empirical results of a numerical simulation and demonstrates that the proposed algorithm enables robust reconstruction against stage motion errors caused by in-plane sample rotation. “Visible light demonstration experiment” reports the results of a demonstration experiment using visible light and confirms the effectiveness of stage motion error estimation in an actual experiment. “X-ray demonstration experiment” reports the results of demonstration experiments using X-rays and confirms the applicability of IRS-BD to full-field X-ray microscopy. Finally, “Discussion” discusses and summarizes the results of this study.
Blind deconvolution using microscope images of an in-plane rotating sample (IRS-BD)
Principle of IRS-BD
This section describes the principles of the proposed method. For this study, the object function and pupil function
 are defined as
 |
1 |
 |
2 |
where  denotes the frequency vectors;
  and
and  are the amplitude and phase of the object function, respectively;
  is the amplitude transmission of the pupil function; and the phase term
  of the pupil function represents the wavefront aberration of the objective lens. When a distortion exists in the phase distribution, the observed image gets degraded. When an object is coherently illuminated, image
  captured by the camera in the image plane is expressed as
 |
3 |
where  represents the inverse Fourier transform and
  the Fourier transform of
  . Furthermore, using
  and angle
  , Eq. (3) can be expressed in polar coordinates as
 |
4 |
If the object function  is rotated in-plane by an angle of rotation
  , its Fourier transform
  gets rotated in-plane by
  ; thus, the observed image
  can be written as
 |
5 |
From Eq. (5), a simultaneous equation for  and
and  can be established by collecting experimental data for multiple rotation angles. Therefore, sample information
  and aberration information
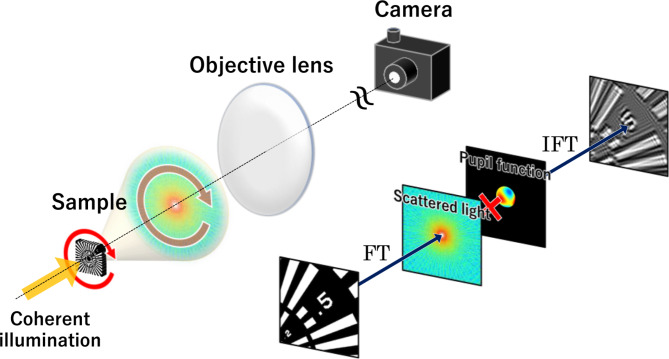
  can be obtained by solving the simultaneous equation. A schematic of the entire process is shown in Fig. 1.
Fig. 1.
Schematic of IRS-BD.
However, the sample position can fluctuate unintentionally in the in-plane and defocus directions during actual experiments owing to stage motion errors caused by in-plane sample rotation. Considering these experimental errors, Eq. (5) can be expanded as
 |
6 |
where  is the wavelength of the light source,
  is the depth position shift at the
  th rotation angle, and
  and
and  are the in-plane position shifts in the
  and
and  directions at the
  th rotation angle, respectively. The additional phase term in Eq. (6) has the same form as the transfer function in the angular spectrum method, implying light propagation in the defocus direction due to the depth-position shift of the sample.
Therefore, determining the unknown in-plane and depth position shifts of the sample at each rotation angle simultaneously is necessary in addition to the unknown object function  and pupil function
  by analyzing an experimental dataset. When several unknowns must be determined, a complex reconstruction algorithm is required.
Reconstruction algorithm based on an untrained neural network (UNN)
For this study, an optimization algorithm based on UNN is used to solve inverse problems with several unknown quantities considering multiple experimental errors, as described above. UNN is a method that combines a deep neural network (DNN) with a physical model and offers the advantage of training with only a single dataset input. The method is superior to training-based DNN because it does not require a large dataset with correct labels, particularly when a large dataset cannot be collected. Recently, remarkable results have been reported in the field of computational imaging by rigorously formulating optical phenomena as a physical model and incorporating them into a DNN19,20.
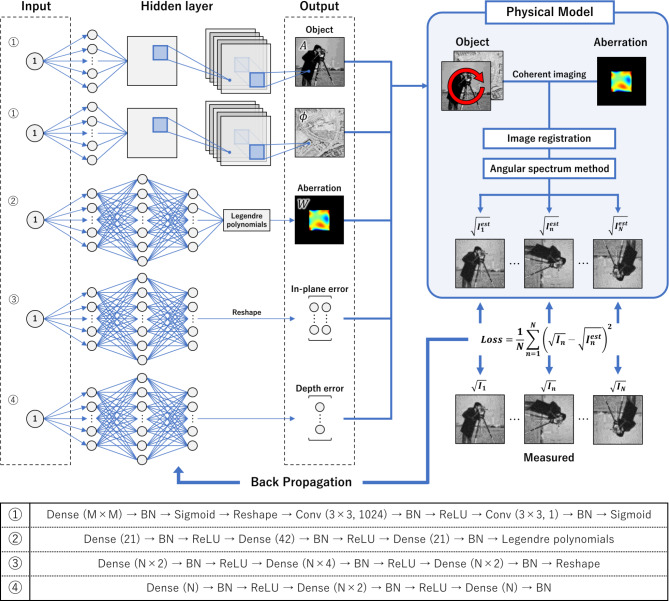
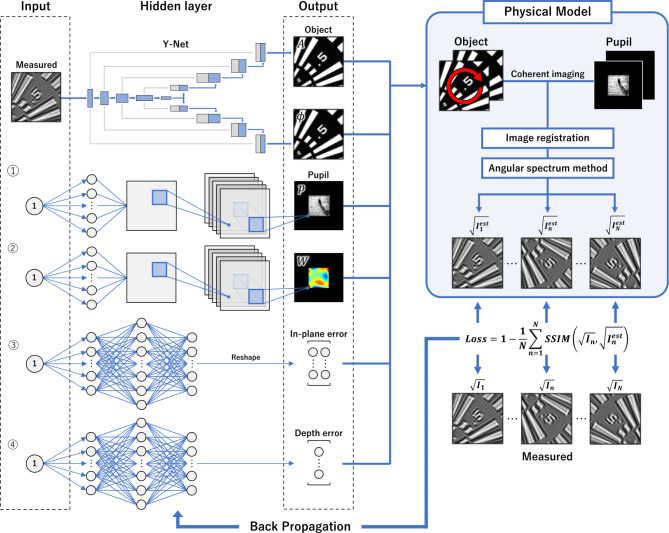
The estimation flowchart of the UNN optimization algorithm used in this study is shown in Fig. 2. The algorithm outputs five parameters: the amplitude and phase distributions of the object function, wavefront aberration, and in-plane and depth position shifts of the sample. Each of these five parameters is output by five optimally designed parallel DNNs24. Although the input of each DNN can be selected arbitrarily, all inputs are set to 1 for this study.
Fig. 2.
Flowchart of UNN estimation for the proposed method.
To estimate the complex object functions  and
and  , DNNs consisting of a fully connected layer and some convolutional layers are used. Initially, any input is connected to a fully connected layer consisting of M×M nodes. Next, the 1D array is converted into a 2D array of size M×M. Additionally, the 2D array is expanded to a size of M×M×1024 by a convolution layer, which provides the object image as an output. A convolution neural network (CNN) allows a network to be deeply scalable with a small number of parameters and provides several non-linearities in the network. Thus, the quality of the reconstructed image is improved compared to that obtained by using only a fully connected layer20,24.
Wavefront aberration  can be expanded using various orthogonal polynomials; however, the Legendre polynomial25 is applied for this study to express the wavefront aberration of the reflective objective lens (e.g., AKB mirrors) with a rectangular aperture.
 |
7 |
where  is the Legendre polynomial and
  is the coefficient. The use of the Legendre polynomial to represent wavefront aberration allows for a robust estimation with fewer degrees of freedom. Initially, the input is connected to a fully connected layer consisting of 21 nodes. Each node is further connected to a fully connected layer with 42 nodes, and then the 1D array, as 21 polynomial coefficients, is output by the fully connected layer. A 2D wavefront aberration image is created using the Legendre polynomial and coefficients.
The in-plane position shifts  and
and  are output as N×2 values in the
  and
and  -directions, respectively, where N is equal to the number of acquired images. Initially, an input is connected to the fully connected layer with N×2 nodes. Each node is further connected to the fully connected layer with N×4 nodes, and then a 1D array with a size of N×2 is output by the fully connected layer.
The depth position shifts  are output as N values. Initially, an input is connected to the fully connected layer with N nodes. Each node is further connected to the fully connected layer with N×2 nodes, and then the 1D array of size N is output by the fully connected layer.
The five parameters output by each of the aforementioned networks are provided to the physical model, and an image degraded by aberration and experimental errors at the  th rotation angle is created using Eq. (6). Using the generated and actual measured intensity images
  , the loss function based on the mean squared error (MSE) is defined as
 |
8 |
where  is the intensity image measured virtually in the physical model.
Subsequently, the parameters of the DNNs are optimized using the back-propagation algorithm such that the loss function defined by Eq. (8) decreases. Thus, the optimization algorithm using UNN is promising in that it can easily solve the inverse imaging problem by simply defining a forward imaging model as a physical model and eliminating the requirement of designing a traditional complicated algorithm by hand.
In the numerical simulation (“Numerical simulation of IRS-BD”) and demonstration experiment with visible light (“Visible light demonstration experiment”), the amplitude  of the pupil function is defined as the ideal binary aperture having a value of 0 or 1.
 |
9 |
where  denotes the numerical aperture (NA) of the objective lens. In the X-ray demonstration experiment (“X-ray demonstration experiment”), an ideal reflectance distribution cannot be obtained due to the use of contaminated mirrors. Therefore, a network to estimate the amplitude of the pupil function is included. Further details are described in “X-ray demonstration experiment”.
For this study, all analyses were performed using a GPU (NVIDIA A100 with 40 GB RAM). The optimizer used was adaptive moment estimation (Adam)26, which is a stochastic gradient descent method. A learning rate of 0.1, decay step size of 100, and decay rate of 0.95 were considered.
Numerical simulation of IRS-BD
Numerical simulation conditions
To demonstrate the effectiveness of the proposed IRS-BD scheme, we conducted reconstruction using simulated datasets. The simulation conditions are listed in Table 1 and were set assuming an X-ray demonstration experiment (“X-ray demonstration experiment”).
Table 1.
Numerical simulation conditions.
| X-ray energy (keV) | 9.884 |
Vertical/horizontal  (rad) (rad) |
1.5 × 10⁻³ |
| Pixel size (nm) | 12 |
| Maximum in-plane position shift (nm) | ± 500 |
| Maximum depth position shift (µm) | ± 50 |
| Rotation angle (deg/step) | 4 |
| Number of images | 90 |
| Image size (pixel) | 512 × 512 |
| Maximum photon count (photons/pixel) | 1000 |
To ensure that the complex object function could be correctly reconstructed, we assumed a sample with different amplitude and phase structures. Wavefront aberration was created using the Legendre polynomial25 with 21 randomly generated coefficients. Assuming the motion errors of the rotating stage, the in-plane and depth position shifts of the sample were assigned to the simulation dataset (Supplementary Movie S1). The top and bottom left movies in Movie S1 present the raw data prepared for reconstruction and the aligned data produced only for confirmation, respectively. All images were subjected to Poisson noise, assuming a maximum photon count of 1000 per pixel. IRS-BD analysis took approximately 600 s at 1000 epochs. The trend of the loss function during the reconstruction is shown in Supplementary Fig. S1.
Reconstruction results
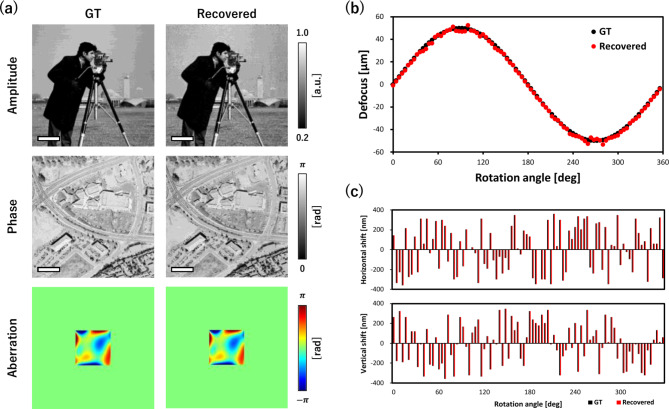
The IRS-BD reconstruction results of the numerical simulation are shown in Fig. 3. The ground truth (GT) and IRS-BD reconstruction results for the amplitude and phase of the complex object function and the wavefront aberration are shown in Fig. 3a. Both the complex object function and wavefront aberration were reconstructed quantitatively and were of good quality. A comparison between the assumed depth-position shifts of each image and those estimated by IRS-BD is shown in Fig. 3b, where a good agreement is observed. Additionally, Fig. 3c shows a comparison of the assumed in-plane position shifts of each image in the  and
and  -directions with those estimated by IRS-BD, depicting good agreement between them. The simulation results demonstrated that a certain amount of in-plane and depth position shift is acceptable as long as the field of view is not narrowed by the shift. The top-right movie in Supplementary Movie S1 presented the simulated dataset after registering it using the in-plane position shifts given by the DNN. The bottom right movie of Movie S1 presented the corresponding aligned dataset. The obtained results confirmed that the proposed IRS-BD was capable of removing wavefront aberrations, even in the presence of multiple experimental errors.
Fig. 3.
Reconstruction results of numerical simulation. (a) Ground truth (GT), recovered complex object function, and wavefront aberration. Scale bar: 1 μm. (b) Comparison of the given depth position shifts for each image and the estimated result. (c) Comparison of the given in-plane position shifts for each image and the estimated result (top: horizontal shift, bottom: vertical shift). The used test images were obtained from the databases27,28.
Visible light demonstration experiment
Experimental methods
To demonstrate the effectiveness of the proposed IRS-BD scheme, we conducted a reconstruction using the datasets obtained in a visible-light experiment. For the visible light experiment, we used an objective lens with a circular aperture; therefore, the Zernike polynomial was used for the algorithm instead of the Legendre polynomial. The visible light experimental setup is shown in Fig. 4, while Table 2 lists the experimental conditions.
Fig. 4.
Visible light experimental setup. (a) Photograph and (b) schematic of the experimental setup.
Table 2.
Visible light experimental conditions.
| Light source wavelength (nm) | 635 |

|
0.25 |

|
0.04 |
| Rotation angle (deg/step) | 4 |
| Number of images | 90 |
| Image size (pixel) | 512 × 512 |
| Effective pixel size (nm) | 680 |
For the visible light experiment, a microscope was constructed using a 10× objective lens ( , OBL-10-A, SIGMA KOKI Co., Ltd.). A USAF 1951 resolution test target (R1DS1N, THORLABS, Inc.) was used as the sample and mounted on a rotating stage (KRW 04360-A, SURUGA SEIKI Co., Ltd.). Sample images were captured using a camera (Raspberry Pi High Quality Camera, Raspberry Pi Foundation, 4056 × 3040 pixels, 1.55 μm/pixel) (Supplementary Movie S2).
The light source comprised a red LED of diameter 3 mm, and the distance between the light source and sample was 150 mm, allowing illumination of the sample under an almost perfect spatially coherent condition. To reconstruct the centrosymmetric wavefront aberrations, often introduced into circular lenses, oblique illumination was performed at an illumination angle  of 0.04 rad. After compressing the size of the captured images, a region of interest with an image size of 512 × 512 pixels was trimmed and used for analysis. The final effective pixel size of the images was 680 nm. The exposure time was 0.05 s/image.
Experimental results
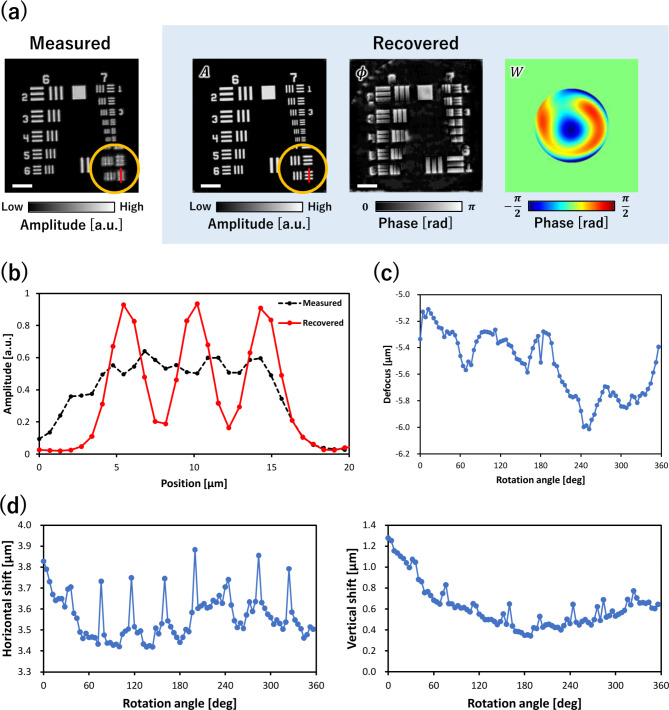
The IRS-BD reconstruction results for the visible-light experiment are shown in Fig. 5. A raw camera image captured at a rotation angle of 0° is shown in Fig. 5a, along with the reconstructed amplitude and phase of the complex object function and wavefront aberration, respectively. The graph in Fig. 5b shows the line profiles of the measured and reconstructed amplitude images indicated by the red line in Fig. 5a. The reconstructed amplitude image evidently resolved the narrowest lines and spaces with better contrast than the measured image. The depth-position shifts given by IRS-BD are shown in Fig. 5c. The defocus distances changed continuously as the sample rotated, and the shifts at 0° and 356° were consistently connected, suggesting reasonably estimated defocus distances. The horizontal and vertical in-plane position shifts provided by IRS-BD are shown in Fig. 5d. As shown in Supplementary Movie S2, depicting the dataset registered based on the shifts, the in-plane position shifts were correctly registered. According to the obtained results, the proposed method operated properly, even for an actual experimental dataset.
Fig. 5.
Reconstruction results for the visible light experiment. (a) Measured image captured at a rotation angle of 0°, along with the reconstructed amplitude/phase of the complex object function and wavefront aberration. Scale bar: 50 μm. (b) Line profiles of the measured and reconstructed amplitude images as shown by red lines in Fig. 5a. (c) Estimated depth position shifts. (d) Estimated horizontal and vertical in-plane position shifts.
X-ray demonstration experiment
Experimental methods
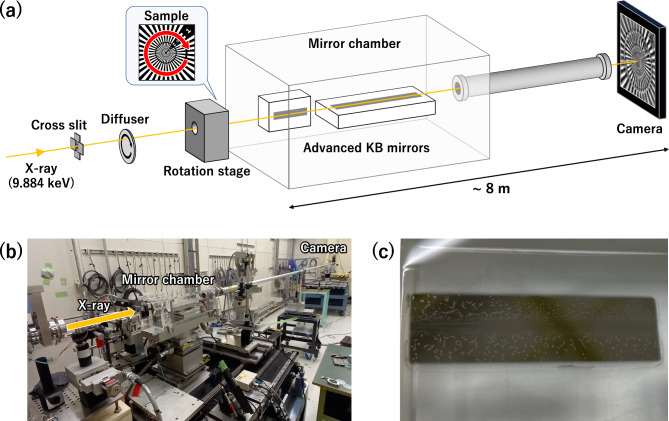
The X-ray demonstration experiment was conducted on SPring-8 BL29XU EH2, located approximately 50 m downstream of the X-ray source (undulator). The setup and conditions of the X-ray experiment are shown in Fig. 6 and Table 3, respectively. The setup comprised a diffuser (rotating sandpaper), samples, AKB type-I mirrors3, and an X-ray camera. X-rays monochromatized to 9.884 keV by a Si (111) double crystal monochromator ( ) were used. The diffuser was placed to suppress speckles from scratches and dust present on optical elements. By suppressing the spatial coherence to approximately 2–3 μm, speckles were suppressed although the sample was illuminated coherently11.
Fig. 6.
X-ray experimental setup. (a) Schematic and (b) photograph of the experimental setup. (c) Photograph of the contaminated X-ray mirror.
Table 3.
X-ray experimental conditions.
| X-ray energy (keV) | 9.884 |
| Vertical/horizontal NA (rad) | 1.44 × 10⁻³/1.51 × 10−3 |
| Rotation angle (deg/step) | 2 |
| Number of images | 180 |
| Image size (pixel) | 512 × 512 |
| Effective pixel size (nm) | 12 |
For in-plane sample rotation, the sample was mounted on a rotation stage same as that used in the visible-light experiment (“Visible light demonstration experiment”). A Siemens star test chart (XRESO-50HC; NTT Advanced Technology Corporation) was used as the sample. The star chart comprising Ta had a minimum linewidth of 50 nm in the innermost region and a thickness of 500 nm. AKB type-I mirrors comprising a pair of vertical and horizontal imaging mirrors aligned perpendicular to each other were used to produce 2D images. For the experiment, AKB mirrors with contaminated surfaces (Fig. 6c) were used to introduce complicated wavefront aberrations. The mirrors were installed inside a vacuum chamber connected to the X-ray camera through a long pipe. The chamber and pipe were filled with He to prevent X-ray attenuation. The X-ray camera comprised a CMOS camera (2048 × 2048 pixels, 6.5 × 6.5 µm2), ×20 lens, and scintillator. The scintillator consisted of Ce-doped Lu3Al5O12(LuAG: Ce, 5 μm thick) bonded to non-doped LuAG (1 mm thick) by solid-state diffusion29.
The sample was rotated in-plane by 2°/step and 180 images were acquired at an exposure time of 1 s/image. The X-ray experiment required more images than the simulation and visible-light experiments because both images of the amplitude and phase of the pupil function were to be estimated. Flat-field correction was performed through the division of the sample image by a blank image without samples after subtracting a dark image from the images with and without the sample. Approximately 15 min were required to complete the dataset. A rough correction of the in-plane position shift based on the cross-correlation function (CCF) was performed before IRS-BD analysis because the experimental data contained a relatively large number of in-plane position shifts. Supplementary Movie S3 presented image stacks for the raw dataset, roughly and finely registered by CCF and IRS-BD, respectively.
Modified reconstruction algorithm
The aforementioned reconstruction algorithm was modified for the X-ray experiment because the contaminated AKB mirrors not only affected wavefront aberration but also the mirror reflectance distribution (shown in Fig. 7). The following changes were incorporated into the modified reconstruction algorithm for the experimental X-ray dataset. The estimation network of the complex object function was altered to Y-Net30, consisting of a combination of two U-nets31 that were effective when a correlation between the input and output of the image structure existed. In Y-Net, a downsampling pass extracted features from the input image, while two upsampling passes output the two images. The respective downsampling and upsampling layers were connected using skip connections. The concrete network structure was the same as that introduced in a previous study30. In this network, an experimental image taken at an in-plane rotation angle of 0° was the input, and two images of the amplitude and phase of the object function were the output. The network structure worked as a weak constraint of the sample shape. A new DNN was added to estimate the amplitude or reflectance distribution of the pupil function. The output for the pupil function estimation changed from polynomial coefficients to an image. The benefit of directly providing the pupil function as an image involved the estimation of more complex pupil functions, such as high-spatial-frequency wavefront aberrations caused by contamination. The networks used to output the amplitude and phase images of the pupil function were the same as the previous network used to estimate the complex object function, as shown in Fig. 2. Additionally, the loss function was newly defined for the analysis of the experimental X-ray dataset as
 |
10 |
Fig. 7.
Modified reconstruction algorithm used to analyze the dataset in the X-ray experiment. The network for the object function estimation is changed to Y-Net. The networks for the pupil function are modified such that both amplitude and phase can be estimated, where an image is produced as an output instead of polynomial coefficients.
The defined loss function was based on a structural similarity index measure (SSIM) and was designed to decrease with SSIM. The use of SSIM as the loss function allowed for a more robust reconstruction against differences in brightness and contrast between  and
and  caused by differences in exposure time. The analysis typically takes approximately 1260 s at 1000 epochs with 180 images. The trend of the loss function during the reconstruction is shown in Supplementary Fig. S1.
Experimental results
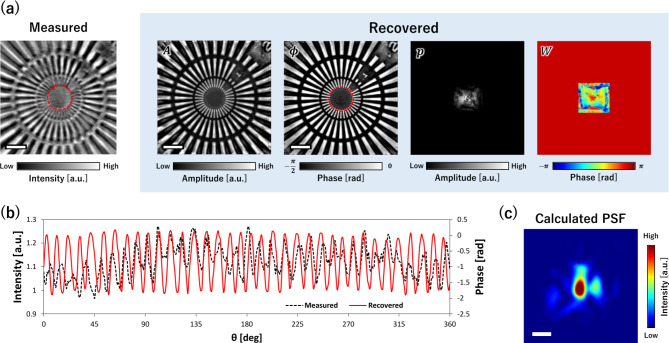
The results of IRS-BD reconstruction for the X-ray experiment are shown in Fig. 8. The reconstruction results of the object and pupil functions, which included the amplitude and phase distributions, are shown in Fig. 8a. The line profiles of the minimum linewidth structure indicated by the red circles both in the captured raw image and the reconstructed phase image are shown in Fig. 8b. The reconstructed image evidently resolved the lines and spaces with better contrast than the captured raw image. The pupil phase converged to a reasonable result. However, a concentric pattern and central peak appeared in the pupil amplitude. They could be attributed to the incomplete separation of center-symmetric structures. The effect on the object function appeared to be limited because the object function was successfully recovered. The point spread function (PSF) calculated from the reconstructed pupil function shown in Fig. 8a is shown in Fig. 8c. The obtained PSF was very complicated owing to contamination, but reasonable because it could well-reproduce the experimental dataset. The obtained results demonstrated that the proposed IRS-BD could effectively improve the quality of X-ray microscope images, even for seriously degraded images owing to contaminated mirrors, by removing the blurriness.
Fig. 8.
Reconstruction results for the X-ray experiment. (a) Measured image captured at a rotation angle of 0°, along with reconstructed amplitude/phase images of the object and pupil functions. Scale bar: 1 μm. (b) Line profiles of the measured and reconstructed images, as indicated by the red circles in (a). (c) Point spread function (PSF) calculated from the reconstructed pupil function. Scale bar: 100 nm.
Discussion
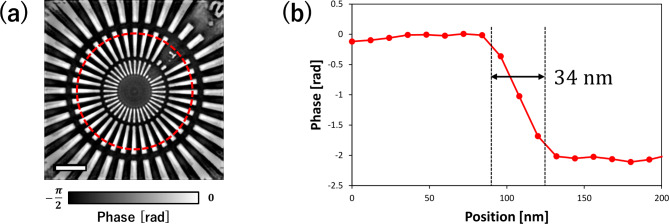
Further, we discuss the spatial resolution of the sample image reconstructed using the experimental X-ray dataset. In this study, the spatial resolution was defined as the full width at half maximum (FWHM) of the differential profile calculated from the edge structure of the star chart, although various methods for evaluating the spatial resolution exist. The regions of the edge structure used to calculate the spatial resolution and one of the extracted edge profiles along the red circle are shown in Fig. 9a,b, respectively. Consequently, the average spatial resolution for the 20 edges was 34 nm at FWHM, which was slightly smaller than the diffraction limit achieved using the AKB mirrors because the in-plane rotation of the sample changed the apparent pupil shape from rectangular to circular, making the NA in all directions equal to that of the rectangular diagonal. Therefore, an improvement in the spatial resolution was observed. The achieved spatial resolution approached the diffraction limit of 30.1 nm (half period) in coherent imaging defined by Abbe’s spatial resolution32 of  . The obtained results demonstrate improvements in the spatial resolution by performing IRS-BD through the removal of wavefront aberration and expansion of the apparent NA by rotating a rectangular aperture. As a more advanced approach, a combination of the proposed method and oblique illumination offers the potential to improve the spatial resolution. Oblique illumination, a well-known conventional microscopic technique, improves the spatial resolution in a certain direction by up to a factor of approximately 2.8 (twice the diagonal of a square lens pupil). The combination of the oblique illumination and the proposed method can improve the NA in all directions by up to a factor of 2.8 by changing the apparent pupil shape from square to circular, resulting in further improvement in the spatial resolution.
Fig. 9.
Evaluation of spatial resolution of the reconstructed phase image in the X-ray experiment. (a) Position of the edge structure used to evaluate the spatial resolution. The phase image is the same as that shown in Fig. 8a. Scale bar: 1 μm. (b) Line profile as indicated by the red circle in (a); the width denotes the full width at half maximum of the differential profile.
Summary and outlook
This paper proposes IRS-BD for the removal of wavefront aberration from microscope images by in-plane sample rotation. The effectiveness of IRS-BD in numerical simulations, visible light experiments, and X-ray experiments is verified. Consequently, we conclude that the proposed method can significantly improve both the image quality and spatial resolution of X-ray microscopes with wavefront aberrations. Additionally, the method can recover the phase information of an object function and extract the pupil function. Furthermore, a combination of the proposed method with oblique illumination will improve the spatial resolution by a factor of approximately 2.8. The potential of the proposed method is expected to contribute to major breakthroughs in X-ray microscopy, where objective lenses with large NA cannot be developed. The method provides a powerful way to quantitatively measure aberrations in a microscopic configuration. In the future, we plan to apply the proposed method to at-wavelength metrology for adaptive X-ray microscopy33. The performance of X-ray microscopy can be further improved by incorporating other advanced techniques, such as deconvolution, oblique illumination, adaptive optics, computational imaging15, and ultraprecise optical devices34–38.
Electronic supplementary material
Below is the link to the electronic supplementary material.
Acknowledgements
This study was financially supported by Fusion-oriented research for disruptive Science and Technology (JPMJFR202Y), Japan Society for the Promotion of Science (JP17H01073, JP20K21146, JP21H05004, JP22H03866, and JP22K18752). We thank Yuto Tanaka and Jumpei Yamada for their assistance. The use of the BL29XU beamline at SPring-8 was supported by RIKEN.
Author contributions
S.M. designed the research. S.M. and S.K. proposed the reconstruction algorithm. S.K. and H.A. conducted the simulations. S.K., T.Inoue, T.Ito, S.I., Y.K., M.Y. and S.M. conducted the experiments. S.K. and S.M. reconstructed the images. All of the authors discussed the results and substantially contributed to the manuscript.
Data availability
Data underlying the results presented in this paper are available from the corresponding author upon request.
Declarations
Competing interests
The authors declare no competing interests.
Footnotes
Publisher’s note
Springer Nature remains neutral with regard to jurisdictional claims in published maps and institutional affiliations.
References
- 1.Chu, Y. S. et al. Hard-x-ray microscopy with Fresnel zone plates reaches 40nm Rayleigh resolution. Appl. Phys. Lett.92 (10), 103119 (2008). [Google Scholar]
- 2.De Andrade, V. et al. Fast X-ray nanotomography with sub-10 nm resolution as a powerful imaging tool for nanotechnology and energy storage applications. Adv. Mater.33 (21), 2008653 (2021). [DOI] [PubMed] [Google Scholar]
- 3.Matsuyama, S. et al. 50-nm-resolution full-field X-ray microscope without chromatic aberration using total-reflection imaging mirrors. Sci. Rep.7 (1), 46358 (2017). [DOI] [PMC free article] [PubMed] [Google Scholar]
- 4.Matsuyama, S. et al. Full-field X-ray fluorescence microscope based on total-reflection advanced Kirkpatrick–Baez mirror optics. Opt. Express. 27 (13), 18318 (2019). [DOI] [PubMed] [Google Scholar]
- 5.Kodama, R. et al. Development of an advanced Kirkpatrick–Baez microscope. Opt. Lett.21 (17), 1321 (1996). [DOI] [PubMed] [Google Scholar]
- 6.Kirkpatrick, P. K. & Baez, A. V. Formation of optical images by X-rays. J. Opt. Soc. Am.38, 766–774 (1948). [DOI] [PubMed] [Google Scholar]
- 7.Wolter, H. Spiegelsysteme Streifenden einfalls als abbildende optiken für röntgenstrahlen. Ann. Phys.445(1–2), 94–114 (1952). [Google Scholar]
- 8.Yamauchi, K., Mimura, H., Inagaki, K. & Mori, Y. Figuring with subnanometer-level accuracy by numerically controlled elastic emission machining. Rev. Sci. Instrum.73(11), 4028–4033 (2002). [Google Scholar]
- 9.Yamauchi, K. et al. Microstitching interferometry for x-ray reflective optics. Rev. Sci. Instrum.74(5), 2894–2898 (2003). [Google Scholar]
- 10.Mimura, H. et al. Relative angle determinable stitching interferometry for hard x-ray reflective optics. Rev. Sci. Instrum.76(4), 045102 (2005). [Google Scholar]
- 11.Tanaka, Y. et al. Propagation-based phase-contrast imaging method for full-field X-ray microscopy using advanced Kirkpatrick–Baez mirrors. Opt. Express. 31(16), 26135–26144 (2023). [DOI] [PubMed] [Google Scholar]
- 12.Yamada, J. et al. Compact full-field hard x-ray microscope based on advanced Kirkpatrick–Baez mirrors. Optica. 7(4), 367–370 (2020). [Google Scholar]
- 13.Born, M. & Wolf, E. Principles of Optics, 7th edition, p. 527 (Cambridge University Press, 1999).
- 14.Satish, P., Srikantaswamy, M. & Ramaswamy, N. K. A Comprehensive Review of Blind Deconvolution techniques for image Deblurring. Trait Signal.37(3), 527–539 (2020). [Google Scholar]
- 15.Zheng, G., Horstmeyer, R. & Yang, C. Wide-field, high-resolution Fourier ptychographic microscopy. Nat. Photonics. 7 (9), 739–745 (2013). [DOI] [PMC free article] [PubMed] [Google Scholar]
- 16.Ou, X., Zheng, G. & Yang, C. Embedded pupil function recovery for Fourier ptychographic microscopy. Opt. Express. 22(5), 4960–4972 (2014). [DOI] [PMC free article] [PubMed] [Google Scholar]
- 17.Wakonig, K. et al. X-ray Fourier ptychography. Sci. Adv.5(2), eaav0282 (2019). [DOI] [PMC free article] [PubMed] [Google Scholar]
- 18.Carlsen, M. et al. Fourier ptychographic dark field x-ray microscopy. Opt. Express. 30(2), 2949–2962 (2022). [DOI] [PubMed] [Google Scholar]
- 19.Qayyum, A. et al. Untrained neural network priors for inverse imaging problems: a survey. IEEE Trans. Pattern Anal. Mach. Intell.45(5), 6511–6536 (2023). [DOI] [PubMed] [Google Scholar]
- 20.Ulyanov, D., Vedaldi, A. & Lempitsky, V. Deep image prior. Int. J. Comp. Vis.128(7), 1867–1888 (2020). [Google Scholar]
- 21.Sun, M. et al. Neural network model combined with pupil recovery for Fourier ptychographic microscopy. Opt. Express. 27(17), 24161–24174 (2019). [DOI] [PubMed] [Google Scholar]
- 22.Zhang, Y. et al. Neural network model assisted Fourier ptychography with Zernike aberration recovery and total variation constraint. J. Biomed. Opt.26(3), 036502 (2021). [DOI] [PMC free article] [PubMed] [Google Scholar]
- 23.Zhang, J. et al. Forward imaging neural network with correction of positional misalignment for Fourier ptychographic microscopy. Opt. Express. 28(16), 23164–23175 (2020). [DOI] [PubMed] [Google Scholar]
- 24.Chen, Q., Huang, D. & Chen, R. Fourier ptychographic microscopy with untrained deep neural network priors. Opt. Express. 30(22), 39597–39612 (2022). [DOI] [PubMed] [Google Scholar]
- 25.Muslimov, E. et al. Combining freeform optics and curved detectors for wide field imaging: a polynomial approach over squared aperture. Opt. Express. 25(13), 14598–14610 (2017). [DOI] [PubMed] [Google Scholar]
- 26.Kingma, D. P. & Ba, J. Adam: A Method for Stochastic Optimization, arXiv preprint arXiv:1412.6980 (2014).
- 27.ImageProcessingPlace.com. standard test images. https://www.imageprocessingplace.com/root_files_V3/image_databases.htm (2024).
- 28.USC University of Southern California. The USC-SIPI Image Database Miscellaneous, (2024). https://sipi.usc.edu/database/
- 29.Takeuchi, A. et al. Development of an X-ray imaging detector to resolve 200 nm line-and-space patterns by using transparent ceramics layers bonded by solid-state diffusion. Opt. Lett.44(6), 1403–1406 (2019). [DOI] [PubMed] [Google Scholar]
- 30.Wang, K., Dou, J., Kemao, Q., Di, J. & Zhao, J. Y-Net: a one-to-two deep learning framework for digital holographic reconstruction. Opt. Letter. 44(19), 4765–4768 (2019). [DOI] [PubMed] [Google Scholar]
- 31.Ronneberger, O., Fischer, P. & Brox, T. U-Net: Convolutional networks for biomedical Image Segmentation. arXiv:150504597 (2015).
- 32.Abbe, E. Beiträge Zur Theorie Des Mikroskops Und Der Mikroskopischen Wahrnehmung. Archiv für Mikroskopische Anatomie. 9, 413–418 (1873). [Google Scholar]
- 33.Inoue, T. et al. Monolithic deformable mirror based on lithium niobate single crystal for high-resolution X-ray adaptive microscopy. Optica11(5), 621 (2024).
- 34.Döring, F. et al. a and Sub-5 nm hard x-ray point focusing by a combined Kirkpatrick-Baez mirror and multilayer zone plate. Opt. Express21(16), 19311–19323 (2013). [DOI] [PubMed]
- 35.Matsuyama, S. et al. Nanofocusing of X-ray free-electron laser using wavefront-corrected multilayer focusing mirrors. Sci. Rep.8(1), 17440 (2018). [DOI] [PMC free article] [PubMed] [Google Scholar]
- 36.Rösner, B. et al. Soft x-ray microscopy with 7 nm resolution. Optica7(11), 1602 (2020).
- 37.Yamada, J. et al. Extreme focusing of hard X-ray free-electron laser pulses enables 7 nm focus width and 1022 W cm– 2 intensity. Nat. Photonics. 18, 685–690 (2024).
- 38.Dresselhaus, J. L. et al. X-ray focusing below 3 nm with aberration-corrected multilayer Laue lenses. Opt. Express. 32(9), 16004–16015 (2024). [DOI] [PubMed]
Associated Data
This section collects any data citations, data availability statements, or supplementary materials included in this article.
Supplementary Materials
Data Availability Statement
Data underlying the results presented in this paper are available from the corresponding author upon request.


