Abstract
Phase contrast x-ray imaging (PCXI) provides high-contrast images of weakly-attenuating structures like the lungs. PCXI, when paired with 4D X-ray Velocimetry (XV), can measure regional lung function and non-invasively assess the efficacy of emerging therapeutics. Bacteriophage therapy is an emerging antimicrobial treatment option for lung diseases such as cystic fibrosis (CF), particularly with increasing rates of multi-drug-resistant infections. Current efficacy assessment in animal models is highly invasive, typically requiring histological assessment. We aim to use XV techniques as non-invasive alternatives to demonstrate efficacy of bacteriophage therapy for treating Pseudomonas aeruginosa CF lung infections, measuring functional changes post-treatment. Time-resolved in vivo PCXI-CT scans of control, Pseudomonas-infected, and phage-treated mouse lungs were taken at the Australian Synchrotron Imaging and Medical Beamline. Using XV we measured local lung expansion and ventilation throughout the breath cycle, analysing the skew of the lung expansion distribution. CT images allowed visualisation of the projected air volume in the lungs, assessing structural lung damage. XV analysis demonstrated changes in lung expansion between infection and control groups, however there were no statistically significant differences between treated and placebo groups. In some cases where structural changes were not evident in the CT scans, XV successfully detected changes in lung function.
Keywords: Cystic Fibrosis, Bacteriophage, X-ray Velocimetry, Phase contrast, Computed tomography
Subject terms: Pharmaceutics, Respiratory tract diseases, Cystic fibrosis, X-rays
Introduction
X-ray imaging is a key investigative tool allowing the visualisation of organs within the body, and it aids in the diagnosis and management of a range of medical conditions. Three limitations of conventional clinical X-ray techniques are their limited spatial resolution, limited temporal resolution and low soft-tissue contrast. The limited spatial resolution prevents imaging of small structures, including the small airways and alveoli. The limited temporal resolution means there have been only a handful of studies that have captured images throughout the breath cycle, and typically only in projection1. Consequently, conventional clinical imaging methods are not routinely used for dynamic imaging of the lungs. Imaging with a bright coherent synchrotron X-ray source enables increased spatial and temporal resolution.
The lung parenchyma is weakly absorbing, thus producing weak attenuation-based contrast, limiting the visualisation of pathologies. Weakly-absorbing materials can be targeted with novel techniques such as phase contrast X-ray imaging (PCXI) to improve their visibility without an increased radiation dose2,3. This is achieved by exploiting the x-ray phase shift information produced by slight refraction in the sample. When compared with conventional X-ray contrast, these PCXI techniques provide considerably enhanced contrast between various biological tissues4,5.
There are multiple PCXI techniques, each using a different mechanism to convert x-ray phase variations into observable intensity variations and interpret that image contrast. These include crystal interferometry6, propagation-based PCXI7,8, analyser-based PCXI9, grating interferometry10,11, and edge-illumination12. Propagation-based PCXI is the simplest technique, and involves introducing a propagation distance between the sample and the detector3, requiring only a spatially-coherent x-ray wavefield13,14. In this study a synchrotron is used, however propagation-based PCXI can be achieved using the coherent wave-field generated by a microfocus x-ray source. Introducing a propagation distance allows the X-ray wavefield to self-interfere as it leaves the sample and propagates to the detector, creating intensity variations that reveal x-ray phase information. Bright/dark interference fringes at the edges of the features in the sample are produced as the X-ray waves diverge and interfere, resulting in increased image contrast7,8. The lungs in particular produce strong contrast due to phase effects caused by the many air/tissue boundaries. The ability to obtain a useful image with one propagation-based PCXI exposure allows for imaging of moving samples, such as performing lung motion measurements15–17.
Dynamic assessment of lung function can be achieved using time-sequenced lung PCXI18,19. The increased image contrast made available due to phase contrast, in combination with bright next-generation x-ray sources, allows multiple images to be taken throughout the breath cycle16,18. By tracking each part of the 3D volume of the lungs in time throughout a breath cycle, 4D information about airflow in the lung can be generated.
Velocimetry is a measurement technique that has been developed to track lung movement in 4D PCXI sequences18and hence assess the flow of air in the lungs. This technique is referred to as 4D X-ray velocimetry (XV). Dubsky et al.18 have combined PCXI with dynamic 4D CT imaging to measure tissue motion and expansion, tissue velocity fields, expiratory time constant, and flow of air in the airways. This allows for non-invasive, regional, functional respiratory testing which is not currently possible with conventional clinical imaging techniques20. As a result, another benefit of time-resolved lung imaging is that it can help improve our understanding of respiratory physiology, facilitating more effective assessment of novel therapies in research and clinical practice21,22. XV imaging has been applied to the B-ENaC mouse model of cystic fibrosis (CF) using synchrotron and laboratory x-ray sources20,23,24, and more recently to CF rats using a 4DMedical Permetium small animal XV imaging system22,25. The clinical applicability of XV is also now being tested in a paediatric CF cohort26.
In this study, we applied XV to investigate the effectiveness of a bacteriophage therapy for the gram negative bacteria Pseudomonas aeruginosa, which causes atypical pneumonia27. Immunocompromised patients, or those with underlying respiratory conditions such as CF are most at risk28. Patients with CF are often colonised with P. aeruginosa resulting in recurrent lower respiratory tract infections29.
Antimicrobial resistance is a growing problem. A number of bacteria, including P. aeruginosa, rapidly develop resistance to commonly used antibiotics27,30. P. aeruginosa also generates biofilms31,32that are harder for both the immune system and antibiotics to penetrate, thus making them impossible to clear33,34. Antibiotic-resistant infections are associated with poorer patient outcomes, including increased morbidity and mortality35–37.
Bacteriophages are viruses that infect bacterial cells28. After a bacteriophage has attached to and injected its genomes into a bacterial cell, it replicates, creating new virions that cause the bacterial cell to lyse, killing the host cell. The clinical use of bacteriophages has been largely limited to Eastern Europe38, but with the worldwide increases in antibiotic-resistant infection rates, bacteriophages are being investigated as a useful treatment option for bacterial infections in a number of countries39,40.
P. aeruginosa is a bacterium against which bacteriophage therapy has been shown to be beneficial both in vitro and in vivo38,41,42. Waters et al. demonstrated through in vitro experiments that bacteriophages are effective at penetrating P. aeruginosa biofilms41. They also demonstrated a reduction in bacterial load when used to treat chronic infection.
The techniques currently used to assess the efficacy of bacteriophage therapies in rodent studies include bronchoalveolar lavage, airway dissection, and organ tissue sampling. These techniques are either highly invasive or require the rodents to be terminally anaesthetised and cannot be translated into a clinical setting38,41,43. There has been little research into the effect of bacteriophage therapies on lung function and inflammation, as most studies focus solely on its effect on bacterial clearance44. XV may allow for non-invasive functional assessment of the lungs as an indicator of disease burden, and hence an assessment of treatment efficacy.
In this study, we explored the use of XV as a non-invasive approach for measuring the efficacy of a bacteriophage therapy for CF in a mouse model of P. aeruginosa, via local measures of lung function.
Methods
Ethics approval was granted by the University of Sydney IRMA Animal Ethics Committee (number 2015/876) for the project NHMRC APP1140617 and the Australian Synchrotron Animal Ethics Committee (approval number AS2020_006). Animal experiments were performed according to the Australian code for the care and use of animals for scientific purposes and the study has been reported in accordance with the ARRIVE guidelines45.
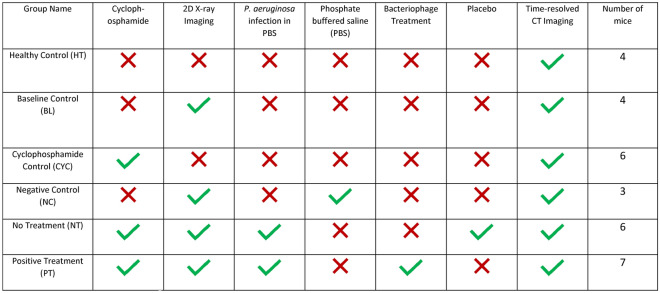
This was a randomised, unblinded study using a mouse model of lung infection. The experiment used female BALB/c mice aged 7 weeks, weighing 18.6 ± 0.9 g, sourced from the Animal Resources Centre (ARC, Western Australia). Animals were provided access to food and water ad libitum. The experimental unit was an individual animal. The exclusion criteria were intubation failures or imaging equipment failures. The mice were pre-treated with cyclophosphamide to reduce the immune response, then infected with P. aeruginosa. Selected mice were then treated with the bacteriophage treatment. Multiple control groups were used to isolate which interventions were responsible for any differences seen in lung function. Mice were anaesthetised for P. aeruginosa inoculation, bacteriophage delivery, and X-ray imaging. The time available at the synchrotron facility allowed no more than 35 mice to be imaged, and for this reason we aimed to allocate n = 4 animals to the control groups, and n = 7 animals to the treatment groups where we expected to see higher levels of variability, based on previous XV and bacteriophage experiments. After completion of the imaging the mice were euthanised with a sodium pentobarbital overdose. The specifics of each group are outlined in Table 1, with timing described in the caption.
Table 1.
Mouse groups and the associated interventions.
Cyclophosphamide (Baxter Healthcare Pty Ltd., New South Wales, Australia) was administered to the relevant mice via intraperitoneal injection, with a 150 mg/kg dose given four days prior to imaging and a 100 mg/kg dose given one day prior to imaging. An initial 2D X-ray was taken prior to infecting the mice with P. aeruginosa (or phosphate buffered saline (PBS) sham in the case of group NC). There was a minimal delay of less than ten minutes between the initial imaging and the infection delivery. An inoculum was prepared with P. aeruginosa in PBS, and a 25μL dose was delivered to the lung of the anaesthetised animals using intra-tracheal instillation. Where appropriate, the bacteriophage powder treatment was administered intratracheally, under anaesthesia, at two hours post infection. In the case of the No Treatment group, a puff of the same volume of air was delivered at this timepoint as a placebo. The mice were then left to recover for 24 h before the final imaging with both time-resolved CT and 2D X-ray.
Images were collected at the Australian Synchrotron’s Imaging and Medical Beamline (IMBL). The imaging setup included a 2560 × 2160 pixel sCMOS camera focused with visible light optics onto an x-ray-to-visible-light-converting phosphor to provide a pixel size of 11.7 μm. The energy of the monochromatic x-ray beam was 30 keV. The detector was placed 3 m behind the sample, providing propagation-based phase contrast to increase the visibility of the lungs relative to conventional x-ray imaging. During imaging the mice were anaesthetised with a mix of Ketamine (80 mg/kg) and xylazine (10 mg/kg), intubated, and connected to a pressure-driven ventilator (Accuvent 200, Notting Hill Devices, Australia)46. Animals were ventilated using a positive inspiratory pressure (PIP) of 14 cmH2O, and positive end-expiratory pressure (PEEP) of 2 cmH2O at a rate of 234 breaths/min (the breath cycle was 256 ms with I:E ratio of 1:1). To image the lungs, mice were positioned upright in a custom 3D-printed chair47. A sequence of 60 2D projections were captured at baseline (immediately before intervention) and after 24 h, for projection imaging (data not included in this manuscript). At 24 h after infection, time-resolved CT datasets were acquired for XV analysis. The CTs were captured with 15 ms exposures, separated by 2 ms breaks, for 12133 projections captured over 182 degrees, with the mouse continuously breathing and image capture triggers sent from the ventilator such that 15 projection images were acquired per breath46. Timing information was recorded with a Powerlab data acquisition system and LabChart Software (AD Instruments, Australia).
The projections were sorted into 15 breath points of 800 projections each. The images were flat and dark field corrected, phase retrieved (γ = 2000)48,49and reconstructed into CT volumes using XTRACT software50. The CT reconstruction step had to be manually adjusted in 4 mice (PT2, PT4, PT5, and PT6) due to 5–7 missed image captures within the 12,000 projections, which impacted our timepoint reconstruction. To rectify this issue, missed projections were identified using the time trace of the camera output signal recorded using LabChart, and replaced with the requisite number of neighbouring images. This process had minimal impact on reconstruction quality due to the small angle of rotation changes between each projection, but ensured all images represented the correct phase of the breath. After this had been completed, the CT reconstruction was run on the adjusted dataset for those particular mice.
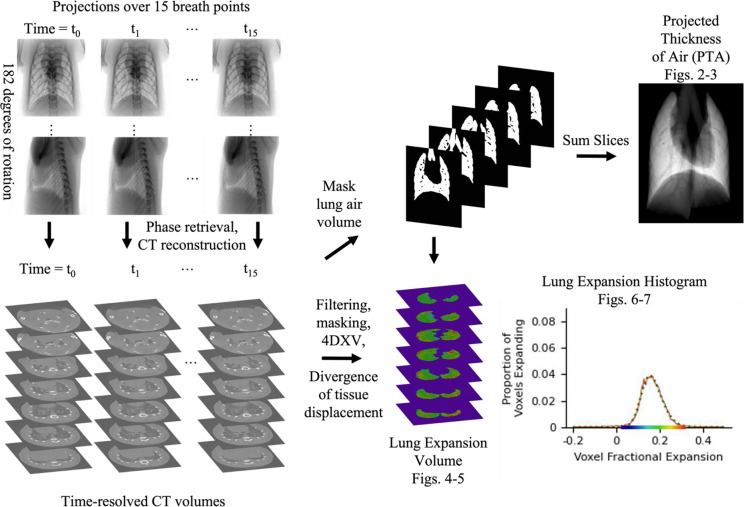
Before XV analysis, all CT stacks were binned 2 × 2 and cropped to the field of view of the lungs23. The spatial resolution of the images was not noticeably reduced by this binning, verified by analysing intensity profiles, due to local blurring introduced by the x-ray to visible light scintillator on the camera. This binning enabled faster XV analysis and more manageable data volumes. To robustly track lung tissue movement through the breath, filtering was applied to the CT stacks to enhance the lung tissue visibility18. A scaling filter was applied with typical values of lower limit 0.01 and upper limit 0.50 – 0.65, to maximise contrast across the available greyscales. A high-pass filter was then applied with a cut off at 64 pixels, to minimise large area contrast and maximise the contrast of the lung tissue for tracking. The full image processing methods are represented in a flowchart in Fig. 1. For representative images of the CTs after each of the application of these filters, please see Supplementary Figure S1.
Fig. 1.
Analysis Flowchart. X-ray projections were captured over 15 breath points and reconstructed into time-resolved CT volumes. These CTs were then filtered, masked, and analysed to produce the final outputs; a lung expansion histogram and a ‘projected thickness of air’ (PTA) image.
To track only the motion of lung tissue and quantify changes in lung volume, a binary mask was extracted from the CT stack corresponding to end expiration. Masking was performed in AVIZO with manual corrections, selecting those voxels within the body of the mouse that primarily contained air. A projection of the binary mask volume was also acquired by summing the pixel values through the CT stack. This produced what we call a Projected Thickness of Air (PTA) image for those lungs, which can be viewed in the oblique or anterior–posterior (AP) view, Figs. 2–3, or oblique, Supplementary S2. A full set of oblique PTA data is provided in Supplementary Figure S2. Here the air-filled lung tissue and airways are visible as increased brightness, while blood vessels appear as ‘tunnels’ within the PTA since they are not included in the binary mask. In a similar way, obstructed volumes of the lungs are excluded from the binary mask, hence the PTA image indicates how much of the lung tissue is obstructed. It allows a single projection representation of the obstructed lung tissue from the thousands of CT slices. This manuscript represents the first use of this kind of visualisation of CT data to the best of our knowledge.
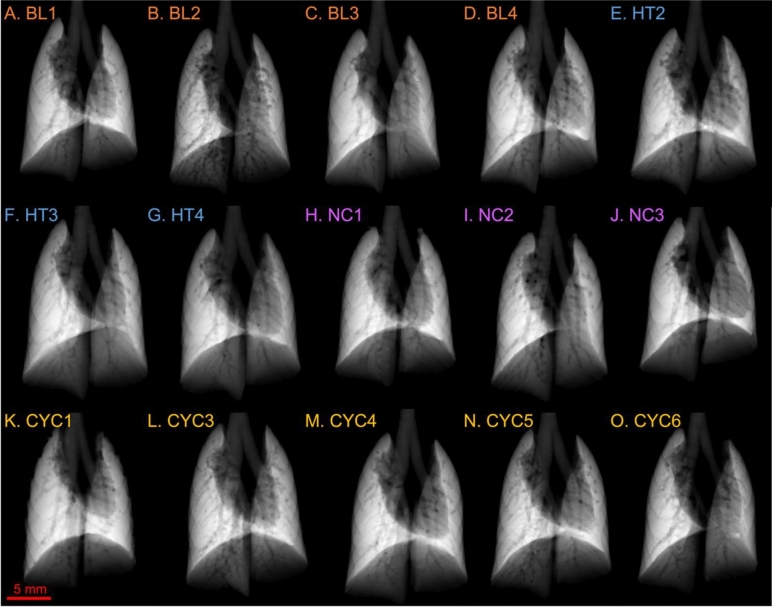
Fig. 2.
Projected thickness of air (PTA) for the control groups of mice: baseline (BL), healthy (HT), negative control (NC), and cyclophosphamide control (CYC). Each panel shows the PTA for a different mouse. Panels A-D show the PTA for the BL mice, E–G for the HT mice, H-J for the NC, and K–O for the CYC mice.
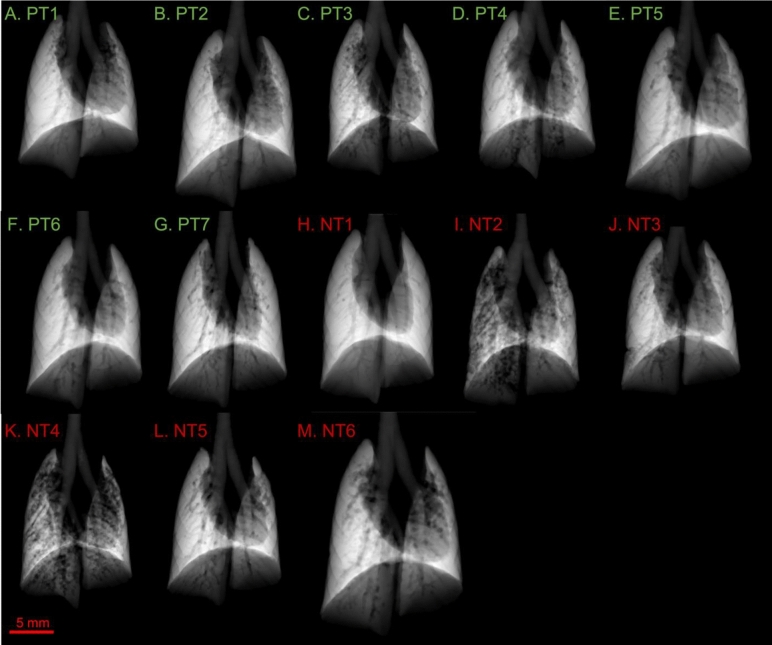
Fig. 3.
Projected thickness of air (PTA) for the mouse groups infected with P. aeruginosa: positive treatment (PT), and no treatment (NT). Refer to Fig. 2 caption for further information. Panels A-G show the PTA for the PT mice, H-M for the NT mice.
XV was used to calculate the displacement of local lung tissue throughout the breath cycle using a Particle Image Velocimetry (PIV) approach. PIV analysis took two spatially-local interrogation windows from CTs at successive time-points and cross-correlated them in 3D. This generated a vector field of the displacement of the local lung tissue, measuring the velocity of the voxels in direction x, y, and z18. The cross-correlation process utilised a large interrogation window of 64 pixels, extracted from the start of the breath cycle, T00, and a small interrogation window of 32 pixels, extracted from the comparison timepoint, Tn, with no overlap between adjacent windows. The small window from Tn was then tracked in the large window from T00 to determine how far it had moved. T00, the start of the breath, was compared to each subsequent timepoint, and displacement vectors were calculated between T00 and Tn for each in order to calculate the timepoint of maximum displacement.
Lung displacement arises from lung expansion, but the local magnitude of the two is not directly correlated. As lungs inflate with inspiration, tissue closest to the airways pushes the distal tissue further away. Consequently, displacement of distal tissue is greater than displacement of proximal tissue. The divergence of the vector displacement field was therefore used to determine lung expansion. From the lung expansion (i.e. tissue divergence) values, we generated a histogram of the lung expansion for each mouse. These histograms show the specific ventilation, the change in volume of each analysis region divided by its end expiratory volume. In other words, the specific ventilation is the fractional lung expansion. Due to the presence of a noticeable skew observed in our histograms, we applied a skewed-gaussian fit to the histograms to statistically analyse the distribution of lung expansion.
The equation of fit we used for the skewed gaussian fit was,
 |
where α is the shape parameter, σ is the scale, x0is the location, and s parameterises the skew51. From this skewed gaussian fit we extracted a fitted mean,  , fitted standard deviation,
  , and skew,
  , where δ =
  .
.
We then compared the histogram measures of mean specific ventilation, standard deviation, and skew between the six mouse groups using a one-way analysis of variance (ANOVA), setting the p-value threshold for statistical significance at p < 0.05 using GraphPad Prism (version 10.0.0, GraphPad Software, Boston, Massachusetts USA).
Results
Two mice from the original study plan are not included here: CYC2 due to intubation issues, and HT1 due to imaging equipment failures. CYC1 died from anaesthetic complications, but we do not consider the few minutes between it dying and being imaged to have negatively impacted the lung tissue and function, nor the imaging results, as mice were mechanically ventilated for the imaging.
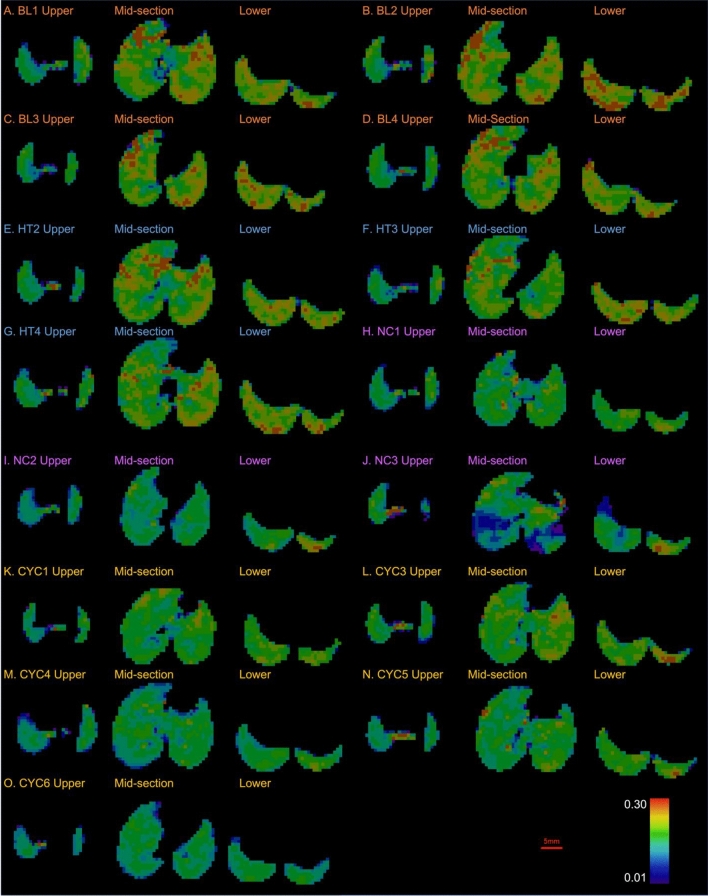
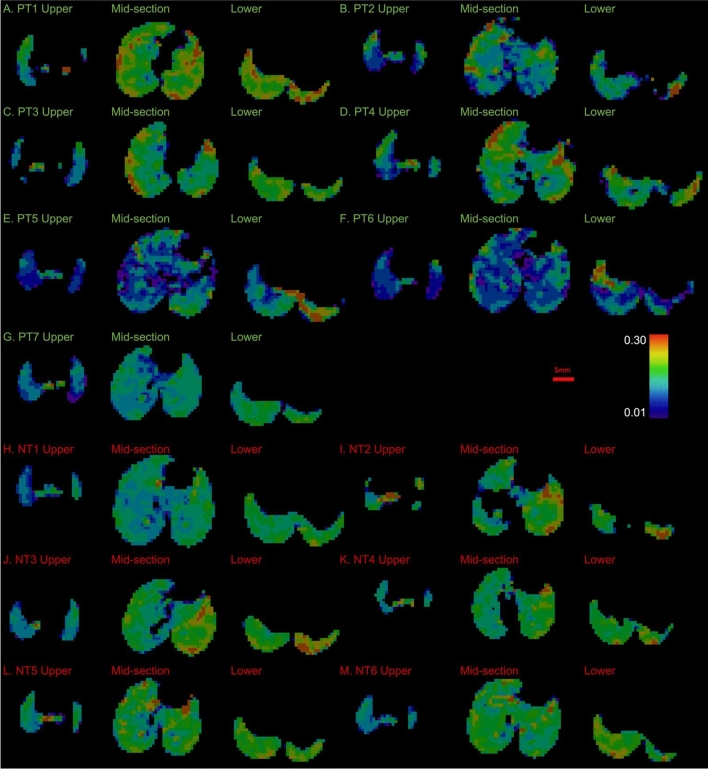
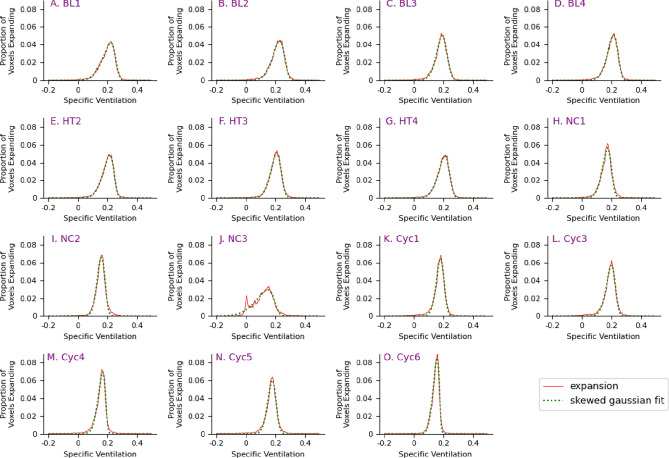
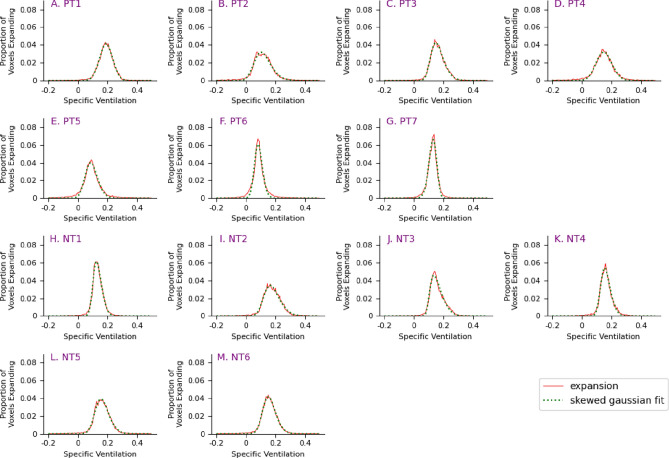
Our key results consisted of the PTA in the AP view (Figures. 2 and 3), the lung expansion maps (Fig. 4 and 5), and the histograms of the lung expansion maps (Fig. 6 and 7).
Fig. 4.
Lung Expansion Maps of baseline (BL), Healthy (HT), negative control (NC), and cyclophosphamide cotrol (CYC) mouse groups. Each panel consists of three lung expansion frames from each mouse to provide representative data of the upper lung parenchyma, mid-section lung parenchyma, and lower lung parenchyma. Panels A-D show the lung expansion maps for the BL mice, E–G for the HT mice, H-J for the NC mice, and K–O for the CYC mice.
Fig. 5.
Lung expansion maps for the positive treatment (PT) and no treatment (NT) mouse groups. Refer to Fig. 4 for further information. Panels A-G show the lung expansion maps for the PT mice, panels H-M for the NT mice.
Fig. 6.
Histograms of lung expansion for baseline (BL), healthy (HT), cyclophosphamide control (CYC), and negative control (NC) mouse groups. The x-axis represents the specific ventilation, and the y-axis represents the proportion of voxels expanding by the given amount. The dotted green light is the skewed Gaussian fit of the data.
Fig. 7.
Histograms of lung expansion for Positive Treatment (PT) and No Treatment (NT) mouse groups. The x-axis represents the specific ventilation, and the y-axis represents the proportion of voxels expanding by the given amount. The dotted green light is the skewed Gaussian fit of the data.
Projected Thickness of Air
Figures 2 and 3 show the projected lung air volume, or projected thickness of air (PTA) for each mouse in the study. The trachea can be seen splitting into the two bronchi leading to the left and right lungs. The shadow in the centre and left of the lung fields is caused by the heart. The dark lines that can be seen running through the lung fields are the blood vessels, and towards the edges of the lungs there are indentations from the surrounding ribs.
Figure 2 shows the PTA for the control groups and indicates a relatively uniform thickness of air throughout the lungs across all four control groups. This indicates there is good lung aeration in the lungs throughout the different control groups. Mouse BL2, Fig. 2B, shows some patchiness and thus reduced lung aeration, however, there appears to be relatively uniform lung aeration throughout all the animals in the BL group. When comparing CYC1, Fig. 2K, with CYC6, Fig. 2O, the anatomical variations of heart size between the mice can be observed by the difference in the cardiac silhouette.
The P. aeruginosa infected PT and NT mice, Fig. 3, show more visible variations in the uniformity of the PTA than the control groups, Fig. 2. While most of the PT mice appear to have relatively uniform lung aeration, there is some visibly reduced aeration in PT3 and PT4, Fig. 3C-D. There is more apparent variation in the uniformity of PTA in the NT mice than the PT mice. NT2 and NT4, Fig. 3I and K respectively, show patchy PTA images, representing reduced aeration of the lung parenchyma in these mice.
Lung Expansion Maps
Figures 4 and 5 show three representative transverse slices of the lung specific ventilation, where red voxels indicate an expansion of 30% during a breath, green voxels indicate approximately 20% expansion, and blue voxels indicate 1% expansion. We expect that sections of the lung that are infected may be inflamed or obstructed, and hence expand by a smaller percentage. The indent at the top of each mid-section slice is caused by the presence of the heart.
The expansion maps for the BL and HT mice show good lung expansion throughout the lung, in that they are predominantly green and yellow with some red, see Fig. 4, hence expanding by at least 20%. Note there are areas of reduced expansion around the heart and at the edge of the lungs, for example in BL1, Fig. 4A.
Control mice NC1, Fig. 4H, and CYC1, Fig. 4K, have good lung expansion (predominantly green). CYC4, Fig. 5F, demonstrates areas around the heart and at the edge of the lungs, particularly the upper right lung field edges, with reduced expansion (blue), likely impacted by the movement of the heart52. Of note, NC3, Fig. 5C, shows varied lung expansion throughout the lung fields. The mid-section frame shows that ventrally the lungs are expanding well (green/yellow), while dorsally the lungs are expanding poorly (blue/purple). The lower frame on the other hand shows poorer lung expansion ventrally on the right (blue), while the dorsal left lung is expanding well (yellow/red).
PT1, PT3, and PT4, Fig. 5A, 5C and 5D, show good lung expansion throughout the lung (predominantly green / yellow), with some reduced lung expansion in the lower lung (blue). PT2, Fig. 5B, on the other hand shows poor lung expansion throughout the lung fields (blue/purple). PT5 and PT6, Fig. 5E and 5F, show poor lung expansion throughout the lung fields (blue / purple), with some areas of good lung expansion at the lower region of the lungs (red). PT7, Fig. 5G, shows poor lung expansion throughout the lung fields (blue), with some areas of better lung expansion at the lower region of the lungs (predominant green).
NT1, Fig. 5H, shows relatively poor lung expansion (predominantly blue), with worse expansion in the upper right lung (dark blue), and better expansion at the lower region of the lungs (predominantly green). The mid-section frame for NT2, Fig. 5I, demonstrates no expansion in the middle of the right lung where the lung parenchyma is not being aerated. The left lung, however, has good lung expansion (green/yellow/red). NT3 and NT6, Fig. 5J and 5M, show poor upper lung expansion (predominantly blue) and better lower lung expansion (green/yellow/red).
Histograms of Lung Expansion
For each mouse, the ventilation variability across the lung is qualified by calculating the skew of a Gaussian curve fitted to the specific ventilation data. As seen in Fig. 6, the BL, HT, NC, and CYC mice all demonstrate a negative skew, with a longer tail on the negative side of the distribution than on the positive side, indicating that a greater proportion of the lung is expanding above the mean. The NT mice, shown in Fig. 7H–M, all demonstrate a positive skew, indicating that a greater proportion of the lung is expanding below the mean. Some of the PT mice have a negative skew while others have a positive skew, Fig. 7A–G.
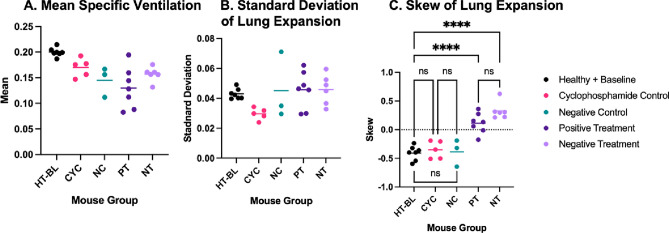
When comparing the mean and standard deviation of the lung expansion between the five analysis groups, there was no statistically significant difference between any of the groups (Fig. 8). Note that since there is no notable difference in mean specific ventilation, standard deviation, or skew between BL and HT assessed by the ANOVA, even with the increased radiation dose received by BL, we analysed these mice as a combined group called HT-BL. There was, however, a significant difference in the skew of lung expansion between the HT-BL group and the PT and NT groups (p < 0.001). This result supports the effect on lung function due to infection with P. aeruginosa, and importantly, there are no significant differences between any of the healthy or the control groups, indicating unlikely confounding factors.
Fig. 8.
Scatterplots analysing specific ventilation, comparing the A: mean specific ventilation; B: standard deviation of specific ventilation; and C: skew of specific ventilation; for the healthy and baseline mouse groups (HT-BL), cyclophosphamide control mouse group (CYC), negative control mouse group (NC), positive treatment mouse group (PT), and no treatment mouse group (NT). Significance has been set at p < 0.05, where ns denotes no significant difference and **** denotes p < 0.001.
Discussion
The lung expansion characteristics measured by XV provide information not only about function averaged across the lung, comparable to what is measurable using spirometry53, but also demonstrates the variability between different regions of the lung, via the standard deviation and the skew of the lung expansion histogram.
The baseline (BL) and healthy (HT) mouse groups show similar lung expansion histograms, in terms of mean, standard deviation and skew, helping to establish a baseline for healthy lung function using the described techniques. The only difference between these two groups is that the BL group received a small radiation dose associated with 2D imaging before the usual infection timepoint. A consistent negative skew is seen in the lung expansion histograms, see Fig. 6A–G, indicating a larger proportion of the lung is expanding above the mean specific ventilation. This is reflected by the regions of green, orange, and red in their lung expansion maps, see Fig. 4. Visually, they also consistently demonstrate uniformity in their PTA images, see Figs. 2A–G, indicating good lung aeration.
The features described above are also observed in the control group results, both NC and CYC, which isolated the effects of a PBS instillation (without infection), and of cyclophosphamide, respectively. In these groups there is a consistent negative skew seen in the histograms of lung expansion, Figs. 6H–O. The scatter plot in Fig. 8C shows no significant difference between the skew of the HT-BL, CYC, and NC groups with all p > 0.999.
The skew of the no treatment (NT) group, where infection is now delivered, is significantly different to that of all control groups (HT-BL, NC, CYC), with all exhibiting p < 0.001. The control groups all demonstrate a negative skew indicating that a larger proportion of the lungs is expanding by a larger amount. The longer tail to the distribution indicates that there are some parts of the lung which naturally expand less than a non-skewed distribution would predict. This perhaps corresponds to the edges of the lungs where expansion is limited by the presence of the chest wall. In contrast, the infected groups demonstrate a positive skew indicating that a larger proportion of the lungs is expanding by a smaller amount. In these mice there are some parts of the lung, however, that are expanding more than would be predicted by a non-skewed fit to the distribution, potentially corresponding to regions that have not been infected and remain at a higher expansion than the infected parts of the lungs. In other words, the distribution shifts towards poorer expansion in the case of the infected mice.
This difference in skew demonstrates a difference in lung expansion in the infected mice that can only be measured using a regional measure like XV. The skew of the positive treatment (PT) group is also significantly different to that of each of the control groups with all p < 0.001. Finally, there is no significant difference between the skew of the NT and PT groups. However, this is a relatively small population sample, and the large variability within these two groups suggests that a larger sample size is required.
The projected thickness of air (PTA) images structurally assess and demonstrate how obstruction and lung injury affect lung aeration. Loss of thickness in the PTA was not necessarily caused by a decrease in lung expansion, but rather a lack of lung aeration. There may be lung tissue that is damaged and exhibits reduced ventilation, however, if the lung tissue is still aerated, the PTA will look uniform, thus providing information about airway obstruction, but not function. This offered a novel structural assessment technique that allowed for the visualisation of obstruction in the airways, which prevents local lung aeration.
A visually-smooth PTA map, and thus relatively uniform lung aeration, was seen in mice in different intervention groups, for example HT3, CYC4, PT1, and NT1, see Fig. 2F and 2M, and Fig. 3A and 3H respectively. With only this structural assessment of the lung aeration we would not have been able to assess whether there were differences in function between those mice, and thus the treatment effect. However, when comparing the functional XV information, these mice demonstrate differences in their lung expansion. HT3 and PT1 demonstrate a consistent picture of health, where the PTA has visually-smooth thickness, indicating good lung aeration, and the lung expansion maps also demonstrate good lung expansion, as indicated by the areas of green and orange, see Figs. 4F and 5A respectively. CYC4 measurements also indicate healthy lungs with visually-smooth PTA thickness and good lung expansion, as indicated by the notable areas of green, see Fig. 4M. However, the PTA image for CYC4 does not capture the areas of orange seen in HT3 and PT1, indicating they have greater lung expansion. NT1 on the other hand, despite having good lung aeration in the PTA, demonstrates poor lung expansion (notable areas of blue) on the lung expansion map, see Fig. 5H, and a histogram sitting relatively low on the expansion axis, Fig. 7H. Thus, the structural information provided by the PTA alone does not fully characterise the effects of infection or treatment. Further functional testing using XV is required to determine this.
XV also allowed for regional assessment of lung function, not currently achieved by conventional lung function assessment techniques. An example of this is the mouse NT3, seen in Fig. 5J. In the representative mid-section slice the lung expansion map demonstrates a difference in lung function between the left and right lungs. The left lung is expanding well, as the lung field is predominantly green with areas of the lung expanding even more as indicated by the regions of orange and red. The right lung on the other hand is not expanding as well, with less green in the lung fields and more areas of turquoise and blue. Furthermore, we can see the differences in lung expansion in the lower region compared with the upper region of the lungs. The lower segment demonstrates good lung expansion (green/orange/red), whereas the upper segment demonstrates poor lung expansion (blue). For a fuller set of the NT3 lung expansion data please see Supplementary Figure S3. It is unknown what may have caused this regional variability in the lung expansion in NT3. It may be due to inconsistent delivery of the P. aeruginosa inoculum throughout the lung fields, or due to pre-existing differences in that mouse’s lung function.
While there was no significant difference detected in function between the PT and NT groups following bacteriophage therapy, this study demonstrates the utility of XV as a quantitative assessment of lung function. XV allowed us to also visualise the functional differences in different regions of the lungs. This regional assessment of lung function and expansion is not currently achieved with conventional spirometry techniques and could provide benefits for earlier disease detection and improved treatment planning. Furthermore, PTA was a qualitative technique that allowed the visualisation of aerated tissues in the lung to aid in structural assessment. By creating a mask of the lungs and removing the bones and other soft tissue, we were able to more clearly obtain qualitative information about the lung structure and visualise the aerated lung tissue.
There was one key outlier, which was Mouse NC3, with the lung expansion generating a histogram with multiple peaks, see Fig. 6J. The two dominant peaks are around 0% and 0.15% expansion, with a fitted mean of 0.113 and a skew of −0.636. This demonstrates that while the mouse had not been infected, it still has an area of lung with reduced lung expansion. This further demonstrates the capacity for XV to assess the regional lung function, as well as global function.
A key limitation of this study is the lack of gold-standard comparison, in both the assessment of lung function as well as biological analysis. Lung function assessment using devices such as the SCIREQ flexiVent would be beneficial to compare to the XV lung function results. In terms of validating the XV approach, early publications demonstrating lung XV in small animals have shown that the XV expansion measurements are consistent with measurements from an inline flow meter18.
No biological analysis of the mice was undertaken. As a result, we are unable to compare the functional assessments to any biological assessments to observe for correlation. Previous biological assessments of the same bacteriophage formulation performed by Chang et al. showed significant reduction in bacterial load 24 h post bacteriophage treatment38. They also demonstrated upregulation of cytokines in the lung parenchyma at 24 h post bacteriophage treatment indicating an ongoing inflammatory response. However, this reduction in bacterial load was not correlated with any functional assessment.
The timeline between treatment and functional assessment presents a limitation with our study design. While previous studies have shown bacterial load reduction 24 h post treatment, they also showed upregulation of inflammatory cytokines37. The lung inflammation caused by infection may impact the function and expansion of the lung parenchyma. Some studies have shown that it takes up to 72 h for lung function to return to normal following inoculation with P. aeruginosa54,55. Allowing more time for the mice to have recovered from the inflammation in the lungs may impact the results of functional assessment in future studies.
A further limitation of this study is that both the P. aeruginosa infection and the bacteriophage treatment were delivered intratracheally. This can result in inconsistent delivery of particles throughout the lungs, as described by Yang et al.56. Consequently, the bacteriophage may have been delivered to a different region of the lung than the infection, resulting in an infection-treatment mismatch.
The study is limited by the natural heterogeneity in lung function between different mice. In our analysis we are relying on baseline lung function and expansion to be comparable between groups. As demonstrated by the local variations in lung health seen in NC3, discussed above, this is not always the case. Due to radiation dose considerations, we do not have the time-resolved CTs that would be required to calculate the baseline lung function of the infected mice and thus the results may be confounded if mice in these groups naturally had reduced lung expansion compared with the control mice. We attempted to reduce this by using standardised mice of a specific breed. As a result, our experiment design used a model with separate groups for controls, rather than having a repeated-measures design where there were pre- and post- tests in each animal. This means there may have been something not-treatment-related that caused the differences seen in NC3.
Conclusion
This study successfully used phase contrast X-ray imaging and 4D X-ray velocimetry (XV) to assess lung function in a P. aeruginosa model of cystic fibrosis lung infection. We demonstrated that while structural changes may not be present in the CT scans and projected thickness of air, XV can still demonstrate functional changes in the lungs by measuring regional lung expansion. While there was no significant difference measured between those mice treated with the bacteriophage therapy and those given a placebo, the skew of the lung expansion histograms appears promising as a measure to assess lung expansion in future research, demonstrating a significant difference between infected and control mouse groups.
Supplementary Information
Acknowledgements
The experiments were completed at the Australian Synchrotron, part of ANSTO, under proposal 16760. We would like to acknowledge the IMBL beamline scientists Chris Hall, Daniel Hausermann, Anton Maksimenko, and Matthew Cameron. We thank Monash Biomedical Imaging and most particularly Mike de Veer for allowing us to use their laboratory. We thank Jian Li and and Jiping Wang from the Monash Biomedicine Discovery Institute for their assistance with the experiment. We acknowledge the funding from the National Health, Medical Research Council (NHMRC) of Australia, grant number APP1140617, and from fellowships ARC DECRA (DE180101133) and Future Fellowship (FT210100786).
Author contributions
Experimental design was conceived by RC, PC, MP, SD, MD, H-KC, and KM. Animal handling, and treatment preparation and delivery was performed by RC, CL, YW, and MC. Animal imaging expertise was provided by PC, NR, and MK. Image data was collected by YH, MP, DT, MD, and KM. Data analysis was performed by SH with assistance from DT, YH, and JP. Manuscript was written by SH with assistance from CW, KM, and other authors.
Funding
National Health,Medical Research Council (NHMRC) of Australia,APP1140617,APP1140617,APP1140617,Australian Research Council,DE180101133,FT180100374
Data availability
Data (30 TB raw CT scans) is available from authors upon request, by contacting the corresponding author at sah.corr@gmail.com.
Declaration
Competing interests
Martin Donnelley and Stephen Dubsky own shares in 4DMedical. Stephanie A. Harker, Melissa Preissner, Rachel Yoon Chang, David Trevascus, Chengxi Liu, Yuncheng Wang, Michael Yee Chow, Patricia Cmielewski, Nicole Reyne, Ying Ying How, James A. Pollock, Mitzi Klein, Christopher A. Wright, Hak-Kim Chan, and Kaye S. Morgan have no competing interests.
Footnotes
Publisher’s note
Springer Nature remains neutral with regard to jurisdictional claims in published maps and institutional affiliations.
Supplementary Information
The online version contains supplementary material available at 10.1038/s41598-024-80326-0.
References
- 1.Fyles, F., FitzMaurice, T. S., Robinson, R. E., Bedi, R., Burhan, H. & Walshaw, M. J. Dynamic chest radiography: a state-of-the-art review. Insights Imaging14 (2023). 10.1186/s13244-023-01451-4 [DOI] [PMC free article] [PubMed]
- 2.Kitchen, M. J. et al. CT dose reduction factors in the thousands using X-ray phase contrast. Scientific Reports7 (2017). 10.1038/s41598-017-16264-x [DOI] [PMC free article] [PubMed]
- 3.Endrizzi, M. X-ray phase-contrast imaging. Nucl. Instrum. Methods Phys. Res., Sect. A878, 88–98. 10.1016/j.nima.2017.07.036 (2018). [Google Scholar]
- 4.Bravin, A., Coan, P. & Suortti, P. X-ray phase-contrast imaging: From pre-clinical applications towards clinics. Phys. Med. Biol.58, R1–R35. 10.1088/0031-9155/58/1/R1 (2013). [DOI] [PubMed] [Google Scholar]
- 5.Lewis, R. A. Medical phase contrast x-ray imaging: Current status and future prospects. Phys. Med. Biol.49, 3573–3583. 10.1088/0031-9155/49/16/005 (2004). [DOI] [PubMed] [Google Scholar]
- 6.Hart, M. & Bonse, U. Interferometry with x rays. Phys. Today23, 26–31. 10.1063/1.3022280 (1970). [Google Scholar]
- 7.Snigirev, A., Snigireva, I., Kohn, V., Kuznetsov, S. & Schelokov, I. On the possibilities of x-ray phase contrast microimaging by coherent high-energy synchrotron radiation. Review of Scientific Instruments66, 5486–5492. 10.1063/1.1146073 (1995). [Google Scholar]
- 8.Cloetens, P., Barrett, R., Baruchel, J., Guigay, J. P. & Schlenker, M. Phase objects in synchrotron radiation hard x-ray imaging. J Phys D29, 133–146. 10.1088/0022-3727/29/1/023 (1996). [Google Scholar]
- 9.Ingal, V. N. & Beliaevskaya, E. A. X-ray plane-wave topography observation of the phase contrast from a non-crystalline object. J Phys D28, 2314–2317. 10.1088/0022-3727/28/11/012 (1995). [Google Scholar]
- 10.Momose, A., Phase-contrast X-ray imaging based on interferometry. J. Synchrotron Radiat.3 edn 136–142 (11972367). 10.1107/S0909049502003771 [DOI] [PubMed]
- 11.David, C., Nöhammer, B., Solak, H. H. & Ziegler, E. Differential x-ray phase contrast imaging using a shearing interferometer. Appl Phys Lett81, 3287–3289. 10.1063/1.1516611 (2002). [Google Scholar]
- 12.Hagen, C. K., Endrizzi, M., Towns, R., Meganck, J. A. & Olivo, A. A Preliminary Investigation into the Use of Edge Illumination X-ray Phase Contrast Micro-CT for Preclinical Imaging. Mol. Imaging Biol.22, 539–548. 10.1007/s11307-019-01396-5 (2020). [DOI] [PMC free article] [PubMed] [Google Scholar]
- 13.Wilkins, S. W., Gureyev, T. E., Gao, D., Pogany, A. & Stevenson, A. W. Phase-contrast imaging using polychromatic hard X-rays. NATURE384, 335–338. 10.1038/384335a0 (1996). [Google Scholar]
- 14.Gradl, R. et al. Propagation-based Phase-Contrast X-ray Imaging at a Compact Light Source. Scientific Reports7 (2017). 10.1038/s41598-017-04739-w [DOI] [PMC free article] [PubMed]
- 15.Yagi, N., Suzuki, Y., Umetani, K., Kohmura, Y. & Yamasaki, K. Refraction-enhanced x-ray imaging of mouse lung using synchrotron radiation source. Med. Phys.26, 2190–2193. 10.1118/1.598735 (1999). [DOI] [PubMed] [Google Scholar]
- 16.Gradl, R. et al. In vivo Dynamic Phase-Contrast X-ray Imaging using a Compact Light Source. Scientific Reports8 (2018). 10.1038/s41598-018-24763-8 [DOI] [PMC free article] [PubMed]
- 17.Kitchen, M. J. et al. Dynamic measures of regional lung air volume using phase contrast x-ray imaging. Physics in Medicine and Biology53, 6065–6077. 10.1088/0031-9155/53/21/012 (2008). [DOI] [PubMed] [Google Scholar]
- 18.Dubsky, S., Hooper, S. B., Siu, K. K. W. & Fouras, A. Synchrotron-based dynamic computed tomography of tissue motion for regional lung function measurement. Journal of the Royal Society Interface9, 2213–2224. 10.1098/rsif.2012.0116 (2012). [DOI] [PMC free article] [PubMed] [Google Scholar]
- 19.Murrie, R. P., Paganin, D. M., Fouras, A. & Morgan, K. S. Phase contrast x-ray velocimetry of small animal lungs: Optimising imaging rates. Biomedical Optics Express7, 79–92. 10.1364/BOE.7.000079 (2016). [DOI] [PMC free article] [PubMed] [Google Scholar]
- 20.Stahr, C. S. et al. Quantification of heterogeneity in lung disease with image-based pulmonary function testing. Scientific Reports6 (2016). 10.1038/srep29438 [DOI] [PMC free article] [PubMed]
- 21.Morgan, K. S. et al. In vivo x-ray imaging reveals improved airway surface hydration after a therapy designed for cystic fibrosis. Am. J. Respir. Crit. Care Med.190, 469–471. 10.1164/rccm.201405-0855le (2014). [DOI] [PMC free article] [PubMed] [Google Scholar]
- 22.Reyne, N. et al. Effect of elexacaftor-tezacaftor-ivacaftor on nasal potential difference and lung function in Phe508del rats. Front. Pharmacol.15 (2024). 10.3389/fphar.2024.1362325 [DOI] [PMC free article] [PubMed]
- 23.Werdiger, F. et al. Quantification of muco-obstructive lung disease variability in mice via laboratory X-ray velocimetry. Scientific Reports10 (2020). 10.1038/s41598-020-67633-y [DOI] [PMC free article] [PubMed]
- 24.Murrie, R. P. et al. Real-time in vivo imaging of regional lung function in a mouse model of cystic fibrosis on a laboratory X-ray source. Scientific Reports10 (2020). 10.1038/s41598-019-57376-w [DOI] [PMC free article] [PubMed]
- 25.Reyne, N. et al. Assessment of respiratory mechanics and X-ray velocimetry functional imaging in two cystic fibrosis rat models. Scientific Reports14 (2024). 10.1038/s41598-024-71632-8 [DOI] [PMC free article] [PubMed]
- 26.Bruorton, M. et al. Pilot study of paediatric regional lung function assessment via X-ray velocimetry (XV) imaging in children with normal lungs and in children with cystic fibrosis. BMJ Open14 (2024). 10.1136/bmjopen-2023-080034 [DOI] [PMC free article] [PubMed]
- 27.Kumar, P. J. & Clark, M. L. Kumar & Clark’s clinical medicine. Ninth edition. edn, (Edinburgh : Elsevier, 2017).
- 28.Goering, R. V. & Mims, C. A. Mims’ medical microbiology. 5th / by Richard V. Goering ... [et al.]. edn, (Edinburgh : Saunders, 2013).
- 29.Smith, W. D. et al. Current and future therapies for Pseudomonas aeruginosa infection in patients with cystic fibrosis. FEMS Microbiology Letters364 (2017). 10.1093/femsle/fnx121 [DOI] [PubMed]
- 30.Therapeutic Guidelines. Directed therapy for pneumnia, <https://tgldcdp-tg-org-au.ap1.proxy.openathens.net/viewTopic?etgAccess=true&guidelinePage=Antibiotic&topicfile=pneumonia-directed-therapy&guidelinename=Antibiotic§ionId=toc_d1e1128#toc_d1e1128> (2019).
- 31.Oliveira, V. D. C. et al. Expression of virulence factors by Pseudomonas aeruginosa biofilm after bacteriophage infection. Microb. Pathog.154 (2021). 10.1016/j.micpath.2021.104834 [DOI] [PubMed]
- 32.Høiby, N. Understanding bacterial biofilms in patients with cystic fibrosis: Current and innovative approaches to potential therapies. J. Cyst. Fibrosis1, 249–254. 10.1016/S1569-1993(02)00104-2 (2002). [DOI] [PubMed] [Google Scholar]
- 33.Laverty, G., Gorman, S. P. & Gilmore, B. F. Biomolecular mechanisms of Pseudomonas aeruginosa and Escherichia coli biofilm formation. Pathogens3, 596–632. 10.3390/pathogens3030596 (2014). [DOI] [PMC free article] [PubMed] [Google Scholar]
- 34.Skariyachan, S., Sridhar, V. S., Packirisamy, S., Kumargowda, S. T. & Challapilli, S. B. Recent perspectives on the molecular basis of biofilm formation by Pseudomonas aeruginosa and approaches for treatment and biofilm dispersal. Folia Microbiol.63, 413–432. 10.1007/s12223-018-0585-4 (2018). [DOI] [PubMed] [Google Scholar]
- 35.Hirsch, E. B. & Tam, V. H. Impact of multidrug-resistant Pseudomonas aeruginosa infection on patient outcomes. Expert Review of Pharmacoeconomics and Outcomes Research10, 441–451. 10.1586/erp.10.49 (2010). [DOI] [PMC free article] [PubMed] [Google Scholar]
- 36.Cao, B., Wang, H., Sun, H., Zhu, Y. & Chen, M. Risk factors and clinical outcomes of nosocomial multi-drug resistant Pseudomonas aeruginosa infections. Journal of Hospital Infection57, 112–118. 10.1016/j.jhin.2004.03.021 (2004). [DOI] [PubMed] [Google Scholar]
- 37.Aloush, V., Navon-Venezia, S., Seigman-Igra, Y., Cabili, S. & Carmeli, Y. Multidrug-resistant Pseudomonas aeruginosa: Risk factors and clinical impact. Antimicrobial Agents and Chemotherapy50, 43–48. 10.1128/AAC.50.1.43-48.2006 (2006). [DOI] [PMC free article] [PubMed] [Google Scholar]
- 38.Chang, R. Y. K. et al. The effects of different doses of inhaled bacteriophage therapy for Pseudomonas aeruginosa pulmonary infections in mice. Clinical Microbiology and Infection10.1016/j.cmi.2022.01.006 (2022). [DOI] [PubMed] [Google Scholar]
- 39.Maimaiti, Z., Li, Z., Xu, C., Chen, J. & Chai, W. Global trends and hotspots of phage therapy for bacterial infection: A bibliometric visualized analysis from 2001 to 2021. Front. Microbiol.13 (2023). 10.3389/fmicb.2022.1067803 [DOI] [PMC free article] [PubMed]
- 40.Hitchcock, N. M. et al. Current Clinical Landscape and Global Potential of Bacteriophage Therapy. Viruses15 (2023). 10.3390/v15041020 [DOI] [PMC free article] [PubMed]
- 41.Waters, E. M. et al. Phage therapy is highly effective against chronic lung infections with Pseudomonas aeruginosa. Thorax72, 666–667. 10.1136/thoraxjnl-2016-209265 (2017). [DOI] [PMC free article] [PubMed] [Google Scholar]
- 42.Li, M., Chang, R. Y. K., Lin, Y., Morales, S., Kutter, E. & Chan, H. K. Phage cocktail powder for Pseudomonas aeruginosa respiratory infections. Int. J. Pharm.596 (2021). 10.1016/j.ijpharm.2021.120200 [DOI] [PMC free article] [PubMed]
- 43.Debarbieux, L. et al. Bacteriophages can treat and prevent pseudomonas aeruginosa lung infections. J. Infect. Dis.201, 1096–1104. 10.1086/651135 (2010). [DOI] [PubMed] [Google Scholar]
- 44.Pabary, R. et al. Antipseudomonal bacteriophage reduces infective burden and inflammatory response in murine lung. Antimicrobial Agents and Chemotherapy60, 744–751. 10.1128/AAC.01426-15 (2016). [DOI] [PMC free article] [PubMed] [Google Scholar]
- 45.updated guidelines for reporting animal research. Percie du Sert, N. et al. The ARRIVE guidelines 2.0. J. Physiol.598, 3793–3801. 10.1113/JP280389 (2020). [DOI] [PMC free article] [PubMed] [Google Scholar]
- 46.Morgan, K. S. et al. Methods for dynamic synchrotron X-ray respiratory imaging in live animals. J. Synchrotron Radiat.27, 164–175. 10.1107/S1600577519014863 (2020). [DOI] [PMC free article] [PubMed] [Google Scholar]
- 47.Murrie, R. P. et al. Live small-animal X-ray lung velocimetry and lung micro-tomography at the Australian Synchrotron Imaging and Medical Beamline. J. Synchrotron Radiat.22, 1049–1055. 10.1107/S1600577515006001 (2015). [DOI] [PubMed] [Google Scholar]
- 48.Irvine, S. C., Paganin, D. M., Dubsky, S., Lewis, R. A. & Fouras, A. Phase retrieval for improved three-dimensional velocimetry of dynamic x-ray blood speckle. Appl Phys Lett93 (2008). 10.1063/1.3001592
- 49.Paganin, D., Mayo, S. C., Gureyev, T. E., Miller, P. R. & Wilkins, S. W. Simultaneous phase and amplitude extraction from a single defocused image of a homogeneous object. J. Microsc.206, 33–40. 10.1046/j.1365-2818.2002.01010.x (2002). [DOI] [PubMed] [Google Scholar]
- 50.Gureyev, T. E. et al. Toolbox for advanced X-ray image processing. Proceedings of SPIE - The International Society for Optical Engineering Vol. 8141 81410B-81410B-81414 (Bellingham Wash: SPIE, Bellingham Wash, 2011). 10.1117/12.893252
- 51.Ashour, S. K. & Abdel-hameed, M. A. Approximate skew normal distribution. J. Adv. Res.1, 341–350. 10.1016/j.jare.2010.06.004 (2010). [Google Scholar]
- 52.Dubsky, S., Thurgood, J., Fouras, A., Thompson, B. R. & Sheard, G. J. Cardiogenic Airflow in the Lung Revealed Using Synchrotron-Based Dynamic Lung Imaging. Scientific Reports8 (2018). 10.1038/s41598-018-23193-w [DOI] [PMC free article] [PubMed]
- 53.Kirkness, J. P. et al. Association of x-ray velocimetry (XV) ventilation analysis compared to spirometry. Front. Med. Technol.5 (2023). 10.3389/fmedt.2023.1148310 [DOI] [PMC free article] [PubMed]
- 54.Wölbeling, F. et al. Lung function and inflammation during murine Pseudomonas aeruginosa airway infection. Immunobiology216, 901–908. 10.1016/j.imbio.2011.02.003 (2011). [DOI] [PubMed] [Google Scholar]
- 55.Wölbeling, F., Munder, A., Stanke, F., Tümmler, B. & Baumann, U. Head-out spirometry accurately monitors the course of pseudomonas aeruginosa lung infection in mice. Respiration80, 340–346. 10.1159/000319442 (2010). [DOI] [PubMed] [Google Scholar]
- 56.Yang, L. et al. Multimodal Precision Imaging of Pulmonary Nanoparticle Delivery in Mice: Dynamics of Application, Spatial Distribution, and Dosimetry. Small15 (2019). 10.1002/smll.201904112 [DOI] [PubMed]
Associated Data
This section collects any data citations, data availability statements, or supplementary materials included in this article.
Supplementary Materials
Data Availability Statement
Data (30 TB raw CT scans) is available from authors upon request, by contacting the corresponding author at sah.corr@gmail.com.


