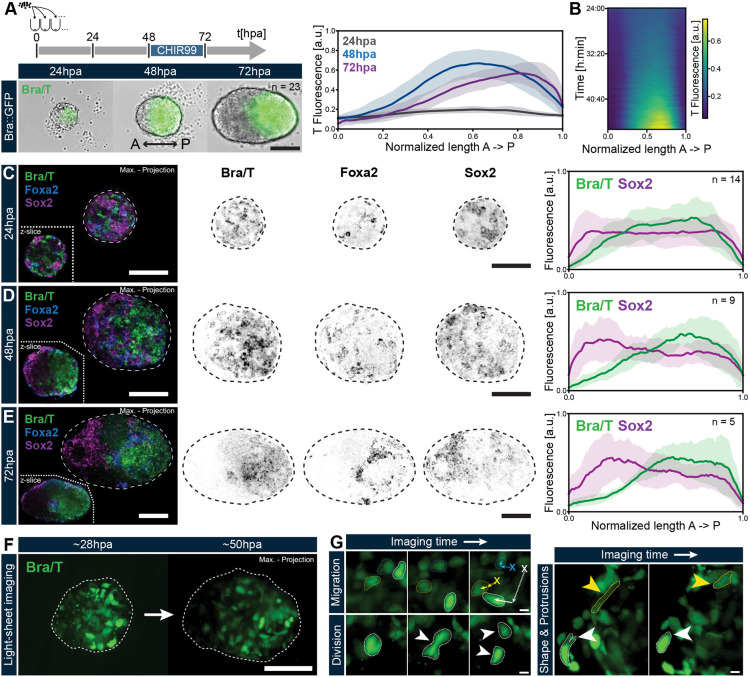
Fig. 1.
Autonomous AP axis formation in gastruloids is demarcated by T polarization and accompanied by variable cell behaviours. (A) Gastruloids were generated from T::GFP mESCs as previously described (Anlas et al., 2021), including a pulse of CHIR99 from 48 to 72 hpa. T symmetry breaking occurs by 48 hpa. Scale bar: 200 µm. Right panel displays T fluorescence intensity of the same n=23 gastruloids at 24, 48 and 72 hpa, plotted along the normalized AP axis length. Central lines indicate the mean intensity values of the included samples; surrounding shades mark the standard deviation. (B) Averaged kymograph of T expression along the AP axis of n=13 gastruloids, live imaged from 24 to 48 hpa, illustrates progression of T polarization over developmental time. (C-E) Hybridization chain reaction (HCR) in situ stainings for T, Foxa2 (anterior mesendoderm) and Sox2 (pluripotent and neural progenitors) in gastruloids at 24, 48 and 72 hpa, showing the arrangement of germ layer primordia pre- and post-T polarization. Scale bars: 100 µm. Right hand panels show quantifications of T and Sox2 fluorescence along the gastruloid AP axis (defined by localization of T expression) based on sum intensity projections of the HCR data for each timepoint. Data are mean±s.d. (F) Representative images of live imaging of gastruloids from T::mESCs, captured via LSFM showing the T polarization process and associated cellular dynamics. Aggregate shape was inferred via SIR-DNA counterstains. Scale bar: 100 µm. (G) Examples of cell behaviours displayed across LSFM datasets by T+ cells during aggregate-wide polarization. White arrowheads indicate cell protrusions; yellow arrowheads indicate cell shape change. Scale bars: 10 µm. The contrasts of the fluorescent channels have been adjusted for display purposes.

