Abstract
Automated assessment of noise level in clinical computed tomography (CT) images is a crucial technique for evaluating and ensuring the quality of these images. There are various factors that can impact CT image noise, such as statistical noise, electronic noise, structure noise, texture noise, artifact noise, etc. In this study, a method was developed to measure the global noise index (GNI) in clinical CT scans due to the fluctuation of x-ray quanta. Initially, a noise map is generated by sliding a 10 × 10 pixel for calculating Hounsfield unit (HU) standard deviation and the noise map is further combined with the gradient magnitude map. By employing Boolean operation, pixels with high gradients are excluded from the noise histogram generated with the noise map. By comparing the shape of the noise histogram from this method with Christianson’s tissue-type global noise measurement algorithm, it was observed that the noise histogram computed in anthropomorphic phantoms had a similar shape with a close GNI value. In patient CT images, excluding the HU deviation due the structure change demonstrated to have consistent GNI values across the entire CT scan range with high heterogeneous tissue compared to the GNI values using Christianson’s tissue-type method. The proposed GNI was evaluated in phantom scans and was found to be capable of comparing scan protocols between different scanners. The variation of GNI when using different reconstruction kernels in clinical CT images demonstrated a similar relationship between noise level and kernel sharpness as observed in uniform phantom: sharper kernel resulted in noisier images. This indicated that GNI was a suitable index for estimating the noise level in clinical CT images with either a smooth or grainy appearance. The study’s results suggested that the algorithm can be effectively utilized to screen the noise level for a better CT image quality control.
Keywords: CT, image quality, noise, global noise index
1. Introduction
Computed tomography (CT) images are prone to noise, which can significantly impact image diagnosis, organ delineation, image registration, and various image analysis technique (Murphy et al 2008, Juluru et al 2013, Chen et al 2017). Therefore, it is crucial to have an automated method to measure and evaluate the noise level in clinical CT images to ensure their quality. Several techniques have been developed to estimate the noise in CT images, such as image subtraction (Tian and Samei 2016), global noise index (GNI) in tissue (Christianson et al 2015), organ-specific region of interest (ROI) (Abadiet al 2017), noise measure in the air outside body (Malkus and Szczkutowicz 2017), and the smallest SD noise algorithm (Anam et al 2021). Among these methods, GNI is widely used to assess noise in clinical CT images and has been employed to establish reference levels for image noise and radiation dose (Ahmad et al 2023). Furthermore, researchers have extended the GNI algorithm to optimize its parameters to improve the accuracy of noise level measurement (Ahmad et al 2021a, 2021b).
Several factors contribute to CT image noise, including statistical noise, electronic noise, structure noise, texture noise, artifact noise, and various scanned parameters such as mAs, slice thickness, reconstruction kernel, reconstruction algorithm, pitch, patient’s scanned position, and scanned immobilization device. Typically, the standard deviation (SD) of the Hounsfield unit (HU) is used to quantify image noise within a region of interest. While measuring SD in a uniform phantom is straightforward, it becomes more complex for clinical exam due to variable anatomy and differences in scanning techniques. In clinical image, the distribution of the noise SD map may be skewed due to the presence of other noise sources. For instance, CT scanner for Radiation Oncology Department often involve scanning patient on a flat tabletop, introducing molds that restrict patient movement and is embedded in a locked bar with high density such that streak artifacts are created. Arms are often placed by the patient’s side instead of above the head as is typical with diagnostic imaging, and contrast material may be present too. To compute a reliable GNI, the anatomical structures, artifacts, or other non-human variables need to be removed from the CT images. Traditionally, this was accomplished by computing only the noise SD across the entire scan and then masking out regions with skewed distributions.
Anatomical structure constitutes gradient in images which directly increases the SD of HU in the pixel located in a neighbor with large gradient. We hypothesized that a noise map combined with the image gradient to exclude pixels with a high gradient from the noise histogram generation will result a noise distribution more reproduce random noise due to photon fluctuation. We aimed to utilize the technique as an automated noise level assessment tool to compare and audit CT images generated by different scanners and different protocols.
2. Method and material
2.1. Automatic noise measurement algorithm
Non-anatomical pixels were eliminated by applying an Otsu threshold filter to the original CT images, followed by a post morphology process to get rid of small objects, while preserving the anatomic objects.
A gradient magnitude map (grad. mag. Map) was generated by calculating the gradient of the CT image with only anatomic image pixels using a Sobel filter in both x and y directions for each pixel. The magnitude of the gradient at a pixel was determined as the square root of the x-gradient and y-gradient. To minimize the impact of grainy noise on gradient calculation, a median filter was used to smooth the CT image before computing the gradient.
To create a noise map, a suitable kernel size was sliding over the masked CT image obtained from step ‘1’ to compute the SD of HU within the pre-defined ROI size. A reference ROI size of 10 × 10 pixels was used throughout phantom study. The sensitivity of GNI compared to ROI size was evaluated in real CT scans.
A global noise histogram (GNH) associated with gradient was established for each CT images slice by performing a Boolean (conjunction) operation on the noise map and gradient magnitude map to exclude the noise values calculated from pixels with a gradient magnitude greater than 10 (an empirical threshold selection based on reviews of grad. mag. map over CT images from thorax to pelvis). The histogram was binned with a size of 0.1 HU, and the mode of the histogram was identified as the GNI of the CT image.
The GNI created using the aforementioned algorithm is referred as GNIgrad in this text to distinguish it from the GNI obtained using Christianson’s tissue-type-associated GNI (referred to as GNIdx). GNIgrad does not require the delineation of any specific organ or region of interest and can be applied to the entire CT images covering the entire scan length. Tests were conducted to explore the situations where GNIrad and GNIdx exhibit significant differences.
2.2. Validation of gradient associated global noise measurement
In phantom validation was carried out on two CT scanners: (a) Philips Big Bore CT scanner (CTp) utilizes dose right (DR) for automatic modulation of tube current (TCM) and iDose for iterative reconstruction (IR), (b) Siemens Biograph PETCT scanner (CTs) utilizes Care Dose for TCM by assigning quality reference mAs (QRM) and SAFIRE for the IR. CT images of a paraspinal case and a brain case were reconstructed using the smooth reconstruction kennel (Br32; B denotes for body, r denotes regular), regular reconstruction kernel (Br38), sharp reconstruction kernel (Br49), very sharp reconstruction kernel (Br58–68) to create varying levels of noise for testing the GNI with both algorithms. GNI’s sensitivity to the ROI size (from 2 to 30 pixels) was studied, too.
Table 1 outlines the clinical protocols for both scanners, including the scanned parameters and reconstruction kernels used for scanning the phantom. It further presents the ROI sizes compared on the clinical images from two anatomical sites.
Table 1.
Scanned protocol and image acquisition parameters in phantom and in clinical scanned images of this study.
| In phantom | In clinical scan | |
|---|---|---|
| kV | 120 | 120 |
| Scan protocols | Thorax; abdomen | Paraspinal; brain+ |
| Slice thickness (3 mm) | 3 | 2; 1 |
| Tube current modulation | Yes | Yes; no |
| Quality reference mAs* | 160, 200, 250 | 270; -+ |
| Dose right** | 17,19,21,23,25 | |
| Iterative reconstruction | SAFIRE-3*; iDose-3** | SAFIRE-3 |
| Reconstruction kernel | Br38*/regular** | Br32, Br38, Br49, Br58, Br62; Hr32. Hr38, Hr49, Hr60, Hr68, Hf38 |
| ROI size (pixel) | 10 | 2, 4, 6, 10, 20, 30 |
at CTs;
at CTp;
no ATC using CTDIvol of 70.3 mGy.
2.2.1. In phantom comparison between scanners and phantom size versus GNH
An adult-sized anthropomorphic phantom (rando phantom) with anatomical range from neck to pelvis was used to compare the GNH using the gradient level associated algorithm proposed in this study and Christianson’s tissue type associated algorithm. The tissue type of HU between −100 and 100 HU in the anthropomorphic phantom study was used in Christianson’s algorithm. Additional 5 cm water equivalent bolus layers was placed on top of the phantom to denote a larger size phantom in contrast to the original phantom without bolus as the small size phantom. The phantom’s water equivalent diameter (wED) was calculated based on the method described in the AAPM Task group report TG220 (McCollough et al 2014).
There were 12 scans (2 protocols, 3 QRMs, 2 phantom sizes) acquired with CTs and 20 scans (2 protocols, 5 DR levels, 2 phantom sizes) with CTp. Each scan comprised of 220 cross sectional axial slices. A total of 7040 GNHs were computed and compared using both GNI algorithms. With GN3p, GN50p, GN97p, GNmean, and GNI as the descriptors of GNH, a paired t-test was used to analyze the 7040 GNHs. P-value < 0.05 is considered statically different. To quantitatively compare the difference of the GNH generated by the two algorithms, the root means square error (RMSE) of the five GNH descriptors was calculated and compared.
2.2.2. Variation of GNIgrad between scanners and between protocols in phantom
A further validation of the GNIgrad in phantom was to evaluate the GNIgrad versus the CTDIvol. The latter was extracted from the DICOM header of each CT slice. The large and small phantoms were scanned at CTp scanner, which is not organ (e.g. thorax and abdomen) dependent, using five different strength level of AEC (DR)—17, 19, 21, 23, 25. Same phantoms were scanned at CTs scanner using both thorax and abdomen protocols of three different QRMs (170, 200, 250).
2.2.3. Comparison of GNIs between scanners and between protocols in clinical CT images
To evaluate the robustness of GNI at patient’s CT images, patients at scanned at CTp and CTs within one-month (Jan/2024) were evaluated for breast patients (to represent thorax site) and pelvis patients. The breast and pelvis protocols were close to the thorax and abdomen protocols of current study’s evaluation in phantoms (2.2.2).
2.2.4. Variation of GNIgrad among different ROI size and among reconstruction kernels in clinical CT images
The impact of GNI dependency on various reconstruction kernels ranging from smooth to sharp was examined in a lengthy paraspinal patient. Additionally, the influence of ROI size on GNI sensitivity was also evaluated. Comparative tests were conducted using both GNIgrad and GNIdx for comparison.
3. Results
3.1. Algorithm demonstration
Figure 1 illustrates step 1 through 4 of the proposed algorithm for calculating the GNI. The characteristic (shape and magnitude) of the GNH was quantitatively defined by the noise histogram by various percentile such as 3% (GN3p), 50% (GN50p), 97% (GN97p), as well as the mean (GNmean), and mode (GNI) of the noise level. The histogram plots in figure 1 highlight the distinction between the gradient-associated GNIgrad (for gradient magnitude>10) noise histogram and tissue type-associated GNIdx (−100 < HU < 100) noise histogram.
Figure 1.
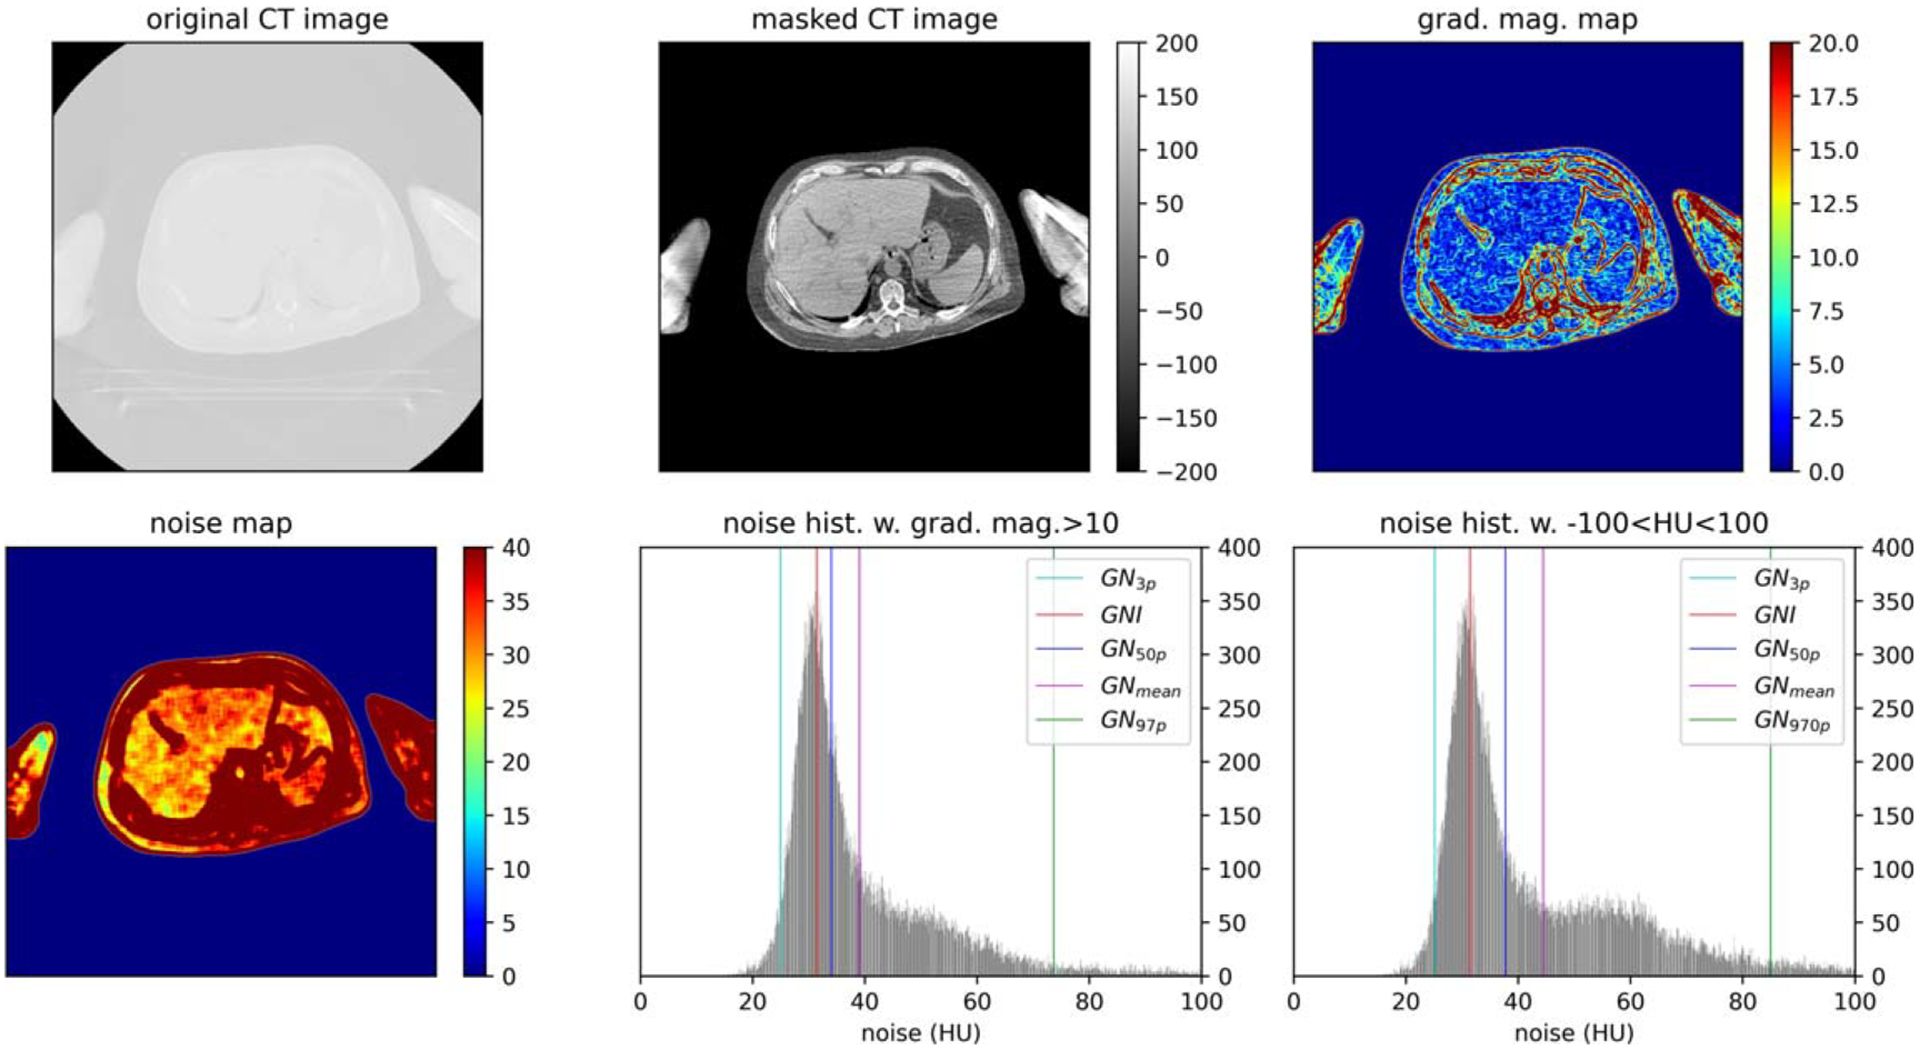
Global noise histogram (GNH) generation process: removal of non-anatomical pixels from the original CT image to masked CT image using Otsu thresholding; compute the gradient magnitude map; compute the noise map; generate GNI from noise map boolean operation with grad. mag.> 10 or boolean operation with HU between (−100,100) such that noise values at pixel with high gradient is excluded.
In figure 2, the top image depicts a lung cancer patient who underwent a contrast enhanced scan. The introduction of contrast altered the Hounsfield Unit (HU) in the tissue from sternum to the heart, narrowing the range of available search to the soft tissue outside the rib cage within the [−100,100] HU range. The low image in figure 2 showed a groin cancer patient with CT scan from lower abdomen to the upper leg. The presence of a heterogeneous structure in the abdominal cavity introduced tissue structure noise which was excluded in GNIgrad’s calculation. In the inferior leg, soft tissue becomes a smaller portion of the CT image and there are a large portion of fat-muscle-bone interface increasing HU variation from pixel to pixel. The demonstrated scenarios were the example when the assigned [−100,100] HU became non-ideal and made the selected tissue HU being sub-optimal in these two scans. On the contrary, using GNIgrad demonstrated minimal sensibility to tissue inhomogeneities within CT images and yielded more consistent GNI values across the entire scanned region.
Figure 2.
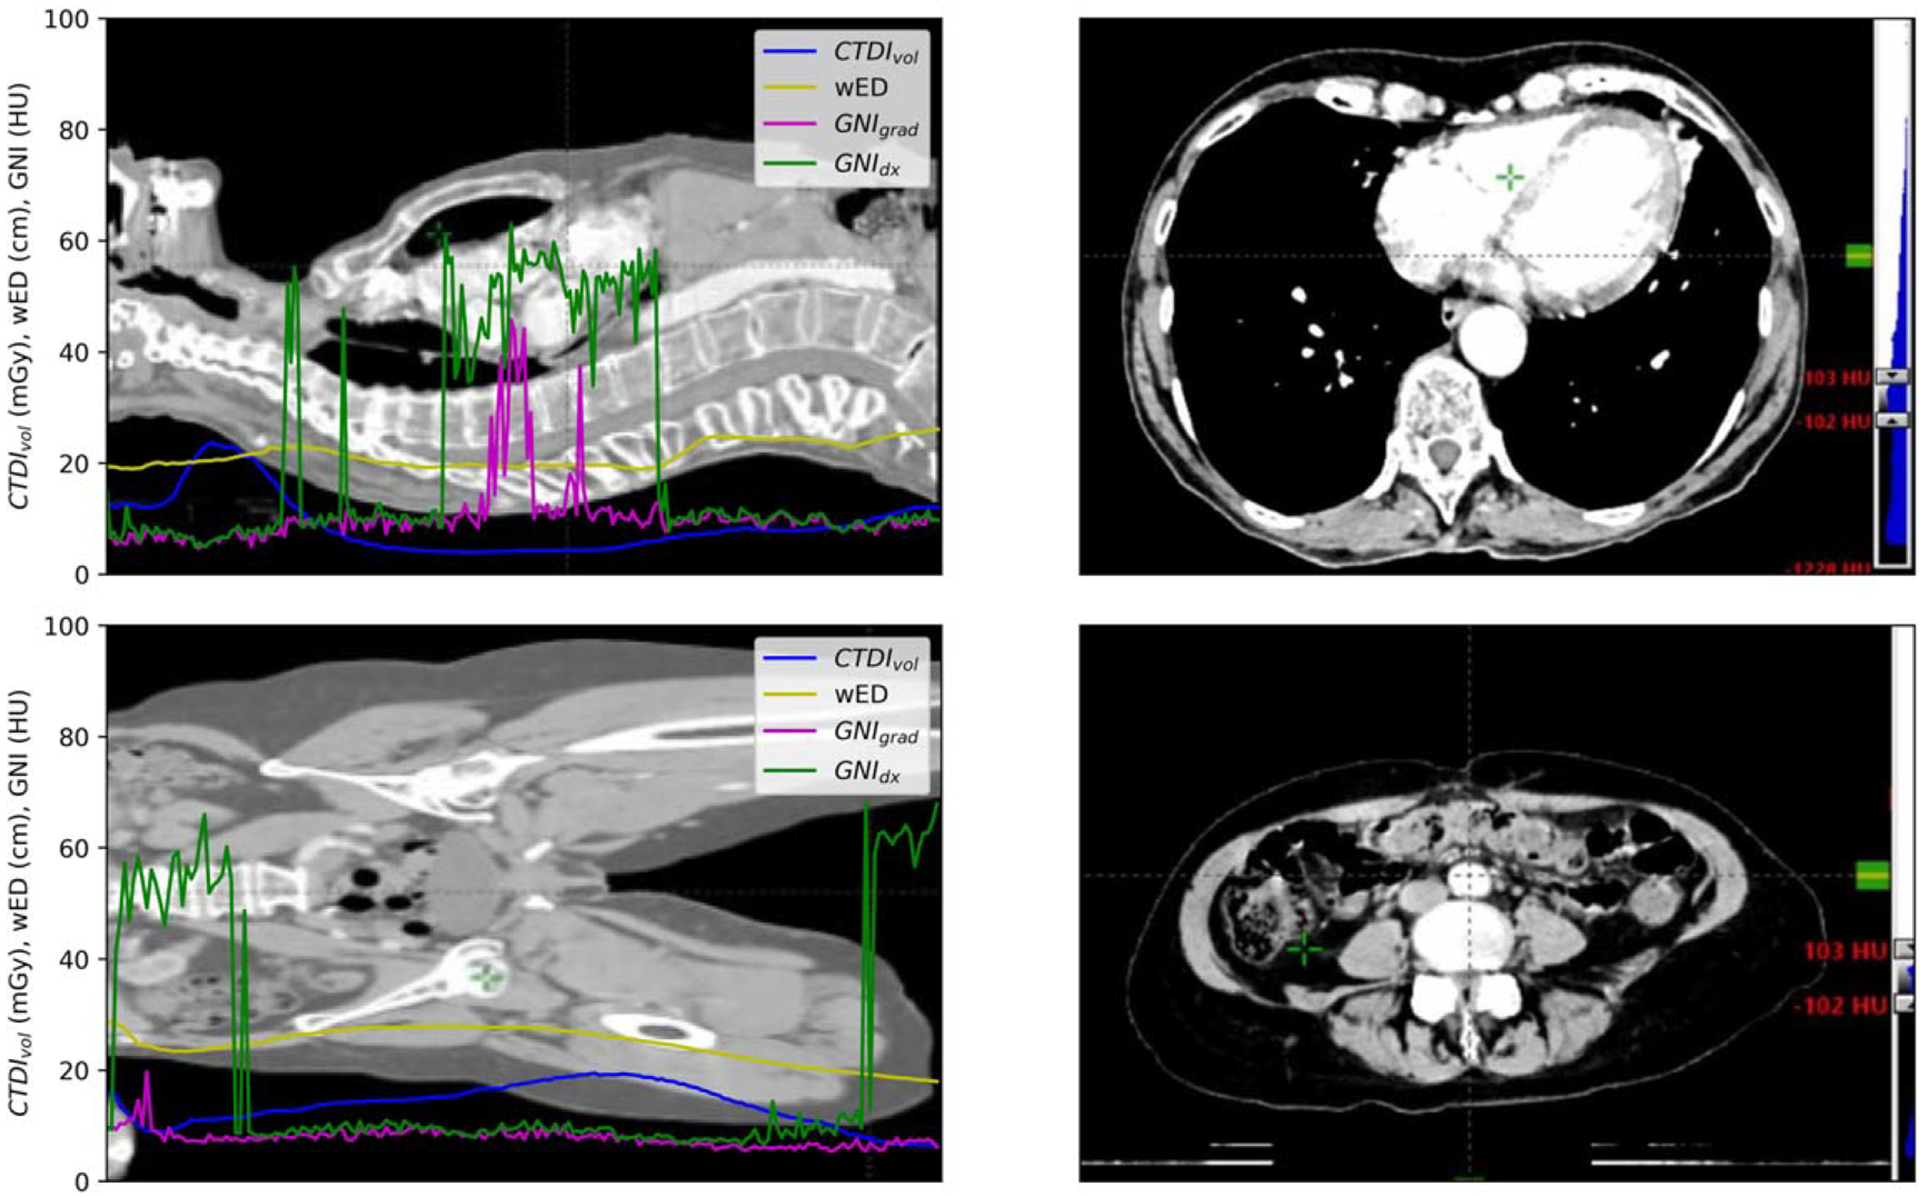
The CTDIvol, wED, GNIgrad, and GNIdx distribution along the scanned length of lung (up left) and groin patient (low left). Right site shows the CT image window at [−100, 100] to demonstrate the scenarios of the images with large GNIdx values.
3.2. Validation of gradient associated global noise measurement
3.2.1. In phantom comparison between scanners and phantom size versus GNH
There were no significant differences (p < 0.001) observed in all the evaluated descriptors between the two algorithms. The mean ± SD of the RMSE per scanner and phantom size are summarized in table 2. The RMSE values obtained from both scanners were similar. However, the RMSEs calculated from the large phantom size were slightly larger than those calculated from the small phantom size, except for RMSE97p. When comparing the generated (GN3p and GNI) by the two algorithms, it was found that 95% of the values fell within the range of 1 to 2 HU. Similarly, for GN50p and GNmean, 95% of the values differed within 10 HU. The major difference in the generated GNH between the two algorithms was observed in GN97p, with a mean difference of approximately 20 HU.
Table 2.
Summary of the root mean square error between two global noise algorithms in the noise frequency at 3%, 50%, 97% percentile, mean, and mode.
| RMSE3p | RMSE50p | RMSE97p | RMSEmean | RMSEmode | |
|---|---|---|---|---|---|
| Siemens-L | 0.4 ± 0.1 | 2.8 ± 2.8 | 16.1 ± 1.4 | 6.1 ± 1.4 | 0.3 ± 0.4 |
| Siemens-S | 0.2 ± 0.1 | 1.3 ± 1.4 | 23.3 ± 7.7 | 4.7 ± 2.5 | 0.3 ± 0.4 |
| Philips-L | 0.5 ± 0.1 | 2.8 ± 2.7 | 13.1 ± 6.1 | 6.3 ± 1.4 | 0.7 ± 0.8 |
| Philips-S | 0.3 ± 0.1 | 1.6 ± 1.6 | 28.0 ± 8.0 | 5.3 ± 2.7 | 0.4 ± 0.4 |
Figure 3 illustrates the linear correlation between GNIgrad and GNIdx. For small phantom (with a mean wED 0f 23 cm), the difference in GNI ranged from 3 to 10 HU. On the other hand, For the large phantom (with a mean wED of 28 cm), the difference in GNI values range from 4 to 14 HU. It is worth noting That the GNIdx was slightly higher than the GNIgrad, as indicated by the RMSE values in table 2.
Figure 3.
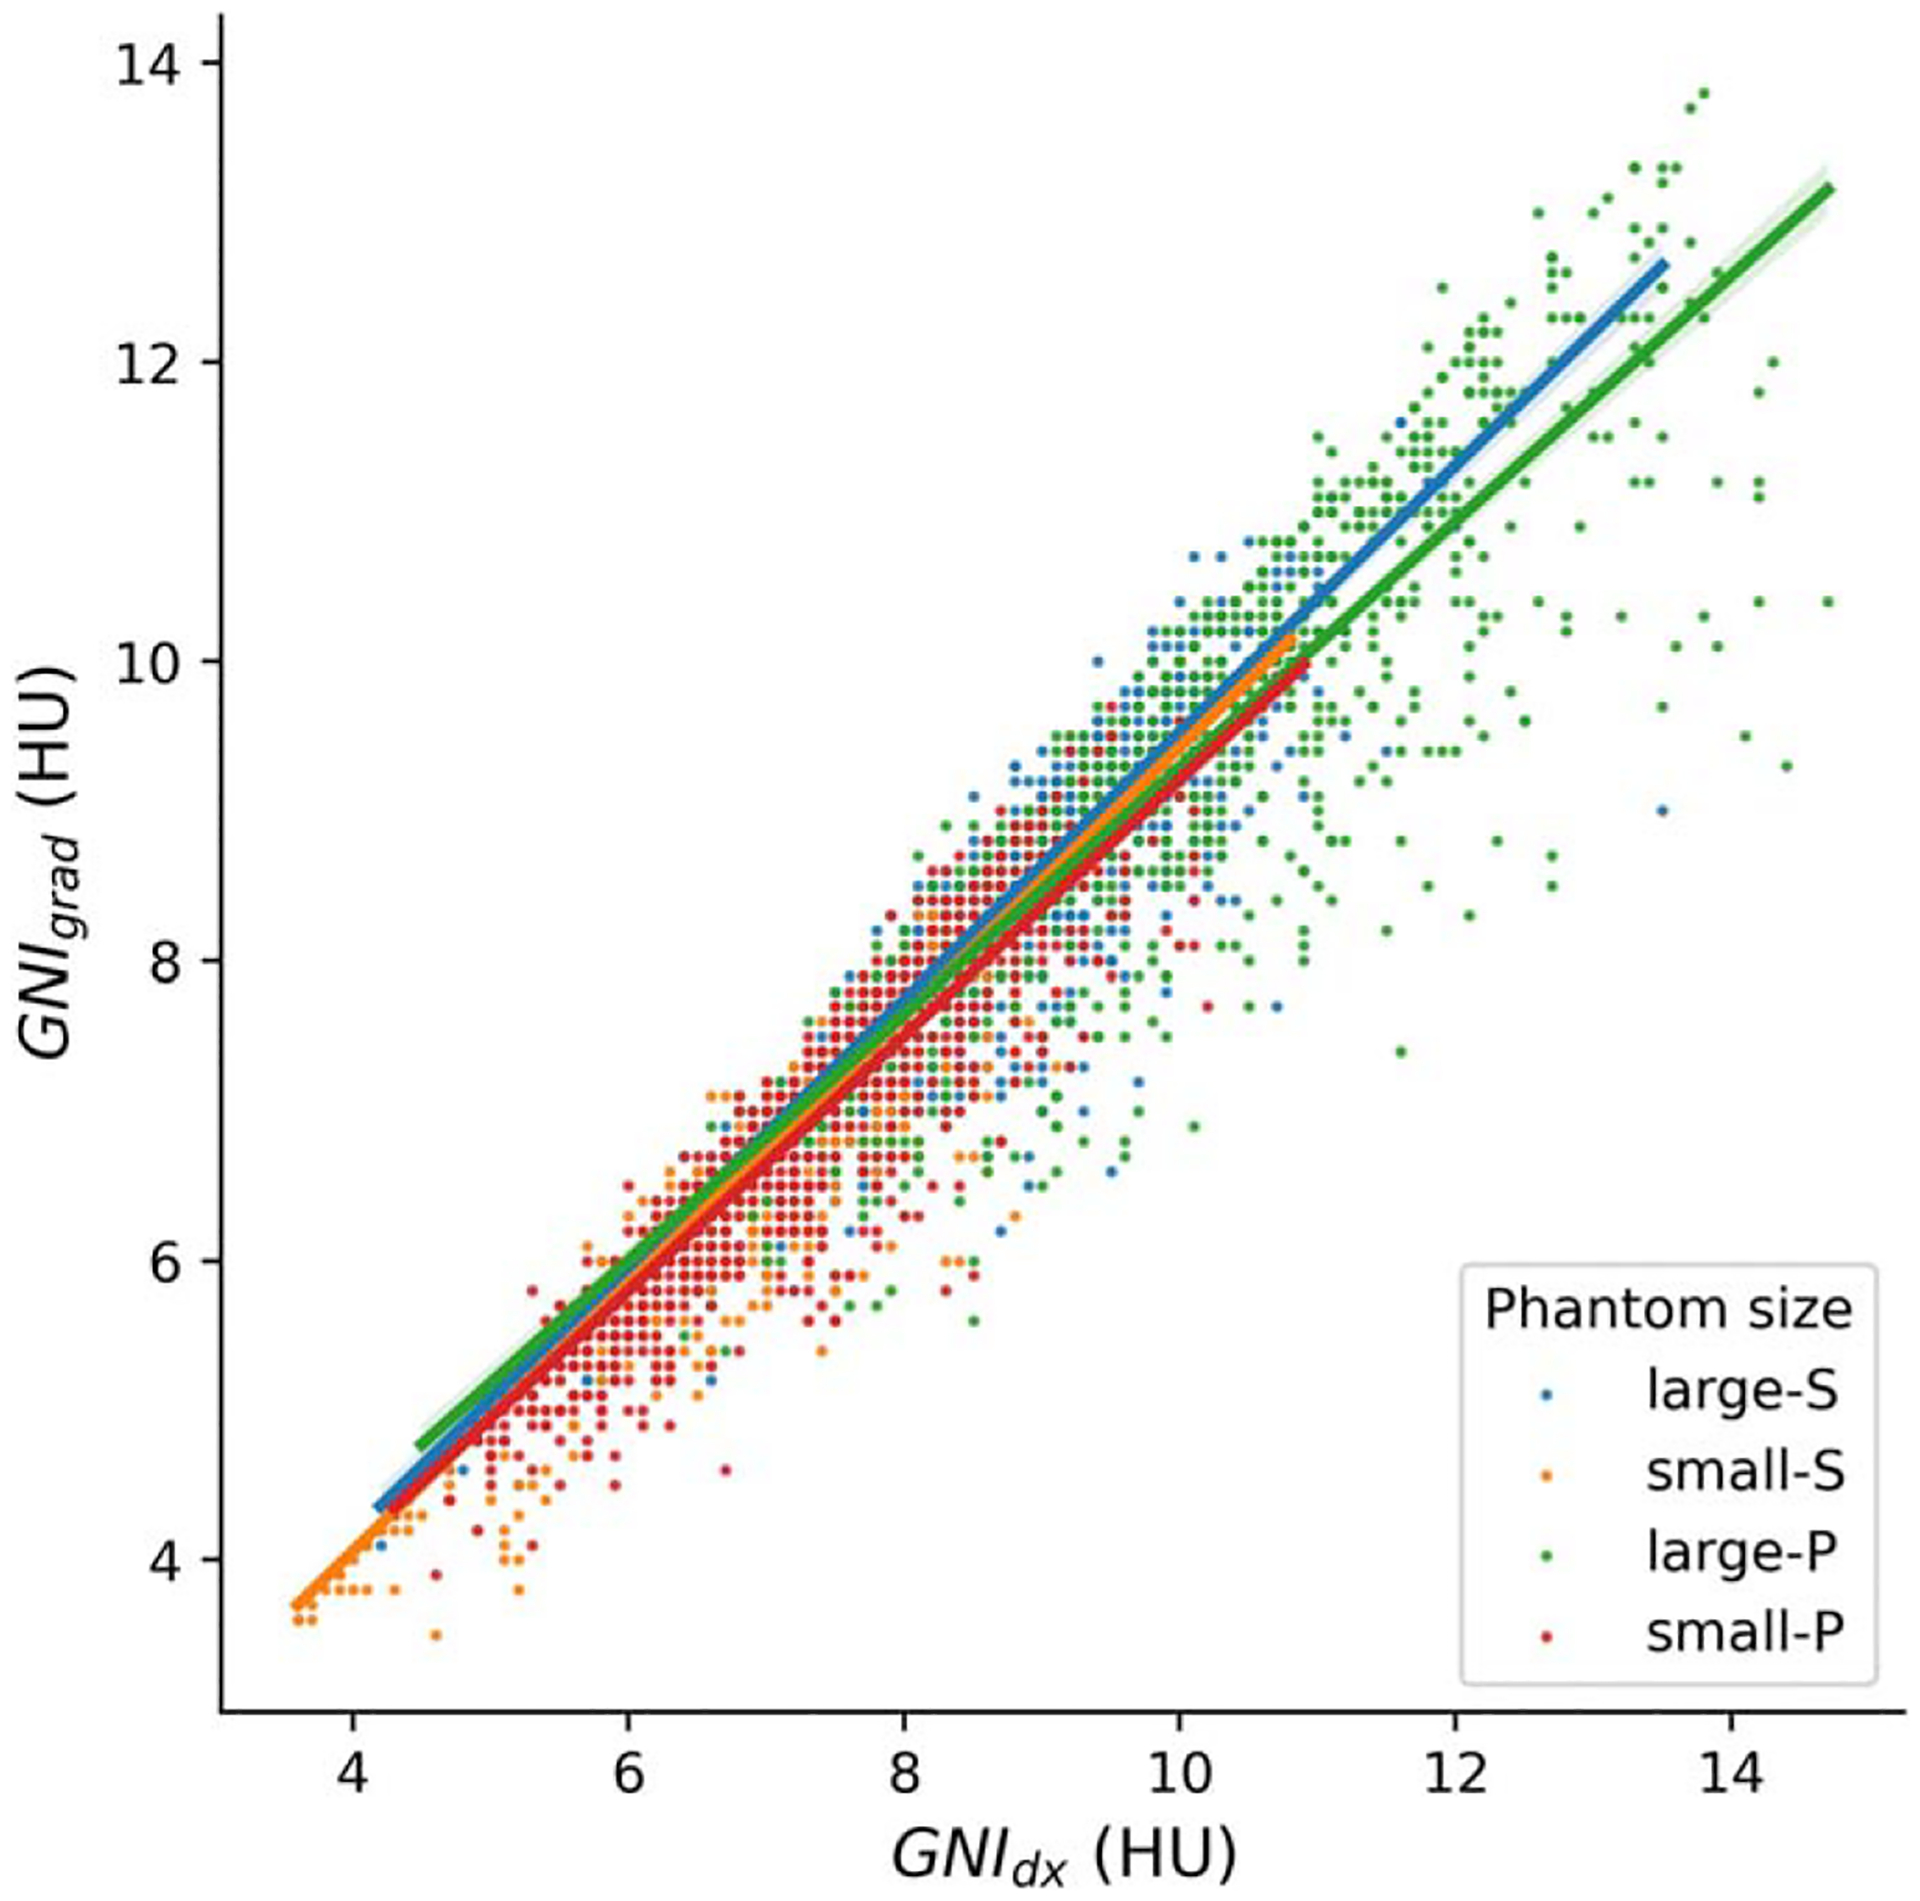
Scatter plots with line fit of GNI Versus GNIgrad for two phantom sizes at two scanners.
3.2.2. Variation of GNIgrad between scanners and between protocols in phantom
Figure 4 illustrates the relationship between GNIgrad versus the CTDIvol for both the large and small phantoms. In the right panel of figure 4, the change in GNIgrad for scans obtained with CTp. As the level of DR increased, there was a corresponding decrease of GNIgrad of approximately 5.5%. This decrease closely aligns with the manufacture’s specification that each level of DR increase would result in a 6% reduction in noise1. On the left panel of figure 3, the scanned exams at CTs are displayed. A higher QRM, which leads to an increased TDIvol, resulted in a decrease in GNIgrad. The abdomen protocol exhibits stronger modulation of mAs stronger in the large size phantom compared to the thorax protocol, and there is a noticeable variation in CTDIvol along the scanned length from neck to pelvis. This variation is implemented to minimize lung dose.
Figure 4.
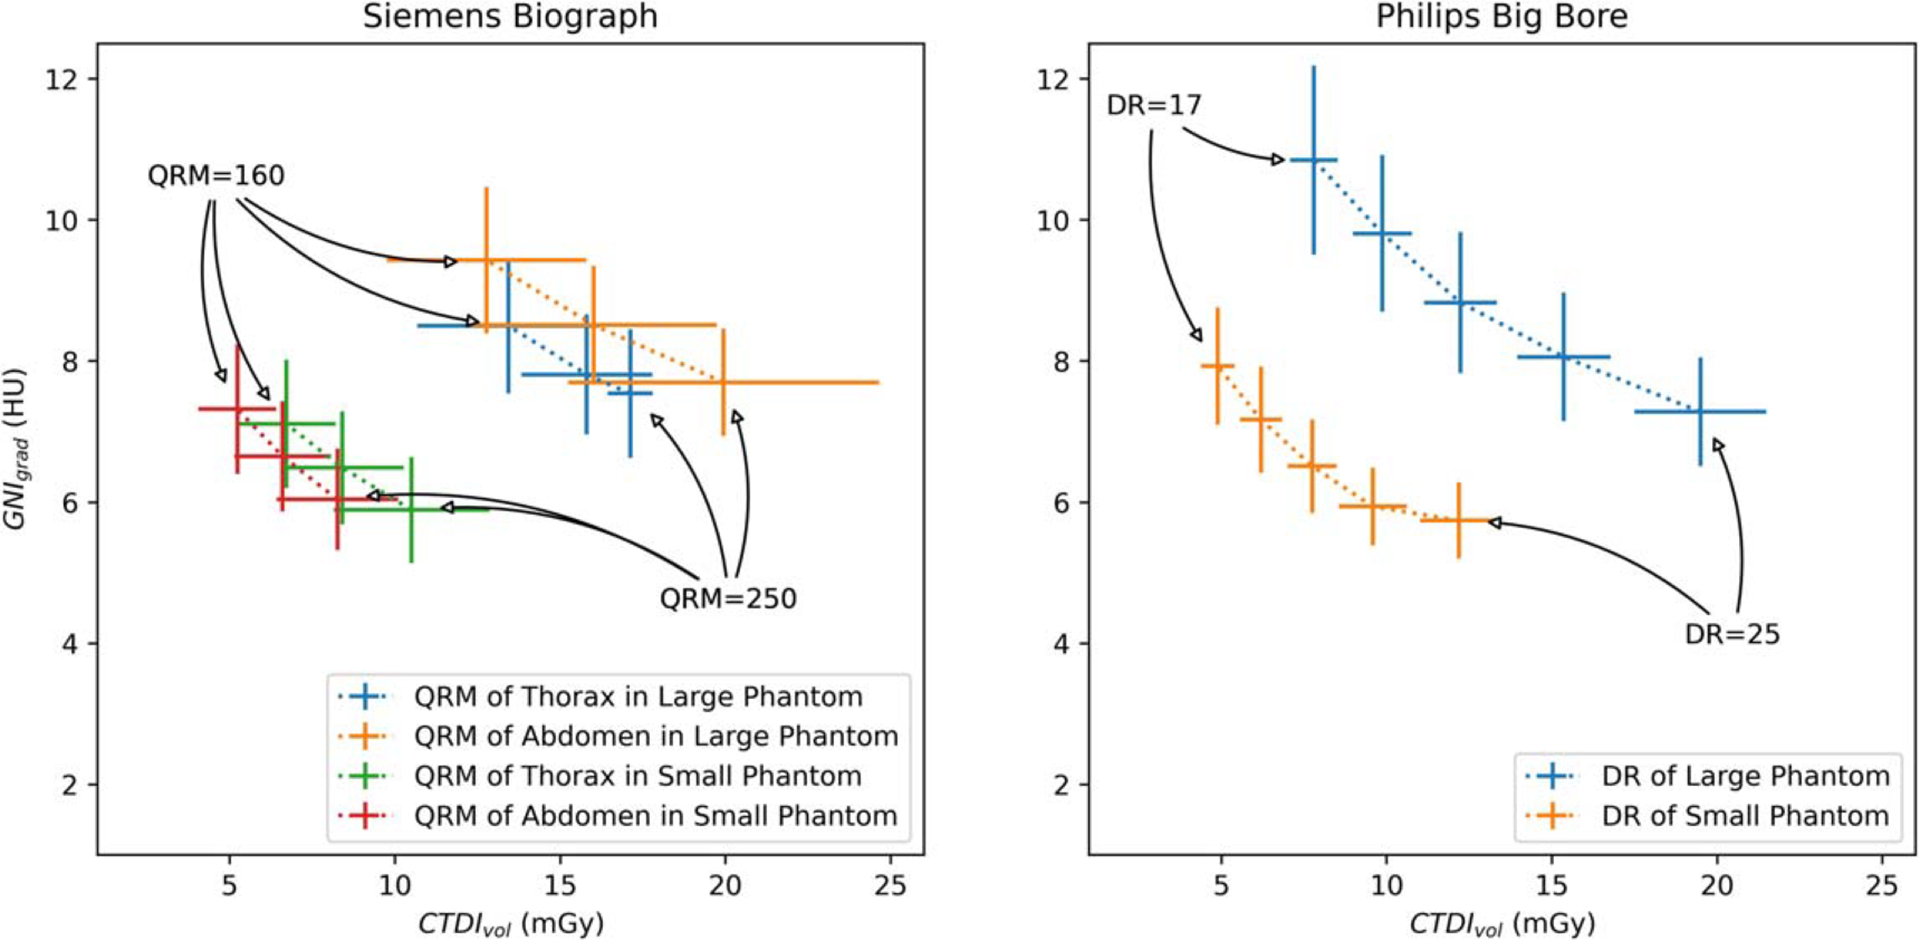
GNIgrad Versus CTDIvol of the phantom scans using different scanned protocols with different tube current modulation settings (Fig. left, QRM: 160, 200, 250 from left to right; Fig. right, DR: 17, 19, 21, 23, 25, from left to right) for each scanner.
3.2.3. Comparison of GNIs between scanners and between protocols in clinical CT images
In figure 5. A comparison is made between GNIgrad and GNIdx in terms of CT noise assessment s patients wED for breast patients and pelvis patients scanned at CTp and CTs scanners. An ideal TMC should effectively regulate tube current to ensure a consistent noise level. The results of the comparison indicate that, for both scanned protocols and scanners, the use of GNIgrad in CT assessment results in less variation among patients and within the CT images of the same patient.
Figure 5.

Scatter plot comparison of GNIgrad versus GNIdx for series of breast and pelvis patient’s CT images scanned at two different scanners. Error bar shows one standard deviation (SD) of wED over each scanned patient and one SD of GNI at each study.
3.2.4. Variation of GNI among reconstruction kernels and among different ROI size in clinical CT images
Figure 6 illustrates the GNI per slice superimposed on the topogram for two patients using regular reconstruction kernel (Br38 and Hr38) and sharp reconstruction kernel (Br58/Hr60). The scanned CTDIvol and the calculated wED of each CT slice were also displays on the topogram. The sharper kernel (Br58/Hr60) resulted in a 4-fold increase in global noise compared to the regular kernel (Br38/Hr38). The GNIs associated with tissue type did not show significant differences from those associated with gradient magnitudes (paired-t test p < 0.001 for all comparison). Analysis of the overlaid GNI plots, reveled major discrepancies in the lung, bowel, and tissue interface near the shoulder. GNIs were high in and around the frontal skull area (figure 5 right, first 0–20 image slices with GNI > 40) due due to air interfaces or bone structures causing insufficient pixels for GNH evaluation. As a result, these initial 20 images were excluded from further analysis.
Figure 6.
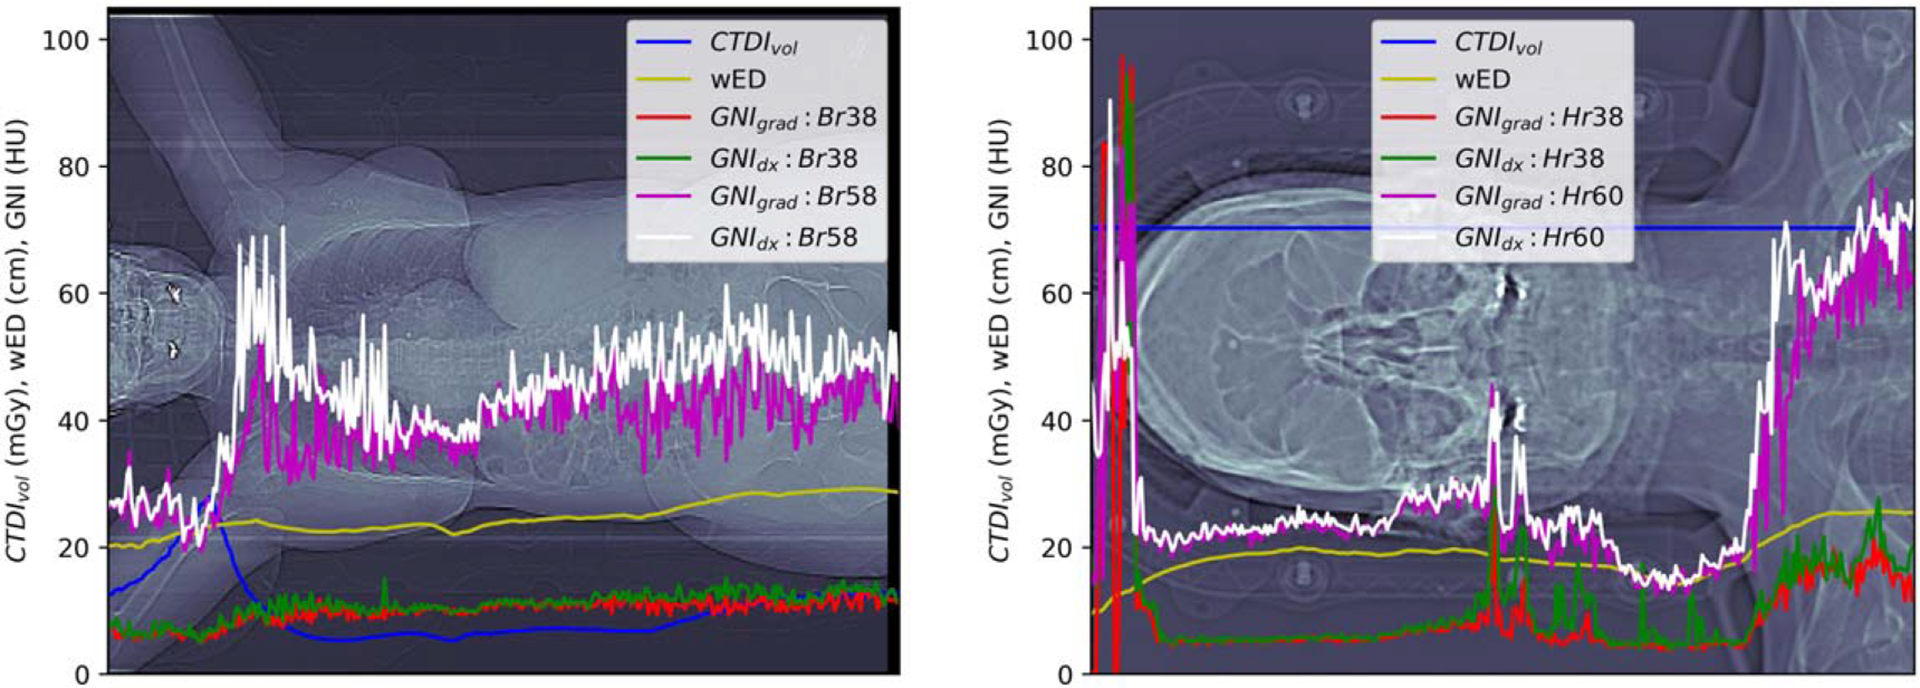
GNIs computed at each CT slice reconstructed with regular (Br38 or Hr38) or sharper (Br58 or Hr60) kernels. CTDIvol and wED was the scanned CTDIvol extracted from dicom of the image slice and the calculated wED. The wED at the shoulder of the brain scan was underestimated due to the CT cut off of the shoulders due to the small FOV.
The boxplots of figure 7 illustrate that as the kernel sharpness increased relative to the regular kernel, the noise magnitude also increased. When comparing to the regular kernel (38), each 10-level shaper kernel resulted in images with approximately double the noise level. Siemens introduced a subtype fine kernel (f) with noise texture at the same resolution which is finer compared to the regular subtype. Brain CT images reconstructed using head fine kernel at level 38 (Hf38) exhibited the same noise level as CT images reconstructed using the head regular kernel (Hr38). Clinical benefits of utilizing a finer kernel justify further investigation.
Figure 7.
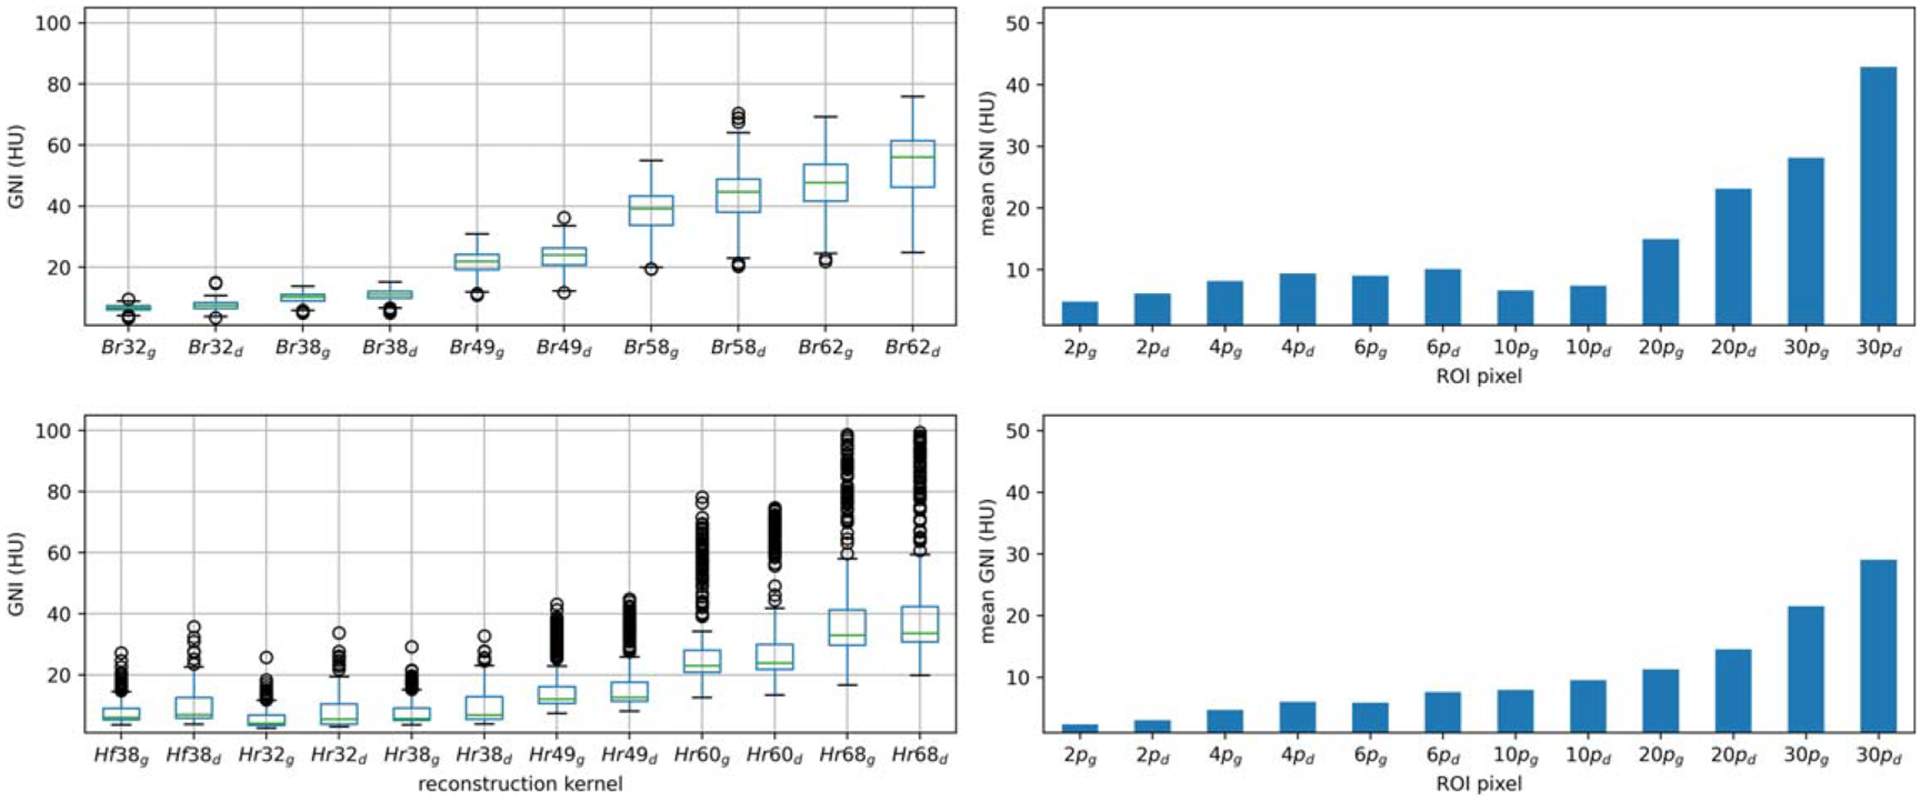
Boxplots (left; up-paraspinal case, bottom-brain case) showed the variation of the global noise index Versus the reconstruction kernel from smooth kernel to sharp kernel. Bar charts (right; up-paraspinal case, bottom-brain case) showed the sensitivity of the mean global noise index on the choice of ROI size. Subscript ‘g’ denotes the parameter calculated for GNIgrad; subscript ‘d’ denotes the parameter calculated for GNIdx.
The sensitivity of the mean GNI across different ROI sizes is depicted in the bar plots presented in figure 7. The range of the ROI size varies from 2 × 2 pixels to 30 × 30 pixels. In the paraspinal case, the pixel size was 1.3 mm, while in brain case, it was 0.7 mm. Both plots demonstrated minimal changes in the mean GNI for ROI size smaller than 10 pixels. However, a significant increase in GNI increase was observed for pixel sizes close to 20 mm (20 pixels and 30 pixels at paraspinal and brain cases, respectively). Based on the findings, an ROI size of 10 pixels was deemed appropriate for both the paraspinal and brain cases, aligned with the suggested kernel size of 6–20 mm in Christianson’s paper.
4. Discussion
The statistical noise that occurs due to the fluctuation of x-ray quanta is known as random noise. The proposed algorithm hypothesizes that the random noise distribution of an image can be better approximated in the noise SD calculation by taking off the noise sources due to structure or texture change. To achieve this, the algorithm combines the computation of the noise map with the gradient map. Pixels located in areas with a gradient magnitude higher than a predetermined values are excluded from the noise SD calculation. After reviewing the gradient magnitude map of the typical head, thorax, abdomen, and pelvis CT images, a threshold value of 10 was chosen. When comparing the shape of the noise histogram (GNH) generated by this method with the one produced by Christianson’s tissue type global noise measurement algorithm, both GNH computed in anthropomorphic phantoms exhibited similar shape with identical GN3p and GNI. There was a slight discrepancy in GNmean and a significant discrepancy at GN97p.
The clinical image analysis revealed that GNIgrad values were slightly smaller than GNIdx in most of the CT image containing a significant amount of soft tissue. However, a more pronounced GNI difference was observed in CT image sections with higher lung or bowel content. This could be attributed to the suboptimal HU threshold utilized in this study for GNI’s calculation in CT image with increasing lung and bowel presence. When it comes to radiation planning CT images, which typically employed regular smooth/sharpness kernel with a viewing window setting at soft tissue (abdomen) or cerebrum (brain), utilizing gradient associated GNI offers the advantage of not needing to optimize the tissue type for noise level computation in CT scans involving various anatomical regions.
The proposed GNI is suitable for comparing scan protocols among different model of scanners and is useful in auditing CT image quality within the same scanner. Our phantom studies reveled that the TCM in Siemens scanner adjusted mAs modulation based on organ type, resulting a large mAs (CTDIvol) variation compared to the TCM in Philips scanner. Interestingly, with the same QRM, utilizing abdomen protocol modulated mAs differently from thorax protocol. When performing clinical CT scans, it is essential to select the appropriate scan protocol suitable for the task and anatomical site being scanned. The variation of GNI Versus different reconstruction kernels in clinical CT images displayed a similar relationship of noise level from smooth to sharp kernel as observed in a uniform phantom, meaning that shaper kernels produced noisier images. This illustrated that GNI serves as a reliable noise level index for estimating the noise level in clinical CT images with smooth or grainy appearance.
The study had a limitation in that it only used the [−100, 100] HU tissue type GNI measurement as reference, without comparing to another method that may be be closer to the ground truth in clinical CT image. For example, it did not consider using GNI calculated with an optimal tissue/organ dependent threshold setting (Ahmad et al 2021a, 2021b) or noise level estimated with ROI locations selected by experts. Additionally, the choice of the gradient magnitude threshold was based on visual inspection and was not optimized. However, the study’s results demonstrated the feasibility of applying the algorithm to screen the noise level in CT images scanned from different scanners and different protocols.
5. Conclusions
A method was developed to enhance the accuracy of noise estimation in clinical CT images by removing pixels with higher gradient magnitude to stratify the random noise. This technique allows for the comparison of image quality across various scanning protocols and different scanners, as well as the evaluation of the effectiveness of reconstruction kernels. This approach offers an automatic and objective means of assessing noise level in CT images.
Funding related to this work
This work was partially supported by the MSK Cancer Center Support Grant/Core Grant (P30 CA008748).
Footnotes
Conflict of interest
None.
Patient-centered CT image: New methods for patient specific optimization of image quality and patient dose: Philips document.
Data availability statement
All data that support the findings of this study are included within the article (and any supplementary information files).
References
- Abadi E, Sanders J and Samei E 2017. Patient-specific quantification of image quality: an automated technique for measuring the distribution of organ Hounsfield units in clinical chest CT images 44 4736–46 [DOI] [PubMed] [Google Scholar]
- Ahmad M et al. 2021a. A benchmark for automatic noise measurement in clinical computed tomography Med. Phys 48 640–7 [DOI] [PubMed] [Google Scholar]
- Ahmad M et al. 2023. Oncology-specific radiation dose and image noise reference levels in abdominal-pelvic CT Clin. Imaging 93 52–9 [DOI] [PMC free article] [PubMed] [Google Scholar]
- Ahmad M, Tan D and Marisetty S 2021b. Assessment of the global noise algorithm for automatic noise measurement in head CT examinations Med. Phys 48 5702–11 [DOI] [PMC free article] [PubMed] [Google Scholar]
- Anam C et al. 2021. An improved method of automated noise measurement system in CT images J. Biomed. Phys. Eng 11 163–74 [DOI] [PMC free article] [PubMed] [Google Scholar]
- Chen G-P et al. 2017. Improving CT quality with optimized image parameters for radiation planning and delivery guidance Phys. Imaging Radiat. Oncol 46–1128253929 [Google Scholar]
- Christianson O, Winslow J, Frush DP and Samei E 2015. Automated technique to measure noise in clinical CT examinations Am. J. Roentgenol 205 W93–9 [DOI] [PubMed] [Google Scholar]
- Juluru K et al. 2013. Effects of increased image noise on image quality and quantitative interpretation in brain CT perfusion Am. J. Neuroradiol 34 1506–21 [DOI] [PMC free article] [PubMed] [Google Scholar]
- Malkus A and Szczkutowicz TP 2017. A method to extract image noise level from patient image in CT Med. Phys 44 2173–84 [DOI] [PubMed] [Google Scholar]
- McCollough C et al. 2014. Use of Water Equivalent Diameter for Calculating Patient Size and Size-specific Dose Estimation (SSDE) in CT 220 The Report of AAPM Task Group ( 10.37206/146) [DOI] [PMC free article] [PubMed] [Google Scholar]
- Murphy MJ et al. 2008. How dose CT image noise affect 3D deformable image registration for image-guided radiotherapy planning? Med. Phys 35 1145–53 [DOI] [PubMed] [Google Scholar]
- Tian X and Samei E 2016. Accurate assement and prediction of noise in clinical CT images Med. Phys 43 475–82 [DOI] [PubMed] [Google Scholar]
Associated Data
This section collects any data citations, data availability statements, or supplementary materials included in this article.
Data Availability Statement
All data that support the findings of this study are included within the article (and any supplementary information files).


