

Abstract
Dopaminergic (DA) neurons play a crucial role in associative learning, but their capacity to regulate behavior on subsecond timescales remains debated. It is thought that DA neurons drive certain behaviors by rapidly modulating striatal spiking activity; however, a view has emerged that only artificially high (i.e., supra-physiological) DA signals alter behavior on fast timescales. This raises the possibility that moment-to-moment striatal spiking activity is not strongly shaped by DA signals in the physiological range. To test this, we transiently altered DA levels while monitoring spiking responses in the ventral striatum of behaving mice. These manipulations led to only weak changes in striatal activity, except when DA release exceeded reward-matched levels. These findings suggest that DA neurons normally play a minor role in the subsecond modulation of striatal dynamics in relation to other inputs and demonstrate the importance of discerning DA neuron contributions to brain function under physiological and potentially non-physiological conditions.
Introduction:
The striatal regulation of learning, movement, motivation, and decision-making is thought to critically depend on DA signaling1. Abnormal levels of striatal DA are implicated in several disorders including Parkinson’s disease, addiction, and depression2,3. Yet despite significant progress, our understanding of DA’s complex modulatory functions in the striatum is incomplete and remains the subject of intense study and controversy. Nevertheless, the commonly accepted dogma is that striatal DA neurons serve two major functions4. First, they regulate synaptic plasticity, a protracted process that is essential for associative learning5,6. Second, they are considered capable of strongly modulating ongoing striatal neural spiking activity on short, subsecond timescales7,8. This rapid modulatory process appears better suited for influencing imminent or ongoing behavioral performance. This view has earned wide support from behavioral studies showing that altering DA levels influences online movement initiation, reward-motivated approach, and action selection9–14. This is further buttressed by data that, in addition to canonical reward prediction error (RPE) – a signal implicated in reinforcement learning15 – DA neurons and their striatal projections encode rapid behavioral processes such as the initiation and performance of ongoing movements16–19. Owing to the underlying premise that moment-to-moment striatal dynamics are strongly coupled to DA signals, it is implicitly assumed that DA encoding of such behaviors is functionally important for performing them20.
In contrast to this line of evidence, an opposing view has emerged that under physiological conditions, DA neurons play only a minor role in subsecond behavioral control21–24. But crucially, a considerably enhanced effect appears when DA levels are artificially raised above physiological levels12,21. However, it is unclear if the distinct behavioral effects observed at different DA levels are reflected in the spiking activity of neurons receiving DA input. For example, it is conceivable that physiological levels of DA still play a major role in rapidly shaping neural activity even if robust behavioral effects were not observed in prior work.
The lack of clear consensus about DA neurons’ role in subsecond behavioral control, suggests the need to reconsider the electrophysiological evidence on which this argument hinges – that striatal spiking activity is strongly and rapidly influenced by physiological DA signals. Superficially, this dependence appears to have been already established, as there is a large body of literature using in vivo and ex vivo measurements to show that DA indeed influences striatal activity. Historically, efforts to understand DA’s modulatory effects on striatal activity initially relied on iontophoretically applied DA25–27, which was not calibrated to physiological DA levels, or electrical stimulation of the midbrain or medial forebrain bundle, which non-specifically activated DA circuits28–30. This was followed by pharmacological manipulation of DA neurons or receptors20,31, as well as chronic DA lesions32–34. These approaches are primarily intended to examine the protracted modulatory contributions of DA (e.g., synaptic plasticity) that occur over multiple seconds to weeks. But they are less suited for identifying rapid electrophysiological effects on subsecond timescales. Optogenetic manipulations address both the need for fast temporal control and cellular specificity3,7,8,35. However, most previous studies based on this technique did not adequately consider the potential distinction between physiological and supra-physiological DA levels. Consequently, while the presentation of food rewards raises striatal DA levels by 10–100 nM10, numerous studies employing optogenetically evoked striatal DA release exceeded those levels – thereby accessing a potentially supra-physiological regime that does not accurately reflect normal function. In summary, due to a variety of limiting factors, previous studies have fallen short of directly addressing to what extent reward-matched or other physiologically calibrated DA signals control striatal spiking activity on subsecond timescales.
To address this significant gap, we examined the ability of DA neurons to elicit strong changes in striatal spiking activity on subsecond timescales. We focused on the role of DA in the ventral striatum during the delivery of unexpected rewarding stimuli, precisely because these stimuli elicit large and rapid DA responses in the ventral striatum36 – and thus, in principle, appear ideally suited to drive strong electrophysiological effects. Since unexpected rewards induce concurrent changes in striatal firing patterns37, we tested whether DA signals are necessary or sufficient for driving reward-evoked neural activity in the ventral striatum. Experiments were carried out by optogenetically increasing or decreasing DA neuron activity while simultaneously monitoring ventral striatal DA and electrophysiological activity. This combined approach enabled a systematic study of striatal dynamics under calibrated reward-matched and supra-reward DA signaling conditions.
We found that reward-matched DA levels had only a small, inconsistent effect on striatal neuron firing rates, whereas artificially elevating DA to supra-reward magnitudes produced robust electrophysiological effects. The small effect size stood in contrast to the markedly stronger electrophysiological changes caused by manipulating a non-DA input to the striatum. Together, these results have three key implications. First, these observations indicate that DA signals at physiological levels (i.e., levels evoked by food rewards) play a relatively minor role in rapidly shaping neural activity in the striatum. This is surprising given that DA signals appear to correlate well with moment-to-moment behavioral variables such as movement kinematics and vigor, and this correlation has often been assumed to suggest strong causal relevance of DA in performing those behaviors. Thus, on rapid timescales, striatal spiking is likely to be primarily influenced by non-DA inputs. Second, these data provide a plausible mechanism to explain previous negative behavioral results, in which reward-matched DA stimulation failed to meaningfully alter performance12,21,24. Finally, the significant enhancement of electrophysiological effects seen at supra-reward DA levels illustrates the potential for overestimating the importance of DA if the supra-physiological regime is not identified as such. Collectively, this work places important constraints on the magnitude of DA neurons’ contribution to striatal dynamics on subsecond timescales.
Results:
Monitoring DA and spiking activity in the ventral striatum
In order to measure neural population activity in the ventral striatum under calibrated levels of change in DA signaling, we constructed an opto-probe device consisting of a multielectrode recording array on a silicon microprobe, coupled to an optical fiber for photometry (Fig. 1a). The optical fiber was used for fluorescence-based DA monitoring in the vicinity of the electrodes with the genetically encoded sensor dLight1.238. The opto-probe was implanted in the nucleus accumbens area of the ventral striatum in head-restrained food-restricted mice. In each animal, the electrodes captured the spiking response of tens of single-units (mean ± SD: 95 ± 44 neurons) alongside photometric data on local DA signaling changes. Another optical fiber was implanted in the ventral tegmental area (VTA) to allow for optogenetic manipulation of DA neurons using virally mediated Cre-dependent opsin expression in DAT-Cre mice (Fig. 1b). Unconditional rewarding stimuli (sweetened milk) were delivered at random intervals to elicit robust increases in licking and DA release (Fig. 1c). Concurrently, the majority (58 %) of recorded neurons in the ventral striatum were modulated by unexpected rewards (Fig. 1d,e)37. Neurons showed a predominantly excitatory subsecond-scale initial reward response, which was sometimes followed by a more prolonged period of inhibition. A strong reward response was observed in all three major putative classes of electrophysiologically identified cell types, corresponding to medium spiny projection neurons (MSNs), fast spiking interneurons (FSIs), and tonically active projection neurons (TANs) (Extended Data Fig. 1). However, to avoid possible bias arising from cell-type specific modulatory effects or classification errors, our primary analysis used spiking data from every recorded neuron. These combined measurements revealed temporally correlated changes in ventral striatal DA and spiking activity during reward delivery. Based on the view that DA neurons drive changes in spiking on subsecond timescales, it has been posited that these two forms of reward signals are causally related30,39. We therefore bidirectionally manipulated DA neuron activity in order to directly test this prediction.
Fig. 1: Simultaneous monitoring of DA and electrophysiological activity in the ventral striatum.

a. Left: Opto-probe device comprised of a 256 electrode array distributed on four shanks, together with an optical fiber for photometry. Scale bar represents 0.400 mm. Middle: Illustration of the opto-microprobe in the targeted area of the ventral striatum. Right: Confocal image of dLight1.2 expression, representative of n = 2 independent sets of striatal images.
b. Mouse recording apparatus during reward delivery and optogenetic stimulation.
c. Mean reward-evoked licking and dLight fractional fluorescence change data from one animal. Shading represents ± SEM.
d. Spike raster and mean firing rate of one reward-responsive MSN. Shading on bottom plot represents ± SEM.
e. Selectivity index of 1047 ventral striatal neurons during reward delivery. Selectivity of neural activity is calculated relative to baseline.
Small effect of inhibiting DA reward signals on spiking
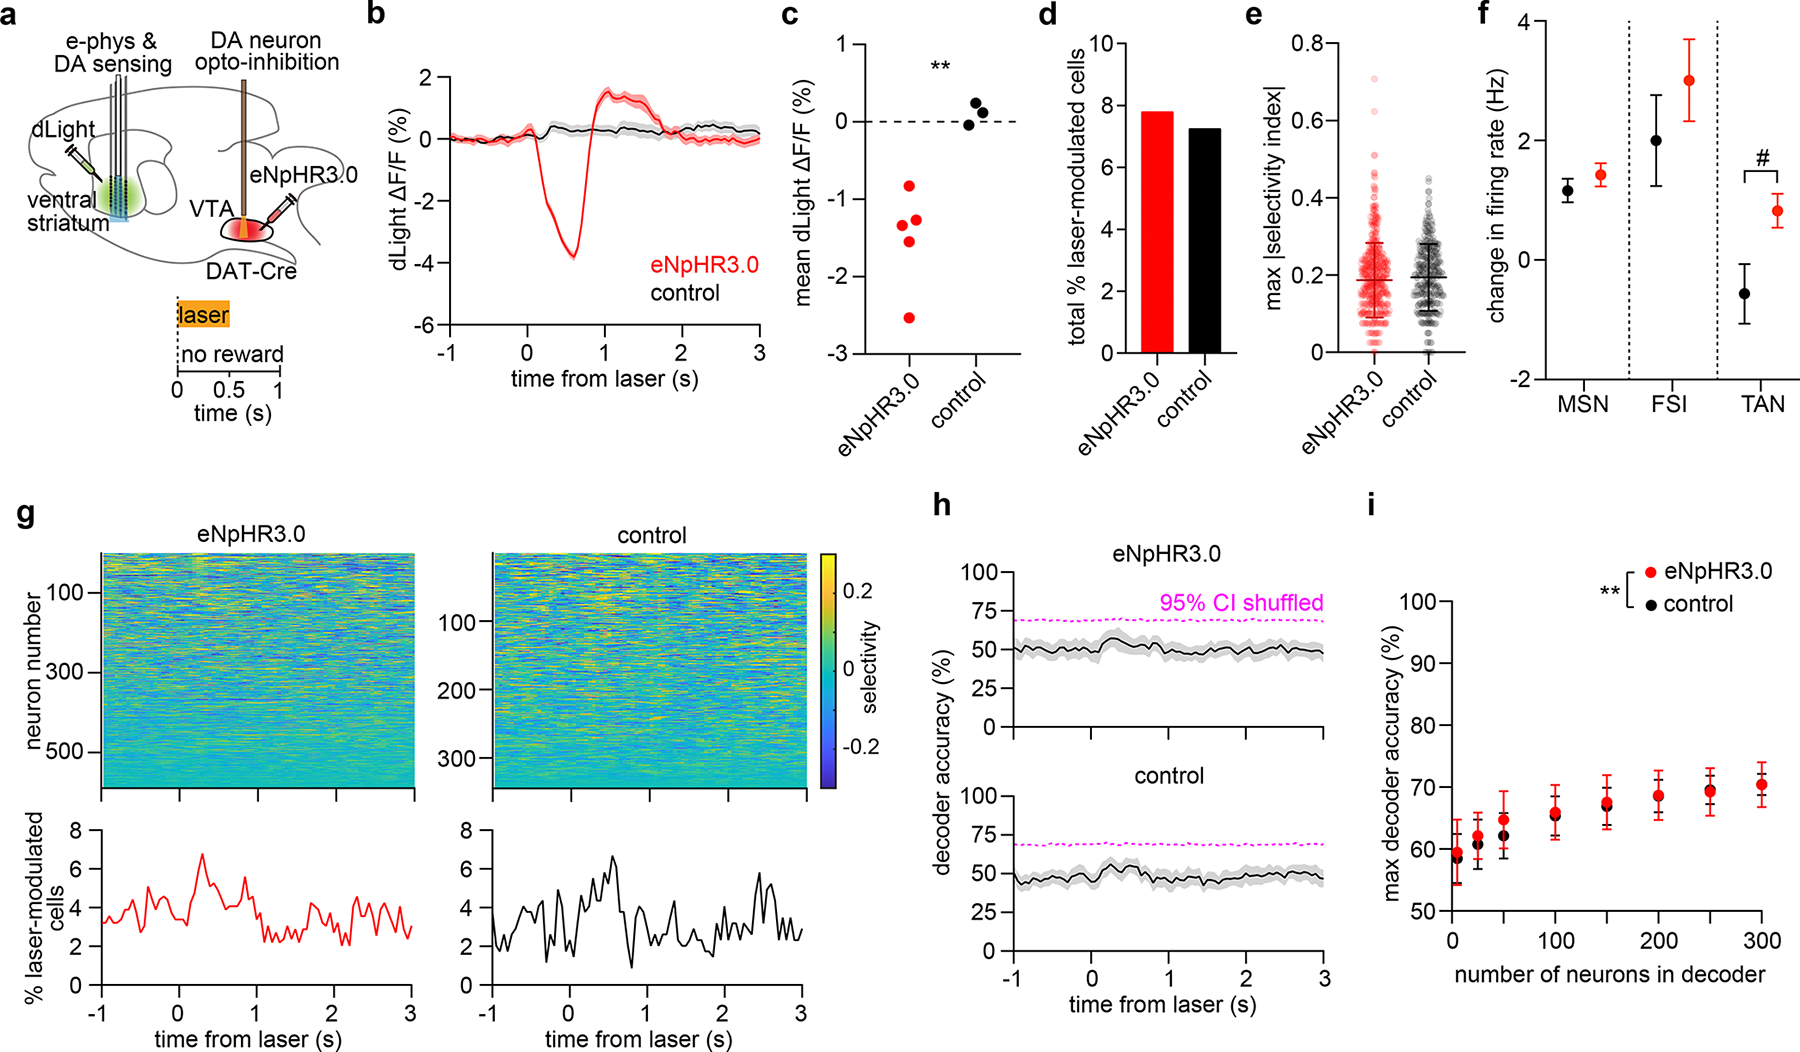
First, we examined whether DA neuron signaling is necessary for reward-evoked striatal spiking activity, through a transient loss of function approach involving opto-inhibition (Fig. 2a). We expressed eNpHR3 in VTA DA neurons, and timed laser stimuli to occur together on 50 % of reward trials (5 mW, 0.5 s continuous laser). Trials consisting of only reward (R) and laser-paired reward (R+L) were randomly interleaved. As expected, reward-evoked DA release in eNpHR3 expressing animals, but not opsin-free controls, was significantly inhibited and even transiently fell below baseline levels (Fig. 2b,c). Miniscope imaging of dLight signal in the ventral striatum appears to confirm that the transient reduction in DA levels was widespread (Extended Data Fig. 2). The duration of opto-stimulation was intentionally matched to previous studies supporting the involvement of DA neurons in rapid behavioral control10,11. Consummatory licking was not significantly altered by DA neuron inhibition, which was applied unilaterally (Fig. 2d). This allowed us to examine changes in neural dynamics in the absence of potentially obfuscating behavioral changes31. According to a prominent view of DA function, transiently reducing DA levels should cause strong and rapid changes in reward-evoked spiking responses in the ipsilateral ventral striatum. To test this we directly compared differences in individual neuron firing profiles between reward and laser-paired reward trials (Fig. 2e,f). The average change in firing rate was small for all three putative cell types, with only FSIs showing a significant difference relative to controls (Extended Data Fig. 3a). We checked if further subdividing the different cell types by their spatial location in the ventral striatum would reveal hotspots with high firing rate changes. While MSN activity did show significant spatial variations, these changes had no clear pattern, and were consistently small in magnitude (Extended Data Fig. 3b,c). There was also no significant change in the duration of the TAN pause following reward delivery (Extended Data Fig. 3d).
Fig. 2: Small effect of inhibiting VTA DA neurons on reward-evoked striatal spiking activity.

a. Top: Experimental approach. Bottom: task schematic in which reward trials (R) are compared to laser-paired reward trials (R+L).
b. dLight fractional fluorescence change signal (mean ± SEM) from one eNpHR3-expressing mouse (top) and selectivity index plot (bottom). Selectivity is calculated between R and R+L trials.
c. Mean reward-evoked dLight fluorescence on R and R+L trials (n = 5 eNpHR3 and 6 control mice, two-way RM ANOVA, group effect: F1,9 = 0.13, P = 0.7, trial effect: F1,9 = 15, P = 0.004).
d. Mean reward-evoked lick rate on R and R+L trials (n = 5 eNpHR3 and 6 control mice, two-way RM ANOVA, group effect: F1,9 = 0.008, P = 0.9, trial effect: F1,9 = 1.9, P = 0.2).
e. Spike raster of one reward-responsive neuron on R (top) and R+L (bottom) trials. Data are from an eNpHR3-expressing animal.
f. Mean firing rate ± SEM (top) and selectivity index (bottom) of the same neuron as panel e. Selectivity is calculated between R and R+L trials.
g. Top: Selectivity index of 589 neurons pooled across 5 eNpHR3-expressing mice, and 458 neurons pooled across 6 control mice. Bottom: Percentage of neurons that were significantly selective for R versus R+L trials, as a function of time.
h. Total percentage of neurons that were selective for R versus R+L trials (n = 45 out of 589 cells (7.6 %) in the eNpHR3 group, n = 17 out of 458 cells (3.7 %) in the control group, chi square test for proportions, χ2 = 7.1, P = 0.008, df = 1).
i. Maximum absolute value of the selectivity index per neuron (n = 589 cells in the eNpHR3 group, n = 458 cells in the control group, unpaired two-sided t-test, t = 2.9, **P = 0.004). Solid lines represent mean ± SD, each dot represents a single cell.
Due to the small magnitude of firing rate differences, optogenetically induced changes in neural activity were further quantified by applying a statistical test to identify time bins with significant differences in firing (see Methods, Fig. 2g). Overall, DA neuron inhibition altered the reward response of 8 % of neurons, compared to 4 % in control animals – a statistically significant but modest difference (Fig. 2h). We also calculated a selectivity index based on the area under the receiver operating characteristic (ROC) curve (range of index: ±1). Positive/negative index values denote higher/lower mean spike rates during DA inhibition, respectively. On average the magnitude of the selectivity index differed significantly from controls, but again by a small amount (Fig. 2i).
The above results reveal a small but statistically significant effect of DA neuron inhibition on individual striatal neuron firing properties. But it is still conceivable that these subtle electrophysiological changes may be important for regulating striatal dynamics and, in turn, behavior, on subsecond timescales. Indeed, if DA inhibition weakly but consistently alters the activity pattern of even a small group of striatal neurons, in principle, downstream brain areas could reliably read out this information to guide behavior. To test this possibility, we attempted to distinguish population-level dynamics observed between reward and laser-paired reward trials (i.e., R versus R+L), using a machine learning-based decoder. Decoding accuracy, reflecting the percentage of correctly classified trials, was briefly elevated following reward delivery, but differences between eNpHR3 and opsin-free control mice were still modest (Fig. 3a). It is also notable that the decoder never performed significantly above chance levels, as defined by the 95th percentile of decoders trained on trial-shuffled data. Decoder performance using data from eNpHR3-expressing mice improved by training the classifier with higher numbers of neurons, and eventually surpassed control data (Fig. 3b). However, even under the most favorable decoder training conditions using spiking data from 400 neurons, only a 13 % improvement in performance was observed (75 % accuracy from eNpHR3 group data, compared to 62 % from control group data). Thus, even with the aid of population-level recordings and machine learning tools, we could not consistently distinguish reward from laser-paired reward trials.
Fig. 3: Population-level decoding discriminates striatal neuron reward responses with and without DA.

a. Mean accuracy of an SVM decoder trained using 50 neurons to discriminate R from R+L trials. Magenta dashed line indicates the 95 % confidence interval of decoder performance trained on trial-shuffled data. Top: neurons selected from the eNpHR3 group. Bottom: neurons selected from the control group. Shaded area represents represent the SD across 50 random drawings of neurons.
b. Maximum decoder accuracy as a function of neuron number (two-way ANOVA, group effect: F1,980 = 1322, P < 0.0001, neuron number effect: F9,980 = 80, P < 0.0001). Post-hoc Sidak’s test: ****P < 0.0001 for all data points involving drawings of n > 5 neurons. Neurons were drawn from a total pool of 589 cells for the eNpHR3 group and 458 cells for the control group. Data represent the mean and SD across 50 random drawings of neurons of specified number.
On a subset of trials and animals in the same experiment, we also examined DA contributions to spontaneous striatal spiking activity, by applying identical laser stimulation but without accompanying rewards (Extended Data Fig. 4a). This caused DA levels to transiently fall below baseline levels (Extended Data Fig. 4b,c). We looked for changes in neural activity relative to a baseline period preceding laser stimulation. Neither the firing rate differences, the fraction of selective cells, nor the mean selectivity index were significantly different from controls (Extended Data Fig. 4d–g). A statistically significant difference arose when testing a decoder trained to distinguish laser-evoked population activity from baseline activity, but again the size of this effect was small (Extended Data Fig. 4h,i). Taken together, the results show that DA neuron inhibition has a weak effect on both reward-evoked and spontaneous spiking activity in the ventral striatum.
To test whether these results may generalize to more complex behaviors, and to other striatal regions, we conducted an additional experiment where DA was inhibited during the reward anticipation phase of a Pavlovian conditioning task (Extended Data Fig. 5a)22. We recorded from the ventral striatum while inhibiting DA neurons in the VTA, or from the dorsal striatum while inhibiting DA neurons in the substantia nigra pars compacta (SNc). DA neuron inhibition was performed for half the trials and caused a temporary decrease in DA levels below baseline (Extended Data Fig. 5b,c). Anticipatory licking was not changed by unilateral DA neuron inhibition (Extended Data Fig. 5d). When comparing spiking data from inhibited trials (C+L) to uninhibited trials (C), the fraction of neurons that were selective for each trial type was not significantly different in ventral or dorsal striatum compared to controls (Extended Data Fig. 5e,f). A small number of neurons that were positively modulated in the eNpHR3 group drove a brief increase in decoding accuracy when trained on combined ventral and dorsal striatum data; however, a similar brief increase in decoding accuracy was seen in controls and the overall difference from controls was similar in magnitude to our other opto-inhibition experiments (Extended Data Fig. 5g,h). Decoding accuracy when compared to controls was higher in the ventral striatum than in the dorsal striatum (Extended Data Fig. 5i). These results suggest that DA’s small effects on striatal neuron spiking also apply in the dorsal striatum and during reward anticipation in a Pavlovian conditioning task.
To better put our findings into context we carried out a positive control experiment involving activation of VTA GABA neurons, which locally regulate DA neuron firing, but also directly project to other areas including the ventral striatum40–42 (Fig. 4a). Since these neurons release an inhibitory neurotransmitter with rapid postsynaptic effects, we expected their contribution to striatal spiking activity would substantially exceed those of DA neurons. We expressed the excitatory opsin Chrimson in VTA GABA neurons, and delivered pulsed laser stimulation on a subset of reward trials. Activating these neurons produced a marked reduction in both reward-evoked striatal DA release and spiking activity, consistent with their inhibitory action (Fig. 4b,c). Similarly, at the population level, neural decoding performance reached 95 % accuracy with as few as 25 neurons used for training the classifier (Fig. 4d). VTA GABA neuron activation without reward delivery also had a large effect on spontaneous striatal firing rates (Extended Data Fig. 6a–d). These data clearly show that our analysis methods are capable of detecting strong changes in neural activity if they exist. Furthermore, the stark contrast between the effect of VTA GABA neuron activation and DA neuron inhibition on striatal spiking activity, supports the view that VTA GABA neurons do not only serve to inhibit local DA neurons, but to directly regulate striatal microcircuits41.
Fig. 4: Strong effect of activating VTA GABAergic neurons on reward-evoked striatal spiking activity.

a. Top: Experimental approach. Bottom: task schematic in which reward trials (R) are compared to laser-paired reward trials (R+L). Laser is pulsed at 40 Hz for 0.5 s total duration.
b. Top: dLight fractional fluorescence change signal on R and R+L trials from one Vgat-Chrimson mouse. Bottom: Mean firing rate of one neuron on R and R+L trials. Data represent mean ± SEM (shading).
c. Top: Selectivity index of 379 neurons pooled across 3 Vgat-Chrimson mice. Bottom: Percentage of neurons that were significantly selective for R versus R+L trials, as a function of time.
d. Top: Mean accuracy of an SVM decoder trained using 50 neurons to discriminate R from R+L trials. Shaded area represents the SD across 50 random drawings of neurons. Magenta dashed line indicates the 95 % confidence interval of decoder performance trained on trial-shuffled data. Bottom: Maximum decoder accuracy as a function of neuron number (one-way ANOVA, neuron number effect: F7,392 = 158, P < 0.0001). Post-hoc Sidak’s test: P < 0.0001. Data represent the mean and SD across 50 random drawings of neurons.
Reward-matched DA transients weakly alter striatal spiking
We next used opto-activation to examine whether certain levels of DA are sufficient to produce strong and rapid changes in striatal spiking. The excitatory opsin Chrimson was expressed in VTA DA neurons, and pulsed laser stimulation was applied as before for a total duration of 0.5 s, both in isolation and paired with a subset of reward trials (Fig. 5a). To study the effect of different DA levels on spontaneous striatal dynamics, we presented isolated laser stimuli and varied the stimulation frequency from 4 to 40 Hz in order to evoke increasing magnitudes of DA release (Fig. 5b). To calibrate these fluorescence signals, we compared the peak level of optogenetically evoked to behaviorally evoked DA during reward delivery. The ratio between these values indicated the factor increase in DA above reward-matched levels21. Across all sessions tested, this factor varied between 0.2 and 23, representing two orders of magnitude change in DA levels relative to reward. Some of these DA stimulation conditions elicited noticeable changes in spontaneous striatal spiking (Fig. 5c). But crucially, neural activity appeared to only be strongly altered by large magnitude, supra-reward DA signals (Fig. 5d). A similar trend emerged when testing a decoder trained to distinguish laser stimulation-evoked population activity from pre-laser baseline activity. Across all the data collected, we found an approximately linear change in the percentage of laser-modulated cells, selectivity index, and decoder performance as a function of the factor increase in DA (Fig. 5e–g). The firing rate changes of different cell subtypes showed qualitatively similar trends, with MSN activity displaying a linear dependence on DA levels (Extended Data Fig. 7a–c). Together, these results suggest that artificial DA signals comparable to the magnitude of unpredicted rewards are not on their own sufficient to cause large, subsecond changes in striatal spiking. But at the same time, supra-reward DA transients are clearly capable of driving strong changes in neural activity.
Fig. 5: Small effect of artificial reward-matched DA transients on spontaneous striatal activity.

a. Top: Experimental approach. Bottom: Confocal image of Chrimson-tdTomato expression in the VTA. Scale bar is 0.5 mm.
b. dLight fractional fluorescence change from one Chrimson-expressing mouse. The data represent reward-evoked (black) and laser-evoked signals at 4 Hz, 20 Hz, and 40 Hz stimulation for 0.5 s.
c. Mean firing rate ± SEM of two laser-modulated MSNs.
d. Top: Selectivity index of 92 simultaneously recorded neurons from one Chrimson-expressing mouse under 4 Hz (left), 20 Hz (middle), and 40 Hz (right) laser stimulation. Bottom: Mean accuracy of an SVM decoder trained using 50 neurons to discriminate laser-evoked from baseline activity. Shaded area represents the SD across 50 random drawings of neurons. Magenta dashed line indicates the 95 % confidence interval of decoder performance trained on trial-shuffled data.
e. Percentage of neurons per recording session significantly modulated by the laser, as a function of factor increase in DA. n = 26 sessions from 9 Chrimson-expressing mice, and n = 12 sessions from 4 control mice. Chrimson group data are positively correlated with the factor increase in DA (Pearson r = 0.6, P = 0.0005). Dashed line represents the highest value seen in control data. Blue line is linear fit of the Chrimson data.
f. Mean of the maximum absolute value of selectivity index per recording session, as a function of factor increase in DA. Selectivity of neural activity is calculated relative to baseline. Chrimson group data are positively correlated with the factor increase in DA (Pearson r = 0.8, P < 0.0001). Dashed line represents the highest value seen in control data. Blue line is linear fit of the Chrimson data.
g. Maximum decoder accuracy per recording session, as a function of factor increase in DA. The decoder was trained using 50 neurons to discriminate laser-evoked from baseline activity. Chrimson group data are positively correlated with the factor increase in DA (Pearson r = 0.8, P < 0.0001). Dashed line represents the highest value seen in the control data. Blue line is linear fit of the Chrimson data.
Our estimate of the factor increase in DA may depend on several variables such as recording location. A large overestimate of this factor would weaken the conclusion that only supra-reward DA signals are sufficient to produce sizable electrophysiological effects. Spatial variations in photometry signals are one potential source of uncertainty. Our opto-probe was configured such that the photometry fiber was placed above the most dorsal electrode recording sites, and thus was separated by over 1 mm from the most ventral recording sites (Fig. 1a). Since it is known that DA reward signals vary substantially across the striatum36, the factor increase in DA cannot be assumed to be constant over the entire span of the electrode array along the dorsal to ventral axis. To quantify how this factor varies with depth, we recorded photometry signals with the optical fiber gradually moved more ventrally (6 different locations spanning 1 mm; Extended Data Fig. 8a). At each location we measured the magnitude of DA signals during reward delivery and optogenetic stimulation. While both of these signals varied considerably across different locations (Extended Data Fig. 8b,c), overall the factor increase in DA displayed a moderate increase with depth (Extended Data Fig. 8d). In experiments involving combined electrophysiology and photometry, access to DA signals from only near the most dorsal optical fiber position was available. This suggests that, rather than overestimating, we may have underestimated the value of the factor increase in DA, potentially strengthening our conclusion. Another source of variability may relate to changes in DA reward signaling during successive trials. In particular, it is possible that the initial set of reward trials are more unexpected than latter trials, and therefore induce a stronger RPE response. To check if this impacts our estimate, we calculated a recalibrated factor increase in DA using the average of only the first 10 % of reward trials. On average the recalibrated factor was 17 % smaller than the original estimate, a level insufficient to appreciably alter our conclusions (Extended Data Fig. 8e,f).
Supra-reward DA signals strongly influence striatal spiking
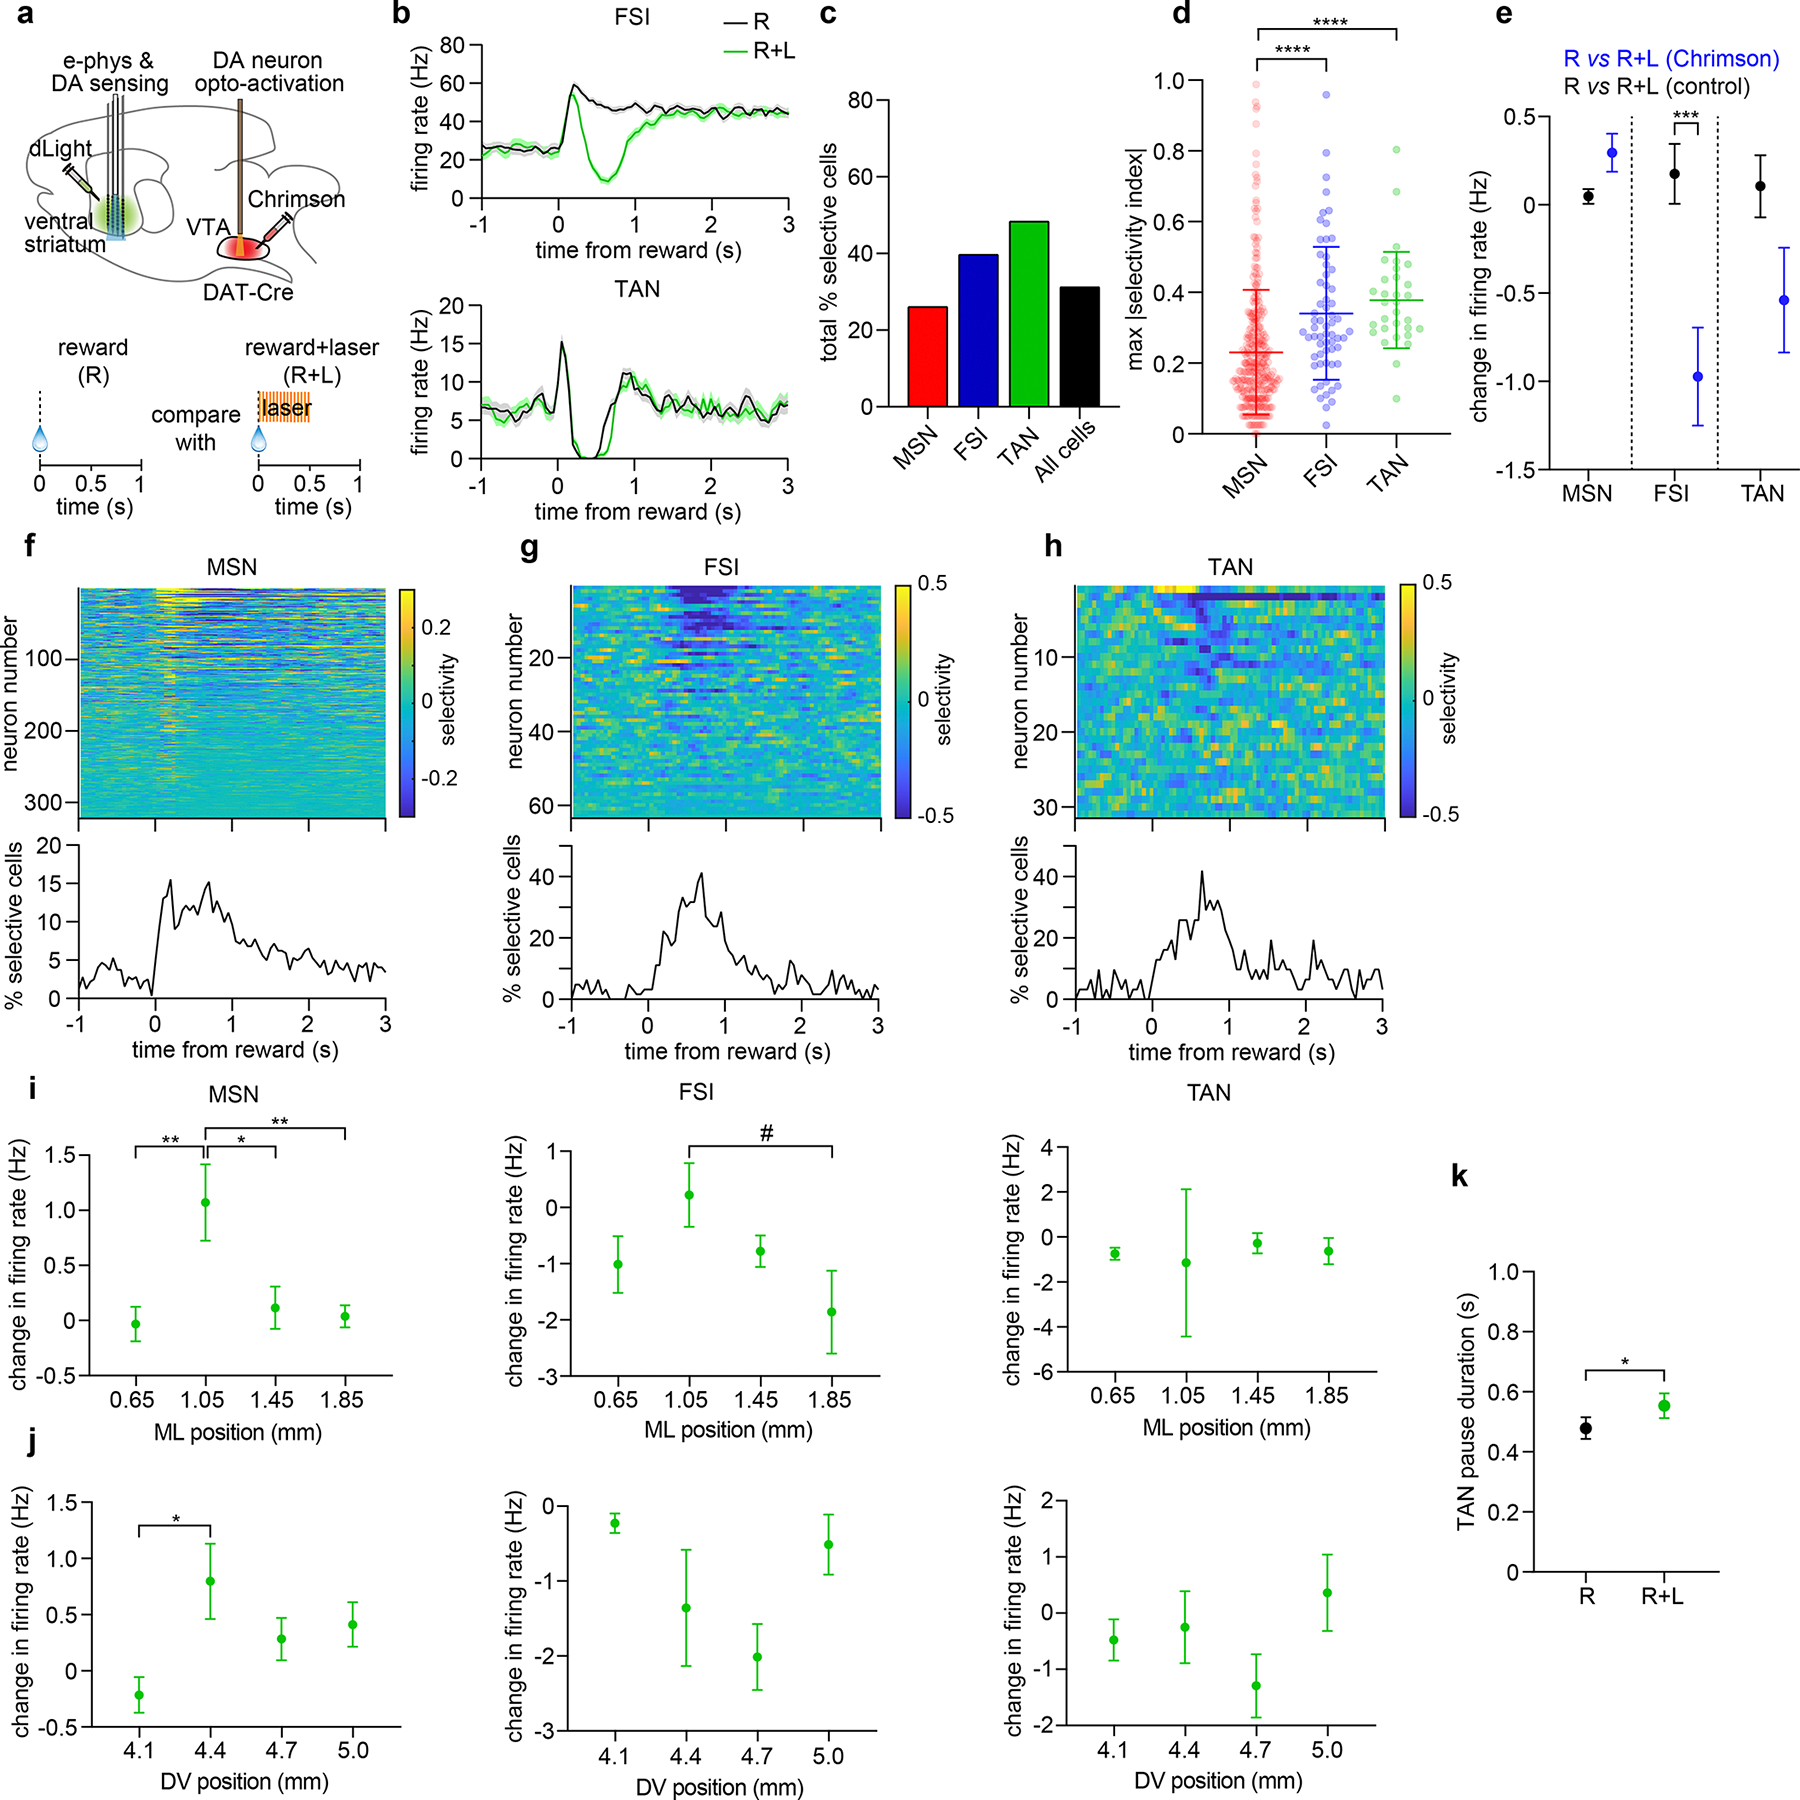
We next examined how amplifying DA reward signals alters striatal reward-evoked spiking activity. Experiments involving DA neuron activation included a block of randomly interleaved reward (R) and laser-paired reward (R+L) trials. Pairing optogenetic stimulation with reward amplified the fluorescence signal (Fig. 6a,b), but the consummatory licking response was not significantly altered (Fig. 6c). Consistent with our analysis of spontaneous activity, changes in reward-evoked neural activity were only clearly distinguished with high DA amplification (Fig. 6d,e). We next characterized how reward-evoked activity is altered under conditions when R and R+L trials could be reliably decoded (greater than 80 % decoder accuracy). In this supra-reward regime, neurons displayed a mixture of excitatory and inhibitory changes in firing (Fig. 6f,g). All three putative cell types exhibited changes in activity (Extended Data Fig. 9). MSNs showed mixed excitatory and inhibitory effects and the weakest overall changes, while the main influence on FSIs appeared to be inhibitory. A subset of TANs showed a significantly longer reward pause duration, in qualitative agreement with previous work attributing the pause to DA modulation43. Effects on neuron firing rates, particularly for MSNs, appeared to be strongest within a region roughly corresponding to the nucleus accumbens core (Extended Data Fig. 9i,j).
Fig. 6: Supra-reward DA signals modulate reward-evoked striatal spiking activity.

a. dLight fractional fluorescence change signal from one Chrimson-expressing mouse (top) and one opsin-free control mouse (bottom) on reward (R) and laser-paired reward (R+L) trials. Data represent mean ± SEM.
b. Mean reward-evoked dLight fluorescence on R and R+L trials (n = 9 Chrimson and 4 control mice, two-way RM ANOVA, group effect: F1,11 = 5.3, P = 0.04, trial effect: F1,11 = 11, P = 0.007). Post-hoc Sidak’s test: **P = 0.001 for R+L trials.
c. Mean reward-evoked lick rate on R and R+L trials (n = 9 Chrimson and 4 control mice, two-way RM ANOVA, group effect: F1,11 = 0.1, P = 0.8, trial effect: F1,11 = 0.6, P = 0.5).
d. Percentage of neurons per animal that were selective for R versus R+L trials, as a function of DA reward amplification factor. n = 9 Chrimson-expressing and 4 control mice. Chrimson group data show a trend for being positively correlated with the DA amplification factor (Pearson r = 0.6, P = 0.075). Dashed line represents the highest value seen in the control data.
e. Maximum decoder accuracy per animal, as a function of DA reward amplification factor. The decoder was trained using 50 neurons to discriminate R from R+L trials. (Pearson r = 0.6, P = 0.08). Dashed line represents the highest value seen in the control data.
f. Mean firing rate of two MSNs showing an excitatory (top) and inhibitory (bottom) response to DA neuron activation. Data are from the supra-reward condition (animals exhibiting over 80 % decoding accuracy in panel e). Data represent mean ± SEM.
g. Top: Selectivity index of 423 neurons pooled across 4 Chrimson-expressing mice. Bottom: Percentage of neurons that were significantly selective for R versus R+L trials, as a function of time. Data are from the supra-reward condition (animals exhibiting over 80 % decoding accuracy in panel e).
In order to examine DA’s modulatory effects during non-rewarding stimuli, in a subset of animals we included a block of trials consisting of randomly interleaved neutral auditory tone and laser-paired tone stimuli. As before, neural activity could only reliably distinguish these conditions when DA signals were amplified above tone-matched levels (Extended Data Fig. 10). Together, the DA opto-activation experiments suggest that only supra-reward DA signals are capable of producing consistent changes in either spontaneous, reward-evoked, or auditory stimulus-evoked spiking in the ventral striatum.
Discussion:
Implications for DA’s role in modulating striatal activity
This study sought to clarify a longstanding question about the magnitude of the dependence of striatal spiking activity on DA neuron input on subsecond behavioral timescales. This issue is at the heart of popular models that propose DA plays a major role not only in shaping future behavior (i.e., via learning-dependent plasticity mechanisms), but in imminent or ongoing actions4,9–12,16–19,44,45. Our findings challenge the idea of a strong influence of DA on moment-to-moment striatal activity, unless potentially non-physiological conditions are met. The optogenetic inhibition experiments show that striatal neural dynamics are largely uncoupled from rapid increases in DA signaling that accompany unexpected reward events and more generally, during reward anticipation39. These findings were confirmed using multiple complementary experiments and analyses. By contrast, the optogenetic activation experiments reveal that under sufficiently elevated, supra-reward DA signaling conditions, striatal dynamics are indeed strongly influenced by DA neuron input. To estimate the transition point from small to large electrophysiological effects, we refer to the population decoding analysis, which provided a sensitive method for detecting changes in neural activity. Interpolating these results, the transition to the high decoding accuracy (80 %) regime occurs when DA signals are amplified around three to four times above reward-matched levels (Fig. 5g, 6e).
There are three major implications of this study. First, it appears that on subsecond timescales striatal dynamics are primarily driven by non-DA neuron inputs, including VTA GABA neurons. Earlier work also demonstrated that suppressing cortical and thalamic input is highly effective at dampening striatal reward activity46. Of course, a striatal network whose dynamics on fast timescales are largely uncoupled from DA may appear counterintuitive, given that DA neurons encode the performance of imminent or ongoing actions11,16, and the widespread assumption that this information drives behavior by modulating striatal activity. However, the influence of this information on downstream neural dynamics has not been rigorously demonstrated, and our work suggests that strong DA signals do not translate on a subsecond basis to strong changes in striatal firing. An alternative interpretation is that the primary role of such DA signals may be to reinforce or weaken future actions by modulating synaptic plasticity22,24.
Second, these findings provide a possible electrophysiological mechanism for the results of some behavioral studies, which showed that performance is markedly altered only by stimulating DA above physiologically calibrated levels12,21,24. Our results indicate that large, supra-reward DA release evokes a distinctly strong response in striatal neurons compared with the response produced under reward-matched conditions. These distinct electrophysiological effects could underlie the different magnitude of behavioral effects reported in the literature. In terms of the neural dynamics which were observed, multiple synaptic and microcircuit-level mechanisms could potentially explain how large magnitude DA release modulates striatal spiking activity on subsecond timescales1. Disentangling these contributions was not the purpose of this study, but we can speculate on potential mechanisms. Previous work has shown that stimulating DA terminals can rapidly enhance the firing of D1 receptor (D1R) expressing MSNs via a D1R-dependent mechanism7. DA also modulates lateral inhibition between MSNs, which may alter spiking activity47. In addition to DA itself, there may be a role for DA neuron co-release of glutamate and GABA48,49, as both of these neurotransmitters are well suited to drive rapid changes in striatal firing. There is evidence that blocking glutamate co-release attenuates DA stimulation-evoked spiking in the ventral striatum8. However, since these mechanistic studies did not appear to discriminate between reward-matched and supra-reward DA signals and the degree to which this affects co-release, it remains unclear to what extent these mechanisms contributed to our observed results.
Third, our study points to an urgent need to carefully distinguish between the modulatory function that DA neurons normally have in shaping striatal dynamics, and the role they can serve under potentially supra-physiological conditions. One possible approach to circumvent this issue is to measure and calibrate DA stimulation levels with respect to a known reference signal10,12,21,24,50,51. However, we suggest that to avoid potential calibration errors, it is essential to include experiments that assess in vivo DA function through inhibitory manipulations. The adoption of standardized practices surrounding optogenetic manipulation of DA is critical to ensure the future reproducibility and consistency of scientific work in this field.
Generalizability of findings
We primarily examined rapid DA modulation of two highly distinct modes of striatal activity – spontaneous and reward-evoked firing. In addition to examining unexpected rewards, we carried out experiments in mice trained on a Pavlovian conditioning task, allowing us to assess the contribution of DA neurons during periods of reward anticipation (Extended Data Fig. 5). Since similar trends were observed under all of these conditions as well as during presentation of neutral auditory stimuli, our findings do indeed appear to generalize to some extent. Of course, we cannot rule out the presence of stronger modulatory effects during other types of tasks with more complex behavioral requirements – as has been suggested previously10. However, the existence of mechanisms by which a different reward-guided task could cause a dramatically higher effect size remains hypothetical. There is also considerable interest in the role of DA in the initiation and performance of movements in the absence of explicit rewards11,16,17. But, again, there is no direct evidence that DA motor signals are fundamentally different in their actions on striatal function than reward signals.
Our experiments were mostly restricted to measuring ventral striatal dynamics during somatic VTA DA manipulation. While our Pavlovian conditioning experiment suggests generalization to the dorsal striatum, this was not stringently tested across all experiments. Turning to the literature, one study suggested that DA has a stronger effect on synaptic transmission in the ventral compared to the dorsal striatum52. There is also evidence that DA neuron glutamate co-release mechanisms may be biased toward the nucleus accumbens48. Thus, while it is possible that DA neurons differentially modulate dorsal and ventral striatal dynamics on short timescales, there is no known mechanism suggesting these modulatory effects are enhanced in the dorsal striatum. A further issue is the specificity of our DA neuron manipulations to the striatum. In order to maximize the likelihood of altering neural dynamics, we intentionally targeted all types of VTA DA neurons instead of only the population projecting to the ventral striatum. This raises the potential pitfall of off-target network effects of opto-stimulation35. However, even if such indirect effects are present, then the exclusive contribution of DA neurons to striatal dynamics would likely be even smaller than this study suggests, thus further strengthening the main conclusions of this work.
Validity and limitations of the DA calibration method
To date, most experiments incorporating optogenetically stimulated DA calibration have done so using food rewards as the reference point and photometry as the means of measuring DA release12,21,24,50. To maintain consistency with prior work in the field, our calibration method relied on photometry to compare optogenetically evoked DA levels to those evoked by unexpected rewards. On a practical level, the data clearly show a markedly higher electrophysiological effect size with elevated DA signaling. This result has important implications regardless of the terminology used to refer to the magnitude of DA signals. Several terms have been previously used in the literature to describe the high amplitude DA regime including supra-reward, supra-physiological, and uncalibrated12,21,50. Nevertheless, there are some caveats to our calibration approach. First, we relied on low spatial resolution DA measurements via fiber photometry, overlooking potentially significant DA fluctuations at smaller spatial scales. Second, even though unexpected rewards evoke some of the most robust DA responses16, DA signals may exceed the proposed supra-physiological threshold under certain behavioral conditions, such as for highly aversive stimuli53, and by drugs of abuse. Despite these caveats, the standardization of our DA calibration method with several other studies helps place these results into context within the broader literature.
Reconciling findings with previous evidence
A major question is whether this work can be reconciled with a sizable body of evidence that appears to contradict our findings either directly via electrophysiological measurements7,8, or indirectly via behavioral measurements9–11. On one hand, a subset of those experiments may have inadvertently over-stimulated DA neuron cell bodies or terminals, causing supra-physiological neurotransmitter release in the striatum. There is further support for this possibility from a study showing that animal motion effects are only evident when SNc DA levels are raised five times above reward-matched levels21. This five-fold behavioral threshold is remarkably similar to our electrophysiologically determined threshold estimate of three to four times reward-matched levels, suggesting the same underlying modulatory mechanisms. While it is tempting to speculate on the prevalence of engaging potentially supra-physiological mechanisms within the literature, it is noted that since optogenetically evoked DA signals are often not measured let alone calibrated, this possibility can neither be firmly proved nor disproved. On the other hand, a number of studies used either DA neuron inhibition or a pre-calibrated level of activation, thereby mitigating the risk to engage supra-physiological DA release mechanisms. In one such experiment, optogenetically manipulating VTA DA neurons did alter the probability of initiating reward-motivated approach behavior10. Two separate studies showed that SNc DA manipulations biased the probability of selecting a particular action over another13,14. Elsewhere, optogenetic SNc DA manipulations modulated the probability of initiating an action at a given moment in time12. Moreover, an earlier study from our group showed that inhibiting SNc DA neurons reduced the probability of initiating reward-anticipatory movements22. These statistically significant behavioral changes may appear to contradict the findings in this work, but a crucial observation is that the average change in movement or action probability seen in those studies is generally small, especially in the case of DA inhibition. By comparison, our neural decoding analysis suggests a downstream area can theoretically distinguish reward-evoked striatal population dynamics with or without DA signals in only 13 % more trials relative to controls (Fig. 3b). Thus, when considering inhibitory manipulations, the size of previously reported behavioral effects, and the upper bound on the size of electrophysiological effects shown here, are comparable. The most parsimonious, unified interpretation of these observations is that under physiological conditions DA neurons modulate striatal activity, and consequently behavior, in a weak probabilistic manner, i.e., on a small minority of trials.
Still, there is an alternative interpretation of the data that should also be considered. It is true that we did find a statistically significant, albeit small effect of physiological DA signals on striatal dynamics. Therefore, it could be argued that the data support the possibility that physiological DA can shape activity in the striatum and in turn could presumably regulate behavior. That said, the observed effect sizes and decoding results must also be considered as well. Around 58 % of cells were reward modulated in our experiments, while only 4 % of cells had their reward response altered by DA neuron inhibition (above control levels). Across the entire population of neurons, the alteration in the reward response was quite subtle and failed to achieve robust decoding accuracy. The small magnitude of this effect was particularly evident when compared to the essentially perfect decoding accuracy achieved by manipulating another input to the striatum, VTA GABA neurons (Fig. 4d). The comparably small effect size of DA neuron inhibition is incompatible with the idea that DA is a major modulator of neural dynamics in the striatum on subsecond timescales. The most immediate implication is that proponents of physiological DA’s role in rapid behavioral performance will either need to determine the mechanisms by which downstream regions might read out subtle striatal effects into strong, meaningful outputs – or, to contextualize the importance of DA in relation to other inputs.
Methods:
Animals.
DAT-Cre mice (Strain # 006660, Jackson Laboratories) and VGAT-Cre mice (Strain # 028862, Jackson Laboratories), 8–18 weeks old at the time of the first surgery, were used for experiments involving optogenetic manipulation of dopaminergic neurons or GABAergic neurons, respectively. Both male and female mice were used (26 males and 8 females total), and the mice were maintained as heterozygotes on a C57BL/6J background. Animals were kept on a 12 hour light/dark cycle in a temperature and humidity controlled environment (approximately 22 °C with 50 % relative humidity), and were group housed until the first surgery at which point they were singly housed. All procedures were approved by the University of California, Los Angeles Chancellor’s Animal Research Committee.
Surgical procedures.
Surgery was performed under isoflurane anesthesia and aseptic conditions using a stereotaxic apparatus (Model 1900, Kopf Instruments). The procedure consisted of three principal components: injection of adeno-associated virus (AAV) into the ventral tegmental area (VTA) and ventral striatum, placement of a fiber-optic implant in the VTA, and attachment of stainless-steel head fixation bars to the skull. AAV for optogenetics (UNC Vector Core) was unilaterally injected into the VTA, consisting of 500 nl of Cre-dependent AAV expressing either AAV5/EF1a-DIO-eNpHR3-mCherry, AAV5/Syn-Flex-ChrimsonR-tdTomato, or AAV5/EF1a-DIO-mCherry (coordinates relative to bregma: 3.30 mm posterior, 0.50 mm lateral, 4.30 mm ventral). AAV expressing the fluorescent DA sensor dLight1.2 under the synapsin promoter (pAAV-hSyn-dLight1.2) was also unilaterally injected into the striatum (ventral striatum coordinates relative to bregma: 1.30 mm anterior, 1.25 mm lateral, 4.25 mm ventral; dorsal striatum coordinates relative to bregma: 0.9 mm anterior, 1.5 mm lateral, 2.8 mm ventral). pAAV-hSyn-dLight1.2 was a gift from Lin Tian (Addgene plasmid # 111068)38. Following viral injection, a ferrule-coupled optical fiber implant (0.2 mm diameter, 0.22 NA, Thor Labs) was placed with the tip approximately 0.2 mm above the viral injection site. For the miniscope imaging experiment, a 0.5 mm diameter GRIN lens (Inscopix, 8.4 mm length) was additionally implanted into the striatum (coordinates relative to bregma: 1.30 mm anterior, 1.25 mm lateral, 4.5 mm ventral). After surgery, all animals were individually housed and were given daily carprofen injections (5mg/kg, subcutaneous) for the first three post-operative days. Over the first post-operative week, animals were administered ibuprofen and amoxicillin dissolved in their drinking water. The mice were given a recovery period of at least two weeks prior to behavioral training.
Behavioral task.
Mice were food restricted but given ad libitum access to water to maintain around 90 % of their baseline weight. Animals were habituated to head fixation and trained to reliably consume uncued rewards (6 μl, 10 % sweetened condensed milk) delivered via an audible solenoid valve. Rewards were delivered via a tube within an infrared lick detection port located approximately 5 mm from the mouth. Mice had to extend their tongue out of the mouth multiple times to consume the reward and these tongue extensions were detected as licks. Mean lick rates were calculated based on the average number of consummatory licks from 0–1 s following reward delivery. During behavioral training, mice were given rewards (20–30 s inter-trial interval, ITI, 100 trials per day). Habituation to head fixation and lick training took place over the course of 7 total days. A subset of animals was also habituated to an audible tone on the last two days of training (12 kHz tone, 0.5 s duration, 20–30 s ITI, 100 trials per day). Another subset of animals were further trained for 5 days on a Pavlovian conditioning task using the same overall apparatus with an olfactory cue presented through an olfactometer (10 % dilution isoamyl acetate in mineral oil, 1.5 L/min total air flow). Each trial consisted of a 1 second odor cue followed by a 1 s delay until reward was finally delivered (20–30 s ITI, 100 trials per day). For this task, anticipatory licking rate was calculated during the delay period before reward delivery. After the training period, mice then proceeded to the experiment involving electrophysiology, photometry, and optogenetics. Custom Labview code (version 11.0 was used to monitor behavior, deliver rewards, and trigger optogenetic stimulation.
Optogenetics.
Optogenetic manipulations were organized into two principal sections, with the first block consisting of reward trials and laser-paired reward trials (R and R+L), and the second block consisting of unpaired laser stimulation (589 nm, 5 mW power, MGL-F-589–100 mW, CNI Laser). For eNpHR3-mediated opto-inhibition, laser stimulation was applied continuously for 0.5 s. The first block consisted of 40 R and 40 R+L trials randomly interleaved (20–30 s ITI). The second block consisted of 80–100 trials where laser was delivered alone (20–30 s ITI); in order to maintain a consistent number of trials across different analyses, only the last 40 trials were analyzed. For experiments involving Chrimson-mediated opto-activation, laser stimulation was pulsed at either 4, 20, or 40 Hz over a 0.5 s period (10 ms pulse width). The first block was similar to the inhibition experiments consisting of 38–40 each of R and R+L trials (laser was pulsed at 40 Hz). The second block consisted of 40 trials each of 4, 20, and 40 Hz unpaired laser stimulation presented in random order. One animal did not undergo 4 Hz laser stimulation. A subset of the animals used for the activation experiments also completed an additional block where an auditory tone was presented with half the trials randomly paired with optogenetic stimulation (40 T and 40 T+L trials). For the subset of animals who completed the Pavlovian task, half the trials were randomly paired with 2 s of opto-inhibition from cue onset to reward delivery (40 C and 40 C+L trials).
Electrophysiology.
To measure reward and optogenetically evoked rapid changes in DA signaling alongside neural spiking responses in the ventral striatum, an opto-probe containing a 256 electrode silicon microprobe (type 256AS, developed by our lab54) attached to a low autofluorescence photometry fiber positioned about 0.15 mm above the nearest electrode recording sites (0.43 mm diameter, 0.48 NA, Doric Lenses). The silicon microprobe contained four shanks separated by 0.4 mm. Each shank contained 64 electrodes spanning a total length of 1.05 mm. This device allowed recordings from a wide area of the nucleus accumbens in the ventral striatum. Prior to electrophysiological recordings, a second surgery was performed under isoflurane anesthesia in which a rectangular craniotomy over the striatum was opened and then covered with a silicone sealant (Kwik-Cast, World Precision Instruments). The animal was allowed to recover for at least 3 hours before inserting the opto-probe into the nucleus accumbens region of the ventral striatum (ventral tip of probe shanks: 1.30 mm anterior, 0.65–1.85 mm lateral, 5.1 mm ventral). For recordings in the dorsal striatum, the coordinates were shifted (ventral tip of probe shanks: 0.9 mm anterior, 0.9–2.1 mm lateral, 3.8 mm ventral). The shanks of the opto-probe were coated with a fluorescent dye prior to insertion (DiI or DiD, Thermo Fisher Scientific). Electrophysiological recordings were conducted at a sampling rate of 25 kHz per electrode using a commercial multichannel data acquisition (DAQ) system (C3316 and C3004, Intan Technologies). Data was collected from the DAQ using open-source Intan Technologies Recording Controller Software (version 2.08) provided by Intan Technologies. Spike sorting was carried out with Kilosort (version 2.5)55, using bandpass filtered data (3 pole Butterworth filter with a passband of 0.6–7 kHz). After identifying single-units, raw data were refiltered with a wider passband (0.3–7 kHz) and then classified as putative MSNs, FSIs, and TANs. The classification procedure was based on spike trough-to-peak duration and baseline firing rate56. Putative FSIs were defined by a narrow spike waveform (0.45 ms maximum duration). MSNs and TANs were both defined by wider waveforms (0.475–2 ms duration). TANs were separated from MSNs by the regularity of their baseline firing (maximum TAN coefficient of variation: 1). The minimum baseline firing was defined as 0.01 Hz for MSNs and FSIs and 2.5 Hz for TANs, and the maximum was defined as 20 Hz for MSNs and TANs. TAN pause responses were calculated for TANs that had at least 4 adjacent timebins below -0.5 Z scores compared to baseline from 0–1 s after trial onset. Unless specified, all analysis of neural activity used all cell types including unclassified units, in order to avoid possible bias arising from cell-type specific modulatory effects as well as classification errors. For assessing changes in neural activity (see the Selectivity Index and Population decoding sections below) firing rates were calculated by binning spikes in 50 ms increments using a three bin sliding window average. For spatial analysis of firing rate changes, ML position was determined based on the shank and DV position was based on binned positions (4.02–4.245 mm, 4.27–4.52 mm, 4.545–4.795 mm, 4.82–5.07 mm). For calculating average firing rates changes by neuron type for experiments comparing two different trial types (R vs. R+L, etc.), the mean firing rate for each neuron from 0–0.5s for the non-laser paired trials was subtracted from the mean firing rate for each neuron from 0–0.5s for the laser paired trials. For calculating average firing rates by neuron type for experiments comparing that compared a trial to baseline activity, the mean firing rate for each cell for 1 second of baseline was subtracted from the mean firing rate for each neuron from 0–0.5s for the trial type of interest.
Fiber photometry.
Photometry of dLight fluorescence was conducted synchronously with electrophysiological recordings using the opto-probe described above. The photometry fiber was coupled via a fiber patch cord to a four-port connectorized fluorescence mini cube (FMC4_AE(405)_E(460–490)_F(500–550)_S, Doric Lenses), with one excitation port (460–490 nm) used for dLight1.2 fluorescence, and a 500–550 nm detection port. Fluorescence excitation light was delivered via a 465 nm light emitting diode oscillated at 211 Hz. The emitted signal was then sent to a low noise femtowatt photoreceiver (Model 2151, Newport) connected to a lock-in amplifier (SR810, Stanford Research Systems). The demodulated signal was sampled at 25 kHz by a DAQ (Intan Technologies), and then downsampled to 1 kHz for storage. Offline analysis involved downsampling the signal again to 20 Hz. The fractional change in fluorescence (ΔF/F) was calculated with respect to the average baseline signal 1 s prior to the onset of a trial. The average fractional change in fluorescence was determined by calculating the average value of ΔF/F for a given trial condition from 0–1 s post-stimulus onset. For the Pavlovian task, the average value was calculated from 0–2 s post-cue onset. The factor increase in DA was calculated as the ratio of the maximum laser-evoked ΔF/F to the maximum reward-evoked ΔF/F signal. The DA reward amplification factor was calculated as the ratio of the maximum ΔF/F on R+L trials to the maximum ΔF/F on R trials. Data was excluded if animals failed to perform the task (consuming at least 90% of rewards), if animals failed to show a reward-evoked change in dLight fluorescence of at least 1 z-score, or if VTA DA neuron optogenetic stimulation failed to induce a change in dLight fluorescence.
Photometry depth test.
To determine whether the estimated factor increase in DA was consistent across different depths spanned by the electrode array, a group of DAT-Cre mice were injected with AAV5/Syn-Flex-ChrimsonR-tdTomato in the VTA and pAAV-hSyn-dLight1.2 in the ventral striatum in a procedure identical to that described in the Surgical procedures section. The mouse also underwent identical behavioral training and craniotomy procedures. However, for recording, instead of using an opto-probe, a photometry fiber was lowered to a site corresponding to the top of the area targeted by the electrodes (1.30 mm anterior, 1.25 mm lateral, 4.1 mm ventral). It was then lowered in 0.2 mm increments to target five additional depths (maximum depth: 5.1 mm). At each depth, the mouse was given a randomly interleaved combination of 10 reward trials and 10 trials of 40 Hz pulsed optogenetic stimulation. Between each depth measurement, a 10 minute waiting period ensued for tissue surrounding the optical fiber to stabilize. Before each recording commenced, mice were given 2–3 rewards to ensure that licking behavior was maintained.
Miniscope recordings.
For the animals with an implanted GRIN lens in the ventral striatum, a miniscope (OpenEphys, v4.4) was lowered above the GRIN lens using a micromanipulator. The task completed by these mice was otherwise identical to the reward-paired opto-inhibition experiments. The miniscope was powered and imaging data was acquired by using a Miniscope DAQ (OpenEphys, v3.3). Imaging data acquisition was synchronized with behavioral data via a 5V trigger connection to the Miniscope DAQ, with the excitation light on from -2 to 3 s relative to reward delivery. Following imaging data acquisition, the data was processed using the Minian (v1.2.1)57 pipeline to perform glow removal and denoising (median filter, ksize = 3) without background removal or motion correction. The data was then exported to Matlab (MathWorks, versions 2020a-2023b) for pixel binning (binning was performed by averaging a 5 × 5 array of adjacent camera pixels, corresponding to an effective field size of approximately 8 μm × 8 μm per pixel) and removal of pixels outside of the GRIN lens field of view. The per pixel ΔF/F was calculated with respect to the average baseline signal 1 s prior to the onset of a trial. The per pixel peak signal was determined from the average ΔF/F values from 0 to 0.5 s after the trial onset for each trial type (R or R+L). The overall mean signal was produced from the average of each per pixel ΔF/F for a given trial type (R or R+L). For normalized comparisons, the average peak signal for each pixel across both trial types was compared to the overall mean peak signal for R trials.
Immunohistochemistry.
Mice were anesthetized with isoflurane and transcardially perfused with phosbate buffered saline followed by 10 % neutral buffered formalin. Brains were stored in the neutral buffered formalin solution for at least 1 day at 4 °C before being sectioned at a thickness of 100 μm on a vibratome. Sections were blocked using donkey serum before antibody incubations. VTA slices were incubated with rabbit anti-dsRed polyclonal antibody (632496, Takara) as the primary antibody (1:1000 dilution) overnight at 4 °C. Striatal slices were incubated with chicken anti-GFP (ab13970, Abcam) as the primary antibody (1:1000 dilution) overnight at 4 °C. VTA slices were then incubated with Alexa Fluor 647-conjugated donkey antibody to rabbit IgG (711–605-152, Jackson ImmunoResearch) as the secondary antibody (1:200 dilution) for 4 hours. Striatal slices were incubated with Alexa Fluor 488-conjugated donkey antibody to chicken IgG (703–545-155, Jackson ImmunoResearch) as the secondary antibody (1:200 dilution) for 4 hours. Sections were then mounted using tissue-mounting medium and imaged under a confocal or epifluorescence microscope.
Selectivity index.
Single-neuron selectivity indices were used in two different ways. The first selectivity index was used to determine a neuron’s discrimination of R+L versus R trials, C+L versus C trials, or T+L versus T trials. The second selectivity index was used to determine a neuron’s discrimination of unpaired reward or laser trials versus a preceding baseline period. In both cases the selectivity index was calculated by subtracting 0.5 from the area under the ROC curve and then multiplying the result by 2. The selectivity index was calculated separately for each time bin from -1 to 3 s post-stimulus. The significance level of neural responses was assessed by comparing the observed difference in mean to the resampled difference in mean using randomly shuffled trial assignments (400 permutations). A neuron was defined as being significantly modulated by a stimulus, or selective between two stimulus conditions, if three or more consecutive time bins from 0–1 s showed a statistically significant change in firing (observed difference in mean was greater than 95 % of resampled differences in mean). This was assessed from 0–2 s for the Pavlovian task.
Population decoding.
As with the selectivity index described above, population decoding was used in two different ways. The first type of decoder was trained to distinguish population dynamics on R+L versus R trials, C+L versus C trials, or T+L versus T trials. The second type of decoder was trained to distinguish population dynamics on unpaired laser trials versus a preceding baseline period. For analysis of DA neuron opto-inhibition and GABA neuron opto-activation effects, the decoder was trained on data pooled across all animals, with the number of neurons varied from 5 to 400 or 300, respectively. For analysis of DA neuron opto-activation effects, the decoder was trained on 50 simultaneously recorded neurons. The decoder was based on a linear support vector machine (SVM) learning algorithm58, and utilized 80 % of trials for training and the remaining 20 % for testing the accuracy. The mean decoder accuracy was calculated from the average performance of 50 random neuron selections, and 100 random train/test trial selections. The decoder was separately trained using randomly shuffled trial assignments. The 95 % confidence interval was calculated from testing decoder performance on these shuffled datasets59.
Statistics.
Statistical analysis utilized standard functions in Matlab (MathWorks, versions 2020a-2023b) and Prism (Version 7, GraphPad Software). Data collection and analysis were not performed with blinding to the experiments, but within each recording session, the order of rewards and laser stimulation within each block were pseudo-randomized. Prior to surgery, the viral group that animals would be assigned to was randomized. No statistical methods were used to predetermine sample sizes, but the sample sizes are similar to those used in previous publications9,11,22. The sample size, type of statistical test, and P values are indicated in figure legends. Data distribution was assumed to be normal, but not specifically tested. T-tests were two sided. One-way ordinary or RM ANOVA was followed by Tukey’s post hoc test for multiple comparisons. Two-way RM ANOVA was followed by Sidak’s post-hoc test for multiple comparisons.
Extended Data
Extended Data Fig. 1: Reward response of electrophysiologically classified cell types in the ventral striatum.

a. Percentage of each cell type that showed a significant reward response.
b. Mean firing rate of one putative FSI (left) and TAN (right) unit during reward delivery. Data in this figure represent mean ± SEM (shading).
c. Selectivity index of a population of 774 MSNs, 136 FSIs, and 95 TANs during reward delivery. Selectivity of neural activity is calculated relative to baseline.
Extended Data Fig. 2: GRIN lens imaging of DA dynamics in the ventral striatum.

a. Experimental approach. Miniscope placed above GRIN lens for imaging (not pictured).
b. dLight fractional fluorescence change for R trials (black) and R+L trials (orange). Translucent traces represent a random sample of 20 individual pixel responses for each trial type; opaque traces represent the mean signal across all pixels.
c. Frequency plot of pixel mean peak fluorescence change for R (black) and R+L (orange) trials relative to mean reward response (black dashed line) (n = 2339 pixels, paired two-sided t-test, t = 117, P < 0.0001).
d. Comparison plot of pixel mean peak fluorescence in R and R+L trials (n = 2339 pixels). Line of identity in black.
Extended Data Fig. 3: Effect of VTA DA neuron inhibition on reward-evoked striatal firing rates.

a. Mean firing rate changes for neurons of each cell type (eNpHR3 animals: n = 435 MSN, 73 FSI, 58 TAN; control animals: n = 339 MSN, 63 FSI, 37 TAN; one-way ANOVA, cell type × group effect: F5,999 = 6.937, P < 0.0001). Post-hoc Sidak’s test comparing eNpHR3 animals and controls: MSN (P = 0.25), FSI (P < 0.0001), TAN (P = 0.99). Data represent mean ± SEM.
b. Mean firing rate changes for neurons of each cell type group by ML position. One-way ANOVA: MSN ML position effect (F3,431 = 3.193, P = 0.02), FSI ML position effect (F3,69 = 0.869, P = 0.46), TAN ML position effect (F3,54 = 0.474, P = 0.70). Post-hoc Tukey’s test for MSN: P = 0.0529 for 1.05 mm vs. 1.45 mm. Data in this figure represent mean ± SEM.
c. Mean firing rate changes for neurons of each cell type group by DV position. One-way ANOVA: MSN DV position effect (F3,431 = 4.557, P = 0.004), FSI DV position effect (F3,69 = 0.904, P = 0.44), TAN DV position effect (F3,54 = 1.002, P = 0.40). Post-hoc Tukey’s test for MSN: P = 0.005 for 4.4 mm vs. 5.0 mm, P = 0.02 for 4.7 mm vs. 5.0 mm. Data represent mean ± SEM.
d. Comparison of TAN pause duration in eNpHR3 expressing animals across R and R+L trial types (n = 29 TANs, paired two-sided t-test, t = 0.3825, P = 0.7). Data represent mean ± SEM.
Extended Data Fig. 4: Effect of VTA DA neuron inhibition on spontaneous striatal activity.
a. Top: Experimental approach. Bottom: Task schematic.
b. dLight fractional fluorescence change (mean ± SEM) from one eNpHR3-expressing mouse and one opsin-free control mouse.
c. Mean laser-evoked dLight fluorescence (n = 5 eNpHR3 and 3 control mice, unpaired two-sided t-test, t = 4.2, **P = 0.005).
d. Total percentage of neurons significantly modulated by laser relative to baseline (n = 46 out of 589 cells in eNpHR3 group, n = 25 out of 344 cells in control group, chi square test, χ2 = 0.09, P = 0.8, df = 1).
e. Maximum selectivity index per neuron (n = 589 cells in the eNpHR3 group, n = 344 cells in the control group, unpaired two-sided t-test, t = 1.1, P = 0.3). Selectivity of neural activity is calculated relative to baseline. Lines represent mean ± SD, dots represent individual cells.
f. Firing rate changes (mean ± SEM) by cell type (eNpHR3 animals: n = 435 MSN, 73 FSI, 58 TAN; control animals: n = 261 MSN, 44 FSI, 25 TAN; one-way ANOVA, cell type × group effect: F5,890 = 4.303, P = 0.0007). Post-hoc Sidak’s test comparing eNpHR3 and controls: MSN (P = 0.78), FSI (P = 0.45), TAN (P = 0.37).
g. Top: Selectivity index of 589 neurons pooled across 5 eNpHR3-expressing mice, and 344 neurons pooled across 3 control mice. Bottom: Percentage of neurons significantly modulated by the laser relative to baseline.
h. Mean accuracy of SVM decoder trained using 50 neurons to discriminate laser-evoked from baseline activity. Magenta dashed line indicates the 95 % confidence interval of decoder performance trained on trial-shuffled data. Top: eNpHR3 group. Bottom: control group. Shaded area represents the SD across 50 random drawings of neurons.
i. Maximum decoder accuracy (mean ± SD across 50 drawings) by neuron number (two-way ANOVA, group effect: F1,784 = 8, P = 0.004, neuron number effect: F7,784 = 116, P < 0.0001). Post-hoc Sidak’s test: **P = 0.005 for n = 50 neurons; other comparisons between eNpHR3 and control group not significant.
Extended Data Fig. 5: Effect of DA neuron inhibition during reward anticipation.

a. Top: Targeted areas in the striatum. Bottom: task schematic.
b. Fractional fluorescence change from one eNpHR3-expressing mouse (mean ± SEM).
c. Mean cue-evoked fluorescence (n = 4 eNpHR3 and 5 control mice, two-way RM ANOVA, group effect: F1,14 = 1.6, P = 0.2, trial effect: F1,14 = 5, P = 0.04).
d. Mean anticipatory lick rate (n = 5 eNpHR3 and 6 control mice, two-way RM ANOVA, group effect: F1,14 = 15, P = 0.0016, trial effect: F1,14 = 0.1, P = 0.8).
e. Top: Neuronal selectivity index (SI) from eNpHR3 expressing mice (n = 124 ventral-striatal neurons from 2 mice, n = 77 dorsal-striatal neurons from 2 mice). Middle: SI from control mice (n = 111 ventral-striatal neurons from 3 mice, n = 105 dorsal-striatal neurons from 2 mice). Bottom: Time course of percent neurons significantly modulated by the laser.
f. Total percent neurons selective for trial type pooled by recording location (n = 18/124 ventral striatal cells in eNpHR3 group, n = 19/111 ventral striatal cells in control group, chi-square test, χ2 = 0.3, P = 0.6, df = 1; n = 9/77 dorsal striatal cells in eNpHR3 group, n = 13/105 dorsal striatal cells in control group, chi-square test, χ2 = 0.02, P = 0.9, df = 1).
g. Mean accuracy (± SD of 50 drawings) of decoder trained using 50 neurons pooled across ventral and dorsal striatum to discriminate trial type. Magenta dashed line indicates 95 % confidence interval of decoder performance trained on trial-shuffled data.
h. Maximum decoder accuracy (mean ± SD of 50 drawings) as a function of number of neurons drawn (two-way ANOVA, group effect: F1,588 = 214, P < 0.0001, neuron number effect: F5,588 = 194, P < 0.0001). Post-hoc Sidak’s test: P < 0.01 for all neuron numbers.
i. Maximum decoder accuracy (mean ± SD of 50 drawings) using 50 neurons by recording location (one-way ANOVA, group × recording location effect: F3,196 = 72, P < 0.0001). Post-hoc Sidak’s test: P < 0.001 for all pairwise comparisons.
Extended Data Fig. 6: Effect of activating VTA GABAergic neurons on spontaneous striatal spiking activity.

a. Top: Experimental approach. Bottom: task schematic in which 0.5 s pulsed laser stimulation is delivered in the absence of reward or other stimuli.
b. Top: dLight fractional fluorescence change signal during laser stimulation from one Vgat-Chrimson mouse. Bottom: Mean firing rate of one neuron. Data represent mean ± SEM.
c. Top: Selectivity index of 379 neurons pooled across 3 Vgat-Chrimson mice. Bottom: Percentage of neurons that were significantly modulated by the laser relative to baseline, as a function of time.
d. Top: Mean accuracy of an SVM decoder trained using 50 neurons to discriminate laser-evoked from baseline activity. Shaded area represents the SD across 50 random drawings of neurons. Magenta line indicates the 95 % confidence interval of decoder performance trained on trial-shuffled data. Bottom: Maximum decoder accuracy as a function of neuron number (one-way ANOVA, neuron number effect: F7,392 = 441, P < 0.0001). Post-hoc Sidak’s test: P < 0.0001. Data represent the mean and SD across 50 random drawings of neurons.
Extended Data Fig. 7: Factor increase in DA effects on neuron firing rates.

a. Changes in MSN firing rates compared to baseline as a function of factor increase in DA. n = 26 sessions from 9 Chrimson-expressing mice, and n = 12 sessions from 4 control mice. Chrimson group MSN data are positively correlated with the factor increase in DA (Pearson r = 0.6, P = 0.0033). Dashed line represents the highest value seen in the control data. Blue line represents the linear fit to the Chrimson data.
b. Changes in FSI firing rates compared to baseline as a function of factor increase in DA (Pearson r = 0.005, P = 0.98). Dashed line represents the highest value seen in the control data.
c. Changes in TAN firing rates compared to baseline as a function of factor increase in DA (Pearson r = 0.12, P = 0.55). Dashed line represents the highest value seen in the control data.
Extended Data Fig. 8: Assessing sources of variability in estimating the factor increase in DA.

a. Experimental approach of the dLight photometry depth test.
b. Reward-evoked dLight fractional fluorescence change signal from one Chrimson-expressing mouse. The plots are color-coded by photometry fiber depth from bregma.
c. Laser-evoked dLight fractional fluorescence change signal from one Chrimson-expressing mouse. The plots are color-coded by photometry fiber depth from bregma.
d. Factor increase in DA (the ration of laser-evoked to reward-evoked dLight signal amplitudes) calculated from data at different photometry fiber depths. Data are from n = 2 mice.
e. Recalibrated versus original factor increase in DA. The recalibrated factor used only the first 10 % of reward trials (n = 26 sessions from 9 Chrimson-expressing mice, paired two-sided t-test, t = 2.1, P = 0.04).
f. Maximum decoder accuracy per recording session, as a function of recalibrated factor increase in DA. The decoder was trained using 50 neurons to discriminate laser-evoked from baseline activity. Chrimson group data are positively correlated with the factor increase in DA (Pearson r = 0.9, P < 0.0001). Dashed line represents the highest value seen in the control data. Blue line represents the linear fit to the Chrimson data.
Extended Data Fig. 9: Effect of supra-reward DA signals on activity of different putative striatal cell types.
a. Top: Experimental approach. Bottom: Task schematic. All data in this figure are from the supra-reward condition (4 mice exhibiting over 80 % decoding accuracy in Fig. 6e).
b. Mean firing rate of an FSI and TAN. Data in b, e, i-k represent mean ± SEM.
c. Percent of selective cells.
d. Mean ± SD of maximum absolute value of selectivity index (n = 322 MSN, 63 FSI, 31 TAN, one-way ANOVA, cell type effect: F2,413 = 18, P < 0.0001). Post-hoc Sidak’s test: ****P < 0.0001.
e. Mean firing rate changes for each cell type (Chrimson animals: n = 322 MSN, 63 FSI, 31 TAN; control animals: n = 308 MSN, 42 FSI, 17 TAN; one-way ANOVA, cell type × group effect: F5,777 = 8.416, P < 0.0001). Post-hoc Sidak’s test for eNpHR3 vs controls: MSN (P = 0.12), FSI (P = 0.0005), TAN (P = 0.40).
f. Top: Selectivity index of 322 MSNs from 4 Chrimson-expressing mice. Bottom: Percentage of neurons selective for trial type over time.
g. Same as f for 63 FSIs.
h. Same as f for 31 TANs.
i. Mean neuron firing rate changes by ML position. One-way ANOVA, position effect: MSN (n = 322, F3,318 = 6, P = 0.0005), FSI (n = 63, F3,59 = 2, P = 0.12), TAN (n = 31, F3,27 = 0.22, P = 0.88). Post-hoc Tukey’s test for MSN: P = 0.004 for 1.05 mm vs. 0.65 mm, P = 0.001 for 1.05 mm vs. 1.45 mm, P = 0.004 for 1.05 mm vs. 1.85 mm.
j. Same as i but by DV position. One-way ANOVA, position effect: MSN (n = 322, F3,318 = 3.027, P = 0.03), FSI (n = 63, F3,59 = 1.848, P = 0.15), TAN (n = 31, F3,27 = 1.599, P = 0.21). Post-hoc Tukey’s test for MSN: P = 0.02 for 4.1 mm vs. 4.4 mm.
k. TAN pause durations (n = 24 neurons, paired two-sided t-test, t = 2.5, P = 0.02).
Extended Data Fig. 10: Effect of DA neuron activation during auditory stimulus processing in ventral striatum.

a. Top: Experimental approach. Bottom: task schematic in which neutral auditory tone trials (T) are compared to laser-paired tone trials (T+L).
b. Fractional fluorescence change signal from one Chrimson-expressing mouse (top) and one opsin-free control mouse (bottom) on tone (T) and laser-paired tone (T+L) trials (mean ± SEM).
c. Percentage of neurons per animal that were selective for T versus T+L trials, as a function of DA tone amplification factor (an amplification factor of one corresponds to tone-matched DA levels). n = 4 Chrimson-expressing and 2 control mice (Pearson r = 0.8, P = 0.18). Dashed line represents the highest value seen in the control data.
d. Maximum decoder accuracy per animal, as a function of DA tone amplification factor. The decoder was trained using 50 neurons to discriminate R from R+L trials. n = 4 Chrimson-expressing and 2 control mice (Pearson r = 0.9, P = 0.12). Dashed line represents the highest value seen in the control data.
e. Mean firing rate of two putative MSNs on T and T+L trials. Data are from the supra-reward condition (mice exhibiting over 80 % decoding accuracy in panel d). Data represent mean ± SEM.
f. Top: Selectivity index of 226 neurons pooled across 2 Chrimson-expressing mice. Bottom: Percentage of neurons that were significantly selective for T versus T+L trials, as a function of time. Data are from the supra-reward condition (mice exhibiting over 80 % decoding accuracy in panel d).
Acknowledgments:
SCM was supported by NIH grants NS100050, NS125877, DA042739, DA005010, and NSF NeuroNex Award 1707408. CL was supported by NIH grant 5T32DA024635.
Footnotes
Competing interests: The authors declare no competing interests.
Code availability: The Matlab code used for analyzing data is available at: https://github.com/sotmasman/Dopamine-constraints
Data availability:
The data that support the findings of this study are available at: https://zenodo.org/record/8237324
References:
- 1.Nicola SM, Surmeier J & Malenka RC Dopaminergic modulation of neuronal excitability in the striatum and nucleus accumbens. Annu Rev Neurosci 23, 185–215 (2000). [DOI] [PubMed] [Google Scholar]
- 2.Albin RL, Young AB & Penney JB The functional anatomy of basal ganglia disorders. Trends in neurosciences 12, 366–375 (1989). [DOI] [PubMed] [Google Scholar]
- 3.Tye KM et al. Dopamine neurons modulate neural encoding and expression of depression-related behaviour. Nature (2012). [DOI] [PMC free article] [PubMed] [Google Scholar]
- 4.Berke JD What does dopamine mean? Nat Neurosci 21, 787–793 (2018). [DOI] [PMC free article] [PubMed] [Google Scholar]
- 5.Reynolds JN, Hyland BI & Wickens JR A cellular mechanism of reward-related learning. Nature 413, 67–70 (2001). [DOI] [PubMed] [Google Scholar]
- 6.Yagishita S et al. A critical time window for dopamine actions on the structural plasticity of dendritic spines. Science 345, 1616–1620 (2014). [DOI] [PMC free article] [PubMed] [Google Scholar]
- 7.Lahiri AK & Bevan MD Dopaminergic Transmission Rapidly and Persistently Enhances Excitability of D1 Receptor-Expressing Striatal Projection Neurons. Neuron 106, 277–290 e276 (2020). [DOI] [PMC free article] [PubMed] [Google Scholar]
- 8.Wang DV et al. Disrupting Glutamate Co-transmission Does Not Affect Acquisition of Conditioned Behavior Reinforced by Dopamine Neuron Activation. Cell Rep 18, 2584–2591 (2017). [DOI] [PMC free article] [PubMed] [Google Scholar]
- 9.Howe MW & Dombeck DA Rapid signalling in distinct dopaminergic axons during locomotion and reward. Nature 535, 505–510 (2016). [DOI] [PMC free article] [PubMed] [Google Scholar]
- 10.Hamid AA et al. Mesolimbic dopamine signals the value of work. Nat Neurosci 19, 117–126 (2016). [DOI] [PMC free article] [PubMed] [Google Scholar]
- 11.da Silva JA, Tecuapetla F, Paixao V & Costa RM Dopamine neuron activity before action initiation gates and invigorates future movements. Nature 554, 244–248 (2018). [DOI] [PubMed] [Google Scholar]
- 12.Hamilos AE et al. Slowly evolving dopaminergic activity modulates the moment-to-moment probability of reward-related self-timed movements. Elife 10 (2021). [DOI] [PMC free article] [PubMed] [Google Scholar]
- 13.Soares S, Atallah BV & Paton JJ Midbrain dopamine neurons control judgment of time. Science 354, 1273–1277 (2016). [DOI] [PubMed] [Google Scholar]
- 14.Howard CD, Li H, Geddes CE & Jin X Dynamic Nigrostriatal Dopamine Biases Action Selection. Neuron 93, 1436–1450 e1438 (2017). [DOI] [PMC free article] [PubMed] [Google Scholar]
- 15.Schultz W, Dayan P & Montague PR A neural substrate of prediction and reward. Science 275, 1593–1599 (1997). [DOI] [PubMed] [Google Scholar]
- 16.Engelhard B et al. Specialized coding of sensory, motor and cognitive variables in VTA dopamine neurons. Nature (2019). [DOI] [PMC free article] [PubMed] [Google Scholar]
- 17.Dodson PD et al. Representation of spontaneous movement by dopaminergic neurons is cell-type selective and disrupted in parkinsonism. Proc Natl Acad Sci U S A 113, E2180–2188 (2016). [DOI] [PMC free article] [PubMed] [Google Scholar]
- 18.Mohebi A et al. Dissociable dopamine dynamics for learning and motivation. Nature 570, 65–70 (2019). [DOI] [PMC free article] [PubMed] [Google Scholar]
- 19.Hughes RN et al. Ventral Tegmental Dopamine Neurons Control the Impulse Vector during Motivated Behavior. Curr Biol 30, 2681–2694 e2685 (2020). [DOI] [PMC free article] [PubMed] [Google Scholar]
- 20.Cheer JF et al. Coordinated accumbal dopamine release and neural activity drive goal-directed behavior. Neuron 54, 237–244 (2007). [DOI] [PubMed] [Google Scholar]
- 21.Coddington LT & Dudman JT The timing of action determines reward prediction signals in identified midbrain dopamine neurons. Nat Neurosci 21, 1563–1573 (2018). [DOI] [PMC free article] [PubMed] [Google Scholar]
- 22.Lee K et al. Temporally restricted dopaminergic control of reward-conditioned movements. Nat Neurosci 23, 209–216 (2020). [DOI] [PMC free article] [PubMed] [Google Scholar]
- 23.Pan WX, Coddington LT & Dudman JT Dissociable contributions of phasic dopamine activity to reward and prediction. Cell Rep 36, 109684 (2021). [DOI] [PubMed] [Google Scholar]
- 24.Markowitz JE et al. Spontaneous behaviour is structured by reinforcement without explicit reward. Nature 614, 108–117 (2023). [DOI] [PMC free article] [PubMed] [Google Scholar]
- 25.Bloom FE, Costa E & Salmoiraghi GC Anesthesia and the responsiveness of individual neurons of the caudate nucleus of the cat to acetylcholine, norepinephrine and dopamine administered by microelectrophoresis. J Pharmacol Exp Ther 150, 244–252 (1965). [PubMed] [Google Scholar]
- 26.Kitai ST, Sugimori M & Kocsis JD Excitatory nature of dopamine in the nigro-caudate pathway. Exp Brain Res 24, 351–363 (1976). [DOI] [PubMed] [Google Scholar]
- 27.Yim CY & Mogenson GJ Response of nucleus accumbens neurons to amygdala stimulation and its modification by dopamine. Brain research 239, 401–415 (1982). [DOI] [PubMed] [Google Scholar]
- 28.Connor JD Caudate unit responses to nigral stimuli: evidence for a possible nigro-neostriatal pathway. Science 160, 899–900 (1968). [DOI] [PubMed] [Google Scholar]
- 29.Gonon F Prolonged and extrasynaptic excitatory action of dopamine mediated by D1 receptors in the rat striatum in vivo. J Neurosci 17, 5972–5978 (1997). [DOI] [PMC free article] [PubMed] [Google Scholar]
- 30.Cheer JF, Heien ML, Garris PA, Carelli RM & Wightman RM Simultaneous dopamine and single-unit recordings reveal accumbens GABAergic responses: implications for intracranial self-stimulation. Proc Natl Acad Sci U S A 102, 19150–19155 (2005). [DOI] [PMC free article] [PubMed] [Google Scholar]
- 31.du Hoffmann J & Nicola SM Dopamine invigorates reward seeking by promoting cue-evoked excitation in the nucleus accumbens. J Neurosci 34, 14349–14364 (2014). [DOI] [PMC free article] [PubMed] [Google Scholar]
- 32.Ketzef M et al. Dopamine Depletion Impairs Bilateral Sensory Processing in the Striatum in a Pathway-Dependent Manner. Neuron 94, 855–865 e855 (2017). [DOI] [PubMed] [Google Scholar]
- 33.Maltese M, March JR, Bashaw AG & Tritsch NX Dopamine differentially modulates the size of projection neuron ensembles in the intact and dopamine-depleted striatum. Elife 10 (2021). [DOI] [PMC free article] [PubMed] [Google Scholar]
- 34.Kim DS, Szczypka MS & Palmiter RD Dopamine-deficient mice are hypersensitive to dopamine receptor agonists. J Neurosci 20, 4405–4413 (2000). [DOI] [PMC free article] [PubMed] [Google Scholar]
- 35.Ferenczi EA et al. Prefrontal cortical regulation of brainwide circuit dynamics and reward-related behavior. Science 351 (2016). [DOI] [PMC free article] [PubMed] [Google Scholar]
- 36.Brown HD, McCutcheon JE, Cone JJ, Ragozzino ME & Roitman MF Primary food reward and reward-predictive stimuli evoke different patterns of phasic dopamine signaling throughout the striatum. Eur J Neurosci 34, 1997–2006 (2011). [DOI] [PMC free article] [PubMed] [Google Scholar]
- 37.Roitman MF, Wheeler RA & Carelli RM Nucleus accumbens neurons are innately tuned for rewarding and aversive taste stimuli, encode their predictors, and are linked to motor output. Neuron 45, 587–597 (2005). [DOI] [PubMed] [Google Scholar]
- 38.Patriarchi T et al. An expanded palette of dopamine sensors for multiplex imaging in vivo. Nat Methods 17, 1147–+ (2020). [DOI] [PMC free article] [PubMed] [Google Scholar]
- 39.Li N & Jasanoff A Local and global consequences of reward-evoked striatal dopamine release. Nature 580, 239–244 (2020). [DOI] [PMC free article] [PubMed] [Google Scholar]
- 40.Johnson SW & North RA Opioids excite dopamine neurons by hyperpolarization of local interneurons. J Neurosci 12, 483–488 (1992). [DOI] [PMC free article] [PubMed] [Google Scholar]
- 41.Brown MT et al. Ventral tegmental area GABA projections pause accumbal cholinergic interneurons to enhance associative learning. Nature 492, 452–456 (2012). [DOI] [PubMed] [Google Scholar]
- 42.Eshel N et al. Arithmetic and local circuitry underlying dopamine prediction errors. Nature (2015). [DOI] [PMC free article] [PubMed] [Google Scholar]
- 43.Chuhma N, Mingote S, Moore H & Rayport S Dopamine neurons control striatal cholinergic neurons via regionally heterogeneous dopamine and glutamate signaling. Neuron 81, 901–912 (2014). [DOI] [PMC free article] [PubMed] [Google Scholar]
- 44.Berridge KC The debate over dopamine's role in reward: the case for incentive salience. Psychopharmacology (Berl) 191, 391–431 (2007). [DOI] [PubMed] [Google Scholar]
- 45.Roitman MF, Stuber GD, Phillips PE, Wightman RM & Carelli RM Dopamine operates as a subsecond modulator of food seeking. J Neurosci 24, 1265–1271 (2004). [DOI] [PMC free article] [PubMed] [Google Scholar]
- 46.Lee K et al. Gain Modulation by Corticostriatal and Thalamostriatal Input Signals during Reward-Conditioned Behavior. Cell Rep 29, 2438–2449 e2434 (2019). [DOI] [PMC free article] [PubMed] [Google Scholar]
- 47.Dobbs LK et al. Dopamine Regulation of Lateral Inhibition between Striatal Neurons Gates the Stimulant Actions of Cocaine. Neuron 90, 1100–1113 (2016). [DOI] [PMC free article] [PubMed] [Google Scholar]
- 48.Stuber GD, Hnasko TS, Britt JP, Edwards RH & Bonci A Dopaminergic terminals in the nucleus accumbens but not the dorsal striatum corelease glutamate. J Neurosci 30, 8229–8233 (2010). [DOI] [PMC free article] [PubMed] [Google Scholar]
- 49.Tritsch NX, Ding JB & Sabatini BL Dopaminergic neurons inhibit striatal output through non-canonical release of GABA. Nature 490, 262–266 (2012). [DOI] [PMC free article] [PubMed] [Google Scholar]
- 50.Coddington LT, Lindo SE & Dudman JT Mesolimbic dopamine adapts the rate of learning from action. Nature 614, 294–302 (2023). [DOI] [PMC free article] [PubMed] [Google Scholar]
- 51.Liu H et al. A permissive role for dopamine in the production of vigorous movements. bioRxiv, 2022.2011.2003.514328 (2022). [Google Scholar]
- 52.Nicola SM & Malenka RC Modulation of synaptic transmission by dopamine and norepinephrine in ventral but not dorsal striatum. J Neurophysiol 79, 1768–1776 (1998). [DOI] [PubMed] [Google Scholar]
- 53.Kutlu MG et al. Dopamine release in the nucleus accumbens core signals perceived saliency. Curr Biol 31, 4748–4761.e4748 (2021). [DOI] [PMC free article] [PubMed] [Google Scholar]
- 54.Yang L, Lee K, Villagracia J & Masmanidis SC Open source silicon microprobes for high throughput neural recording. J Neural Eng 17, 016036 (2020). [DOI] [PMC free article] [PubMed] [Google Scholar]
- 55.Pachitariu M, Steinmetz N, Kadir S, Carandini M & Harris KD Kilosort: realtime spike-sorting for extracellular electrophysiology with hundreds of channels. bioRxiv (2016). [Google Scholar]
- 56.Bakhurin KI, Mac V, Golshani P & Masmanidis SC Temporal correlations among functionally specialized striatal neural ensembles in reward-conditioned mice. J Neurophysiol 115, 1521–1532 (2016). [DOI] [PMC free article] [PubMed] [Google Scholar]
- 57.Dong Z et al. Minian, an open-source miniscope analysis pipeline. Elife 11 (2022). [DOI] [PMC free article] [PubMed] [Google Scholar]
- 58.Chang CC & Lin CJ LIBSVM: A Library for Support Vector Machines. Acm T Intel Syst Tec 2 (2011). [Google Scholar]
- 59.Yang L & Masmanidis SC Differential encoding of action selection by orbitofrontal and striatal population dynamics. J Neurophysiol 124, 634–644 (2020). [DOI] [PMC free article] [PubMed] [Google Scholar]
Associated Data
This section collects any data citations, data availability statements, or supplementary materials included in this article.
Data Availability Statement
The data that support the findings of this study are available at: https://zenodo.org/record/8237324