

Abstract
Objective
The long‐term effectiveness of total hip arthroplasty (THA) largely depends on the accuracy of acetabular prosthesis placement. To improve the accuracy of acetabular prosthesis placement, we utilized a new surgical navigation system: visual treatment solution (VTS). The purpose of this study was to verify the efficacy and safety of this system in assisting THA.
Methods
This was a prospective, multicenter, randomized controlled trial. One hundred and twenty‐four patients undergoing primary THAs were included. The experimental group underwent VTS‐assisted THA, and the control group underwent traditional surgical techniques. The main efficacy evaluation indicators were the proportion of anteversion and inclination angles in the Lewinnek safe zone, and secondary evaluation indicators included operation time, Western Ontario and McMaster University Osteoarthritis index (WOMAC) score, Harris score, short‐form‐36 (SF‐36) score, and hip dislocation rate. Statistical analysis was performed mainly by t‐test and chi‐square test.
Results
The proportion of both anteversion and inclination angles in the safe zone was 93.1% in the experimental group and 50.9% in the control group; the difference was significant (p < 0.01). The average operation time was 112.5 min in the experimental group and 92.6 min in the control group; the difference was significant (p < 0.01). There were no significant differences in WOMAC score, Harris score, or SF‐36 score between the experimental and control groups at 3 months after the operation (p > 0.05). The dislocation rate was 0% in the experimental group and 1.6% in the control group; the difference was not significant (p > 0.05).
Conclusion
VTS‐assisted THA can significantly improve the accuracy of acetabular prosthesis placement. However, there were no differences in short‐term clinical outcomes or dislocation rates between the two groups.
Keywords: Accuracy, Computer‐Assisted Navigation, Cup Position, Safe Zone, Total Hip Arthroplasty
A new surgical navigation system “VTS” which can provide “visual treatment solution”in total hip arthroplasty to improve the accuracy of acetabular prosthesis placement.

Background
Total hip arthroplasty (THA) is an effective method for treating advanced hip osteoarthritis and avascular necrosis of the femoral head. The long‐term effectiveness of THA largely depends on the accuracy of acetabular prosthesis placement. Improper acetabular component position may lead to acetabular impingement, polyethylene wear, 1 prosthesis loosening, 2 and dislocation.1, 3
The anteversion and inclination angles are the two most important parameters for evaluating the accuracy of acetabular component placement. Lewinnek 4 recommended an anteversion angle of 15° ± 10° and an inclination angle of 40° ± 10° as the “safety zone” for acetabular cup placement in THA. Deviation of acetabular components from the Lewinnek safe zone is associated with higher dislocation and revision rates. 5 In traditional THA, it is difficult for doctors to know the exact angle of acetabular prosthesis placement, as it is blind to a certain extent. Danoff et al. 6 conducted an analysis of 1289 patients who underwent traditional THA and found that the proportion of the acetabular component deviating from the Lewinnek safe zone was 37%.
With the development of digital technology, surgical navigation systems are increasingly used in THA. These systems use a computer to analyze and process patient image data and assist doctors in formulating surgical plans. During the surgery, they measure the surgical target area and the spatial coordinates of surgical instruments or robots using external spatial coordinate tracking equipment to obtain the relative positional relationship between the two, thereby guiding doctors in precise positioning and implant placement. Surgical navigation systems for THA can be CT‐based or image‐free. 7 Previous researches8, 9, 10, 11 have shown that navigation system–aided THA can improve the accuracy of acetabular prosthesis placement. However, there is a lack of domestic THA navigation system with independent intellectual property rights at present, and the imported navigations are expensive and cannot match the domestic hip joint prosthesis.
Herein, we developed a novel surgical navigation system: visual treatment solution (VTS, One Point, China), consisting of an optical positioning system, a computer, a screen, and a tracker (Figure 1). VTS can track the position of surgical instruments relative to anatomical structures and display parameters, such as acetabular cup angle and reaming depth, in real time. The new navigation system supports simple primary, complex primary and revision THAs. Moreover, VTS supports personalized surgical solutions, such as functional safety zone planning considering pelvic parameters of the fused spine and three‐dimensional (3D) printed prostheses to repair bone defects. This multicenter, randomized controlled clinical study was conducted to evaluate the anteversion and inclination angles, operation time, postoperative functional score, and incidence of adverse events, such as hip dislocation rate, to verify the efficacy and safety of the clinical application of VTS.
FIGURE 1.

The surgical navigation system for total hip arthroplasty: visual treatment solution (VTS).
Materials and Methods
Study Design
This was a prospective, multicenter, randomized controlled, superiority trial. This study was approved by the Ethics Committee of Peking University Third Hospital (approval number: D2021011) and registered with ClinicalTrials.gov (NCT04711720). Subjects were screened from 2021 to 2022 among patients undergoing initial THA at three clinical centers. The subjects were randomly divided into an experimental group and a control group. Patients in the experimental group underwent VTS‐assisted THA, and patients in the control group underwent THA using traditional surgical methods. The perioperative treatment of the two groups of patients was the same. The inclusion criteria were as follows: (1) patients aged 45–80 years and (2) indications for primary THA. The exclusion criteria were as follows: (1) body mass index (BMI) >35 kg/m2, (2) revision THA, (3) patients who were mentally incompetent and patients with alcohol or drug addictions, and (4) the presence of active infectious lesions in the hip or other parts of the body. All the patients signed the informed consent form. The Consolidated Standards of Reporting Trials diagram is shown in Figure 2.
FIGURE 2.
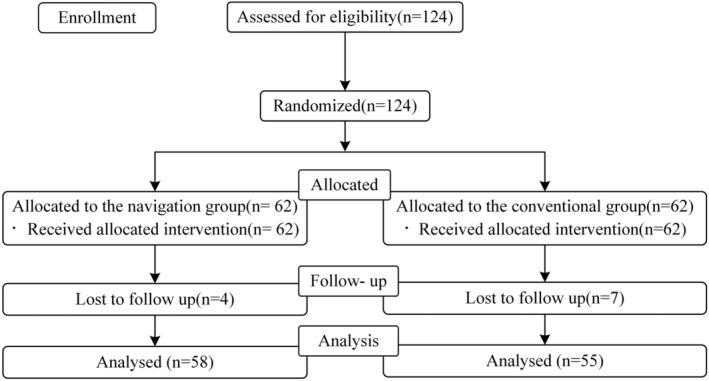
Consolidated Standards of Reporting Trials (CONSORT) diagram. There were 62 patients recruited in each group. Eventually, data from 113 patients (58 in navigation group vs. 55 in conventional group) were collected for statistical analysis.
Surgical Procedure
At each clinical center, surgeries were performed by a senior surgeon who was familiar with the procedures of computer‐assisted surgeries, respectively. The surgical skills of surgeons and the capabilities of postoperative management at the three centers are comparable to each other. All patients were positioned in the lateral decubitus position, and the standardized posterolateral approach was used for both groups in each center. A cementless stem “CL” (Aikang, China) and a cementless acetabular cup “ACT” (Aikang, China) were used for each patient.
In the control group, the surgeon determined the position and size of the prosthesis, the level of osteotomy of the femoral neck, and the adjustment length for the lower extremity using x‐ray films. Intraoperatively, THA was performed using conventional surgical instruments. After the femoral head was removed, the acetabular side was reaped first. The surgeon determined the anteversion and inclination angles of the acetabular cup and placed the acetabular cup and corresponding liner based on patient's position, the angle of the cup with respect to certain anatomical landmarks (such as the transverse acetabular ligament or the acetabular rim). After reaming the femur and implanting the femoral stem, the stability and length of the lower limb were assessed by determining the tension of the joint capsule and the levels of the knee joints and heels on both sides.
Patients in the experimental group underwent VTS‐assisted THA (Figure 3). All patients underwent a preoperative CT of the lower extremities, including the full length of the pelvis and bilateral femurs. 3D modeling of the pelvis and proximal femur was performed by the VTS system, and the preoperative planning included determining the size and position of the prosthesis and predicting the recovery of lower extremity length and femoral eccentricity. During the operation, three screws were inserted into the anterior superior iliac spine to fix and install the pelvic reference frame. After the hip joint was exposed and dislocated, a femoral reference frame fixing screw was inserted into the trochanteric femur to install the femoral reference frame. Registration of the proximal femur and the femoral head was performed, and the femoral neck osteotomy line was marked under the guidance of VTS considering the preoperative femoral osteotomy plan. The medial and edge of the acetabulum were registered, and then, an appropriately sized acetabular reamer was selected considering the preoperative planning. Acetabular reaming was performed and the planned acetabular cup was implanted. During the process of reaming the acetabulum and implanting the acetabular cup, the VTS system was used to determine the position and angle of the acetabular cup in real time, avoiding abnormal reaming and implantation angles of the implant. Subsequently, the femoral marrow cavity was opened, and the medullary cavity was then treated; the appropriately sized stem was placed, and the VTS displayed the femoral anteversion and eccentricity. After placing the acetabular cup and the corresponding liner, as well as the femoral stem and the ball head, the hip joint was repositioned. VTS displayed changes in the final joint anteversion and eccentricity of the hip joint and lower limb length. Based on the above indicators and hip stability, an appropriately sized femoral head was installed to ensure hip stability, restore hip eccentricity, and lower extremity length.
FIGURE 3.

Surgical procedures of VTS‐assisted total hip arthroplasty. (A) Preoperative planning; (B) accurate registration; (C) acetabular reaming; (D) cup impaction; (E) cup verification; (F) final results.
All patients were treated with the same anticoagulation, hemostasis, analgesia, anti‐inflammatory, and other treatment measures during the perioperative period. At 12–24 h after the operation, under the guidance of medical staff, active and passive functional rehabilitation training began.
Outcome Measures
Baseline information included the following: (1) demographic data, for example, patient gender, age, height, and weight; (2) medical history data, for example, disease type, course, and severity; (3) preoperative scale scores, that is, Harris score, Western Ontario and McMaster University Osteoarthritis index (WOMAC) score, and short‐form‐36 (SF‐36) score.
Postoperative pelvic CT of all patients was obtained 3 months after surgery. All the parameters were measured independently and averaged by two professional physicians who were blinded to the groups of patients.
The primary outcome measurement was the proportion of postoperative CT acetabular inclination and anteversion angles in the Lewinnek safe zone. The anteversion was considered the angle between the acetabular axis and its projection on the coronal plane. The inclination angle was considered the angle between the projection of the acetabular axis on the coronal plane and the sagittal plane. The safe zone range was 40° ± 10° inclination and 15° ± 10° anteversion.
Secondary evaluation indicators included the following: (1) operation time (from the establishment of the surgical incision to the end of skin suturing, including the time for instrument and bone alignment); (2) WOMAC score, Harris score, and SF‐36 score 3 months after surgery; (3) hip dislocation rate (probability of hip dislocation due to improper placement of the prosthesis or improper posture of the patient during surgery); and (4) safety (incidence of adverse events and serious adverse events).
Sample Size and Randomization
In this clinical study, to estimate the sample size, the proportion of anteversion and inclination angles in the safe zone was used as the main evaluation index. Referencing the study by Domb et al., 12 the required sample size for this study was 52 patients in each group. Considering possible withdrawals, the sample size was expanded to 62 patients in each group. Participants were randomly assigned to either the experimental group or the control group in a 1:1 ratio using the random envelope method. Before the study began, an independent statistician used SAS 9.4 software to generate a blocked random number sequence. The electronic data capture system systematically created sequential participant ID numbers, which were then linked to the assigned treatment method during randomization. The participants' ID numbers and their assigned groups were securely placed in envelopes. A research assistant was responsible for enrolling participants and assigning them to their respective groups.
Data Analysis
Statistical analysis was performed using SPSS 25.0 (Inc., Chicago, IL). The description of quantitative indicators includes the mean, standard deviation, median, minimum value, maximum value, lower quartile, and upper quartile, and qualitative indicators are described as counts and frequencies. The normality of the data was assessed using the Shapiro–Wilk test. Quantitative data were compared using the t‐test or nonparametric Mann–Whitney U test. Qualitative data were assessed using the chi‐square test or Fisher's exact test. Ranked data were assessed using the Wilcoxon rank‐sum test. A p value less than 0.05 was considered statistically significant.
Results
Baseline Characteristics
A total of 124 patients were randomly enrolled, with 62 subjects in the experimental group and 62 in the control group. Among them, four patients (6.5%) in the experimental group withdrew, and seven subjects (11.3%) in the control group withdrew. There was no significant difference in the withdrawal rate between the two groups (p = 0.34). In total, 113 patients were included in the analysis (58 patients in the experimental group and 55 patients in the control group).
There were no significant differences in gender, age, height, weight, surgical side, disease course, disease staging, or disease category between the experimental group and the control group (p > 0.05; Table 1). There were no significant differences in Harris score, WOMAC score, SF‐36 score, adduction, abduction, internal rotation, external rotation, and hip flexion range of motion between the experimental group and the control group (p > 0.05; Table 2).
TABLE 1.
Demographic data.
| Variate | Index statistics | Experimental group | Control group | Statistic value | p value |
|---|---|---|---|---|---|
| Gender, n (%) | N (missing) | 62 (0) | 62 (0) | 0.00 b | 1.00 |
| Male | 33 (53.2%) | 33 (53.2%) | |||
| Female | 29 (46.8%) | 29 (46.8%) | |||
| Age (years) | N (missing) | 62 (0) | 62 (0) | 1.27 a | 0.21 |
| Mean (SD) | 58.9 (10.3) | 56.5 (10.5) | |||
| Median (Q1, Q3) | 59.5 (53.0, 66.0) | 54.5 (51.0, 64.0) | |||
| Min, max | 32.0, 78.0 | 31.0, 77.0 | |||
| Height (cm) | N (missing) | 62 (0) | 62 (0) | −0.12 a | 0.90 |
| Mean (SD) | 164.9 (8.2) | 165.1 (8.2) | |||
| Median (Q1, Q3) | 165.0 (158.0, 170.0) | 166.0 (158.0, 170.0) | |||
| Min, max | 150.0, 188.0 | 150.0, 183.0 | |||
| Weight (kg) | N (missing) | 62 (0) | 62 (0) | 0.69 a | 0.49 |
| Mean (SD) | 68.8 (10.9) | 67.6 (9.2) | |||
| Median (Q1, Q3) | 69.0 (62.0, 75.0) | 68.9 (60.0, 75.0) | |||
| Min, max | 42.0, 95.0 | 49.0, 86.2 | |||
| Surgical side, n (%) | N (missing) | 62 (0) | 62 (0) | 0.74 b | 0.69 |
| Left | 28 (45.2%) | 31 (50.0%) | |||
| Right | 33 (53.2%) | 29 (46.8%) | |||
| Both | 1 (1.6%) | 2 (3.2%) | |||
| Disease course (months) | N (missing) | 62 (0) | 62 (0) | 0.47 a | 0.64 |
| Mean (SD) | 70.9 (100.3) | 63.2 (82.1) | |||
| Median (Q1, Q3) | 24.0 (12.0, 96.0) | 24.0 (12.0, 84.0) | |||
| Min, max | 0.1480.0 | 0.1360.0 | |||
| Disease staging, n (%) | N (missing) | 62 (0) | 62 (0) | 4.58 b | 0.10 |
| Early stage | 0 (0.0%) | 2 (3.2%) | |||
| Middle stage | 14 (22.6%) | 7 (11.3%) | |||
| End stage | 48 (77.4%) | 53 (85.5%) | |||
| Disease category, n (%) | N (missing) | 62 (0) | 62 (0) | 8.96 b | 0.11 |
| OA | 15 (24.2%) | 13 (21.0%) | |||
| ON | 40 (64.5%) | 38 (61.3%) | |||
| Fx | 3 (4.8%) | 1 (1.6%) | |||
| RA | 4 (6.5%) | 10 (16.1%) |
Abbreviations: FNF, femoral neck fracture; OA, osteoarthritis; ON, osteonecrosis of the femoral head; RA, rheumatoid arthritis; SD, standard deviation.
Two‐tailed independent t‐test.
Chi‐squared test.
TABLE 2.
Baseline patient scores and activity.
| Variate | Index statistics | Experimental group | Control group | Statistic value | p value |
|---|---|---|---|---|---|
| Harris score | N (missing) | 62 (0) | 62 (0) | −0.57 a | 0.57 |
| Mean (SD) | 51.2 (29.6) | 56.1 (61.4) | |||
| Median (Q1, Q3) | 49.5 (39.7, 57.0) | 47.8 (38.6, 56.1) | |||
| Min, max | 11.0, 260.0 | 22.0, 520.0 | |||
| WOMAC | N (missing) | 62 (0) | 62 (0) | −0.07 a | 0.94 |
| Mean (SD) | 47.2 (12.7) | 47.4 (14.2) | |||
| Median (Q1, Q3) | 46.0 (38.0, 54.0) | 48.0 (41.0, 53.0) | |||
| Min, max | 25.0, 87.0 | 5.0, 92.0 | |||
| SF‐36 | N (missing) | 62 (0) | 62 (0) | 0.50 a | 0.62 |
| Mean (SD) | 354.4 (83.5) | 347.1 (77.7) | |||
| Median (Q1, Q3) | 348.4 (305.8400.4) | 330.2 (307.9, 382.5) | |||
| Min, max | 130.0, 558.8 | 168.8, 667.5 | |||
| Adduction (°) | N (missing) | 62 (0) | 62 (0) | 0.86 a | 0.39 |
| Mean (SD) | 13.7 (7.9) | 12.6 (6.4) | |||
| Median (Q1, Q3) | 10.0 (10.0, 15.0) | 10.0 (10.0, 20.0) | |||
| Min, max | 0.0, 30.0 | 0.0, 30.0 | |||
| Abduction (°) | N (missing) | 62 (0) | 62 (0) | 0.30 a | 0.76 |
| Mean (SD) | 20.8 (11.3) | 20.2 (11.4) | |||
| Median (Q1, Q3) | 20.0 (10.0, 30.0) | 20.0 (10.0, 30.0) | |||
| Min, max | 0.0, 45.0 | 0.0, 45.0 | |||
| Internal rotation (°) | N (missing) | 62 (0) | 62 (0) | 0.41 a | 0.68 |
| Mean (SD) | 10.4 (8.2) | 9.8 (9.1) | |||
| Median (Q1, Q3) | 10.0 (5.0, 15.0) | 7.5 (5.0, 15.0) | |||
| Min, max | 0.0, 45.0 | 0.0, 50.0 | |||
| External rotation (°) | N (missing) | 62 (0) | 62 (0) | 1.72 a | 0.09 |
| Mean (SD) | 18.1 (15.1) | 13.7 (12.9) | |||
| Median (Q1, Q3) | 15.0 (5.0, 30.0) | 10.0 (5.0, 20.0) | |||
| Min, max | 0.0, 80.0 | 0.0, 60.0 | |||
| Flexion (°) | N (missing) | 62 (0) | 62 (0) | −0.25 a | 0.80 |
| Mean (SD) | 82.1 (22.9) | 83.1 (23.5) | |||
| Median (Q1, Q3) | 90.0 (70.0, 90.0) | 85.0 (70.0, 90.0) | |||
| Min, max | 0.0, 120.0 | 30.0, 145.0 |
Abbreviations: SD, standard deviation; SF‐36, short‐form‐36; WOMAC, Western Ontario and McMaster University Osteoarthritis index.
Two‐tailed independent t‐test.
Primary Outcomes
The average anteversion angle was 19.5° ± 5.1° (range, 8.3°~32.5°) in the experimental group and 22.7° ± 7.2° (range, 4.5°~34.0°) in the control group; the difference was significant (p = 0.01). The average inclination angle was 40.4° ± 4.9° (range, 32.4°~51.9°) in the experimental group and 41.0° ± 5.8° (range, 29.7°~53.9°) in the control group; the difference was not significant (p = 0.57). A total of 55 (94.8%) and 30 (54.5%) patients in the experimental group and the control group, respectively, had anteversion angles located in the safe zone; the difference was significant (p < 0.01). A total of 57 (98.3%) and 53 (96.4%) patients in the experimental group and the control group, respectively, had inclination angles located in the safe zone; the difference was not significant (p = 0.53). A total of 54 (93.1%) and 28 (50.9%) patients in the experimental group and the control group, respectively, had anteversion and inclination angles both located in the safe zone; the difference was significant (p < 0.01) (Table 3) (Figure 4).
TABLE 3.
Analysis of the anteversion angle and the inclination angle 3 months after surgery.
| Variate | Index statistics | Experimental group | Control group | Statistic value | p value |
|---|---|---|---|---|---|
| Anteversion angle (°) | N (missing) | 58 (4) | 55 (7) | −2.74 a | 0.01 |
| Mean (SD) | 19.5 (5.1) | 22.7 (7.2) | |||
| Median (Q1, Q3) | 20.2 (15.8, 22.9) | 23.1 (17.8, 28.2) | |||
| Min, max | 8.3, 32.5 | 4.5, 34.0 | |||
| Inclination angle (°) | N (missing) | 58 (4) | 55 (7) | −0.57 a | 0.57 |
| Mean (SD) | 40.4 (4.9) | 41.0 (5.8) | |||
| Median (Q1, Q3) | 40.0 (37.0, 43.0) | 40.4 (35.8, 46.3) | |||
| Min, max | 32.4, 51.9 | 29.7, 53.9 | |||
| Anteversion angle in the safe zone (%) | N (missing) | 58 (4) | 55 (7) | 24.58 b | 0.00 |
| Yes | 55 (94.8%) | 30 (54.5%) | |||
| No | 3 (5.2%) | 25 (45.5%) | |||
| Inclination angle in the safe zone (%) | N (missing) | 58 (4) | 55 (7) | 0.40 b | 0.53 |
| Yes | 57 (98.3%) | 53 (96.4%) | |||
| No | 1 (1.7%) | 2 (3.6%) | |||
| Both in the safe zone (%) | N (missing) | 58 (4) | 55 (7) | 25.25 b | 0.00 |
| Yes | 54 (93.1%) | 28 (50.9%) | |||
| No | 4 (6.9%) | 27 (49.1%) |
Abbreviation: SD, standard deviation.
Two‐tailed independent t‐test.
Chi‐squared test.
FIGURE 4.

Typical radiographic images for patients. (A) Pre‐operative and (B) post‐operative images of a patient undergoing conventional THA; (C) pre‐operative and (D) post‐operative images of a patient undergoing VTS‐assisted THA.
Secondary Outcomes
The mean operative time in the experimental group was 112.5 ± 31.3 min (range, 65.0 to 194.0 min), and the mean operative time in the control group was 92.6 ± 42.1 min (range, 48.0 to 298.0 min); the difference was statistically significant (p < 0.01) (Table 4).
TABLE 4.
Analysis of the operation time.
| Variate | Index statistics | Experimental group | Control group | Statistic value | p value |
|---|---|---|---|---|---|
| Operation time (min) | N (missing) | 62 (0) | 62 (0) | 2.99 a | 0.00 |
| Mean (SD) | 112.5 (31.3) | 92.6 (42.1) | |||
| Median (Q1, Q3) | 108.0 (91.0, 127.0) | 90.0 (65.0, 103.0) | |||
| Min, max | 65.0, 194.0 | 48.0, 298.0 |
Abbreviation: SD, standard deviation.
Two‐tailed independent t‐test.
Regarding clinical scores 3 months after surgery, the mean WOMAC score was 16.6 ± 6.8 (range, 3.0 to 30.0) in the experimental group and 17.8 ± 7.8 (range, 1.0 to 35.0) in the control group; the difference was not significant (p = 0.40). The mean Harris score was 81.4 ± 7.7 (range, 57.4 to 97.8) in the experimental group and 80.2 ± 6.6 (range, 60.7 to 99.7) in the control group; the difference was not significant (p = 0.38). The mean SF‐36 score was 545.4 ± 72.5 (range, 391.3 to 780.0) in the experimental group and 534.3 ± 99.9 (range, 236.3 to 772.5) in the control group; the difference was not significant (p = 0.50; Table 5).
TABLE 5.
Analysis of patient‐reported outcome measures (PROMs) 3 months after surgery.
| Variate | Index statistics | Experimental group | Control group | Statistic value | p value |
|---|---|---|---|---|---|
| Harris score | N (missing) | 58 (4) | 55 (7) | 0.88 a | 0.38 |
| Mean (SD) | 81.4 (7.7) | 80.2 (6.6) | |||
| Median (Q1, Q3) | 81.4 (77.7, 85.7) | 79.9 (77.9, 83.7) | |||
| Min, max | 57.4, 97.8 | 60.7, 99.7 | |||
| WOMAC | N (missing) | 58 (4) | 55 (7) | −0.85 a | 0.40 |
| Mean (SD) | 16.6 (6.8) | 17.8 (7.8) | |||
| Median (Q1, Q3) | 16.5 (11.0, 22.0) | 17.0 (13.0, 23.0) | |||
| Min, max | 3.0, 30.0 | 1.0, 35.0 | |||
| SF‐36 | N (missing) | 58 (4) | 55 (7) | 0.68 a | 0.50 |
| Mean (SD) | 545.4 (72.5) | 534.3 (99.9) | |||
| Median (Q1, Q3) | 538.6 (502.9, 587.5) | 533.3 (483.3, 585.0) | |||
| Min, max | 391.3, 780.0 | 236.3, 772.5 |
Abbreviations: SD, standard deviation; SF‐36, short‐form‐36; WOMAC, Western Ontario and McMaster University Osteoarthritis index.
Two‐tailed independent t‐test.
There were no significant differences in the range of motion of adduction, inclination, internal rotation, external rotation, and hip flexion between the experimental group and the control group at 3 months after the surgery (p > 0.05; Table 6). The number of cases of hip dislocation in the experimental group and the control group was 0 (0%) and 1 (1.6%), respectively; there was no significant difference between the two groups (p = 0.32; Table 7). There were no adverse events or serious adverse events in the experimental group or in the control group.
TABLE 6.
Analysis of hip range of motion 3 months after surgery.
| Variate | Index statistics | Experimental group | Control group | Statistic value | p value |
|---|---|---|---|---|---|
| Adduction (°) | N (missing) | 58 (4) | 55 (7) | −0.01 a | 1.00 |
| Mean (SD) | 18.4 (5.1) | 18.5 (5.8) | |||
| Median (Q1, Q3) | 20.0 (15.0, 20.0) | 20.0 (15.0, 20.0) | |||
| Min, max | 10.0, 30.0 | 10.0, 40.0 | |||
| Abduction (°) | N (missing) | 58 (4) | 55 (7) | −0.13 a | 0.90 |
| Mean (SD) | 28.7 (8.7) | 28.9 (8.0) | |||
| Median (Q1, Q3) | 30.0 (20.0, 30.0) | 30.0 (20.0, 30.0) | |||
| Min, max | 15.0, 50.0 | 15.0, 45.0 | |||
| Internal rotation (°) | N (missing) | 58 (4) | 55 (7) | 0.21 a | 0.84 |
| Mean (SD) | 13.7 (7.2) | 13.5 (5.8) | |||
| Median (Q1, Q3) | 10.0 (10.0, 15.0) | 10.0 (10.0, 20.0) | |||
| Min, max | 0.0, 50.0 | 0.0, 30.0 | |||
| External rotation (°) | N (missing) | 58 (4) | 55 (7) | 1.85 a | 0.07 |
| Mean (SD) | 21.6 (12.0) | 18.2 (7.2) | |||
| Median (Q1, Q3) | 15.0 (15.0, 25.0) | 15.0 (15.0, 20.0) | |||
| Min, max | 10.0, 70.0 | 10.0, 45.0 | |||
| Flexion (°) | N (missing) | 58 (4) | 55 (7) | 1.34 a | 0.18 |
| Mean (SD) | 98.4 (8.0) | 96.1 (10.0) | |||
| Median (Q1, Q3) | 100.0 (90.0, 100.0) | 100.0 (90.0, 100.0) | |||
| Min, max | 80.0, 130.0 | 70.0, 130.0 |
Abbreviation: SD, standard deviation.
Two‐tailed independent t‐test.
TABLE 7.
Analysis of the hip dislocation rate.
| Variate | Index statistics | Experimental group | Control group | Statistic value | p value |
|---|---|---|---|---|---|
| Hip dislocation, n (%) | N (missing) | 58 (4) | 55 (7) | 1.02 a | 0.32 |
| No | 58 (100.0%) | 54 (98.1%) | |||
| Yes | 0 (0.0%) | 1 (1.8%) |
Chi‐squared test.
Discussion
The accuracy of acetabular component placement is an influencing factor for the clinical outcomes of THA. Computer‐assisted surgery (CAS) has opened up the possibility of more accurate prosthesis placement. We developed a novel surgical navigation system “VTS” and conducted this multicenter, randomized controlled clinical study to verify the efficacy and safety of this system in assisting THA. The results indicate that VTS‐assisted THA significantly improves acetabular prosthesis placement accuracy.
The Accuracy of Acetabular Component Placement
Multiple meta‐analyses have indicated that CAS can improve the accuracy of acetabular component placement. Beckmann et al. 8 showed that navigation, compared with conventional surgical techniques, reduced the variability in acetabular component positioning and the risk of deviation from the Lewinnek safe zone (RR = 0.21, CI: 0.13–0.32). Similarly, a meta‐analysis by Xu et al. 9 showed that the proportion of acetabular prosthesis outside of the Lewinnek safe zone in traditional THA was 28.4% (85/299) and that the proportion of navigation‐aided THA was only 8.63% (22/255). Liu et al. 10 reported that image‐free navigation systems reduced the proportion of acetabular components that deviated from the Lewinnek safe zone. The results of this study are similar to those of previous studies. In the experimental group, the proportion of both anteversion and inclination angles in the safe zone was 93.1%, much higher than that in the control group 50.9%, demonstrating the efficacy of the new surgical navigation system. Different from previous studies, VTS showed a greater advantage in improving the accuracy of anteversion angles than inclination angles. The VTS navigation system can formulate personalized preoperative planning, including prosthesis type, position, and angle, using patient CT scans. During the operation, the inclination angle, anteversion angle and reaming depth of the acetabular prosthesis can be displayed in real time, effectively solving the issue of blinding in traditional THA surgical prosthesis placement.
Operation Time
Regarding the operation time, most scholars report that the operation time for CAS is longer than that for traditional THA. A meta‐analysis by Xu et al. 9 showed that the use of a navigation system in THA increased the operation time by approximately 19.2 min. The results of this study were similar. The average operation time was 112.5 ± 31.3 min in the experimental group and 92.6 ± 42.1 min in the control group; the difference was significant. This may be related to the addition of nail placement, navigation registration, and repeated angle verification during surgery in the experimental group.
Clinical Outcomes
There is still debate about whether CAS can lead to better clinical outcomes. Many studies have shown that although CAS improves the accuracy of acetabular component placement, this advantage does not translate into better clinical outcomes. Singh et al. 13 compared the 1‐ to 2‐year clinical outcomes of 1960 patients who underwent THA using navigation, robotics, and traditional devices and found that there was no significant difference in patient‐reported outcome measures (PROMs) among the three groups of patients. Lass et al. 14 showed that the Harris hip score (HHS), WOMAC score, and revision rate were comparable between a navigation‐assisted group and conventional group 2 years after surgery. Keshmiri et al. 15 reported 5–7 years of follow‐up results after CAS and traditional THA, with no significant differences in hip injury and osteoarthritis outcome score (HOOS), HHS, and ROM. A study by Parratte et al. 16 showed that HHS, HOOS, SF‐12 scores, and survival rates were comparable between CAS and traditional THA at 10 years of follow‐up. The conclusion of this study was similar to the above, which may be related to a ceiling effect of WOMAC, Harris, and SF‐36 scores in evaluating THA outcomes.
Dislocation Rate
Many studies17, 18, 19 have demonstrated that the accurate placement of acetabular prostheses by CAS can reduce the long‐term postoperative dislocation rate. In this study, there was no significant difference in the dislocation rate between the experimental and control groups (0% vs. 1.6%), a finding that may be related to the smaller sample size and shorter follow‐up time; however, the improved prosthesis placement accuracy is important because increased accuracy reduces dislocations due to force alignment issues.
Safety of the VTS
VTS‐aided THA showed good safety. There were no significant differences in the incidence of adverse events and serious adverse events between the experimental group and the control group, and there were no adverse events and serious adverse events that were “definitely related” to the navigation and positioning system used in this study, indicating that the system is safe for clinical application.
Strengths and Limitations
This is a multicenter, randomized controlled clinical study. However, there are also some limitations. The short follow‐up time may not have been sufficient to observe differences in functional outcomes. Comparisons of complications such as dislocation, polyethylene wear, and prosthesis loosening and revision rate require long‐term follow‐up; notably, our follow‐up study is still in progress. Besides, although the Lewinnek safe area is accepted by most surgeons, the safety margin remains controversial.20, 21, 22 If necessary, different safety zones can be combined for analysis. Finally, spinal‐pelvic parameters were not included in the preoperative planning of the subjects. Spinal‐pelvic considerations has been added in new version of this navigation system, which will be further studied.
Prospects of Clinical Application
The VTS system provides personalized preoperative plan, visual implantation, and precise guidance over the procedure of THA. Moreover, the new navigation system exhibits extraordinary clinical application potential for personalized surgical solutions of complicated operations, such as THAs with fused spine and revision THAs. Related researches are underway.
Conclusions
We developed a new surgical navigation system which can provide VTS for THA. By personalized preoperative plan, visual cup implantation, and precise guidance, the VTS significantly reduced the proportion of acetabular components that deviated from the Lewinnek safe zone, demonstrating great efficacy. Moreover, there were no dislocation or adverse events after VTS‐assisted THAs in this study, indicating good safety for this navigation system.
Ethics Statement
This study was performed in line with the principles of the Declaration of Helsinki and was approved by the Ethics Committee of Peking University Third Hospital, Beijing, China (Approval No. D2021011).
Author Contributions
Ge Zhou and Xiao Geng are joint first authors. Hua Tian, Minwei Zhao, and Feng Li obtained funding and designed the study. Ming Zhang and Zhiwen Sun were involved in performing surgeries, data collecting, and data analyzing. Ge Zhou and Xiao Geng drafted the manuscript. Feng Li, Minwei Zhao, and Hua Tian contributed to critical revision of the manuscript for important intellectual content and approved the final version of the manuscript. All authors read and approved the final manuscript.
Funding Information
This work was supported by Natural Science Foundation of Beijing Municipality (No. L192067).
Conflict of Interest Statement
The authors declare no conflicts of interest.
Acknowledgments
We would like to acknowledge the hard work of Yang Li, Yanqing Liu, and Zijian Li at Peking University Third Hospital, Xinfeng Yan at the First Affiliated Hospital of Shandong First Medical University, and Xin Lv and Feng Guo at Chifeng Municipal Hospital for their contributions to the data collection and analysis in this study.
Ge Zhou and Xiao Geng are co‐first authors.
Contributor Information
Feng Li, Email: lfmed@sina.com.
Minwei Zhao, Email: 18611165078@163.com.
Hua Tian, Email: tianhua@bjmu.edu.cn.
References
- 1. Kennedy JG, Rogers WB, Soffe KE, Sullivan RJ, Griffen DG, Sheehan LJ. Effect of acetabular component orientation on recurrent dislocation, pelvic osteolysis, polyethylene wear, and component migration. J Arthroplast. 1998;13:530–534. 10.1016/s0883-5403(98)90052-3 [DOI] [PubMed] [Google Scholar]
- 2. Georgiades G, Babis GC, Kourlaba G, Hartofilakidis G. Effect of cementless acetabular component orientation, position, and containment in total hip arthroplasty for congenital hip disease. J Arthroplast. 2010;25:1143–1150. 10.1016/j.arth.2009.12.016 [DOI] [PubMed] [Google Scholar]
- 3. Rowan FE, Benjamin B, Pietrak JR, Haddad FS. Prevention of dislocation after total hip arthroplasty. J Arthroplast. 2018;33:1316–1324. 10.1016/j.arth.2018.01.047 [DOI] [PubMed] [Google Scholar]
- 4. Lewinnek GE, Lewis JL, Tarr R, Compere CL, Zimmerman JR. Dislocations after total hip‐replacement arthroplasties. J Bone Joint Surg Am. 1978;60:217–220. [PubMed] [Google Scholar]
- 5. Sadhu A, Nam D, Coobs BR, Barrack TN, Nunley RM, Barrack RL. Acetabular component position and the risk of dislocation following primary and revision total hip arthroplasty: a matched cohort analysis. J Arthroplast. 2017;32:987–991. 10.1016/j.arth.2016.08.008 [DOI] [PubMed] [Google Scholar]
- 6. Danoff JR, Bobman JT, Cunn G, Murtaugh T, Gorroochurn P, Geller JA, et al. Redefining the acetabular component safe zone for posterior approach total hip arthroplasty. J Arthroplast. 2016;31:506–511. 10.1016/j.arth.2015.09.010 [DOI] [PubMed] [Google Scholar]
- 7. Sugano N. Computer‐assisted orthopaedic surgery and robotic surgery in total hip arthroplasty. Clin Orthop Surg. 2013;5:1–9. 10.4055/cios.2013.5.1.1 [DOI] [PMC free article] [PubMed] [Google Scholar]
- 8. Sai Sathikumar A, Jacob G, Thomas AB, Varghese J, Menon V. Acetabular cup positioning in primary routine total hip arthroplasty‐a review of current concepts and technologies. Art Ther. 2023;5:59. 10.1186/s42836-023-00213-3 [DOI] [PMC free article] [PubMed] [Google Scholar]
- 9. Xu K, Li YM, Zhang HF, Wang CG, Xu YQ, Li ZJ. Computer navigation in total hip arthroplasty: a meta‐analysis of randomized controlled trials. Int J Surg. 2014;12:528–533. 10.1016/j.ijsu.2014.02.014 [DOI] [PubMed] [Google Scholar]
- 10. Liu Z, Gao Y, Cai L. Imageless navigation versus traditional method in total hip arthroplasty: a meta‐analysis. Int J Surg. 2015;21:122–127. 10.1016/j.ijsu.2015.07.707 [DOI] [PubMed] [Google Scholar]
- 11. Snijders T, van Gaalen SM, de Gast A. Precision and accuracy of imageless navigation versus freehand implantation of total hip arthroplasty: a systematic review and meta‐analysis. Int J Med Robot. 2017;13:13. 10.1002/rcs.1843 [DOI] [PubMed] [Google Scholar]
- 12. Domb BG, Redmond JM, Louis SS, Alden KJ, Daley RJ, LaReau JM, et al. Accuracy of component positioning in 1980 Total hip arthroplasties: a comparative analysis by surgical technique and mode of guidance. J Arthroplast. 2015;30:2208–2218. 10.1016/j.arth.2015.06.059 [DOI] [PubMed] [Google Scholar]
- 13. Singh V, Realyvasquez J, Simcox T, Rozell JC, Schwarzkopf R, Davidovitch RI. Robotics versus navigation versus conventional total hip arthroplasty: does the use of technology yield superior outcomes? J Arthroplast. 2021;36:2801–2807. 10.1016/j.arth.2021.02.074 [DOI] [PubMed] [Google Scholar]
- 14. Lass R, Olischar B, Kubista B, Waldhoer T, Giurea A, Windhager R. Total hip arthroplasty using imageless computer‐assisted navigation‐2‐year follow‐up of a prospective randomized study. J Clin Med. 2020;9:9. 10.3390/jcm9061620 [DOI] [PMC free article] [PubMed] [Google Scholar]
- 15. Keshmiri A, Schröter C, Weber M, Craiovan B, Grifka J, Renkawitz T. No difference in clinical outcome, bone density and polyethylene wear 5‐7 years after standard navigated vs. conventional cementfree total hip arthroplasty. Arch Orthop Trauma Surg. 2015;135:723–730. 10.1007/s00402-015-2201-2 [DOI] [PubMed] [Google Scholar]
- 16. Parratte S, Ollivier M, Lunebourg A, Flecher X, Argenson JNA. No benefit after THA performed with computer‐assisted cup placement: 10‐year results of a randomized controlled study. Clin Orthop Relat Res. 2016;474:2085–2093. 10.1007/s11999-016-4863-7 [DOI] [PMC free article] [PubMed] [Google Scholar]
- 17. Sugano N, Takao M, Sakai T, Nishii T, Miki H. Does CT‐based navigation improve the long‐term survival in ceramic‐on‐ceramic THA? Clin Orthop Relat Res. 2012;470:3054–3059. 10.1007/s11999-012-2378-4 [DOI] [PMC free article] [PubMed] [Google Scholar]
- 18. Bohl DD, Nolte MT, Ong K, Lau E, Calkins TE, Della Valle CJ. Computer‐assisted navigation is associated with reductions in the rates of dislocation and acetabular component revision following primary total hip arthroplasty. J Bone Joint Surg Am. 2019;101:250–256. 10.2106/jbjs.18.00108 [DOI] [PubMed] [Google Scholar]
- 19. Agarwal S, Eckhard L, Walter WL, Peng A, Hatton A, Donnelly B, et al. The use of computer navigation in total hip arthroplasty is associated with a reduced rate of revision for dislocation: a study of 6,912 navigated THA procedures from the Australian Orthopaedic Association National Joint Replacement Registry. J Bone Joint Surg Am. 2021;103:1900–1905. 10.2106/jbjs.20.00950 [DOI] [PubMed] [Google Scholar]
- 20. Murphy WS, Yun HH, Hayden B, Kowal JH, Murphy SB. The safe zone range for cup anteversion is narrower than for inclination in THA. Clin Orthop Relat Res. 2018;476:325–335. 10.1007/s11999.0000000000000051 [DOI] [PMC free article] [PubMed] [Google Scholar]
- 21. Abdel MP, von Roth P, Jennings MT, Hanssen AD, Pagnano MW. What safe zone? The vast majority of dislocated THAs are within the Lewinnek safe zone for acetabular component position. Clin Orthop Relat Res. 2016;474:386–391. 10.1007/s11999-015-4432-5 [DOI] [PMC free article] [PubMed] [Google Scholar]
- 22. Tezuka T, Heckmann ND, Bodner RJ, Dorr LD. Functional safe zone is superior to the Lewinnek safe zone for total hip arthroplasty: why the Lewinnek safe zone is not always predictive of stability. J Arthroplast. 2019;34:3–8. 10.1016/j.arth.2018.10.034 [DOI] [PubMed] [Google Scholar]