Abstract
Background
Ovarian cancer (OC) poses a significant health burden with high mortality rates among female reproductive malignancies. Variability in treatment responses underscores the need for reliable prognostic markers to refine risk stratification. PANoptosis, a novel form of programmed cell death, plays pivotal roles in cancer pathogenesis and therapy. However, its prognostic relevance in OC remains unclear.
Methods
Utilizing data from The Cancer Genome Atlas (TCGA), we analyzed transcriptomic and clinical signatures of OC patients. Through consensus clustering, we delineated molecular subtypes associated with PANoptosis-related genes (PRGs). We constructed and validated prognostic models using LASSO and Cox regression analyses, corroborated with GEO dataset validation. CIBERSORT assessed immune cell infiltration by risk score, and a predictive algorithm evaluated chemotherapy responses. Additionally, we investigated the biological role of the key gene CXCL13 in OC and its response to immunotherapy.
Results
Based on 19 PRGs, we identified two OC subtypes (PAN-Cluster1, PAN-Cluster2). Machine learning-derived risk scores using PAN-Cluster differentially expressed genes emerged as an independent prognostic indicator. Distinct risk groups exhibited varying clinical outcomes, immune profiles, drug sensitivities, and mutational landscapes. Notably, we confirmed CXCL13 as a model key gene and explored its role in OC regulation. In OC cells, suppression of CXCL13 expression enhances cell proliferation and migration, while patients with high CXCL13 expression show an improved response to immunotherapy.
Conclusion
We initially identified the molecular subtypes associated with PRGs and established a prognostic model related to PRGs to predict survival and drug response in OC patients. Although further validation is required, these findings offer valuable insights into the development of personalized treatment strategies for OC patients.
Keywords: PANoptosis, ovarian cancer, tumor microenvironment, drug sensitivity, prognosis
Introduction
Ovarian cancer (OC) is the most malignant tumor among gynecological tumors, posing a serious threat to women’s health.1 In recent years, advancements in surgical techniques, chemotherapy, molecular targeted therapy, and immunotherapy drugs have led to a significant increase in the survival rate of OC patients.2 Due to the lack of typical clinical manifestations of early-stage OC, and the lack of effective screening methods and therapeutic targets at this stage, patients with significant symptoms may often be in the advanced stage.3 Therefore, there is an urgent need to find the factors associated with OC prognosis and their molecular mechanisms, which are essential to provide effective treatment and improve patient outcomes.
Programmed cell death (PCD) is an evolutionarily conserved biological process that plays a central role in maintaining the body’s physiological balance.4 Among all known types of PCD, pyrodeath, apoptosis, and necrosis are typical ways of controlling the initiation, transduction, and execution of cell death through complex molecular mechanisms.5 PANoptosis is a PCD pattern that combines the features of apoptosis, pyrodeath and necrotic apoptosis and cannot be replaced alone.6,7 Due to the complex mechanism of PANoptosis, it has been widely studied in recent years. Studies have found that the disorder of PANoptosis is related to various human diseases, including autoinflammatory diseases, cancer, infectivity and metabolic disorders. Research has confirmed that PANoptosis can induce cell death in different cancer cell lines. Cell death provides host defense and maintains homeostasis, indicating that PANoptosis plays an important role in tumor progression.8,9 The phenotypic heterogeneity of tumor samples can be comprehensively evaluated by multi-omics analysis, which plays an important role in the screening and mechanism study of tumor markers.10 The molecular clustering and prognostic features of PANoptosis have great potential in predicting the survival status and tumor microenvironment of colon cancer patients.11 Through the regulation of PCD pathway, most chemotherapy drugs have achieved obvious therapeutic effect. However, drug tolerance often occurs in the PCD pathway due to mutations in tumor cells, but stimulating PANoptosis triggers immune system activation and reduced drug resistance,12,13 such as paclitaxel and cisplatin, which inhibit lung cancer cell proliferation and metastasis by inducing PANoptosis. Phosphorylated cysteine desulphurase can reduce chemotherapy sensitivity of colorectal cancer by inhibiting PANoptosis.14 The development of resistance to chemotherapy drugs in OC has become a difficult clinical treatment, so a deeper understanding of the mechanism of PANoptosis could provide new opportunities for effective strategies for anti-cancer treatment.
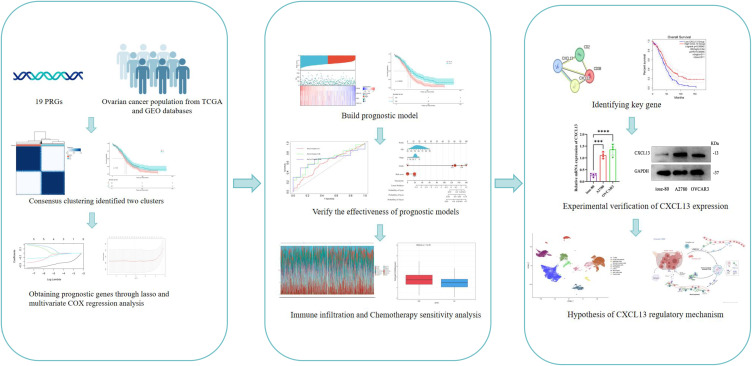
Currently, research on PANoptosis in OC is still limited. Recently, Liu’s team published a study on a PANoptosis-related Prognostic Signature for predicting ovarian cancer prognosis, tumor microenvironment, and immune responses, highlighting the growing interest in the role of PANoptosis in OC.15 However, a unified model has yet to be applied in clinical practice, and the relationship between PANoptosis and OC remains to be further explored. In this study, we investigated the important role of PANoptosis-related genes (PRGs) in stratification and prognosis of patients with OC based on high-throughput sequencing data. Further evaluation of the immune status of the patient and evaluation of the association of PRGs with the immune environment may help to shed light on the pathogenesis of OC and potential therapeutic pathways. As the flow chart shows (Figure 1), this study suggests that the PRGs related prognostic model we constructed is an important part of OC individualized therapy.
Figure 1.
The flowchart of this study.
Materials and Methods
Data Acquisition and Preprocessing
We collected transcriptome and clinical data from 412 cases of ovarian cancer available in the Cancer Genome Atlas (TCGA) database (https://portal.gdc.cancer.gov/). mRNA expression data from 88 normal ovarian samples were obtained from the GTEx database (https://www.gtexportal.org/). Patients with complete gene expression data and clinical prognosis information were selected for subsequent analysis. Additionally, single-cell RNA sequencing (scRNA seq) data in matrix file format (GSE149614) were downloaded from the NCBI GEO public database (http://www.ncbi.nlm.nih.gov/geo/), comprising 7 ovarian cancer samples and 5 normal controls (NC). Furthermore, the expression profile and clinical information from the GSE30161 dataset were used as a validation set. Nineteen non-redundant PANoptosis were identified based on previous research and literature.12,16,17 The expression data and clinical treatment information from the IMvigor210 cohort were downloaded from the following website: http://research-pub.gene.com/imvigor210corebiologies, and the data were normalized using the DESeq2 R package.18
Cluster Pattern Based on PRGs
Based on PRG expression profiles, ovarian cancer (OC) patients from TCGA were aggregated and subjected to clustering using the “ConsensusClusterPlus” package to delineate PRG-related molecular subtypes in OC.19 Agglomerative PAM clustering with a 1-Pearson correlation distance metric was employed, resampling 80% of the samples across 10 iterations to ensure robust clustering. The optimal number of clusters was determined using an empirical cumulative distribution function plot.Furthermore, survival analysis comparing different subtypes was conducted using Kaplan-Meier (KM) survival curves. Differentially expressed genes (DEGs) associated with PRGs were identified by screening with the “limma” package, employing criteria of “|log2FC|>2” and “adjusted P<0.05”. Gene Set Variation Analysis (GSVA), implemented using the R package, was utilized to assess variations in biological processes.20
Functional Enrichment Analysis
Enrichment analysis was employed to discern gene ontology (GO) and Kyoto Encyclopedia of Genes and Genomes (KEGG) functional annotations. GO analysis and KEGG pathway analysis were conducted using the R package “clusterProfiler”, employing a significance threshold of P < 0.05.21
Constructing Prognostic Characteristics of OC Patients
Using the identified DEGs, genes were selected to construct prognostic features based on PRGs. Initially, we conducted univariate Cox regression analysis to identify DEGs associated with prognosis. Subsequently, we employed the survival, survminer, and glmnet R packages for least absolute shrinkage and selection operator (LASSO) regression analysis and multivariate Cox regression analysis to refine the candidate gene selection process. The PRGs signature feature was calculated as: risk score = , where
  denotes the LASSO coefficient for ith gene, and
  represents the expression level of ith gene.22 Patients were stratified into high-risk and low-risk groups based on their median risk score, and Kaplan-Meier analysis was performed to assess their prognostic outcomes. The stability of the prognostic model was evaluated using time-dependent receiver operating characteristic (ROC) curves and the area under the curve (AUC).23
Evaluation of Mutations, Tumor Microenvironment and Drug Sensitivity in High-Risk and Low-Risk Subgroups
Initially, the “maftools” R package was employed to analyze mutation frequency, mutation types, and base changes in two distinct subgroups of ovarian cancer (OC) patients.24 Subsequently, CIBERSORT was utilized to assess immune cell infiltration using gene expression data from TCGA. The “ESTIMATE” R package was then applied to compute Immune Score, Stromal Score, and ESTIMATE Score, which collectively represent scores for immune infiltration, stromal cell infiltration, and overall tumor purity, respectively. To further characterize immune cell infiltration, we calculated immune cell infiltration scores and evaluated immune function using single-sample gene set enrichment analysis (ssGSEA). Additionally, leveraging the “pRRophetic” R package, we predicted drug responses in cancer patients and assessed the sensitivity of different patient subgroups based on cell line screening data.25
The Expression, Prognostic Value, and Distribution of Genes in This Model
We employed the GEPIA database to investigate the distinct expression patterns and prognostic significance of core genes within ovarian cancer (OC) and normal ovarian tissue (NT) as part of our risk model. Furthermore, we utilized the String database (https://string-db.org/)26,27 to analyze protein interactions among these core genes. For a deeper exploration of the tumor microenvironment (TME) at the single-cell level, we utilized data from the Tumor Immune Single-cell Hub (TISCH) database (http://tisch.compgenomics.org).28 The TISCH approach facilitated the examination of core gene expression across various TME cell types in OC patients.
Cells and Culture
The human ovarian cancer cell lines A2780 and OVCAR3, along with the human ovarian surface epithelial cell line IOSE-80, were procured from the BeNa Culture Collection (China). These cell lines were maintained in DMEM medium (HyClone, USA) supplemented with 10% bovine serum (Gibco) and antibiotics, and incubated in a 5% CO2 atmosphere at 37°C.
Transfection of Small Interfering RNA (siRNA)
Three distinct siRNA sequences targeting CXCR13, along with a scrambled control siRNA, were designed as follows: CXCR13 siRNA-1 (siCXCR13-1): 5’-GGAUUCUUCUACAGACUU-3’; CXCR13 siRNA-2 (siCXCR13-2): 5’-GGAUAGGUUGACAGAUUU-3’; CXCR13 siRNA-3 (siCXCR13-3):5’-GGAAGACUGUUCAAAAUU-3’; Control siRNA (si-NC): 5’-UUCUCCGAACGUGUCACGU-3’. All siRNAs were synthesized by HanBio Technology (Shanghai, China) and transfected using Lipofectamine™ 2000 (Invitrogen), according to the manufacturer’s protocol.
Real-Time Quantitative PCR
Total RNA was extracted using a reagent from Vazyme Biotech Co, Ltd, followed by reverse transcription into cDNA using Hiscript III RT SuperMix for qPCR+gDNA wiper (Vazyme Biotech Co, Ltd). Quantitative PCR (qPCR) was carried out using ChamQ Universal SYBR qPCR Master Mix (Vazyme Biotech Co, Ltd) on the StepOnePlus Real-Time PCR system (ABI). Primers specific to human genes were sourced from Shangya Biotechnology (Fuzhou). The primer sequences used were as follows: CXCL13 forward primer 5’-GCTTGAGGTGTAGATGTGTCC-3’ and reverse primer 5’-CCCACGGGGCAAGATTTGAA-3’; GAPDH (used as an internal reference) forward primer 5’-CAGCCTCAAGATCATCAGCA-3’ and reverse primer 5’-TGTGGTCATGAGTCCTTCCA-3’.
Western Blotting Analysis
Cells were harvested and lysed in RIPA lysis buffer (Keygen Biotech) supplemented with a protease and phosphatase inhibitor cocktail (Keygen Biotech). Immunoblotting was performed as previously described using primary antibodies. Protein concentrations were determined using the BCA Protein Assay Kit (Thermo Fisher Scientific, USA). Protein samples (20–50 μg) were separated on a 10% SDS-PAGE gel and transferred to a PVDF membrane (Millipore, USA). Following blocking with 5% skim milk, membranes were incubated overnight at 4 °C with primary antibodies, followed by appropriate secondary antibodies. Immunoreactive proteins were detected using ECL Western blotting detection reagents (Thermo Fisher Scientific). Protein expression levels were quantified using ImageJ Software and normalized to β-actin as the loading control.
T Cell-Mediated Cytotoxicity Assay
T cell-mediated cytotoxicity assay was performed according to reports,29 using the apoptosis assay to evaluate T cell killing activity. A2780 cells and T cells were co-cultured for 24 hours before undergoing the related treatments. Cell viability was measured using a microplate reader at 450 nm.
CCK-8 Assay
The cells were plated in a 96-well plate at a density of 5000 cells per well, with each well containing a total volume of 100 μL. Following the incubation of A2780 cells for 48 hours, 10 μL of CCK-8 reagent was introduced to each well. The cells were subsequently incubated at 37°C in an atmosphere containing 5% CO2 for one hour. Cell viability was assessed using the Cell Counting Kit (Beyotime, Nanjing, China), and optical absorbance was measured at a wavelength of 450 nm.
Apoptosis Assay
In this study, the Annexin V/PE Cell Apoptosis Kit (Keygene Biotech, Nanjing, China) was used to assess the apoptosis of A2780 cells. The cells were digested into a suspension using trypsin without EDTA, followed by a 5-minute centrifugation at 1000 rpm. The cell pellets were washed twice with pre-cooled PBS and then resuspended in 750 μL of binding buffer working solution. Cells were stained with 5 μL of Annexin V (Annexin V(FITC)) and 5 μL of propidium iodide (PI) in the dark for 15 minutes at room temperature. After the staining incubation, 400 μL of 1× Binding Buffer was added to each tube. Flow cytometry was used to analyze the apoptotic cells.
EdU Proliferation Assay
The 10 μM 5-ethynyl-2′-deoxyuridine (EdU) solution was prepared according to the manufacturer’s instructions (C10310-3, C10310-1, RiboBio, China). A2780 cells, transfected with siRNA, were seeded in a 24-well plate. Once the cells reached the desired confluence, the medium was replaced with 100 μL of EdU solution and incubated at 37°C in a 5% CO2 atmosphere for 2 hours. After incubation, the cells were fixed with 4% paraformaldehyde for 20 minutes, followed by a 30-minute incubation with Apollo® reagent (100 μL) at room temperature. Subsequently, the cells were stained with DAPI and analyzed using a fluorescence microscope. The proliferation rate was determined by calculating the ratio of EdU-positive cells to the total number of DAPI-positive cells.
Wound Healing Assay
A2780 cells were seeded in a 12-well plate. Once the cells reached 100% confluence, a sharp instrument was used to draw four intersecting lines within each well, effectively creating a scratch in the monolayer. Images were then captured under a microscope at 0 hours. After a 48-hour incubation, images were taken again to observe cell migration. The migration area between the two time points was quantified using ImageJ software.
Statistical Analysis
Statistical analysis was conducted using R software (version 4.1.3). The t test was used to compare the difference between the two groups of normally distributed data, and the Wilcoxon rank sum test was used to compare the difference between the two groups of data that did not obey the normal distribution. Survival curves were generated using the Kaplan-Meier method, with group comparisons performed using the logrank test. Cox proportional hazards regression analysis was employed for multivariate survival analysis. Experimental data and images were processed using GraphPad (version 9.4.1, USA) and ImageJ (version 1.53e, USA). Parametric data were analyzed using one-way ANOVA. A bilateral P value less than 0.05 was considered statistically significant for all tests.
Results
Genetic Variability of PRGs in OC
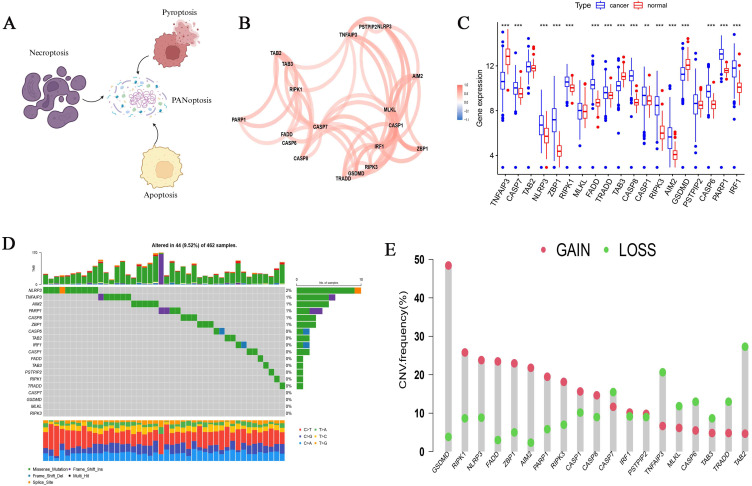
PANoptosis is composed of apoptosis, necroptosis, and pyroptosis (Figure 2A). Based on previous research results, we included 19 PRGs (Table S1), and we found that 19 PRGs were positively correlated in OC (Figure 2B). 412 ovarian cancer samples and 88 normal ovarian tissue samples from TCGA and GTEx databases were used to analyze the expression differences of 19 PRGs. There was no significant difference in the expression of TAB2, MLKL and PSTPIP2 genes between the two groups, TNFAIP3, TAB3, and GSDMD were highly expressed in normal ovarian tissue, while other genes were highly expressed in ovarian cancer tissue (p<0.05) (Figure 2C).By analyzing the somatic mutation rates of 19 PRGs in OC patients, we found that 44 out of 462 OC samples had PRGs mutations, with a mutation frequency of 9.52%, and the NLRP3 gene had the highest mutation frequency (Figure 2D). PRGs copy number variation (CNV) was observed on human chromosomes, and the copy number amplification frequency of GSDMD, RIPK1 and NLRP3 genes was higher, while the copy number deletion frequency of TAB2, TRADD and TNFAIP3 genes was higher (Figure 2E).
Figure 2.
Summary of the properties of PRGs (PANoptosis-related genes) in OC samples (ovarian cancer). (A) Schematic diagram of the PRGs. (B) PRGs interaction in OC samples. (C) Differential expression of PRGs in OC and normal tissue samples. **p < 0.01; ***p < 0.001. (D) Mutations of PRGs in OC samples. (E) CNV frequencies of PRGs in OC samples.
Identification and Analysis of Molecular Subtypes Related to PRGs
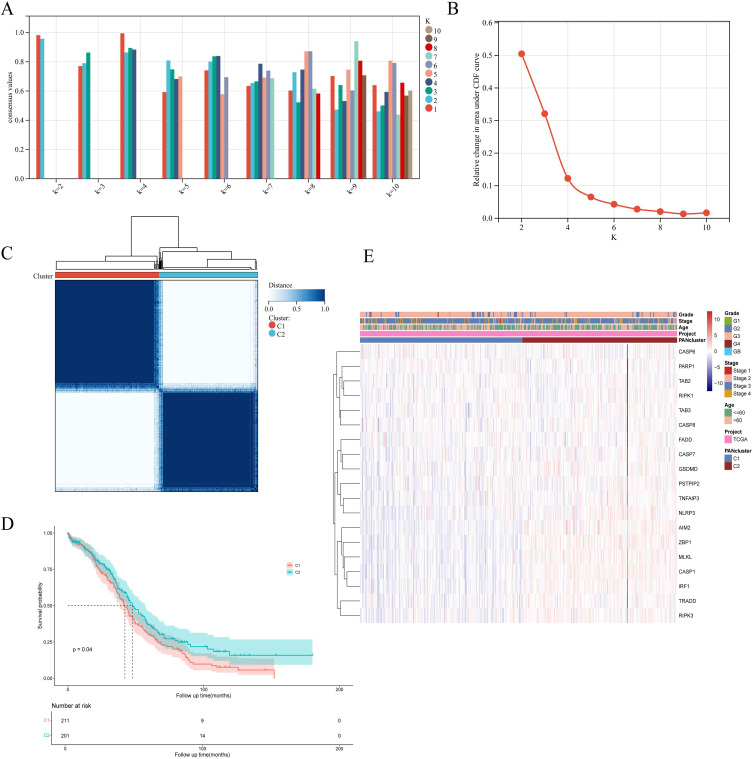
Based on 19 PRGs, we performed consensus cluster classification on OC samples from TCGA dataset. After unsupervised clustering, the samples were divided into two clusters, and the clusters were named Cluster1 (n =211) and Cluster2 (n = 201) (Figure 3A, B and C). The prognosis analysis showed that the survival time difference between the two groups was statistically significant, and the prognosis of cluster2 was significantly better than cluster1 (Figure 3D). In addition, we constructed a heat map to evaluate the correlation between PRGs expression and PRGs clustering and clinical features. We found that PRGs is highly expressed in Cluster2, which has a better prognosis, which is in line with the biological function of PANoptosis in cells (Figure 3E).
Figure 3.
19 PRGs identified two PAN clusters with different prognoses in OC samples. (A and B) Evaluate the average consistency within the cluster and evaluate the area under the CDF curve when K takes different values. (C) OC samples were grouped by consensus clustering (k=2). (D) Kaplan-Meier survival analysis of PAN cluster groups. (E) The heatmap displays the correlation among PANclusters, clinical characteristics of OC samples, and PRG expression.
The Biological Behavior of DEGs in Different Molecular Subtype Groups
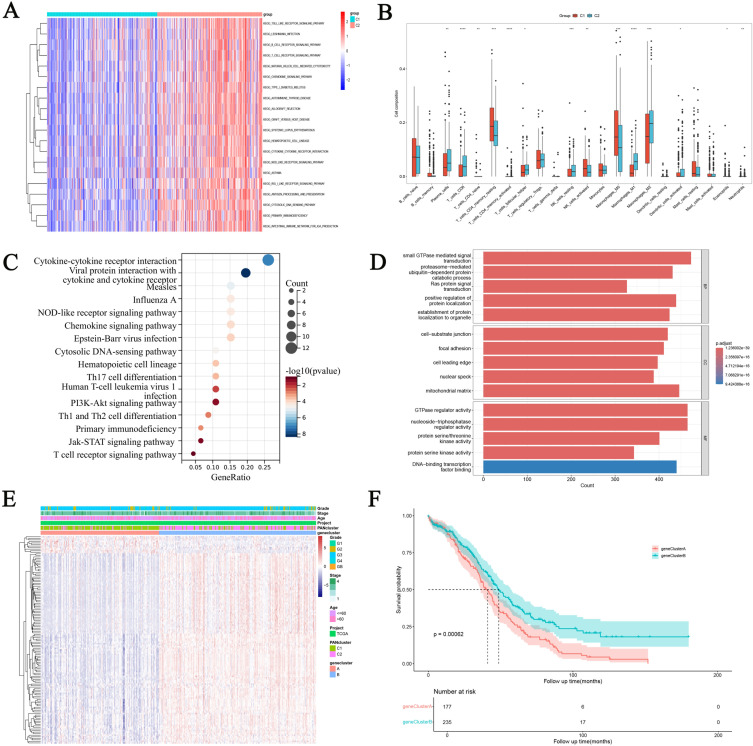
In order to determine the enrichment of KEGG pathways between different clusters, GSVA enrichment analysis was performed (Figure 4A). Compared with cluster1, toll-like receptor signaling pathway, B-cell receptor pathway and T-cell receptor signaling pathway were significantly enriched in cluster2, indicating certain differences in immune regulation ability between the two groups. Therefore, CIBERPORT method was used to analyze the immune cell infiltration between the two groups (Figure 4B). Immune killer cells such as Plasma cells, CD8 cells, Follicular helper T cell and Macrophages mainly infiltrate highly in cluster2. Immunostatic cells such as CD4 memory resting and M0 macrophages are mainly highly infiltrated in cluster1. In order to better study the function of PANoptosis, differential genes in different cluster groups were analyzed using limma R package, and KEGG (Figure 4C) and GO (Figure 4D) enrichment analyses were performed. We found that the main enrichment pathways of DEGs are “Cytokine-cytokine receptor interaction”, “NOD-like receptor signaling pathway”, “Th17, Th1 and Th2 cell differentiation”, “PI3K-Akt signaling pathway”, DEGs is mainly manifested in biological processes as “protein serine kinase activity”, “GTPase regulator activity” and “cell-substrate junction”. Then we conducted consensus clustering classification on OC samples of TCGA data set again based on DEGs. After unsupervised clustering, the samples were divided into two gene clusters, and the queues were named gene Cluster A (n =177) and gene Cluster B (n = 235) (Figure S1). Subsequently, heat maps were constructed to show the association between DEGs and PANcluster, gene cluster and clinical information (Figure 4E). We found that DEGs was significantly highly expressed in clutser2 and gene clusterB, and the samples of PANcluster and gene cluster were highly overlapping. In addition, the prognostic analysis found that the prognosis of gene Cluster A was significantly better than that of gene Cluster B (Figure 4F).
Figure 4.
Identification of Differential expression of genes (DEGs) in PAN clusters and construction of gene-clusters. (A) Differences in GSEA enrichment between PANclusters. (B) Analysis of immune cell infiltration between PANclusters. *p < 0.05; **p < 0.01; ***p < 0.001;****p<0.0001. (C and D) KEGG and GO analyze of DEGs in PAN clusters. (E) Heatmap showing the relationship between PRGs expression and gene cluster, PANcluster, and clinical information. (F) Prognostic differences between gene clusters.
Establishment and Verification of Risk Model Based on DEGs
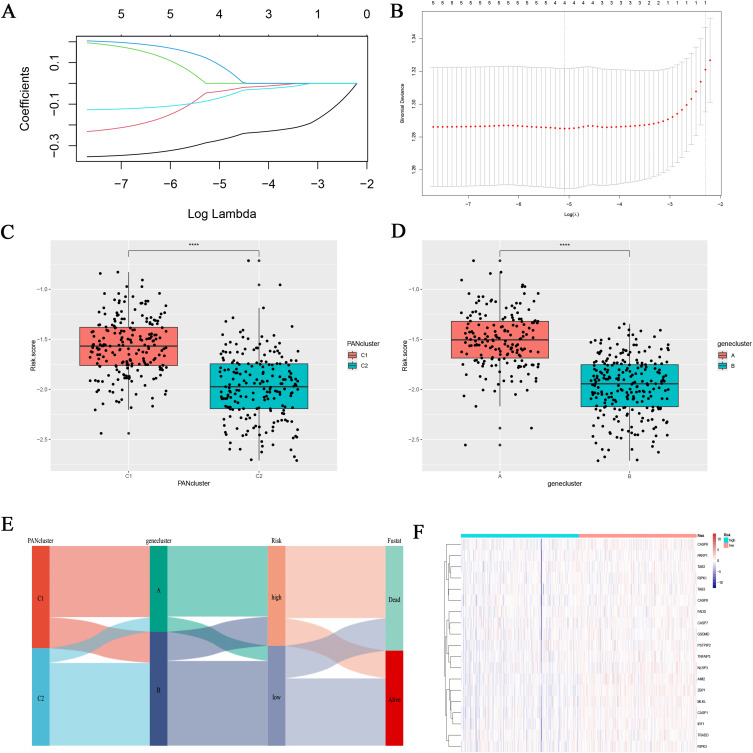
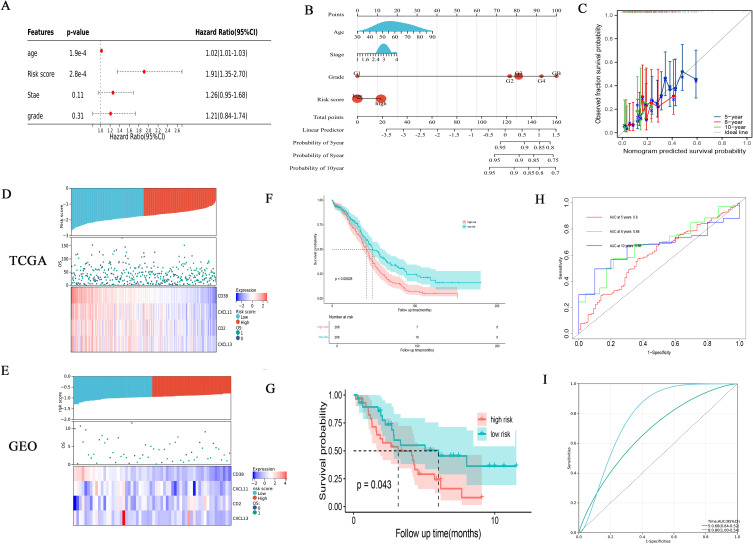
Through univariate and multivariate cox regression analysis of DEGs, genes with independent prognosis were selected. Finally, through lasso regression analysis, a prognostic model was constructed under the optimal lambda value (Figure 5A and B). The formula of the risk score model was risk score = , and the TCGA samples were divided into high-risk group and low-risk group according to the median risk score. Through group analysis, we found that the risk scores of PANclutser1 and gene clusterA were significantly higher than those of PANclutser2 and gene cluster B (Figure 5C and D). Sankey plots were used to show correlations between PANclutser, gene clusterB, risk groups, and survival outcomes (Figure 5E). By constructing heat maps, we found that PRGs were generally highly expressed in the low-risk group (Figure 5F). Multivariate regression analysis suggested that risk score was an independent prognostic indicator of poor prognosis (Figure 6A). Univariate and multivariate Cox and LASSO regression analyses were used to build a nomogram based on age, grade, stage and risk score to enhance the clinical applicability of the model. The nomogram helps to accurately predict patients’ 5-year, 8-year, and 10-year OS (Figure 6B). The calibration curve shows that the survival predicted by the nomogram is in good agreement with the actual observation results (Figure 6C).Through the median risk score, OC patients’ risk scores increased from left to right, risk scores increased, deaths increased, and patient outcomes worsened, and heat maps showed that the expression of model genes was higher in the low-risk score than in the high-risk group, suggesting that elevated expression of model genes predicted better outcomes for patients (Figure 6D). By prognostic analysis, it was found that the prognosis of patients in the low-risk group was significantly better than that in the high-risk group (Figure 6F). The sensitivity and specificity of the prognostic model were evaluated by ROC curve, which also proved that the model had good predictive ability, predicting the AUC of 5-year, 8-year and 10-year OS in OC patients was 0.0.6, 0.68 and 0.66, respectively (Figure 6H). Using the GEO30161 database as a validation set, similar prediction results were obtained (Figure 6E, G and I).
Figure 5.
Developing a Risk Scoring Model Based on DEGs. (A and B) Survival related genes were identified through Lasso regression analysis. The correlation between risk score and PAN cluster and gene cluster. The correlation between risk score and PAN cluster (C) and gene cluster (D). ****p<0.0001. (E) The Sankey plot shows the distribution of PAN cluster, gene-cluster, risk score group, and survival outcomes. (F) PRGs expression in different risk scoring groups.
Figure 6.
Analyzing the prognosis and clinical value of risk models. (A) Multivariate Cox regression analysis of OC patients. (B) A nomogram was established to predict the prognosis of OC patients. (C) Assessing the predictive accuracy of nomograms with calibration charts. (D and E) Distribution of risk score among patients, survival status of each patient, and expression heatmaps of four genes. (F and G) Prognostic differences between two risk groups. (H and I) The ROC curve shows the predictive efficiency of the risk model.
Evaluate Tumor Microenvironment in Two Risk Subgroups and Prediction of Response to Immunotherapy
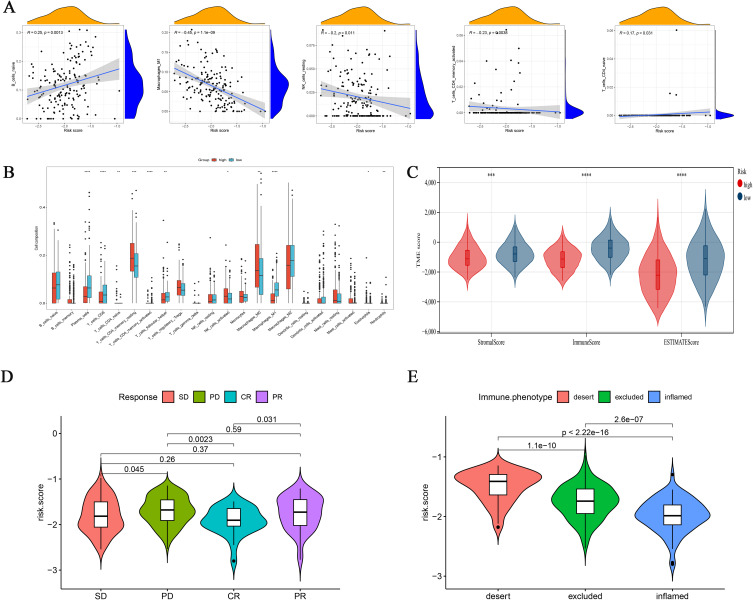
The difference of TME between high-risk group and low-risk group was found by immunoinfiltration analysis (Figure 7A). We also discussed the relationship between the risk group and the infiltration of immune cells, and found that the high-risk group and the low-risk group had significantly different immune infiltrating cells, and the low-risk group had higher infiltration levels of Tfh, CD8+ T cells and M1-macrophages (Figure 7B). We also found that the Stromal score, Immune score and Estimate score were significantly different between different subgroups. The high-risk group scored lower than the low-risk group (Figure 7C). Currently, immunotherapy has provided significant insights into the clinical treatment of cancer. PD-L1 and PD-1 blockade-based therapies have become a major focus of research in tumor immunotherapy. In our previous findings, we observed a correlation between risk models and the tumor immune microenvironment. Thus, through the analysis of immunotherapy cohorts, we investigated whether risk models could predict the response of ovarian cancer patients to immune checkpoint blockade therapy. Our results revealed that the low-risk group exhibited better therapeutic outcomes in the anti-PD-L1 cohort, with patients achieving complete remission (CR) showing lower risk scores compared to those with stable disease (SD), progressive disease (PD), or partial response (PR) (Figure 7D). Additionally, we analyzed the risk scores of three immune subtypes in the IMvigor210 cohort and found that the “immune-inflamed” subtype had the low-risk group, whereas the “immune-desert” subtype had the high-risk group (Figure 7E).
Figure 7.
Integrated assessment of the immune cell landscape of risk models. (A) Association between risk score and immune cell type. (B) Immune cell infiltration between different risk model groups. (C) Immuno-score, Stromal-score, and ESTIMATE-score between different risk models. *p < 0.05; **p < 0.01; ***p < 0.001; ****p<0.0001. (D) In the IMvigor210 cohort, there were variations in risk scores across different clinical responses to anti-PD-L1 treatment. (E) Differences in risk scores for various immunophenotypes in the IMvigor210 cohort.
Mutation Analysis of Risk Model and Its Predictive Effect on Chemotherapy Drug Sensitivity
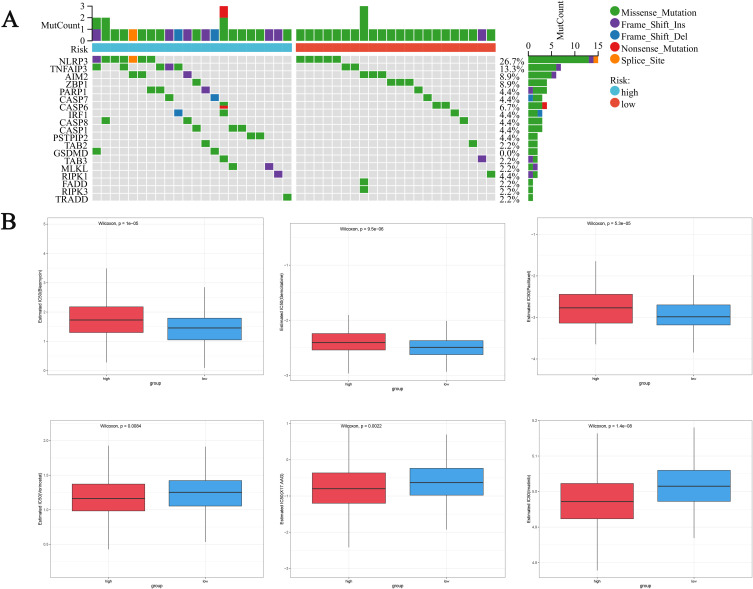
We used the maftools R package to investigate the differences in gene mutations between the two risk subgroups of OC, and the results showed that NLRP3, TNFAIP3 and AIM2 had the most mutations in the two risk subgroups, mostly MIssense Mutation (Figure 8A). To demonstrate the value of risk scores in predicting chemotherapy response, we compared the differences in sensitivity to commonly used chemotherapy agents for ovarian cancer between the two groups. To demonstrate the value of risk scores in predicting chemotherapy response (Figure 8B), we compared the differences in sensitivity to chemotherapy agents for ovarian cancer between the two groups. We found that the IC50 values of Bleomycin, Gemcitabine, and Paclitaxel in the high-risk group were significantly higher than those in the low-risk group, indicating that patients in the low-risk group were more sensitive to these drugs, while patients in the high-risk group were more sensitive to Vorinostat, X17.AAG, and Imatinib. In summary, our low-risk group is more sensitive to common chemotherapy drugs for ovarian cancer, which provides a theoretical basis for our model to guide personalized medication for patients.
Figure 8.
Evaluation of mutations and chemotherapy drug sensitivity in high-risk and low-risk groups. (A) Waterfall plot of gene mutations between high and low-risk groups. (B) Differences in drug sensitivity between high-risk and low-risk groups.
CXCL13 is a Diagnostic and Predictive Biomarker for OC
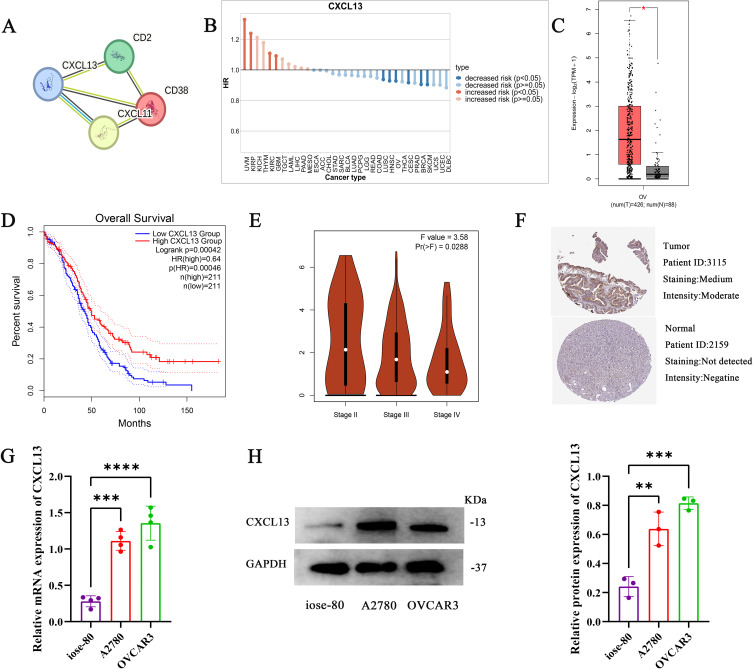
Through the protein interaction analysis of STRING website, CXCL13 was found to be the key gene (Figure 9A). In addition, we found that CXCL13 is a protective gene in most tumors, including ovarian cancer (Figure 9B). We used the GEPIA database to determine the expression and prognostic significance of model genes in patients, and the results showed that compared with NT, the expression of model genes in OC was significantly increased (Figure 9C), and patients with high expression had significantly better prognosis (Figure 9D).In addition, the expression of CXCL13 was lower with the later stage of the tumor (Figure 9E).The HPA database also showed that CXCL13 protein levels were higher in tumor tissue (Figure 9F).We used RT-qPCR and Western blot to verify the expression of CXCL13 in ovarian cancer cells (A2780,OVCAR3), and found that the mRNA (Figure 9G) and protein (Figure 9H and Figure S2) levels of CXCL13 were significantly overexpressed in ovarian cancer cells.
Figure 9.
CXCL13 is a diagnostic and predictive biomarker for OC.(A) STRING database analysis model for gene interactions. (B) The role of CXCL13 in different tumor types. (C) Differences in CXCL13 expression between normal and tumor tissue samples. (D) Prognostic role of CXCL13 in ovarian cancer. (E) Expression of CXCL13 in different stages of ovarian cancer. (F) Expression of CXCL13 protein in normal tissue samples and OC tissue samples. The mRNA (G) and protein (H) expression levels of CXCL13 in normal ovarian cells and ovarian cancer cells were verified by RT-qPCR and Western blot. *p < 0.05; **p < 0.01; ***p < 0.001; ****p<0.0001.
Effect of CXCL13 on Tumor Cell Function and Immune Response
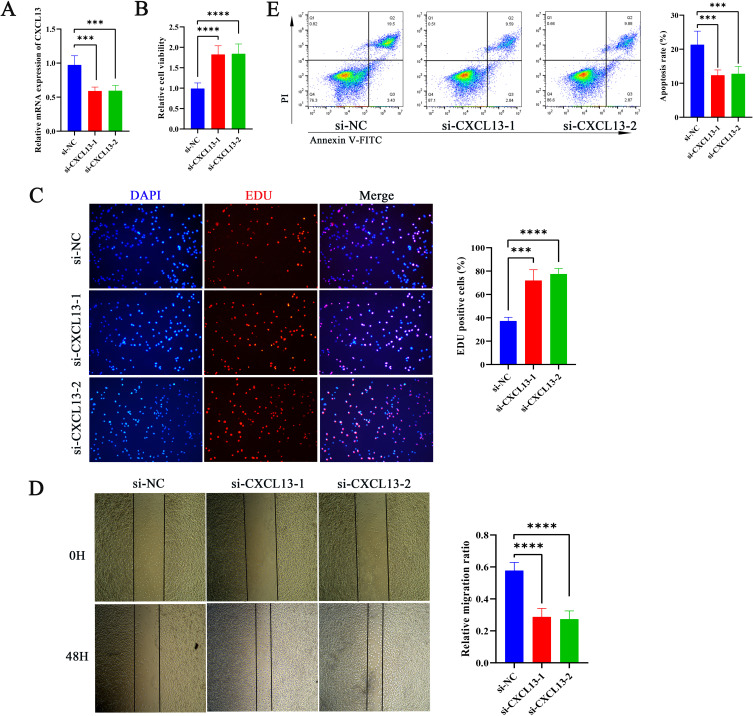
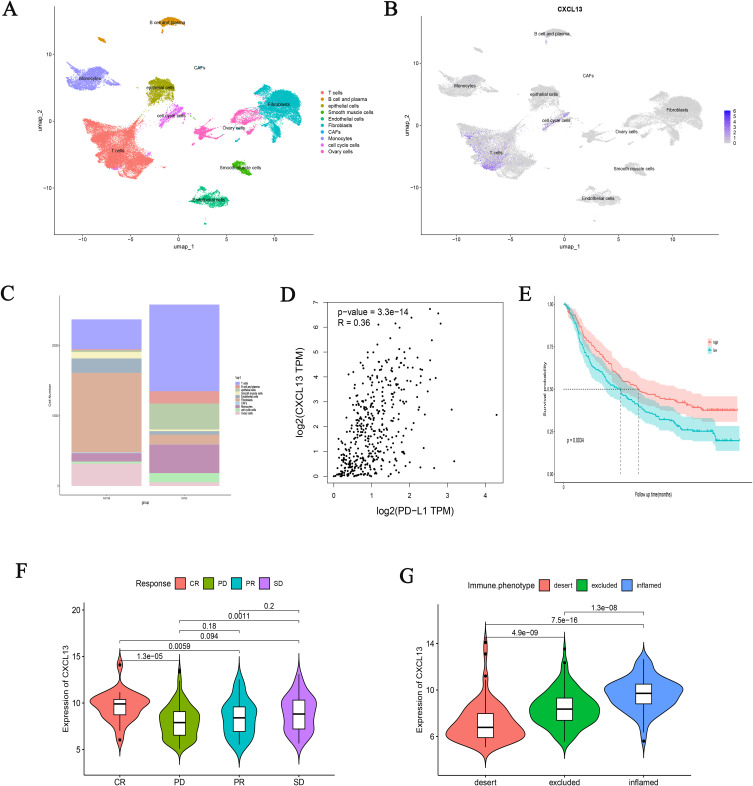
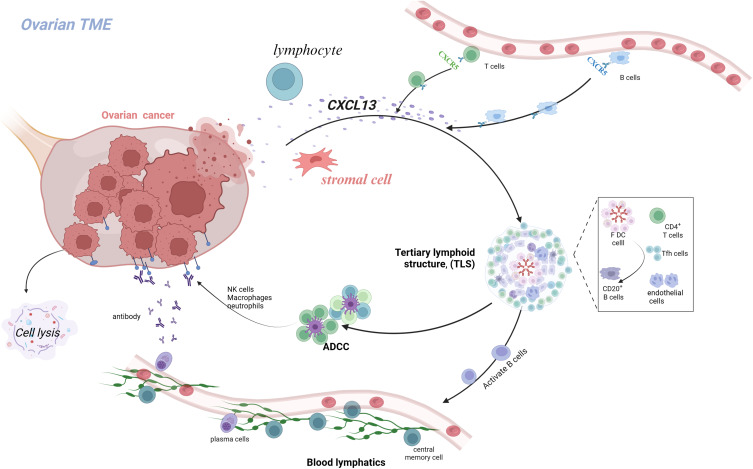
Through the bioinformatics analysis described above, we identified CXCL13 as a key gene in our model, which may play a critical role in the initiation and progression of OC. Therefore, we further investigated the role of CXCL13 in regulating OC cell functions. To this end, we employed siRNA-mediated knockdown of CXCL13 expression in A2780 cells (Figure 10A). Both CCK-8 and EdU assays revealed that inhibition of CXCL13 significantly enhanced cell viability and proliferation (Figure 10B and C). Additionally, wound healing assays demonstrated that suppression of CXCL13 markedly increased the migratory capacity of A2780 cells (Figures 10D). These results suggest that CXCL13 inhibition significantly promotes the proliferation and migration of OC cells. Given the important role of CXCL13 as a chemokine in the immune microenvironment, we further employed T-cell cytotoxicity assays to examine its impact on immune responses. We found that inhibition of CXCL13 effectively attenuated T-cell-induced apoptosis of tumor cells (Figure 10E). At the single-cell level, we detected the expression level of CXCL13 in the OC microenvironment, and found that CXCL13 was mainly expressed in T cells and cell cycle cells (Figure 11A and B). In addition, we found a higher distribution of T cells in tumor tissues (Figure 11C), which may be due to the immune response triggered by specific antigens on the surface of tumor tissues, while CXCL13 is highly expressed in ovarian cancer tissues and cells, and could bring better prognosis. To investigate the response of CXCL13 to immunotherapy, we first analyzed the correlation between CXCL13 and immune checkpoints in OC. The results showed a significant correlation between CXCL13 and PD-L1 (Figure 11D). In the IMvigor210 cohort, we found that individuals with high expression of CXCL13 in the anti-PD-L1 cohort had longer survival times (Figure 11E), higher rates of complete remission (Figure 11F), and stronger immune infiltration (Figure 11G). Therefore, based on the above experimental results, we have consulted literature to preliminarily speculate the prognostic role of CXCL13 in ovarian cancer. CXCL13 can recruit peripheral circulating CXCR5+B cells and CXCR5+CD4+T cell populations into tumor tissues, promote tertiary lymphoid structures (TLS), and stimulate the body’s anti-tumor immune response (Figure 12).
Figure 10.
Effect of CXCL13 on Tumor Cell Function and Immune Response (A) RT-qPCR analysis showed the inhibitory efficiency of CXCL13 in A780 cells. Cell Viability (B) and Proliferation (C) of A2780 After CXCL13 Inhibition Assessed by CCK-8 and EdU Assays.(D) Conduct wound healing tests to evaluate the migration ability of A2780 cells after CXCL13 inhibition.(E) The cell apoptosis in each treatment group. ***p < 0.001; ****p<0.0001.
Figure 11.
The relationship between CXCL13 and the efficacy of immunotherapy. UMAP visualization of the major cell subsets of ovarian cancer (A) and the distribution of CXCL13 in different cells (B) in single-cell analysis of the GSE149614 database. (C) The proportion of different cell populations in ovarian cancer and normal tissue.(D) The relationship between CXCL13 and PD-L1.(E) The survival curve shows the prognostic differences caused by different expressions of CXCL13. Different CXCL13 expression groups lead to different clinical responses (F) and immune infiltration (G) differences in anti-PD-L1 therapy.
Figure 12.
Schematic hypothesis of CXCL13 regulatory mechanism in ovarian cancer.
Discussion
Cell death occurs in two important ways, accidental cell death (ACD) and programmed cell death (PCD).30 ACD is a biological process that happens to lose control. However, PCD needs to comply with regulations and interact with various mechanisms. PCD includes cell apoptosis, necrotic apoptosis, and pyroptosis.31 In contrast, PANoptosis is a complex process that involves the synergistic action of multiple cell death pathways, integrating apoptosis, necroptosis, and pyroptosis.16 It may activate multiple death pathways simultaneously within the same cell, thereby promoting cell death. This process is usually accompanied by membrane rupture, leading to leakage of cellular contents and triggering immune and inflammatory responses, with high immune activation characteristics.32 In the occurrence and development of ovarian cancer, cell escape death is an important strategy for tumor cell survival and proliferation. Cancer cells resist the killing effects of chemotherapy and radiation therapy by evading conventional apoptotic pathways, leading to chemotherapy resistance.33 The activation of PANoptosis provides a pathway for cancer cell death beyond the “escape” mechanism. Due to the characteristic of PANoptosis involving the interaction of multiple cell death pathways, PANoptosis may alter the microenvironment through a mechanism different from traditional cell death, affecting the immune response of tumors and providing new targets for treatment. Besides, the exploration of tumor and the mechanism of PANoptosis is a hot research topic,34,35 but the potential association between OC and PANoptosis remains elusive. Liu et al constructed a risk score model based on PANoptosis-related genes, and ovarian cancer patients classified according to the risk score exhibited significant differences in immune status, response to immunotherapy, and drug sensitivity.15 This underscores the potential value of PANoptosis in ovarian cancer. However, given the important role of molecular subtyping in guiding personalized cancer therapy, the molecular mechanisms of PANoptosis require further investigation to inform personalized anticancer treatments for OC patients.
Our results showed that most PRGs was significantly differentially expressed in OC samples and normal tissue samples, suggesting that PRGs may be involved in the pathogenesis of OC. Research has found that the dysfunctional expression of caspase-8 caused by the −652 6N del variant in the promoter of CASP8 can prevent the occurrence and delay the onset age of OC.36 Research by Chen et al has shown that reducing the expression of TAB3 in ovarian cancer cells significantly inhibits the biological activity of tumor cells, including proliferation and cell cycle distribution, and promotes the chemical sensitivity of tumor cells to cisplatin and paclitaxel treatment by inhibiting the NF-κB pathway.37 These studies further confirm our hypothesis about the important role of PRGs in the development of ovarian cancer. Subsequently, we conducted consensus clustering analysis to explore the molecular subtypes associated with PRGs. The results showed that all OC patients can be divided into two subtypes: PANcluster1 and cluster2. Our results indicate that cluster2 has a significantly better prognosis and richer immune pathways. As is well known, the human immune response includes innate immune response and highly specific adaptive immune response, which interact to resist the invasion of pathogenic microorganisms.38 Host cell specific receptors are extensively enriched in our cluster, such as toll like receptors, RIG-I like receptors, NOD like receptors, etc. Therefore, the better prognosis of cluster 2 may be due to triggering innate immune responses. Using Lasso regression and univariate and multivariate COX analysis, we screened four genes closely related to prognosis and constructed a risk scoring model. Calibration curve, AUC curve and Kaplan Meier survival curve all confirm that our model has high accuracy, stability and good clinical prediction ability. The CD38, CD2, CXCL11, and CXCL13 genes used to construct the model are highly expressed in the low-risk group. In TME, CXCL11 mainly mediates the migration, differentiation, and activation of immune cells. A study armed oncolytic adenovirus (oAds) with the chemokine CXCL11 to increase the infiltration of chimeric antigen receptor T (CAR-T) cells and reprogram immunosuppressive TME, achieving a long-lasting anti-tumor response.39 Higher CD38+immune infiltration and macrophage levels are associated with improved immune therapy response. The study found that a higher proportion of CD38+cells within the tumor is closely related to the improvement of ICB response. Patients with a high proportion of total CD38+cells have a significantly higher overall response rate to ICB than those with a low proportion, indicating that CD38+cells can predict response to ICB.40 CD2 mainly exists on T cells and NK cells, which are now considered to have co stimulatory effects, particularly in overcoming T cell exhaustion and enhancing anti-tumor responses. The importance of the CD2-CD58 axis in overcoming resistance to ICI or chimeric antigen receptor (CAR) T cell therapy provides valuable insights into breaking through current barriers to cancer immunotherapy.41 Using this model, we divided the queue into high-risk and low-risk groups, with the high-risk group mainly coming from PAN cluster 1 and gene cluster A, and the low-risk group mainly coming from PAN cluster 2 and gene cluster B. PRGs are mainly expressed in the low-risk group, while the high-risk group has a poorer prognosis. The immune analysis of this study showed that PANcluster1 has immunosuppressive effects and is associated with higher risk scores, while PANcluster2 has immune activating effects and is associated with lower risk scores. In the low-risk scoring group, the infiltration levels of Tfh, CD8+T cells, and macrophage M1 were higher, indicating that the higher infiltration of Tfh, CD8+T cells, and macrophage M2 plays a crucial role in immune defense. Experiments have shown that Tfh cell dependent tertiary lymphoid structures inhibit tumor growth through IL-21/IL21R signaling.42 CD8 molecule is a leukocyte differentiation antigen. It is a glycoprotein on the surface of some T cells. CD8+T cells expressing CD8 typically differentiate into cytotoxic T cells (CTLs) upon activation, which can specifically kill target cells.43 This is consistent with our analysis. The results indicate that the good prognosis of low-risk OC patients is associated with high levels of cytotoxic immune cell infiltration. Surgery combined with chemotherapy has become the first-line treatment for cancer. All patients with advanced OC received adjuvant drug therapy.44 However, different patients have varying responses to different medications. Therefore, determining the patient’s sensitivity to medication is crucial for designing personalized treatments and improving the efficacy and response of drug therapy. Our research found significant differences in drug sensitivity among different risk groups. In particular, some low-risk groups may exhibit higher sensitivity to traditional chemotherapy drugs such as gemcitabine and paclitaxel, while high-risk groups may be resistant to chemotherapy. This discovery provides important clues for the development of personalized treatment plans. For example, for chemotherapy sensitive subtypes of patients, existing standard chemotherapy regimens can be prioritized, while for chemotherapy resistant subtypes, other treatment options need to be explored. For high-risk patients with chemotherapy resistance, alternative drug combinations may need to be used, or treatment plans may be adjusted through sensitivity assessment of targeted therapy. We further analyzed the correlation between risk models and immune checkpoint inhibitors. Our data suggests that the low-risk group may be associated with higher levels of immune cell infiltration and immune activation, and these subtypes may be more suitable for receiving immunotherapy. On the contrary, high-risk groups may exhibit lower immune reactivity, and therefore may require strategies that combine other immune enhancement therapies or anti-tumor immune responses. For low-risk patients who may be sensitive to immunotherapy, immune checkpoint inhibitors can be considered as a treatment option, especially when traditional chemotherapy is ineffective. In addition, for subtypes with low immune reactivity, combination immunotherapy or other immune modulators (such as IL-2, anti-CTLA-4, etc) may help improve treatment efficacy.45,46 We emphasize that risk scoring models can not only guide the selection of chemotherapy drugs, but also provide important reference for patients’ immunotherapy and targeted therapy.
This study showed that the transcription and protein levels of CXCL13 were significantly elevated in OC. High CXCL13 expression is associated with improved overall survival (OS) and slowed tumor progression in TCGA-OC. In vitro experiments show that reducing CXCL13 expression in ovarian cancer cells diminishes T cell-mediated tumor cell killing, while enhancing tumor cell proliferation and migration. This effect is likely linked to the immune modulatory role of CXCL13, which acts as a chemoattractant for CXCR5+ CD4+ memory T cells in circulation (56). CXCL13 recruits peripheral CXCR5+ B cells and CXCR5+ CD4+ T cells to sites of chronic inflammation, coordinating both humoral and cell-mediated adaptive immune responses. These cells are essential for effective plasma cell differentiation, immunoglobulin secretion, and long-term antigen immunity. Overexpression of CXCL13 in non-lymphoid tissues may promote the formation of tertiary lymphoid structures (TLS), which are key sources of tumor-infiltrating T lymphocytes.47 A high number of tumor-infiltrating T cells is correlated with better responses to neoadjuvant chemotherapy and improved survival rates in cancer patients (53). As such, CXCL13 is considered a central organizer of TLS formation across various tumor tissues (54). Similar findings have been reported in ovarian cancer, where CXCL13 serves as a strong prognostic factor and plays a significant role in TLS formation.48 CD4+ T cells that produce CXCL13 in response to tumor microenvironment factors like TGF-β are crucial for the initial formation of TLS. The presence of TLS recruits various lymphocytes and enhances the infiltration of B cell lineages and CD8+ T cells into ovarian tumors, thereby promoting anti-tumor immunity.49 Both humoral and cellular immune responses in anti-tumor immunity are influenced by TLS, highlighting the potential for TLS-related immune interactions. In vivo experiments indicate that inducing CXCL13 and TLS formation could modulate the tumor microenvironment (TME), representing a promising immunomodulatory strategy to enhance anti-tumor immunity. Therefore, local injection of CXCL13 to induce TLSs at specific sites may offer a potential approach to improve therapeutic outcomes.48 Yang et al confirmed that high CXCL13 expression in OC leads to increased infiltration and activation of CXCR5+ CD8+ T cells. These CXCR5+ CD8+ T cells, referred to as follicular cytotoxic T (Tfc) cells, play a key role in maintaining anti-tumor immunity and responding to PD-1 checkpoint inhibition.50 Both in vitro and in vivo studies further suggest that combining CXCL13 with PD-1 inhibitors can enhance immune activity by recruiting and activating CXCR5+ CD8+ T cells, thereby boosting anti-cancer responses and inhibiting tumor growth.50,51 Thus, the characterization of CXCL13 in the TME is crucial for patient stratification and guiding anti-PD-1 interventions in OC. Our research shows that external data from IMvigor210 confirms the impact of CXCL13 on PD-1 blockade efficacy. Patients with higher CXCL13 expression have improved survival probabilities, and those achieving complete response (CR) or stable disease (SD) tend to exhibit higher CXCL13 expression levels, indicating better responses to immunotherapy. Therefore, CXCL13 is proposed as a potential biomarker for ovarian cancer. Our findings provide a foundation for future immune therapeutic targeting of CXCL13 in OC, particularly in combination with PD-1 checkpoint blockade.
This study may have certain limitations. First, the retrospective analysis of data from public databases rarely includes random prospective samples, which could introduce some degree of bias. Secondly, we primarily relied on ovarian cancer (OC) samples from the TCGA and GEO databases, which may exhibit regional biases due to the sources of the samples. In future research, we plan to incorporate independent ovarian cancer datasets to validate our model and further assess the generalizability and robustness of our findings.
Conclusion
In summary, we utilized prognostic-related genes (PRGs) to identify two subgroups with distinct characteristics in terms of prognosis, mutation landscape, and immune infiltration. A risk model was developed based on the differentially expressed genes (DEGs) of these two subgroups, categorizing ovarian cancer (OC) patients into high-risk and low-risk groups. Patients in the low-risk group demonstrated a significantly better prognosis compared to those in the high-risk group, thereby advancing the development of personalized treatment strategies for OC. Additionally, the expression of immune-related genes and chemokines differed between these subgroups, and experimental validation confirmed the relative expression levels of CXCL13 in both OC tissues and normal ovarian tissues, as well as its functional significance in ovarian cancer. This may provide a deeper understanding of the biological mechanisms underlying OC and offer valuable insights for the development of more targeted therapeutic approaches for ovarian cancer.
Acknowledgments
We thank the TCGA and GEO databases and the authors who uploaded the data.
Funding Statement
This work was funded by the Joint Funds for the Innovation of Science and Technology of Fujian province (2021Y9209 and 2023Y9428), the Fujian Provincial Natural Science Foundation Projects (2024J011107) and National Natural Science Foundation of China (82374081).
Abbreviations
OC, Ovarian Cancer; TCGA, The Cancer Genome Atlas; PRGs, PANoptosis-related genes; PAN_DEGs, PAN-Clusters related differentially expressed genes; PCD, Programmed cell death; NC, Normal Controls; KM, Kaplan Meier; GSVA, Gene Set Variation Analysis; GO, Gene Ontology; KEGG, Kyoto Encyclopedia of Genes and Genomes; LASSO, Least absolute shrinkage and selection operator; ROC, Receiver operating characteristic curves; AUC, Area under the curve; ssGSEA, single sample gene set enrichment analysis.
Data Sharing Statement
The original data were obtained from TCGA and GEO databases, and other data could be obtained by contacting corresponding authors.
Ethics Approval
GEO, TCGA, and HPA are public databases. The patients involved in these databases have obtained ethical approval. Users can freely download the relevant data for research and publish related articles. According to China’s “Ethical Review Measures for Life Science and Medical Research Involving Humans”, our research is based on open-source data, and therefore, there are no ethical issues.
Author Contributions
All authors made a significant contribution to the work reported, whether that is in the conception, study design, execution, acquisition of data, analysis and interpretation, or in all these areas; took part in drafting, revising or critically reviewing the article; gave final approval of the version to be published; have agreed on the journal to which the article has been submitted; and agree to be accountable for all aspects of the work.
Disclosure
The authors declare that they have no competing interests.
References
- 1.Kuroki L, Guntupalli SR. Treatment of epithelial ovarian cancer. BMJ. 2020;371(m3773). doi: 10.1136/bmj.m3773 [DOI] [PubMed] [Google Scholar]
- 2.Zheng J, Jiang S, Lin X, et al. Comprehensive analyses of mitophagy-related genes and mitophagy-related lncRNAs for patients with ovarian cancer. BMC Women's Health. 2024;24(1):37. doi: 10.1186/s12905-023-02864-5 [DOI] [PMC free article] [PubMed] [Google Scholar]
- 3.Plett H, Ricciardi E, Harter P, et al. Dataset on patients with recurrent borderline ovarian tumors and table with review of literature on fertility and oncologic outcomes of patients with borderline ovarian tumors. Data Brief. 2020;30:105653. doi: 10.1016/j.dib.2020.105653 [DOI] [PMC free article] [PubMed] [Google Scholar]
- 4.Kopeina GS, Zhivotovsky B. Programmed cell death: past, present and future. Biochem Biophys Res Commun. 2022;633:55–58. doi: 10.1016/j.bbrc.2022.09.022 [DOI] [PubMed] [Google Scholar]
- 5.Kesavardhana S, Malireddi RKS, Kanneganti TD. Caspases in cell death, inflammation, and pyroptosis. Annu Rev Immunol. 2020;38(567–95):567–595. doi: 10.1146/annurev-immunol-073119-095439 [DOI] [PMC free article] [PubMed] [Google Scholar]
- 6.Pandian N, Kanneganti TD. PANoptosis: a unique innate immune inflammatory cell death modality. J Immunol. 2022;209(9):1625–1633. doi: 10.4049/jimmunol.2200508 [DOI] [PMC free article] [PubMed] [Google Scholar]
- 7.Zhu P, Ke ZR, Chen JX, et al. Advances in mechanism and regulation of PANoptosis: prospects in disease treatment. Front Immunol. 2023;14(1120034). doi: 10.3389/fimmu.2023.1120034 [DOI] [PMC free article] [PubMed] [Google Scholar]
- 8.Sauler M, Bazan IS, Lee PJ. Cell death in the lung: the apoptosis-necroptosis axis. Annu Rev Physiol. 2019;81(375–402):375–402. doi: 10.1146/annurev-physiol-020518-114320 [DOI] [PMC free article] [PubMed] [Google Scholar]
- 9.Bertheloot D, Latz E, Franklin BS. Necroptosis, pyroptosis and apoptosis: an intricate game of cell death. Cell Mol Immunol. 2021;18(5):1106–1121. doi: 10.1038/s41423-020-00630-3 [DOI] [PMC free article] [PubMed] [Google Scholar]
- 10.Zhu P, Pei Y, Yu J, et al. High-throughput sequencing approach for the identification of lncRNA biomarkers in hepatocellular carcinoma and revealing the effect of ZFAS1/miR-150-5p on hepatocellular carcinoma progression. PeerJ. 2023;11:e14891. doi: 10.7717/peerj.14891 [DOI] [PMC free article] [PubMed] [Google Scholar]
- 11.Wang X, Sun R, Chan S, et al. PANoptosis-based molecular clustering and prognostic signature predicts patient survival and immune landscape in colon cancer. Front Genet. 2022;13:955355. doi: 10.3389/fgene.2022.955355 [DOI] [PMC free article] [PubMed] [Google Scholar]
- 12.Malireddi RKS, Tweedell RE, Kanneganti TD. PANoptosis components, regulation, and implications. Aging. 2020;12(12):11163–11164. doi: 10.18632/aging.103528 [DOI] [PMC free article] [PubMed] [Google Scholar]
- 13.Xu J, Chen J, Wang D, et al. Nafamostat mesylate sensitizes ovarian cancer cells to carboplatin by promoting the ZNF24-mediated inhibition of WNT2B. J Toxicol Sci. 2024;49(11):467–479. doi: 10.2131/jts.49.467 [DOI] [PubMed] [Google Scholar]
- 14.Zhang CC, Li CG, Wang YF, et al. Chemotherapeutic paclitaxel and cisplatin differentially induce pyroptosis in A549 lung cancer cells via caspase-3/GSDME activation. Apoptosis. 2019;24(3–4):312–325. doi: 10.1007/s10495-019-01515-1 [DOI] [PubMed] [Google Scholar]
- 15.Liu Y, Lyu G. Construction of a PANoptosis-related prognostic signature for predicting prognosis, tumor microenvironment, and immune response in ovarian cancer. Curr Med Chem. 2024. doi: 10.2174/0109298673314864240829064622 [DOI] [PubMed] [Google Scholar]
- 16.Malireddi RKS, Kesavardhana S, Kanneganti TD. ZBP1 and TAK1: master regulators of NLRP3 Inflammasome/pyroptosis, apoptosis, and necroptosis (PAN-optosis). Front Cell Infect Microbiol. 2019;9:406. doi: 10.3389/fcimb.2019.00406 [DOI] [PMC free article] [PubMed] [Google Scholar]
- 17.Cai X, Lin J, Liu L, et al. A novel TCGA-validated programmed cell-death-related signature of ovarian cancer. BMC Cancer. 2024;24(1):515. doi: 10.1186/s12885-024-12245-2 [DOI] [PMC free article] [PubMed] [Google Scholar]
- 18.Mariathasan S, Turley SJ, Nickles D, et al. TGFβ attenuates tumour response to PD-L1 blockade by contributing to exclusion of T cells. Nature. 2018;554(7693):544–548. doi: 10.1038/nature25501 [DOI] [PMC free article] [PubMed] [Google Scholar]
- 19.Wilkerson MD, Hayes DN. ConsensusClusterPlus: a class discovery tool with confidence assessments and item tracking. Bioinformatics. 2010;26(12):1572–1573. doi: 10.1093/bioinformatics/btq170 [DOI] [PMC free article] [PubMed] [Google Scholar]
- 20.Hänzelmann S, Castelo R, Guinney J. GSVA: gene set variation analysis for microarray and RNA-seq data. BMC Bioinf 2013;14(7). doi: 10.1186/1471-2105-14-7 [DOI] [PMC free article] [PubMed] [Google Scholar]
- 21.Yu G, Wang LG, Han Y, et al. clusterProfiler: an R package for comparing biological themes among gene clusters. Omics. 2012;16(5):284–287. doi: 10.1089/omi.2011.0118 [DOI] [PMC free article] [PubMed] [Google Scholar]
- 22.Sotiriou C, Wirapati P, Loi S, et al. Gene expression profiling in breast cancer: understanding the molecular basis of histologic grade to improve prognosis. J Natl Cancer Inst. 2006;98(4):262–272. doi: 10.1093/jnci/djj052 [DOI] [PubMed] [Google Scholar]
- 23.Park SH, Goo JM, Jo CH. Receiver operating characteristic (ROC) curve: practical review for radiologists. Korean J Radiol. 2004;5(1):11–18. doi: 10.3348/kjr.2004.5.1.11 [DOI] [PMC free article] [PubMed] [Google Scholar]
- 24.Mayakonda A, Lin DC, Assenov Y, et al. Maftools: efficient and comprehensive analysis of somatic variants in cancer. Genome Res. 2018;28(11):1747–1756. doi: 10.1101/gr.239244.118 [DOI] [PMC free article] [PubMed] [Google Scholar]
- 25.Geeleher P, Cox N, Huang RS. pRRophetic: an R package for prediction of clinical chemotherapeutic response from tumor gene expression levels. PLoS One. 2014;9(9):e107468. doi: 10.1371/journal.pone.0107468 [DOI] [PMC free article] [PubMed] [Google Scholar]
- 26.Tang Z, Li C, Kang B, et al. GEPIA: a web server for cancer and normal gene expression profiling and interactive analyses. Nucleic Acids Res. 2017;45(W1):W98–w102. doi: 10.1093/nar/gkx247 [DOI] [PMC free article] [PubMed] [Google Scholar]
- 27.Liu GH, Tan XY, Xu ZY, et al. REEP3 is a potential diagnostic and prognostic biomarker correlated with immune infiltration in pancreatic cancer. Sci Rep. 2024;14(1):13834. doi: 10.1038/s41598-024-64720-2 [DOI] [PMC free article] [PubMed] [Google Scholar]
- 28.Sun D, Wang J, Han Y, et al. TISCH: a comprehensive web resource enabling interactive single-cell transcriptome visualization of tumor microenvironment. Nucleic Acids Res. 2021;49(D1):D1420–d30. doi: 10.1093/nar/gkaa1020 [DOI] [PMC free article] [PubMed] [Google Scholar]
- 29.Lim SO, Li CW, Xia W, et al. Deubiquitination and Stabilization of PD-L1 by CSN5. Cancer Cell. 2016;30(6):925–939. doi: 10.1016/j.ccell.2016.10.010 [DOI] [PMC free article] [PubMed] [Google Scholar]
- 30.Peng F, Liao M, Qin R, et al. Regulated cell death (RCD) in cancer: key pathways and targeted therapies. Signal Transduct Target Ther. 2022;7(1):286. doi: 10.1038/s41392-022-01110-y [DOI] [PMC free article] [PubMed] [Google Scholar]
- 31.Zheng M, Kanneganti TD. The regulation of the ZBP1-NLRP3 inflammasome and its implications in pyroptosis, apoptosis, and necroptosis (PANoptosis). Immunol Rev. 2020;297(1):26–38. doi: 10.1111/imr.12909 [DOI] [PMC free article] [PubMed] [Google Scholar]
- 32.Christgen S, Tweedell RE, Kanneganti TD. Programming inflammatory cell death for therapy. Pharmacol Ther. 2022;232:108010. doi: 10.1016/j.pharmthera.2021.108010 [DOI] [PMC free article] [PubMed] [Google Scholar]
- 33.Tian W, Lei N, Zhou J, et al. Extracellular vesicles in ovarian cancer chemoresistance, metastasis, and immune evasion. Cell Death Dis. 2022;13(1):64. doi: 10.1038/s41419-022-04510-8 [DOI] [PMC free article] [PubMed] [Google Scholar]
- 34.Gao W, Wang X, Zhou Y, et al. Autophagy, ferroptosis, pyroptosis, and necroptosis in tumor immunotherapy. Signal Transduct Target Ther. 2022;7(1):196. doi: 10.1038/s41392-022-01046-3 [DOI] [PMC free article] [PubMed] [Google Scholar]
- 35.Tang R, Xu J, Zhang B, et al. Ferroptosis, necroptosis, and pyroptosis in anticancer immunity. J Hematol Oncol. 2020;13(1):110. doi: 10.1186/s13045-020-00946-7 [DOI] [PMC free article] [PubMed] [Google Scholar]
- 36.Ma X, Zhang J, Liu S, et al. Polymorphisms in the CASP8 gene and the risk of epithelial ovarian cancer. Gynecol Oncol. 2011;122(3):554–559. doi: 10.1016/j.ygyno.2011.05.031 [DOI] [PubMed] [Google Scholar]
- 37.Chen Y, Wang X, Duan C, et al. Loss of TAB3 expression by shRNA exhibits suppressive bioactivity and increased chemical sensitivity of ovarian cancer cell lines via the NF-κB pathway. Cell Prolif. 2016;49(6):657–668. doi: 10.1111/cpr.12293 [DOI] [PMC free article] [PubMed] [Google Scholar]
- 38.Hu MM, Shu HB. Mitochondrial DNA-triggered innate immune response: mechanisms and diseases. Cell Mol Immunol. 2023;20(12):1403–1412. doi: 10.1038/s41423-023-01086-x [DOI] [PMC free article] [PubMed] [Google Scholar]
- 39.Wang G, Zhang Z, Zhong K, et al. CXCL11-armed oncolytic adenoviruses enhance CAR-T cell therapeutic efficacy and reprogram tumor microenvironment in glioblastoma. Mol Ther. 2023;31(1):134–153. doi: 10.1016/j.ymthe.2022.08.021 [DOI] [PMC free article] [PubMed] [Google Scholar]
- 40.HHM N, Lee RY, Goh S, et al. Immunohistochemical scoring of CD38 in the tumor microenvironment predicts responsiveness to anti-PD-1/PD-L1 immunotherapy in hepatocellular carcinoma. J Immunother Cancer. 2020;8(2). doi: 10.1136/jitc-2020-000987 [DOI] [PMC free article] [PubMed] [Google Scholar]
- 41.Jo Y, Sim HI, Yun B, et al. Revisiting T-cell adhesion molecules as potential targets for cancer immunotherapy: CD226 and CD2. Exp Mol Med. 2024;56(10):2113–2126. doi: 10.1038/s12276-024-01317-9 [DOI] [PMC free article] [PubMed] [Google Scholar]
- 42.Calderaro J, Petitprez F, Becht E, et al. Intra-tumoral tertiary lymphoid structures are associated with a low risk of early recurrence of hepatocellular carcinoma. J Hepatol. 2019;70(1):58–65. doi: 10.1016/j.jhep.2018.09.003 [DOI] [PubMed] [Google Scholar]
- 43.St Paul M, Ohashi PS. The roles of CD8(+) T cell subsets in antitumor immunity. Trends Cell Biol. 2020;30(9):695–704. doi: 10.1016/j.tcb.2020.06.003 [DOI] [PubMed] [Google Scholar]
- 44.Richardson DL, Eskander RN, O’Malley DM. Advances in ovarian cancer care and unmet treatment needs for patients with platinum resistance: a narrative review. JAMA Oncol. 2023;9(6):851–859. doi: 10.1001/jamaoncol.2023.0197 [DOI] [PubMed] [Google Scholar]
- 45.Campbell KM, Amouzgar M, Pfeiffer SM, et al. Prior anti-CTLA-4 therapy impacts molecular characteristics associated with anti-PD-1 response in advanced melanoma. Cancer Cell. 2023;41(4):791–806.e4. doi: 10.1016/j.ccell.2023.03.010 [DOI] [PMC free article] [PubMed] [Google Scholar]
- 46.Hernandez R, Põder J, LaPorte KM, et al. Engineering IL-2 for immunotherapy of autoimmunity and cancer. Nat Rev Immunol. 2022;22(10):614–628. doi: 10.1038/s41577-022-00680-w [DOI] [PubMed] [Google Scholar]
- 47.Ng KW, Boumelha J, Enfield KSS, et al. Antibodies against endogenous retroviruses promote lung cancer immunotherapy. Nature. 2023;616(7957):563–573. doi: 10.1038/s41586-023-05771-9 [DOI] [PMC free article] [PubMed] [Google Scholar]
- 48.Ukita M, Hamanishi J, Yoshitomi H, et al. CXCL13-producing CD4+ T cells accumulate in the early phase of tertiary lymphoid structures in ovarian cancer. JCI Insight. 2022;7(12). doi: 10.1172/jci.insight.157215 [DOI] [PMC free article] [PubMed] [Google Scholar]
- 49.Dai S, Zeng H, Liu Z, et al. Intratumoral CXCL13 + CD8 + T cell infiltration determines poor clinical outcomes and immunoevasive contexture in patients with clear cell renal cell carcinoma. J Immunother Cancer. 2021;9(2):e001823. doi: 10.1136/jitc-2020-001823 [DOI] [PMC free article] [PubMed] [Google Scholar]
- 50.Yang M, Lu J, Zhang G, et al. CXCL13 shapes immunoactive tumor microenvironment and enhances the efficacy of PD-1 checkpoint blockade in high-grade serous ovarian cancer. J Immunother Cancer. 2021;9(1):e001136. doi: 10.1136/jitc-2020-001136 [DOI] [PMC free article] [PubMed] [Google Scholar]
- 51.He R, Hou S, Liu C, et al. Follicular CXCR5- expressing CD8(+) T cells curtail chronic viral infection. Nature. 2016;537(7620):412–428. doi: 10.1038/nature19317 [DOI] [PubMed] [Google Scholar]
Associated Data
This section collects any data citations, data availability statements, or supplementary materials included in this article.
Data Availability Statement
The original data were obtained from TCGA and GEO databases, and other data could be obtained by contacting corresponding authors.


