



Abstract
Diet, a modifiable risk factor, plays a pivotal role in most diseases, from cardiovascular disease to type 2 diabetes mellitus, cancer, and obesity. However, our understanding of the mechanistic role of the chemical compounds found in food remains incomplete. In this review, we explore the “dark matter” of nutrition, going beyond the macro- and micronutrients documented by national databases to unveil the exceptional chemical diversity of food composition. We also discuss the need to explore the impact of each compound in the presence of associated chemicals and relevant food sources and describe the tools that will allow us to do so. Finally, we discuss the role of network medicine in understanding the mechanism of action of each food molecule. Overall, we illustrate the important role of network science and artificial intelligence in our ability to reveal nutrition’s multifaceted role in health and disease.
Keywords: network science, machine learning, artificial intelligence, complexity, network medicine, systems pharmacology, nutrition
1. INTRODUCTION
An unhealthy diet has a far-reaching impact on health, surpassing the combined influence of alcohol, tobacco, drug use, and unsafe sexual practices (154). The consequences of poorly balanced diets are particularly evident in African countries where they contribute to the dual burden of undernourishment and obesity (150). Additionally, dietary imbalances are closely tied to the rising prevalence of various noncommunicable diseases (NCDs) worldwide, including coronary heart disease (CHD), stroke, and type 2 diabetes mellitus. In contrast, embracing a healthy diet and lifestyle can significantly mitigate the effects of a strong genetic predisposition to CHD, reducing the relative risk by nearly 50% (70). In other words, diet quality has emerged as a major modifiable risk factor in the development of chronic diseases.
Nutrition science has significantly advanced our understanding of the nutritional components of human diet. This research has resulted in databases such as the United States Department of Agriculture (USDA) FoodData Central, including Foundation Foods and Standard Reference (SR) Legacy (50), and its counterparts in Europe, such as Frida in Denmark (109), that offer detailed nutritional profiles for virtually all foods. Such databases have powered an array of single-nutrient or single-food association studies, becoming the primary methodological approach used to reveal how diet affects human health. This approach has led to multiple important findings, such as the negative impact of trans fats (98, 104, 155) and the beneficial effects of n-3 polyunsaturated fatty acids, legumes, and nuts on cardiovascular disease (CVD) risk (26). At the same time, these studies have highlighted the inherent limitations of the reductionist approach to hypothesis testing, which ignores the complexity of food composition and of dietary patterns. A well-documented example is provided by Kolonel et al. (77), who initially reported a positive association between β-carotene consumption and the risk of prostate cancer, a result later attributed to the consumption of papaya (83) and not to β-carotene-rich ingredients such as carrots (153). This finding supports the first paradigm we address in this review: Dietary compounds cannot be investigated in isolation. Instead, to assess their impact on health, we must consider the presence of other chemical compounds in the diet and their interactions with networks of molecular targets (Section 2).
Single-nutrient studies are the legacy of the twentieth century’s nutrition research, which focused on the discovery, isolation, and synthesis of essential micronutrients, such as vitamins, and their role in deficiency diseases (106). This perspective has resulted in an exceptional focus on approximately 150 nutritional components, tracked in most national databases. However, our diet carries a far richer chemical diversity than these nutritional components indicate. Indeed, our research, combined with several databases focusing on the detailed chemical composition of foods, has documented the presence of more than 139,000 molecules in food ingredients. Many of them, like the numerous polyphenols, play a major and well-documented role in human health. Therefore, there is a real need to document the “dark matter” of nutrition (DMN) (13), leading to the second paradigm explored in this review: Our food not only is a source of calories and vitamins but also carries an exceptionally large number of (bio)chemicals with health implications beyond those that have been investigated to date (Section 3).
Finally, food compounds can bind to human proteins to regulate their activity, a process whose implications on health can be captured only by a densely wired network of (bio)chemicals. This complex chemical interplay reflects the evolutionary processes that have shaped the genome and metabolism of various life forms contributing to the staples of human diet. A network framework is therefore essential to comprehend the molecular mechanisms underlying the influence of diet on our health (60). Indeed, unlike traditional reductionist analyses, network science acknowledges and quantifies the important dependencies among multiple factors (11), contributing to a comprehensive modeling of concepts such as nutrient bioavailability, the food matrix, and disease phenotypes (3, 17, 24, 34, 121, 130). This brings us to the third paradigm we address: Food chemicals display a wide range of mechanisms of action, from modulating regulatory, transcriptional, and epigenetic mechanisms to acting as substrates for metabolic reactions, including those conducted by commensal organisms, that can only be understood using the tools of network medicine (Section 4).
In this review, we explore how network science and artificial intelligence (AI) have contributed to each of the paradigms listed above. In Section 2, we cover advances in hypothesis testing in nutritional epidemiology driven by genomics-inspired methodologies, then explore the improved mathematical tools that capture nutrient variability and the diversity of the food supply. In Section 3, we delve into the concept of the DMN, discussing how food composition databases are shifting their focus beyond standard macro- and micronutrients, as well as the role of contemporary mass spectrometry in identifying detailed chemical food profiles. Finally, in Section 4, we discuss how, by offering tools for drug discovery and repurposing, network medicine can help reveal the diverse biochemical processes through which dietary compounds affect human health.
2. FROM SINGLE-NUTRIENT STUDIES TO ENVIRONMENT-WIDE ASSOCIATIONS
Knowledge of the interplay between diet and health is derived largely from hypothesis-driven epidemiological association studies. These studies explore the impact of one or a few exposures, such as nutrients, specific foods, dietary scores, and metabolic biomarkers. The selection of these exposures is determined by researchers’ interests and hypotheses, often supported by evidence from animal or mechanistic studies. For example, the dietary factors contributing to CHD have been extensively researched within the Nurses’ Health Study (NHS) cohort, a longitudinal prospective study designed to investigate the effects of nutrition on health and disease. The NHS, which began in 1976, recruited female registered nurses aged 30–55 from various parts of the United States. Participants were asked to complete questionnaires every 2 years, and in 1980, a Food Frequency Questionnaire was added to gather information about their dietary habits. Follow-up questionnaires were administered in 1984, 1986, and every 4 years thereafter. Figure 1 illustrates the extensive body of knowledge on the dietary determinants of CVD that has emerged from NHS data (100). For example, CHD has been linked to 120 single-exposure associations, which account for a total of 63 protective factors, 22 risk factors, and 35 exposures that lack statistical significance.
Figure 1.

The knowledge graph connecting dietary factors and CVDs analyzed in NHS data. The graph consists of two sets of nodes: dietary exposures represented by circles, and CVDs represented by diamonds. Protective associations are depicted by green links, harmful associations by red links, and associations that were tested but not found to be statistically significant are shown in gray. In the context of NHS, CHD refers to nonfatal MI and fatal CHD, while CAD refers to nonfatal MI and fatal CAD. CVD is defined as a composite of CAD and nonfatal or fatal stroke. Abbreviations: A, animal; ALA, alpha-linolenic acid; CAD, coronary artery disease; CHD, coronary heart disease; CVD, cardiovascular disease; D, dietary; DASH, dietary approaches to stop hypertension; DHA, docosahexaenoic acid; DPA, docosapentaenoic acid; FA, fatty acids; FGF, fibroblast growth factor; FGI, food group index; GLS, glucosinolate; LCD, low carbohydrate diet; MDDW, minimal diet diversity score for women; MI, myocardial infarction; MUFA, monounsaturated fatty acids; NHS, Nurses’ Health Study; P, plant; PDQS, prime diet quality score; PPI, proton pump inhibitor; PTH, plasma parathyroid hormone; PUFA, polyunsaturated fatty acids; rep, replaced with; S, supplemental; SSB, sugar-sweetened beverage; SFA, saturated fatty acids; sTfR, soluble transferrin receptor; T, total; USFA, unsaturated fatty acids; VLCSFA, very-long-chain saturated fatty acids. Figure and caption adapted from Reference 100 (CC BY 4.0).
While these single-association studies have offered valuable insight into disease risk determinants, they are limited by their reductionist design and, most importantly, by a lack of comprehensive knowledge about the true complexity of the (bio)chemical composition of the food supply. These inherent limitations may have contributed to several discrepancies in the epidemiological literature, which have led to spurious associations that cannot be replicated in clinical trials or by meta-analyses (64, 65).
Environment-wide association studies (EWASs), designed to discover agnostically new environmental factors in disease-related phenotypes, identify the driving signals across a large pool of hypotheses while limiting the appearance of spurious results, offering an alternative to conventional single-nutrient-focused studies. EWASs are inspired by genome-wide association studies (GWASs), where a large set of correlated exposures are studied in relation to a specific phenotype, and the dominant statistical associations are retained through rigorous multiple-testing corrections (115, 116). Taking advantage of these statistical advances, we relied on EWASs focusing on all dietary exposures available in NHS data to identify 37 nutrients and 16 foods significantly associated with the risk of fatal CHD and acute myocardial infarction (100).
The outcome of this EWAS captures the exposures associated with a risk of acute myocardial infarction and fatal CHD as a bipartite network, where each link signifies a specific food’s contribution to the total quantity of a specific nutrient in the food supply (Figure 2). Two distinct clusters emerge, one comprising protective nutrients and foods and the other encompassing harmful nutrients and foods. Yet, notable exceptions challenge the observed cluster segregation. For example, yogurt exhibits a protective effect despite containing multiple individual risk factors, including various adverse fatty acids such as myristic acid, trans-16:1 fatty acid, and palmitic acid. Taken together, the data on yogurt indicate the limitations of single-exposure associations: Higher yogurt consumption tends to align with more balanced dietary habits despite being the carrier of single nutrients flagged as CHD risk factors, the overall associations of which are driven by food groups dominant in Western-like dietary patterns (51).
Figure 2.
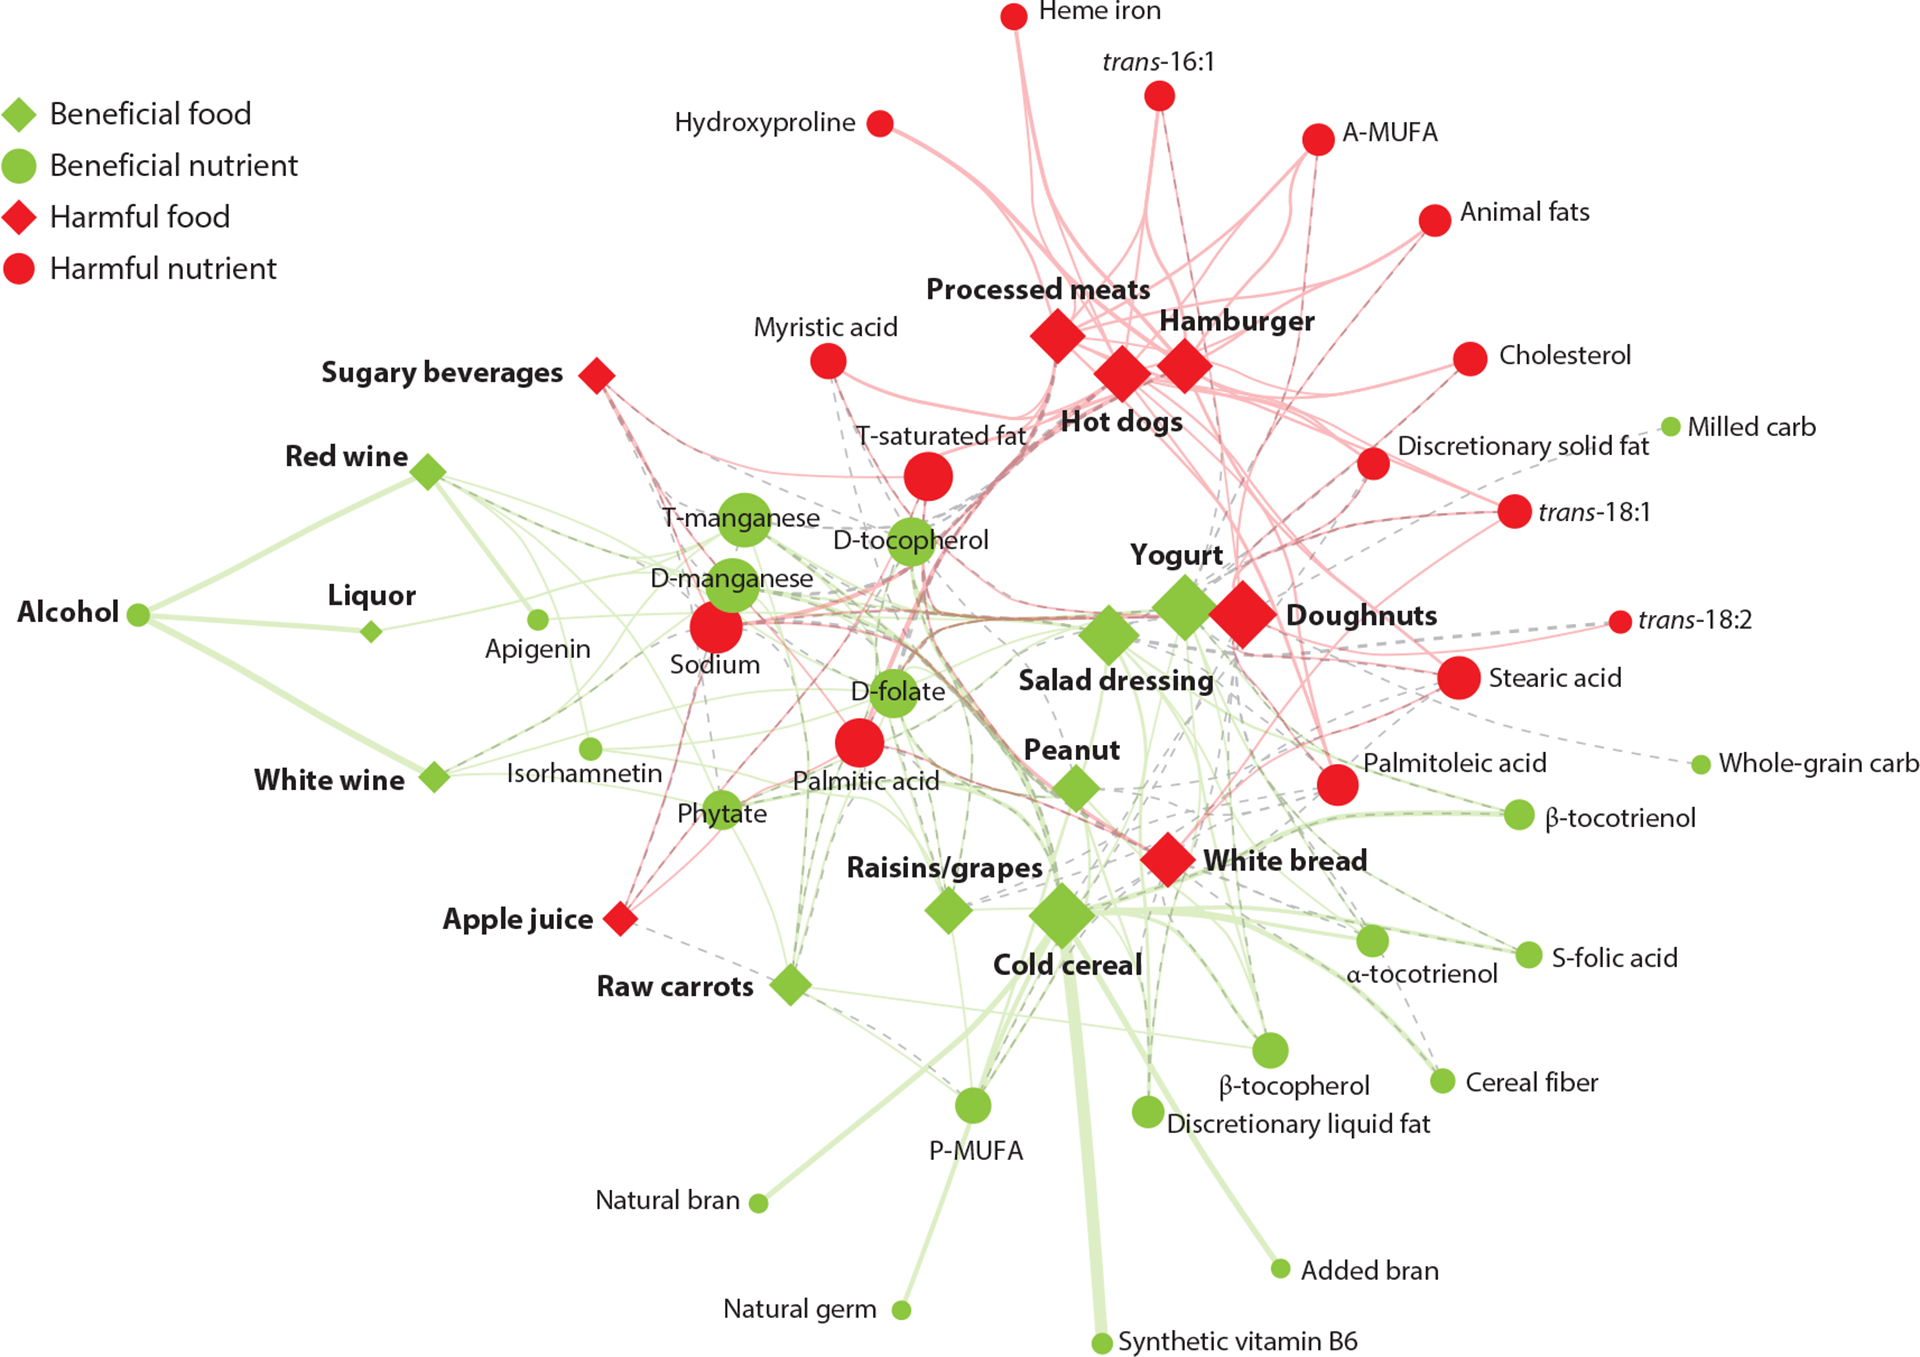
The food–nutrient network of dietary exposures associated with CHD. In this bipartite food–nutrient network, protective factors are colored in green and detrimental factors in red. Different shapes distinguish between nutrients (circles) and foods (diamonds), while the size of each node corresponds to the estimated effect size in absolute value. The edge thickness indicates the contribution of a specific food to the overall quantity of a nutrient in the food supply. Abbreviations: A, animal; CHD, coronary heart disease; D, dietary; MUFA, monounsaturated fatty acids; P, plant; S, supplemental; T, total. Figure and caption adapted from Reference 100 (CC BY 4.0).
2.1. Chemical Concentrations in Food Follow Universal Laws
Both single-nutrient association studies and EWASs need as input an accurate measure of the concentration of specific compounds in a food item, raising an important question: What governs these concentrations? Indeed, a precise description of the food source variability of each nutrient is instrumental in quantifying how nutrient intake varies within the population.
Virtually all ingredients of the human diet were once living organisms, relying on a diverse array of (bio)chemicals for their growth and survival within their respective environments. Therefore, a comprehensive understanding of food composition must be based on the fundamental (bio)chemical principles that govern metabolic networks. We have shown that chemical concentrations in food, expressed in grams per 100 g, span approximately eight orders of magnitude (96). For example, raw onion carries 4 × 10⁻⁷ g/100 g of vitamin K and 89 g/100 g of water, an eight-order-of-magnitude difference within the same ingredient (Figure 3). This exceptionally wide range is rooted in the broad spectrum of physicochemical properties (10) exhibited by the nutrients and the metabolic networks responsible for their modulation (Figure 3a). (Bio)chemical reaction networks (68) adhere to kinetic laws with similar functional forms, regardless of the specific chemical species involved or the organism producing it. As a result, the concentrations of individual components follow common patterns that govern both their expected values and the extent of their fluctuations across the food supply. Indeed, we found that the concentrations of each nutrient follow approximately the same log-normal distribution with a constant logarithmic standard deviation that quantifies their variability across the food supply at various average concentrations. Figure 4a illustrates this phenomenon, showing the distribution of the concentrations of four nutrients—thiamine, zinc, gadoleic acid, and total protein—across the food supply.
Figure 3.

Nutrient composition of food. According to the Food and Nutrient Database for Dietary Studies, the consumption of 100 g of raw onion delivers 45 nutritional components, whose amounts (measured in grams) span eight orders of magnitude. Among these 45 nutrients are compounds from different chemical classes, such as copper (a mineral), linoleic acid (a polyunsaturated omega-6 fatty acid, the most typical isomer of fatty acid 18:2), and quercetin (a flavonol). We rank the nutrients in onion in descending order of concentration on the ordinate axis. The gram amount of nutrient n per 100 g is reported as xn.
Figure 4.
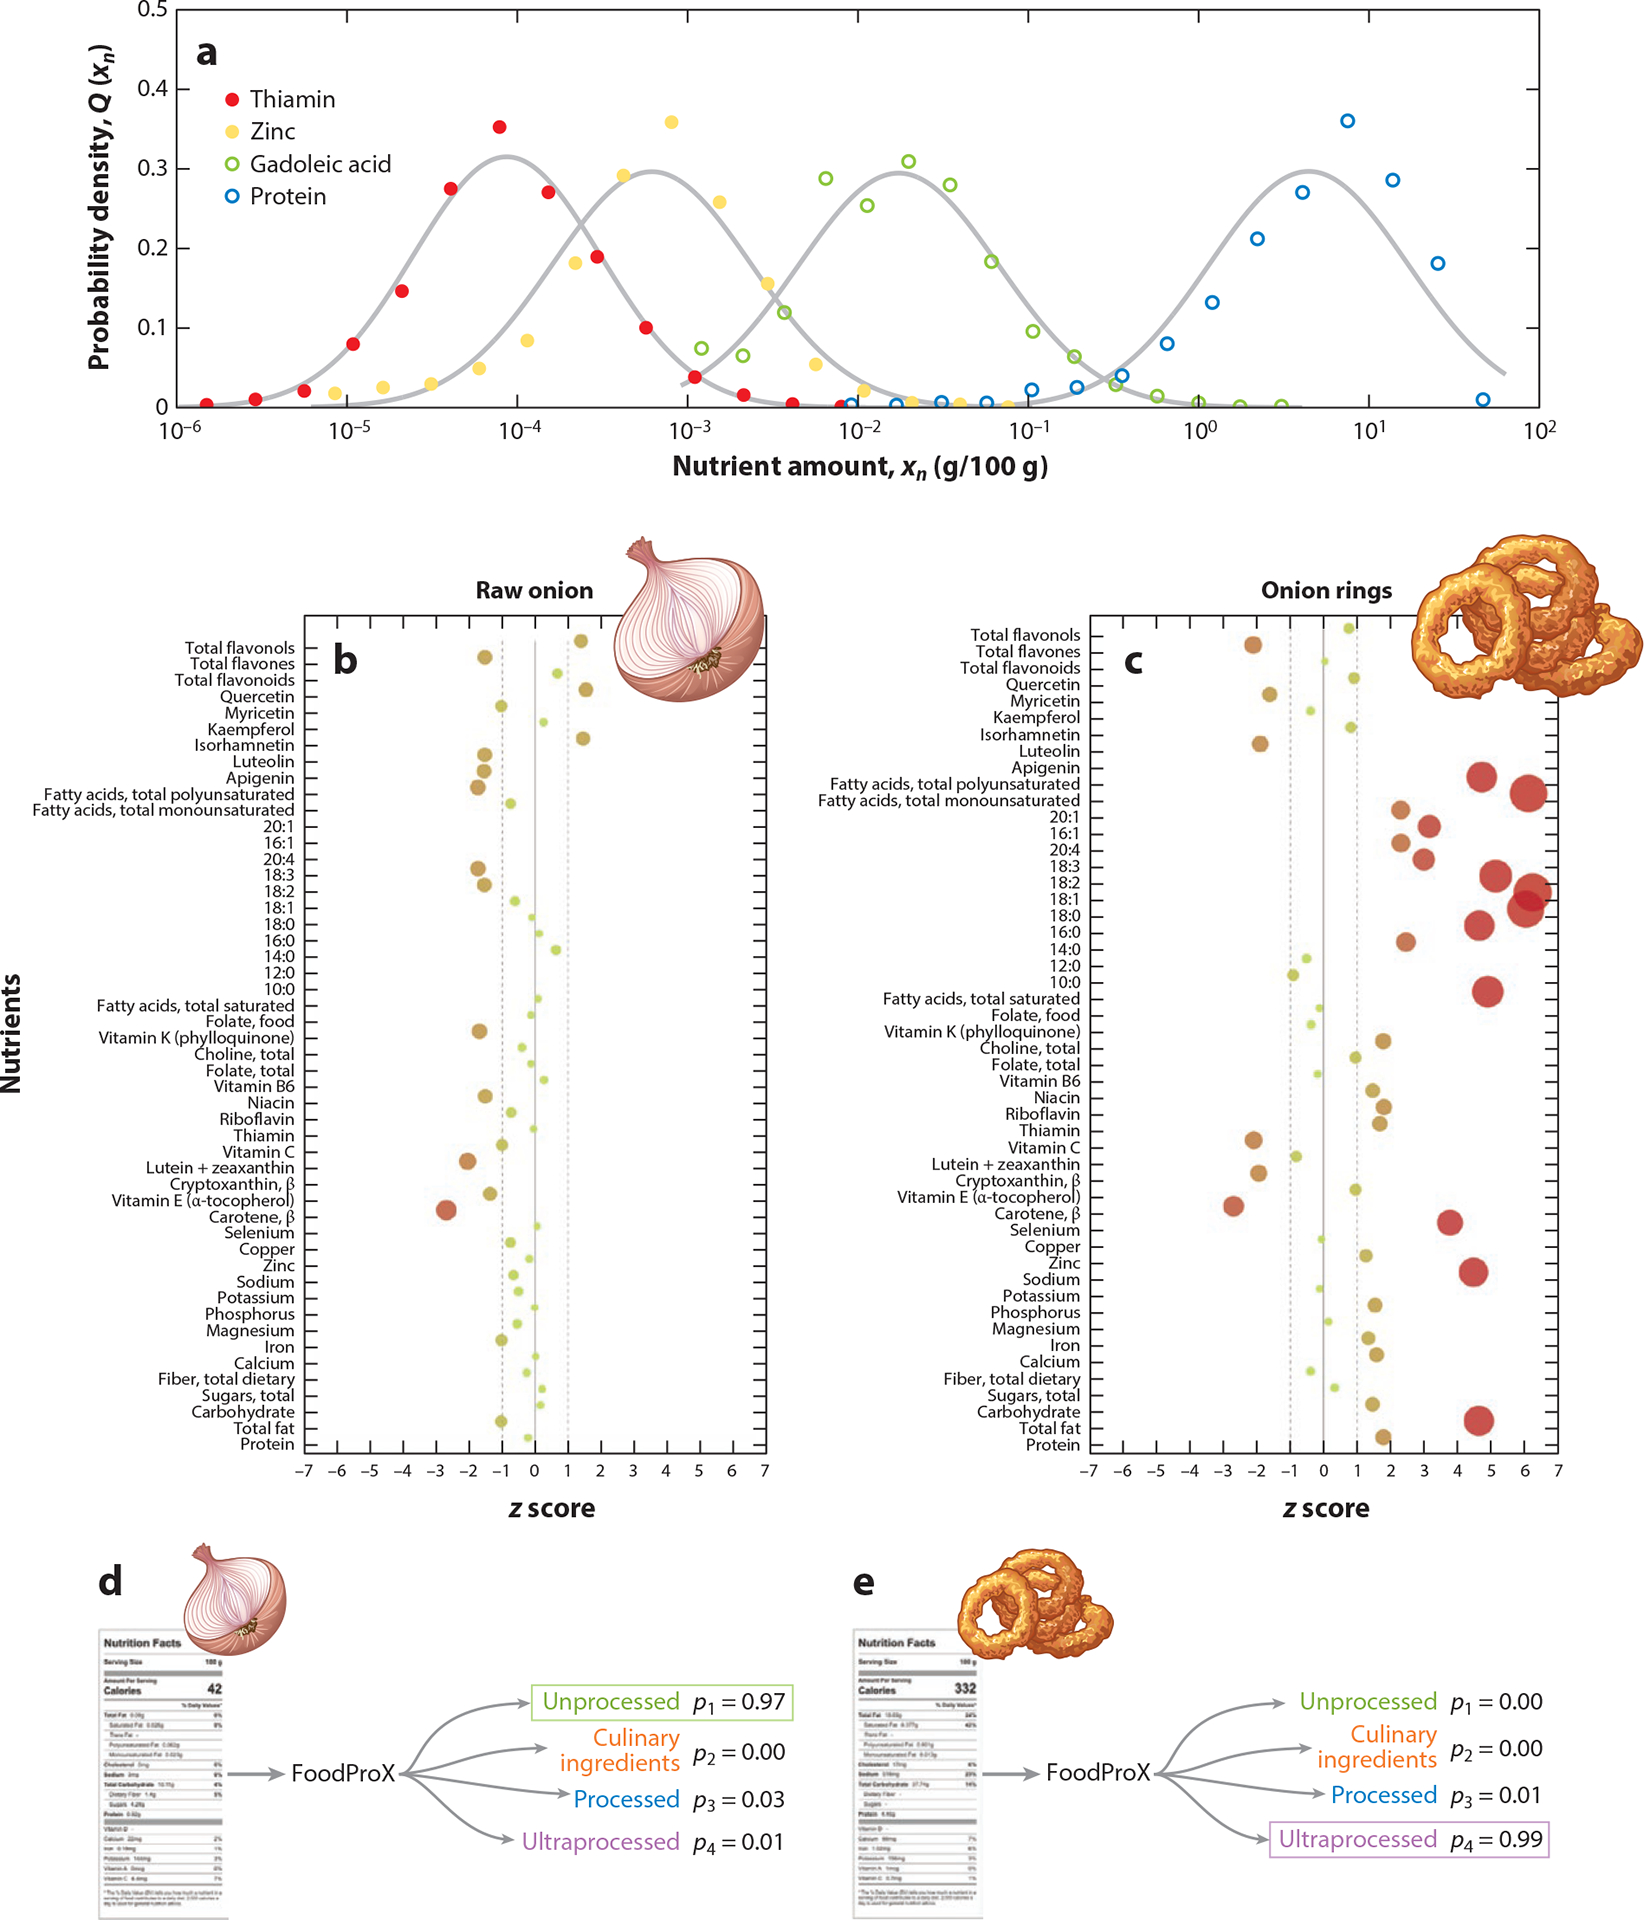
Large-scale analysis of nutrient concentrations in food. (a) The concentration probability distribution Q(𝑥𝑛) for four nutrients across the 4,889 foods reported in NHANES 2009–2010 data, shown on a logarithmic horizontal axis. The four distributions are approximately symmetric on a log scale and have similar width and shape that are independent of the average concentration of the respective nutrient. Each symbol represents a histogram bin. (b,c) The observed common scale of nutrient fluctuations observed in the log space allows us to rescale all nutrients and compare them on a single plot, suggesting a methodology to detect foods with outlier concentrations. The pattern of nutrient outliers in different foods (quantified by a z score in the log space) is informative of the type and extent of processing, as shown here for (b) 100 g of raw onion compared with (c) 100 g of onion rings. (d,e) FoodProX is a random forest classifier that was trained over the nutrient concentrations within 100 g of each food, tasking the classifier to predict its processing level according to NOVA. FoodProX represents each food by a vector of probabilities {pi}, capturing the likelihood of the food being classified as an unprocessed food (NOVA 1), a processed culinary ingredient (NOVA 2), a processed food (NOVA 3), or an ultraprocessed food (NOVA 4). The final classification label, highlighted with a box on the right, is determined by the highest probability. The probability values were rounded to two decimal places. Abbreviation: NHANES, National Health and Nutrition Examination Survey. Panel a adapted from Reference 96. Panels d and e adapted from Reference 97 (CC BY 4.0).
The universality of nutrient variability supports the hypothesis that nutrient distributions across the food supply are the result of (bio)chemical reaction networks characterized by similar dynamic and kinetic patterns. The concept of universality, based on statistical physics (83), captures the idea that similar measurable macroscopic features can arise from interactions between diverse individual components and that these features cannot be reduced to the properties of the individual elements (11). Indeed, the variability in nutrient concentrations in all national databases, such as those curated by the USDA, is well approximated by a log-normal distribution with a constant logarithmic standard deviation. The mechanistic origin of this scaling law can be formally attributed to the variability of the kinetic constants and their multiplicative products, which govern the kinetics of linked biochemical reaction sequences responsible for regulating these nutrients in diverse organisms (119). Untargeted metabolomics experiments have confirmed this universality, revealing that peak areas observed for raw plant ingredients follow the same log-normal distributions as observed in nutrient concentrations (128).
2.2. The Impact of Food Processing on Chemical Concentrations
The observation of a consistent scale of fluctuations shared across all nutrients and grounded in (bio)chemical principles prompted us to ask how human metabolism coevolved to operate with resilience and adaptability within an environment defined by specific chemical species and concentration constraints. A systematic alteration of these physiological ranges, along with the introduction of novel chemical components, could disrupt an organism’s normal homeostasis. This evolutionary perspective on human health, arising from a comprehensive analysis of nutrient concentrations in food, appears to align with recent observational studies, meta-analyses, and controlled metabolic investigations showing that diverse diets, such as prudent, Mediterranean, and Nordic, offer greater protection against disease risk than the heavily processed Western diet (33, 47, 113). Indeed, dietary markers, including glycemic load, macronutrient distribution, micronutrient density, acid-base equilibrium, sodium-to-potassium ratio, fatty acid composition, and fiber content, have all undergone substantial changes caused by shifts in lifestyle and diet. These changes accelerated significantly following the Industrial Revolution, with exponential growth commencing in the mid-twentieth century as a result of major advances in food processing technology and industrialization after World War II. The rapid pace of changes in dietary habits and lifestyle has left human biology adapted to ecosystems vastly different from modern life, creating a profound misalignment between human physiology and the contemporary Western dietary pattern (123). This discordance is considered a potential contributor to so-called diseases of civilization, including CVD (33, 42, 69, 145, 149).
Food processing is known to alter the concentration of native nutrients. Processing is also accompanied by the addition of extra salt, sugars, fats, and other additives whose purpose is to mimic the sensory qualities of fresh or raw foods or mask undesirable sensory attributes of the final product. In the last decade, epidemiological studies have highlighted the adverse health effects of processed foods, especially highly processed foods (HPFs). Indeed, many health effects traditionally associated with meat and fat consumption are linked predominantly to consumption of processed meat, which is associated with a 42% higher risk of CHD and a 19% higher risk of type 2 diabetes mellitus (99). Overall, an increased proportion of HPFs in an individual’s diet is associated with greater risk for numerous diseases, including CVD, CHD, and cerebrovascular disease (138); overweight and obesity (18); type 2 diabetes mellitus (137); cancer (49); and depression (1). Telomere length, which serves as a biomarker for biological age, is also influenced by diet through inflammatory mechanisms and oxidation (4). The adverse role of processed food is also supported by an EWAS (Section 2) that identified HPFs such as doughnuts, hot dogs, packaged white bread, and processed meats as the exposures that most significantly contribute to a higher risk of CHD (100) (Figure 2).
The chemical, physical, and biological processes involved in food preparation and preservation alter the nutritional composition of an ingredient. For example, comparing raw onion with fried and battered onion rings, we find that approximately three-quarters of the nutrients undergo concentration changes exceeding 10%. Furthermore, more than half of the nutrients experience tenfold changes (Figure 4b,c). However, we lack a singular nutrient biomarker that can precisely track the degree of processing. Instead, processing changes the concentration of multiple nutrients, whose combinations jointly correlate with the level of processing.
Despite the wealth of epidemiological data on the impact of HPFs on NCDs, a comprehensive understanding of the underlying mechanisms remains elusive. An ongoing academic debate emphasizes that the altered food matrix inherent to HPFs may compromise nutrient bioavailability, postprandial glycemic responses, and satiety levels (16, 55, 90, 110, 156). Recent research suggests that the microbiome may also mediate the detrimental effects of nonnutritive sweeteners and emulsifiers on glycemic response and intestinal inflammation (32, 107, 141). Exposure to artificial sweeteners and emulsifiers has also been found to be positively associated with CVD risk in large-scale prospective cohorts (37, 129).
As epidemiological evidence surrounding HPFs continues to increase, the impact of processed food is gaining prominence in food policy discussions. This shift has resulted in various expertise-based food classification systems used in cohort studies, including the European Prospective Investigation into Cancer and Nutrition (EPIC) (54, 133), as well as the expansion of food domain dictionaries, taxonomies, and ontologies, such as LanguaL (see https://www.langual.org), FoodEx2 (44), and FoodOn (see https://foodon.org). This body of research highlights a transition from food security, which primarily concerns ensuring access to affordable food, to nutrition security, which places greater emphasis on the availability of nutritious and nourishing foods (105). However, as we discuss next, recognized limitations in the existing classification systems have led researchers to advocate for a more data-driven and unbiased definition of food processing (54, 126).
2.3. Measuring the Degree of Food Processing Using Machine Learning
NOVA, an expert-based classification system designed to assess the degree and purpose of food processing, has been the starting point in 95% of studies investigating connections between the consumption of HPFs and health outcomes (29, 102, 103). Policy makers have also adopted NOVA categorizations to guide national and international public health decisions (101, 102). For example, several Latin American countries have formulated dietary guidelines based on NOVA classifications (35, 114), and, drawing heavily upon NOVA, the French government has set its sights on reducing HPF consumption by 20% (58).
NOVA categorizes individual foods into four broad categories: unprocessed or minimally processed foods (NOVA 1), which include items such as fruits and vegetables (fresh, dried, or frozen), milk, fish, and meat; processed culinary ingredients (NOVA 2), such as salt, oils, and table sugars; processed foods (NOVA 3), encompassing canned goods, artisanal bread, and cheese; and ultraprocessed products (UPFs or NOVA 4), which are industrial formulations with typically longer lists of ingredients, including substances not commonly used in culinary preparations. Examples of UPFs are margarine, packaged bread, sweetened breakfast cereals, cookies, spreads, sauces, sodas, hamburgers, and pizza. They are usually mass-produced, convenient, highly palatable, and ready to eat, containing limited or no whole foods.
NOVA relies on an expertise-based manual evaluation to address a challenging and inherently incomplete classification task (72), resulting in inconsistencies and ambiguities across the literature. For example, NOVA assigns only 35% of the foods from the USDA Food and Nutrient Database for Dietary Studies to a unique class, decomposing the rest into ingredients to be analyzed further (96). The classification becomes particularly challenging when dealing with composite recipes, products, and mixed meals, which constitute a significant portion of the food supply. Even when detailed ingredient information is available, the consistency in assigning NOVA classes among nutrition specialists is notably low (22). Finally, all of the observed health risk falls within NOVA 4, a broad and diverse category that assigns a single ultraprocessed label to more than 70% of the food supply (8, 72). This broad class restricts our ability to explore the health implications of consuming food with varying levels of food processing (82).
To overcome these shortcomings, we introduced FPro, a continuous processing score that combines features of processing techniques elucidated in the NOVA manual labels with nutrient concentrations derived from food composition data (97). The complex nutrient patterns shown in Figure 4a and b make a compelling case for the use of machine learning (ML), which excels at deciphering the combinations of nutrient changes related to food processing. FPro is derived from FoodProX, a multiclass random forest classifier designed to replicate accurately the manual NOVA classification using only nutritional information as input. For example, FoodProX assigns raw onion to NOVA 1 with probability p1 = 0.97 (Figure 4d) and industrial onion rings to NOVA 4 with probability p4 = 0.99 (Figure 4e).
FPro for food k is defined as follows:
| 1. |
which captures the trade-off between the confidence of the FoodProX algorithm in classifying food item k as NOVA 1 () and as NOVA 4 (), the two extreme classes clearly ranked according to an increasing extent of food processing. The score ranges from zero for raw ingredients (FPro = 0.0203 for raw onion) to one for UPFs (FPro = 0.9955 for onion rings). FPro does not assess individual nutrients in isolation but, rather, learns from patterns of correlated nutrient changes within a fixed mass (100 g), implying that a single high or low nutrient value does not singularly determine a food’s final FPro score. Instead, FPro depends on the likelihood of observing the overall pattern of nutrient concentrations in unprocessed foods versus UPFs. For example, while fortified foods may exhibit mineral and vitamin content similar to that of unprocessed foods, the algorithm identifies unique concentration patterns that are unlikely to be found in minimally processed whole foods, resulting in a high FPro score.
FPro offers automated and reproducible scoring of foods across various national and commercial databases as well as the ability to analyze complex recipes and meals. Additionally, it can assess the degree of processing in an individual’s diet. This capability facilitates the implementation of large-scale EWASs and the identification of foods to substitute in order to nudge individuals toward a less processed diet. Indeed, by applying FPro to the National Health and Nutrition Examination Survey data, we find that individuals with highly processed diets show significant positive associations with inflammation markers (C-reactive protein), as well as elevated risk scores for conditions like cardiovascular disease (measured by the Framingham and American College of Cardiology/American Heart Association risk scores), diabetes (indicated by fasting glucose and C-peptide levels), and metabolic syndrome (97). Conversely, we observe negative correlations with circulating levels of vitamins in the bloodstream, including vitamins B12, C, and D. FPro also reveals the remarkable variability in processing displayed by subgroups of foods with comparable function and composition in the US food supply (Figure 5). These findings offer the opportunity to implement substitution strategies that minimize the dietary shifts required to improve the epidemiological health implications of processed diets.
Figure 5.

FPro’s variability with food categories. Distribution of FPro for the food categories in What We Eat in America (WWEIA) data (2015–2016) with at least five items. WWEIA categories group foods and beverages with similar usage and nutrient content in the US food supply. All categories are ranked in increasing order of median FPro, indicating that each food group varies widely in FPro, thereby confirming the presence of different degrees of processing. The figure shows four ready-to-eat cereals, all manually classified as NOVA 4, that have different FPro values. While the differences between the nutrient content of Post Shredded Wheat ‘n Bran (FPro = 0.5658) and that of Post Shredded Wheat (FPro = 0.5685) are minimal, with lower fiber content for the latter, fortification with vitamins and minerals as well as the addition of sugar significantly increases the processing of Post Grape-Nuts (FPro = 0.9603), and the addition of fats results in an even higher processing score for Post Honey Bunches of Oats with Almonds (FPro = 0.9999). These data show how FPro ranks progressive changes in nutrient content. Figure and caption adapted from Reference 97 (CC BY 4.0).
FPro can accurately predict the degree of processing for various nutrient lists, including the minimal information encoded in Nutrition Facts labels, allowing us to assess the degree of processing of more than 50,000 products sourced from major US grocery store websites (122). This analysis represents a key step toward the complete digital phenotyping of food environments, beyond food deserts and food swamps (74).
To develop an entirely unsupervised FPro, independent of manual classifications, we need to move beyond standard nutrient concentrations and rely on systematic mapping of the DMN (Section 3), which will allow us to include the concentrations of additives and processing by-products. Such a broad array of chemical classes will enhance FPro’s ability to model the food matrix by capturing, for example, the cell wall transformations induced by food processing.
3. THE DARK MATTER OF NUTRITION
Nineteenth-century research on the caloric content of foods by chemist Wilbur Olin Atwater evolved with the recognition that food provides not only energy but also essential nutrients. This finding led to a greater emphasis on the diversity of dietary patterns as key factors in promoting overall health and well-being (48). In other words, food not only is a source of energy but also represents a complex mixture of nutrients and bioactive compounds that play multiple roles in health and in diseases. Yet, our understanding of food composition continues to rely on USDA data reporting a core nutritional panel of 150 essential micro- and macronutrients, related primarily to energy intake and metabolism, which comprise the concentrations of fatty acids, amino acids, sugars, fibers, minerals, and vitamins. Since 2003, the USDA has also reported the flavonoid content of selected foods, extending its main panel to 188 nutritional components. Although this information has been transformative for nutrition, the list of chemicals currently tracked by the USDA represent only a small fraction of the more than 139,000 chemicals present in food, many of which have known health effects (Figure 6). For example, the 69 nutrients currently documented by the USDA SR Legacy database for raw garlic include vitamins such as ascorbic acid (vitamin C) and nonessential amino acids such as alanine. However, it does not track important organosulfur compounds such as allicin and ajoene, which underlie the cardioprotective and antimicrobial effects of garlic, or the polyphenol p-coumaric acid, which protects against carcinogenesis and inflammation. These three bioactive compounds are only a few examples from the 6,802 small molecules we recently documented in raw garlic, many of which are secondary metabolites acting as the plant’s chemical defense against stressors such as predators and extreme weather conditions. This finding prompted us to define the DMN in 2019, helping us acknowledge the exceptional number of food compounds largely overlooked by epidemiological studies (13).
Figure 6.
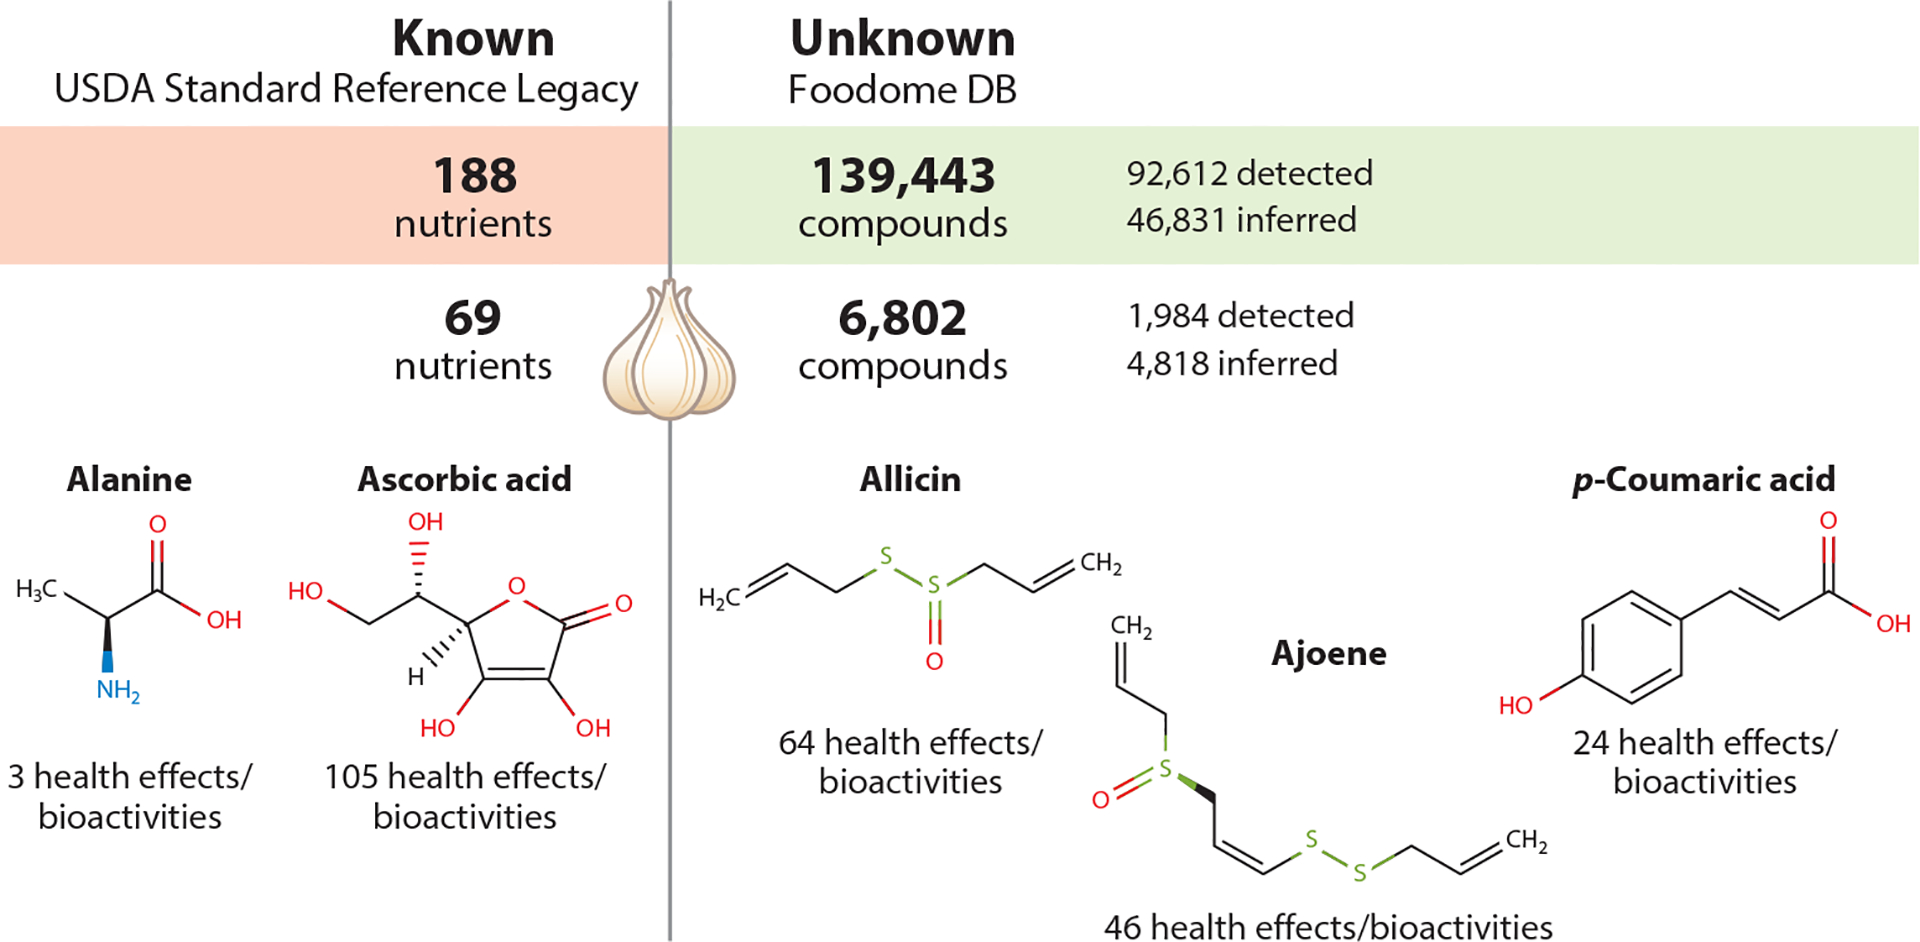
The dark matter of nutrition. The United States Department of Agriculture (USDA) has systematically measured 188 nutritional components that encompass essential micro- and macronutrients related primarily to energy intake and vitamin deficiencies. Although this knowledge has been transformative for the health sciences, these nutritional components represent only a fraction of the more than 139,000 chemicals we have collected, many of which have documented effects. For example, the 69 nutrients documented by the USDA Standard Reference Legacy database for raw garlic include vitamins such as ascorbic acid and amino acids such as alanine but miss important bioactive compounds such as allicin, ajoene, and p-coumaric acid. The number of health effects/bioactivities documented in FooDB is shown for each compound.
Efforts to develop multiple systematic steps of data integration and disambiguation, which allowed us to combine annotations from the specialized scientific literature (59), mass spectrometry repositories (see https://www.ebi.ac.uk/metabolights), mass spectrometry experiments, aggregated composition databases (124, 157; see http://foodb.ca), and genomics and pathway predictions (111), resulted in a library of more than 139,000 small molecules linked to food. Perhaps not surprisingly, many of these compounds have physicochemical properties similar to those of pharmaceutical drugs (molecular weight ≤ 1,000 Da); however, the underlying molecular mechanisms through which the DMN affects human health remain largely unexplored. Consider, for example, dietary polyphenols, a wide class of plant secondary metabolites, that are not engaged in metabolic processes of anabolism and catabolism endogenous to humans. Rather, they (a) display anti- or pro-oxidant activity by binding to proteins (38), (b) modulate cellular signal transduction pathways via a process of cross-kingdom signaling (81, 108), and (c) interact with the metabolism of gut bacteria (20). Currently, the USDA SR Legacy database contains only 38 nutritional measurements on polyphenol concentrations, limiting our ability to identify foods rich in protective molecules such as rosmarinic acid (RA) (38), a polyphenol that exerts an antithrombotic effect by binding to and inhibiting human proteins involved in platelet activation (see Section 4).
Despite our efforts to map out the DMN, the collected food composition data remain highly uneven and incomplete, largely missing concentrations. In the following subsections, we discuss in detail the completeness of current food composition data and explore how AI can fill this important knowledge gap.
3.1. Data Resources for Food Composition
Numerous governmental agencies around the globe independently compile data on essential nutrients vital for sustaining bodily functions. For example, EuroFIR (the European Food Information Resource) integrates the national endeavors of a number of countries, compiling compositional data for approximately 29,000 foods (76). Such databases offer comprehensive lists of essential nutrients, often including average concentrations established through experimentation adhering to AOAC (Association of Official Agricultural Chemists) guidelines or by comparison with measurements reported in neighboring countries (5). These data sources encompass the full spectrum of processing steps, spanning raw ingredients (e.g., apples), minimally processed items (e.g., peeled apples), prepared dishes (e.g., apple pie), restaurant menu items (e.g., fast-food apple fritters), and multiple variations of ingredients (e.g., Golden Delicious apples) (127).
The scale of these systematic endeavors is commendable; however, as our understanding of the relation between the DMN and health expands, it becomes evident that these databases are incomplete, limiting our ability to investigate the connections between nutrition and well-being. While suitable for energy considerations, the categorization of thousands of compounds into single entries, as done for macronutrients, masks the health implications of individual compounds. This gap inspired the creation of multiple food composition databases. For example, Phenol-Explorer focuses on polyphenols in food (124), TOMATOMET compiles all (bio)chemicals in tomatoes (6), KNApSAcK covers the composition of plant-based foods (2), and SuperNatural II gathers naturally occurring compounds (9). The largest curation endeavor in this domain is the Dictionary of Food Compounds (DFC), which reports around 41,000 (bio)chemicals (157). Overall, the array of databases containing potential food composition data is vast and heterogeneous, each employing unique criteria for including (bio)chemicals and food items and using varying nomenclature (such as common plant names versus scientific names or different designations for compounds such as ethanol and ethyl alcohol). This diversity makes it challenging to harmonize and integrate the different data sources, requiring considerable time and resources (127).
FooDB (see http://foodb.ca) offers the most extensive open-source initiative to aggregate food composition data, leveraging the manual curation and integration of multiple publicly accessible, specialized databases. FooDB supplements its data with inferences based on genomic and pathway analyses of the source species. As of 2023, FooDB contained approximately 71,000 compounds. Another aggregation database is COCONUT, which harmonizes data from 53 natural compound databases for a total of 407,270 predicted compounds, although associations with food are reported for only a fraction of them (135). Despite their invaluable contribution to the current understanding of food composition, these databases remain uneven, sparse, and incomplete. Indeed, of the 71,000 compounds in FooDB, more than 50,000 are inferred, and nearly 46,000 of them are lipids. Consequently, only a handful of (bio)chemicals have been experimentally detected, with even fewer reported concentrations. For example, in the case of soft-necked garlic, FooDB lists 4,250 (bio)chemicals, but only 282 of them have been experimentally detected, and concentrations have been reported for just 89 (bio)chemicals sourced from USDA databases (127, 50; see https://phytochem.nal.usda.gov).
3.2. Artificial Intelligence–Driven Knowledge Extraction from Scientific Literature
A wealth of knowledge about the (bio)chemical composition of foods is scattered throughout the vast scientific literature. Indeed, many articles report detected (bio)chemicals and changes in their concentrations according to diverse agricultural, cultural, and regional food cultivation and preparation practices (raw, cooked, processed, or as components of culinary recipes). This abundant information is not currently covered in databases, given the variability in reporting methods, journal formats, and author preferences.
Creating and curating composition databases from the scientific literature are substantial tasks, ranging from the identification of pertinent articles to information extraction—a process that frequently relies on manual labor with solid domain knowledge. Due to these limitations, databases like DFC become outdated, subsequently impacting aggregation databases such as FooDB, which heavily relies on DFC’s last update in 2012.
To address these challenges, Hooton et al. (59) employed an ML pipeline to identify relevant literature on garlic and cocoa. Following manual extraction of data from 77 garlic-related papers and 93 cocoa-related papers, their findings revealed substantial gaps within FooDB, missing 48% of garlic-detected compounds and 72% of cocoa-detected compounds. Additionally, around 70% of all compounds documented in the literature were quantified, more than doubling the number of quantified compounds reported in FooDB. This study showed, by automating collection, assessment, and extraction, that ML is well suited for enhancing information quality and accessibility.
With more than a million research papers published each year (151), the sheer volume of scientific literature makes the manual curation of papers containing composition information unfeasible. ML, by contrast, can efficiently identify food-related papers by leveraging well-established domain dictionaries, taxonomies, and ontologies for foods and (bio)chemicals. Algorithms take as input comprehensive lists of relevant terminology: For chemical compounds, PubChem (see https://pubchem.ncbi.nlm.nih.gov), ZINC (66), ChemSpider (118), and Medical Subject Headings (MeSH) trees (see https://www.nlm.nih.gov/mesh) provide names and synonyms, while FoodBase (120), FoodEx2 (43), and FoodOn (39) offer food-related terminology. Each paper scored with probable composition information can then be evaluated through the use of supervised classifiers, such as neural networks, XGBoost, and random forests, to prioritize articles for data extraction. In the mining phase, each paper with pertinent information contributes to a data set reporting details on food composition. While manual extraction is common, ML can assist in this process (142), suggesting that in the near future ML models may be able to reduce manual curation efforts.
Integrating self-attention mechanisms, a core component of large language models (LLMs) such as OpenAI’s ChatGPT, into supervised ML frameworks can significantly improve the accuracy and efficiency of extracting food composition data from scientific texts. Self-attention, a technique that allows models to weigh the importance of different words in a text relative to each other, can be applied to better identify and extract relevant information from dense academic articles. By using self-attention within ML frameworks, the models can focus on key terms and context around biochemical compounds and nutritional data, enhancing the precision of data extraction from a wide array of scientific publications. For example, FoodNER demonstrated a high rate of success in detecting food-related papers (139), while BuTTER was able to extract food composition information from unstructured Wikipedia’s text (25). These advances in ML-based data mining, and the unfolding revolution in LLMs, promise to offer a comprehensive (bio)chemical description of food items for use in future health studies.
3.3. Unveiling Food Composition with Mass Spectrometry
Much as genomic sequencing revolutionized genetics by revealing the sequence of entire genomes, we need a robust experimental approach to unveil the complete (bio)chemical composition of each food. Metabolomics employs untargeted techniques to reveal a comprehensive array of (bio)chemicals within food as well as targeted techniques to assess the concentration of compounds of interest. Untargeted techniques offer a high-resolution profile of food constituents by combining results from multiple platforms sensitive to specific physical properties. Each platform involves three key steps: extraction, which isolates select metabolites; separation, which separates metabolites according to structural differences using chromatography; and detection, which obtains spectra for each structure using mass spectrometry (127) or nuclear magnetic resonance spectroscopy.
Over the past 20 years, metabolomics has consolidated around three core platforms. First, gas chromatography–mass spectrometry detects a wide range of metabolites, including amino acids, carbohydrates, fatty acids, and their derivatives (and has been an established method for the detection of certain lipids for many years). Second, hydrophilic interaction chromatography–mass spectrometry (HILIC-MS/MS) identifies polar compounds, such as biogenic amines, nucleotides, and peptides. Third, reverse-phase–mass spectrometry (RP-MS/MS) detects nonpolar compounds, including lipids, fatty acids, and carotenoids (127).
Other emerging platforms cater to specific compound classes, such as phenolics or complex sugars. For example, a pentafluorophenylpropyl matrix (column) has been used by nutritional metabolomics to detect flavonoids, coumarins, anthocyanins, and terpenes. However, no single platform can capture the complete list of chemical compounds present in food. Moreover, untargeted metabolomics is not quantitative; the concentrations of the detected compounds are relative to the other compounds within the sample, expressed as a ratio to the total ion current or to the sum of all detected metabolites (136). In order to address this limitation, additional experiments such as targeted metabolomics must be performed to determine absolute concentrations.
3.4. Artificial Intelligence–Based Spectra Annotation
Untargeted metabolomics has made significant strides in annotating several hundreds of compounds within a single experiment, often surpassing the resolution of existing databases. However, the number of annotated compounds remains relatively low. Indeed, approximately 80% of the peaks identified in RP-MS/MS and HILIC-MS/MS spectra remain unannotated (28, 108), leaving numerous compounds undetected. The nature of these unannotated peaks remains a subject of ongoing discussion within the metabolomics community; it is still unclear whether they represent novel, undetected metabolites or adducts, modified versions of known metabolites. More recently, studies indicate that approximately 50% of these unannotated peaks may correspond to unknown metabolites (67, 140).
The gold standard for annotation involves comparing sample spectra with reference standards obtained from pure compounds with well-defined chemical structures and analyzed on the same instrument. Yet, most metabolomics centers offer gold standards for only a limited set of (bio)chemicals due to the high cost of maintaining extensive reference standard libraries. To increase the number of annotated compounds, centers rely on spectra-matching programs that compare sample spectra with extensive repositories of previously obtained spectra from sources such as METLIN (METabolite LINk) (134), MoNA (MassBank of North America), NIST (National Institute of Standards and Technology) Standard Reference Data, and GNSP (Global Natural Products Social Molecular Networking) (152). While this method significantly increases the number of annotated compounds, the outcome is biased toward well-studied chemical structures with known spectra.
To determine the strengths and weaknesses of current mass spectrometry annotation tools, we initiated a systematic experimental study (see https://www.metabolomicsworkbench.org/data/DRCCMetadata.php?Mode=Study&StudyID=ST002493) of five plant-based foods (apple, basil, lettuce, strawberry, and tomato), engaging with a state-of-the-art laboratory (UC Davis) that uses different methods and annotation approaches. These efforts successfully annotated 871 peaks in HILIC-MS/MS while leaving 3,823 unannotated; annotated 637 peaks in RP-MS/MS while leaving 2,771 unannotated; and provided 918 annotated peaks in pentafluorophenylpropyl together with 18,979 unannotated peaks. This pilot study documented the rich layer of information that can be captured by mass spectrometry, yet it also showed that more than 20,000 peaks in these five foods remain unannotated, concealing much information about their chemical composition and demonstrating the severe limitations of single-spectra peak-based matching annotation methodologies.
ML offers the promise of fundamentally changing spectral annotation. First, ML models can generate predicted spectra, termed in silico spectra, for compounds with no experimental spectra. MS-FINDER, for example, utilizes fragmentation rules and training on spectral repositories to predict the breakdown of chemical compounds in mass spectrometry experiments, thereby providing valuable in silico spectra that enhance sample annotation (148). Second, ML algorithms can generate predicted structures using peaks from sample spectra. SIRIUS, for example, trains on spectral repositories to capture the relation between chemical substructures and fragmentation patterns (41). Combining this knowledge with graph-based algorithms delivers fully resolved chemical structures. Both SIRIUS and MS-FINDER were successful in annotating compounds missing from spectral repositories, particularly plant secondary metabolites that are often overlooked (89). Despite their success, numerous metabolomics centers remain hesitant to adopt these annotation tools due to concerns about varying annotation quality, which can affect the nature and reliability of the results.
Recent developments in natural language processing transformers could overcome single-spectra peak-based matching by leveraging the information encoded in the full spectra corpus and reinforcing the learning task with food composition data captured by the DMN. Indeed, transformer-based deep learning strategies excel at language translation tasks, which provides a useful analogy for metabolomics annotation. In this framework, the spectra language represents words formed by peaks, while compound language corresponds to words made up of substructures (127). MassGenie has showcased the validity of this approach by generating a candidate list of chemical structures through peak translation for a subset of chemicals in ZINC (66, 132). Yet, adapting this approach to annotate food composition at scale presents a pressing challenge awaiting resolution. It is, however, a necessary step if we wish to understand the molecular mechanisms through which diet affects health, as we next discuss.
4. A NETWORK MEDICINE FRAMEWORK FOR PREDICTING THE THERAPEUTIC EFFECTS OF FOOD MOLECULES
Network medicine is a post-genome discipline that highlights the pivotal role of molecular interactions in understanding, preventing, and treating diseases (12, 86). The resulting set of network methodologies developed since 2015 can help identify functional pathways tied to specific phenotypes and diseases (131), pinpoint potential drug targets, highlight drug repurposing opportunities (30, 117), and identify effective drug combinations (31, 56). This framework, initially focused on drugs, can be readily extended to food compounds within the DMN, identifying food-derived molecules that can affect specific diseases (38, 108), as well as shedding light on the diverse mechanisms of actions that food molecules leverage to modulate health and homeostasis. Ultimately, network medicine can provide evidence for causal diet–health associations and help identify the specific molecular pathways underpinning epidemiological observations. A systematic characterization of these biological pathways could also reveal molecular scaffolds in classes of food molecules that evolved as preferred protein–ligand binding motifs, making them invaluable inspiration for drug design (108).
4.1. Mechanisms of Action for Food Molecules
The human interactome or protein–protein interaction network (PPI) is a vast subcellular network that catalogs all known physical and regulatory interactions among human proteins, serving as an important resource for understanding disease mechanisms and facilitating drug target discovery (14, 94). While the current map of the interactome remains incomplete, it captures 354,659 physical interactions (mainly binding) between 18,659 proteins (63, 87, 91). Many disorders, such as coronary artery disease (CAD) and its endotypes, represent perturbations on the PPI, which congregate in localized disease modules or therapeutic areas (52, 94). In the network space, these disease modules tend to be proximal to modules of comorbid diseases, such as cerebrovascular disease, or to subnetworks of endophenotypes, such as inflammation (53) (Figure 7). Similar functional modules or subgraphs are observed in the interactome for epigenetic factors, including proteins that recognize and covalently modify DNA, RNA, and histones (93) and proteins involved in common drug side effects such as electrocardiographic QT interval prolongation and drug-induced asthma (112).
Figure 7.

The network medicine framework. The human interactome is the sum of all experimentally validated physical interactions (links) between proteins and transcription factors (nodes). Proteins linked to a specific phenotype or disease congregate in well-defined regions of the human interactome, forming disease modules (red, yellow). By binding to human proteins, both drugs and food molecules can perturb the cellular network, resulting in therapeutically beneficial local changes. Understanding which food molecules target the interactome could offer potential pathways for the discovery of food-based therapeutic interventions.
Drugs whose protein targets are in the network neighborhood of a specific disease module are likely to show efficacy as treatments for the disease and for comorbid pathologies (Figure 7). We can apply a similar framework to food molecules by investigating the network proximity of their targets to known therapeutic areas and functional modules. This approach has shown promising results in elucidating the mechanisms of action of polyphenols and other plant secondary metabolites (38, 108).
To illustrate the fundamentals of network medicine in its application to food (bio)chemical analysis, consider sulforaphane (SF), an isothiocyanate common in broccoli and cruciferous plants that is produced from the glucosinolate glucoraphanin upon injury and stress to the plant. Despite its well-documented anticarcinogenic properties (70, 84), its known therapeutic effects in CVD and type 2 diabetes mellitus through NRF2 pathway activation (21, 46), and its epi-bioactive properties (73, 92), national food composition databases do not track SF.
By scanning publicly available databases reporting the bioactivities of compounds in human assays, such as PubChem (see https://pubchem.ncbi.nlm.nih.gov/), DrugBank (see https://go.drugbank.com), BindingDB (85), ChEMBL (95), the Comparative Toxicogenomics Database (36), Drug Target Commons (143), and STITCH (80), we found that SF has 58 experimental binding protein partners. These targets are not randomly scattered on the interactome but, rather, create a cluster of 49 proteins that form a large connected component (LCC), the size of which shows statistical significance as a unique cluster (z score = 2.82 by degree-preserving randomization) (Figure 8a). While the creation of large clusters is not typical of synthetic drug targets, this finding is in agreement with observations by do Valle et al. (38) for the targets of 23 polyphenols (Figure 9).
Figure 8.
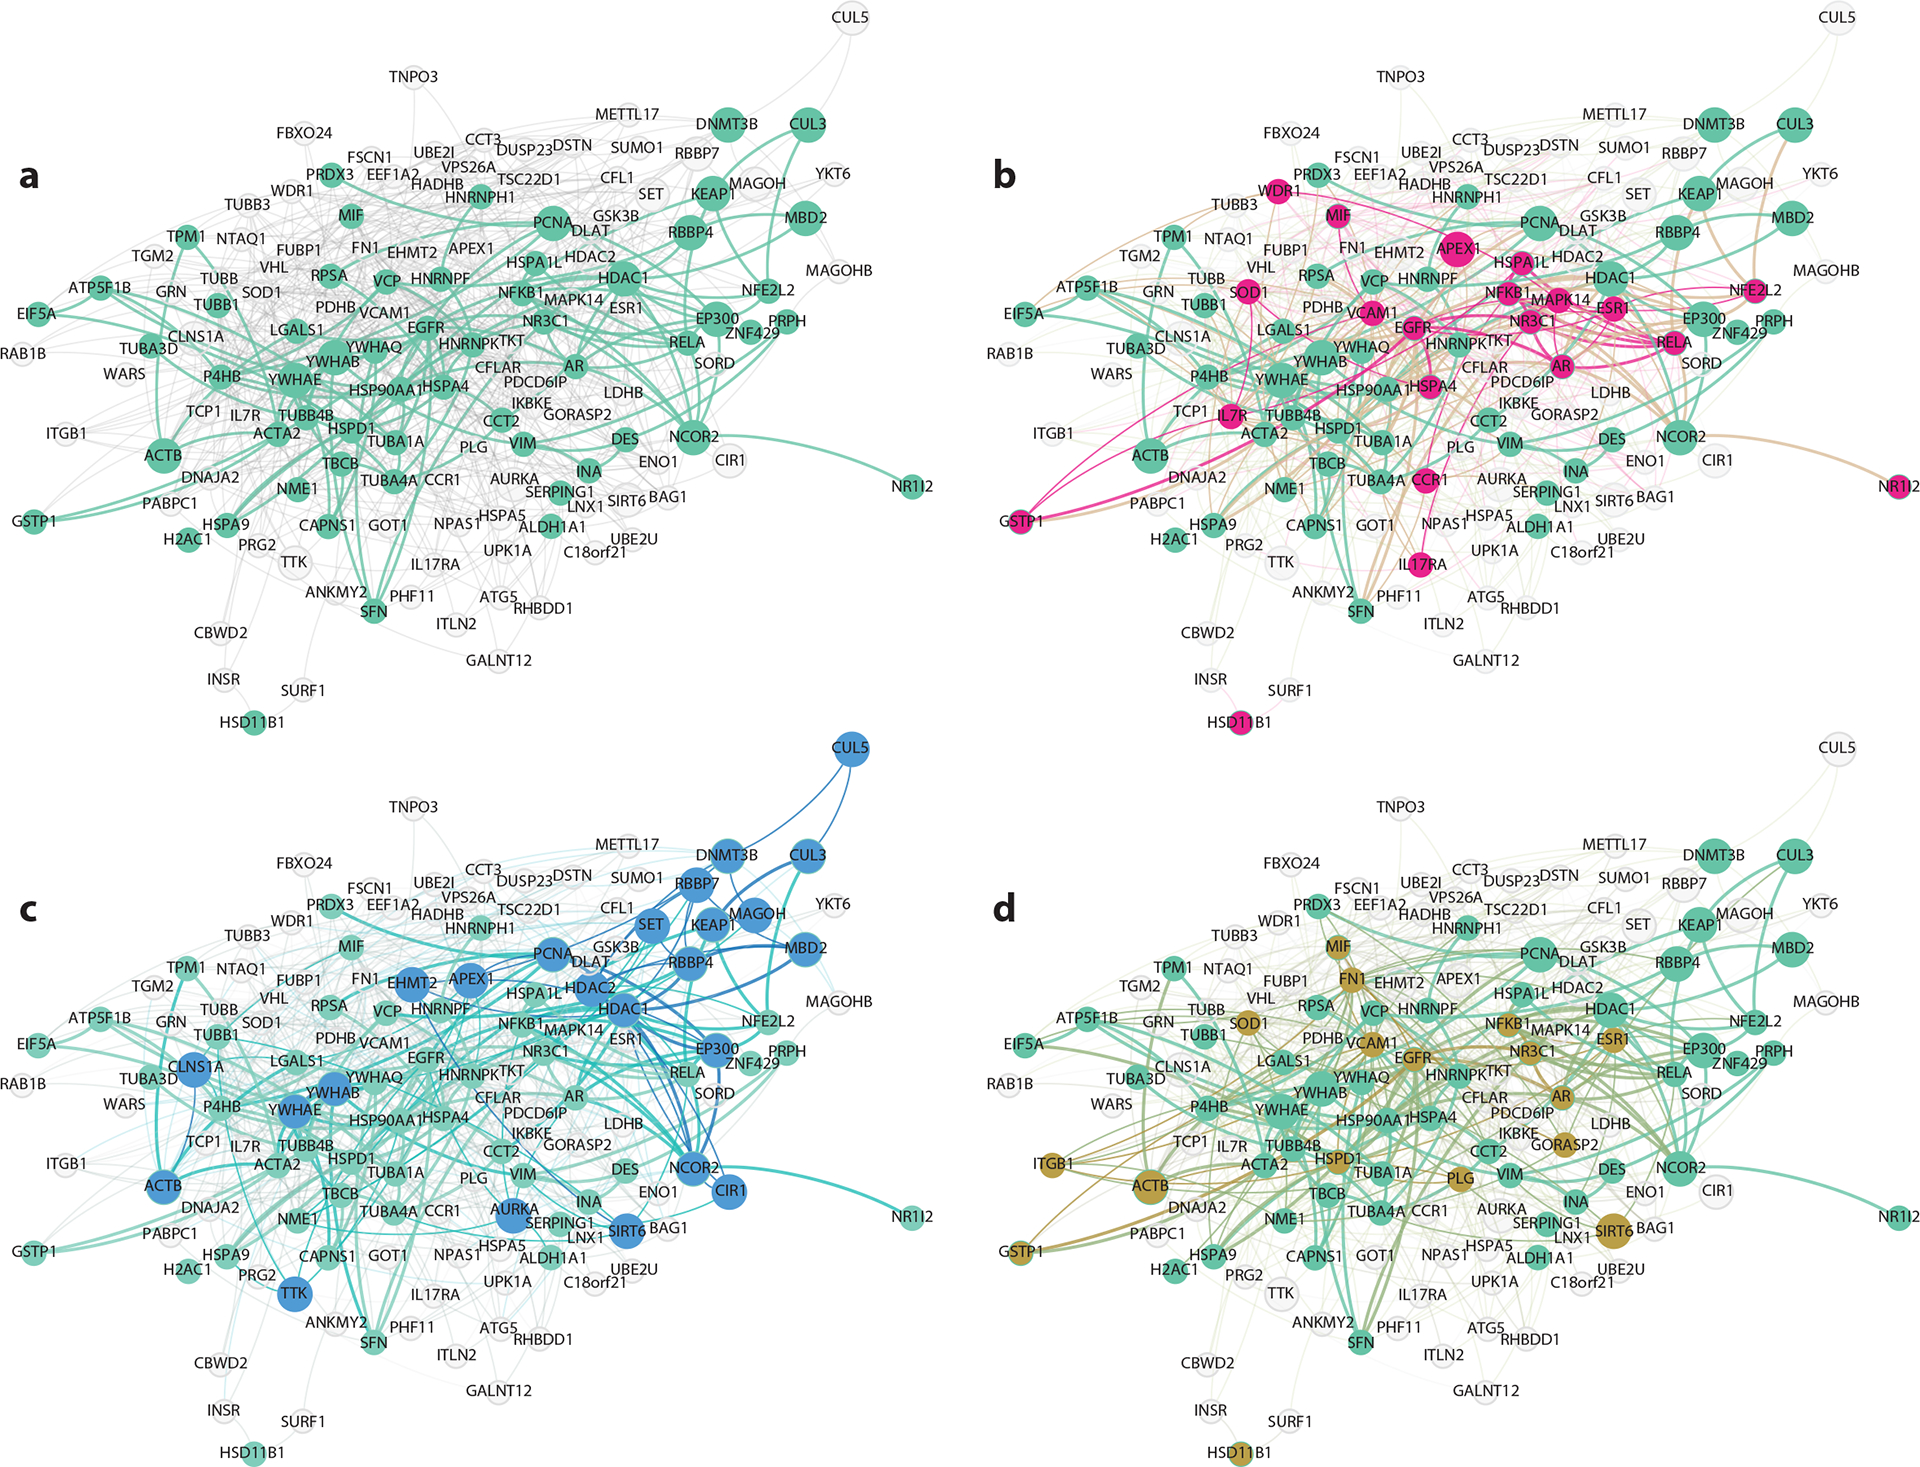
The network neighborhood of sulforaphane’s targets in the protein–protein interaction network. (a) Network neighborhood of sulforaphane’s largest connected component comprising 49 targets, surrounded by 9 additional isolated targets. Green indicates both sulforaphane’s targets and the binding links connecting them. Gray indicates proteins close to sulforaphane’s targets. (b–d) Within the same region of the interactome are proteins belonging to the modules of inflammation (magenta), epigenetic modifiers (blue), and coronary artery disease (gold). Proteins that are both sulforaphane’s targets and associated with a therapeutic area are filled with the color of the selected therapeutic area, while their border is colored green.
Figure 9.

The protein–protein interactions of polyphenol targets for 23 polyphenols forming connected components in the interactome (protein targets retrieved from STITCH). For instance, piceatannol targets constitute a single connected component comprising 23 proteins, whereas quercetin targets form several connected components, with the largest consisting of 140 proteins. Polyphenol targets disconnected from other targets are omitted from the visualization. Different colors are used to denote connected components associated with different polyphenols. Figure and caption adapted from Reference 38.
Epidemiological evidence for the role of SF as a modulator of inflammatory processes, epigenetic mechanisms, and CAD is well supported by the network-based distance or proximity of SF’s targets to proteins involved in these functional modules. This metric accounts for the shortest path lengths between the set of target proteins of a (bio)chemical (T) and proteins involved in a specific therapeutic area (S):
| 2. |
The significance of the observed proximity, dc(S,T), is quantified through a z score calculated by reiterating the same metric 1,000 times, while selecting random subsets of proteins of the same size and with a compatible number of interacting protein partners. The more negative the z score is, the stronger the predicted effect will be.
We identified the proteins contributing to the modules for inflammation (INFLA), epigenetic modifiers (EPM), and CAD by leveraging high-confidence annotations from DisGeNet (see https://www.disgenet.org), Open Target Platform (78), Phenopedia (158), and Epi-Factor (7). All three groups of proteins are well localized on the PPI, as quantified by the significance of their LCCs: LCCINFLA = 519 proteins (z score = 11.79), LCCEPM = 708 proteins (z score = 8.89), and LCCCAD = 837 proteins (z score = 6.32). Figure 8b and d zooms in on subregions of these therapeutic areas that are most proximal to SF’s targets, visualizing the pathways in the interactome that are most likely responsible for the therapeutic effects of SF. SF’s targets are significantly proximal to all three therapeutic areas: z scoreINFLA(SF) = −4.21, z scoreEPM(SF) = −3.21, and z scoreCAD(SF) = −3.29.
Network medicine predictions have uncovered novel mechanisms of action for several small molecules, and many of these mechanisms have been validated experimentally (38, 117). For example, the targets of RA (Figure 10a), a polyphenol common in many culinary herbs such as rosemary and sage, are within the interactome neighborhood of vascular diseases as they are in close proximity to proteins related to platelet function. Specifically, RA’s target FYN and the vascular disease proteins associated with platelet function (PDE4D, CD36, and APP) create a connected component (Figure 10b). In vitro experiments revealed that, indeed, RA inhibits collagen-mediated platelet aggregation (Figure 10c) and α-granule secretion (Figure 10d) through inhibition of protein tyrosine phosphorylation via its interaction with FYN.
Figure 10.
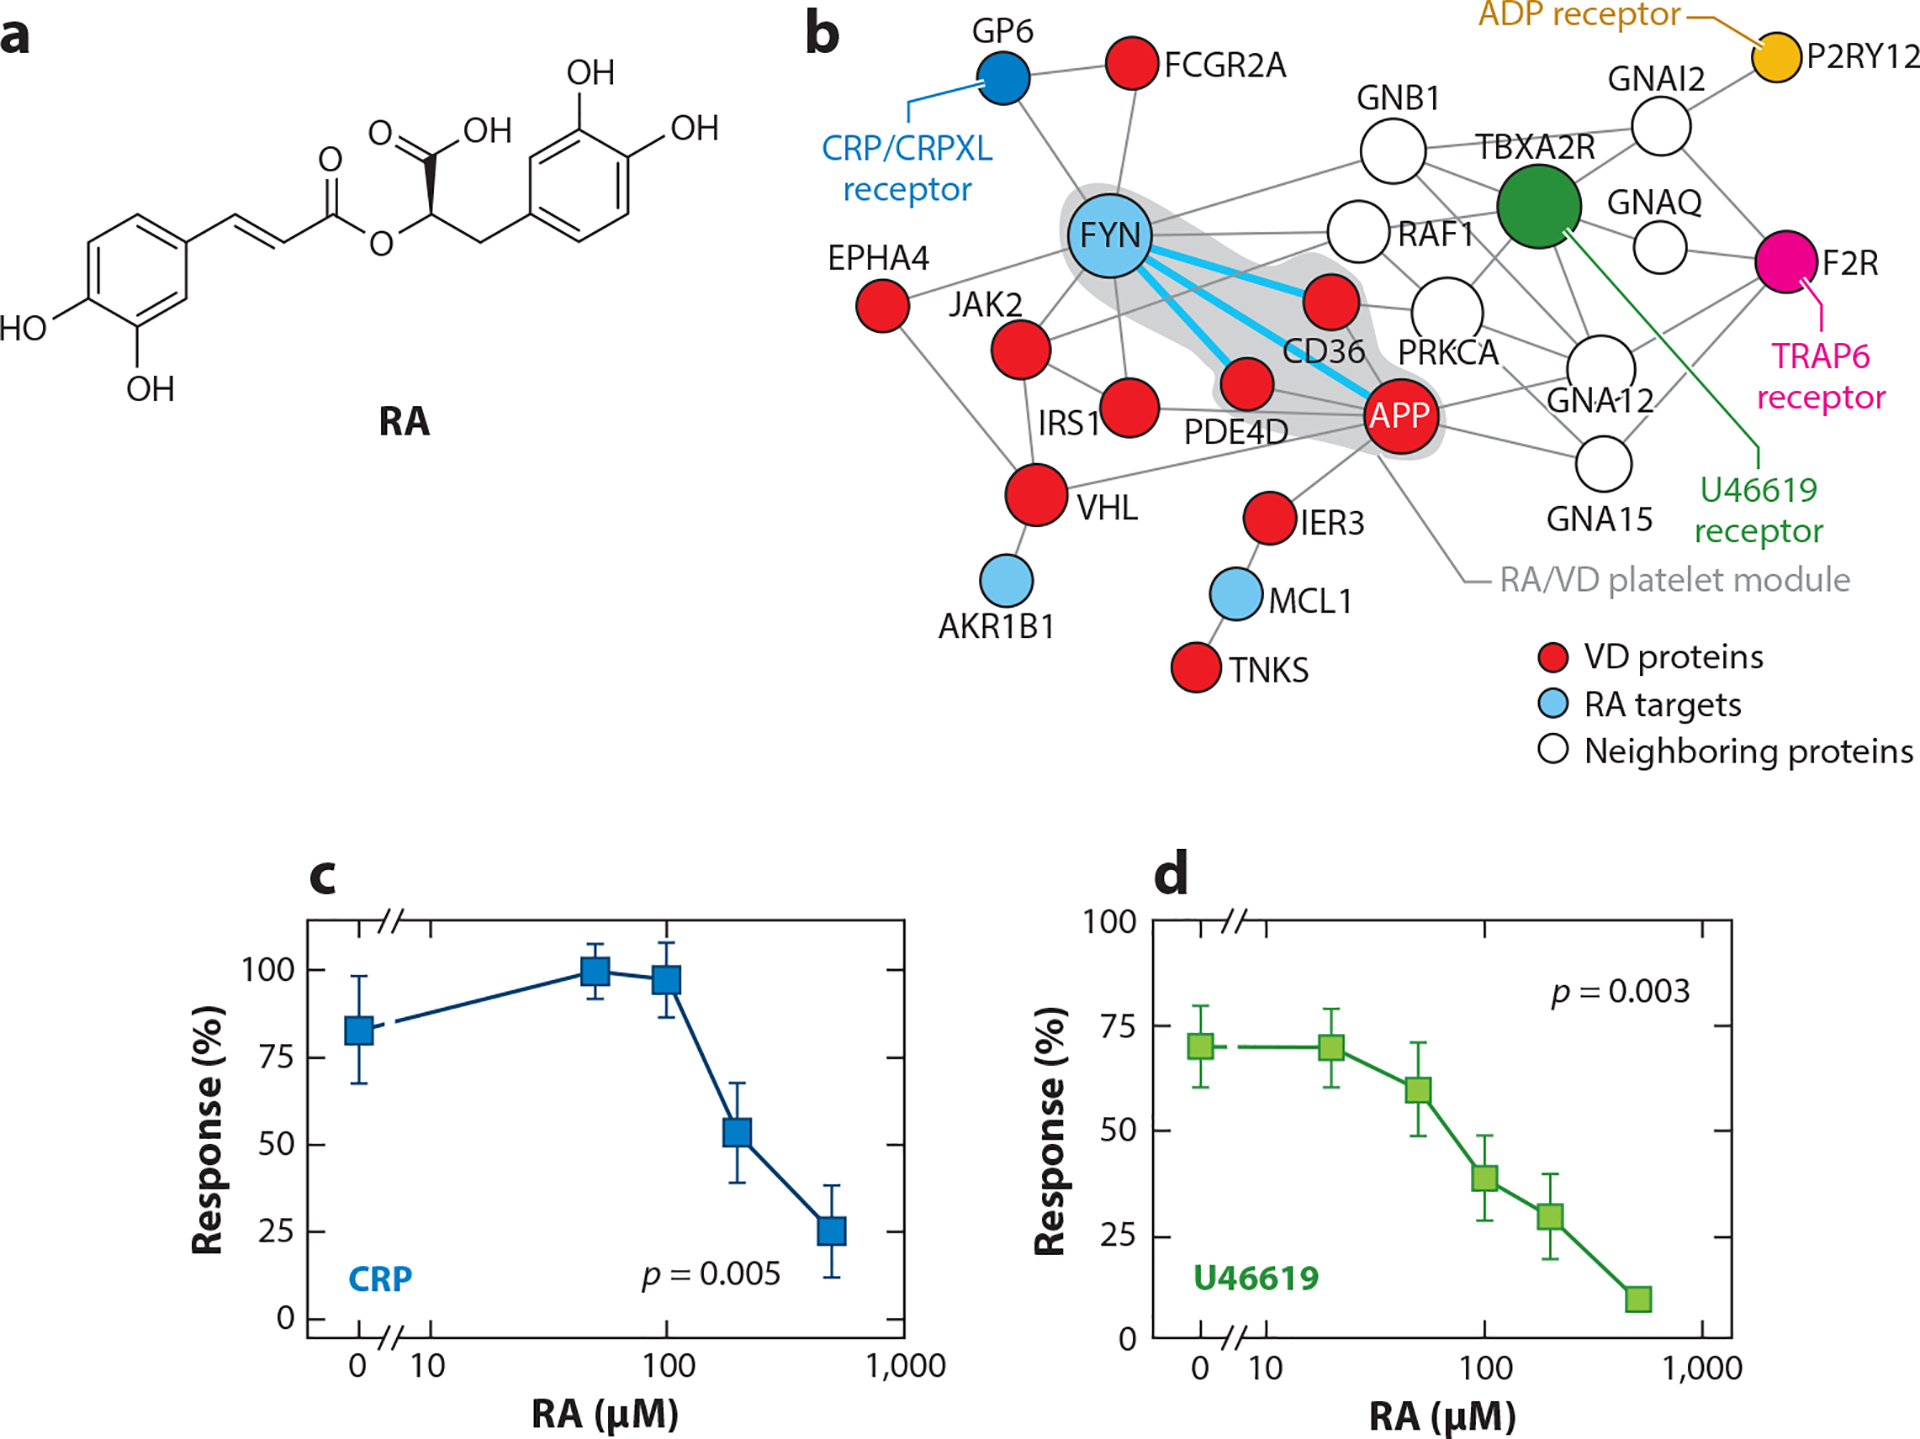
RA modulates platelet function. (a) Chemical structure of RA, a flavonoid commonly found in plants such as Perilla frutescens L., Rosmarinus officinalis L., and Melissa officinalis L. (b) Interactome neighborhood illustrating RA targets alongside the RA/VD platelet module, a connected subgraph composed by the RA target FYN and the VD proteins linked to platelet function (PDE4D, CD36, and APP), as well as the receptors for platelet agonists used in the experiments (collagen/CRPXL, TRAP-6, U46619, and ADP). (c,d) PRP or washed platelets were pretreated with RA for 1 h before CRP (CRPXL, 1 μg/mL) or U46619 (1 μM) stimulation, followed by assessment of (c) aggregation or (d) α-granule secretion. Abbreviations: CRP, collagen-related peptide; PRP, platelet-rich plasma; RA, rosmarinic acid; VD, vascular disease. Panels b, c, and d and caption text adapted from Reference 38.
4.2. Target Prediction for Food-Based Small Molecules
The use of network medicine as an effective platform for investigating the health effects of food-based molecules requires a comprehensive mapping of the protein-ligand interactions associated with each dietary compound. While databases such as DrugBank, BindingDB, and ChEMBL report such interactions, they primarily catalog drug targets. Interactions involving dietary compounds have been relatively understudied, limiting our ability to explore their biological role.
The need for accurate protein–ligand predictions extends beyond dietary research—it is equally critical for the pharmaceutical industry. The ability to screen large libraries of food compounds with standard computational resources is a prized asset among scientists. Consequently, we established a standardized workflow combining ML and molecular docking algorithms to forecast protein binding for small molecules (27). In this workflow, ML models such as AI-Bind (27), TransDTI (71), MolTrans (62), and DeepPurpose (61) are trained on binding interaction databases such as DrugBank and BindingDB. Subsequently, docking algorithms such as AutoDock Vina (147), Schrödinger Glide (57), and rDock (125) are used to analyze a prioritized list of protein–ligand pairs to predict the binding locations of molecules and estimate their protein binding affinities. We have shown (27) that combining ML and docking simulations can successfully and efficiently predict binding between food compounds and proteins.
The predicted binding annotations derived from such ML–docking pipelines are invaluable for network medicine, revealing potential health effects of (bio)chemicals when knowledge of interactions is limited. Moreover, the increasing availability of high-performance computing systems, such as the near-exascale Sierra System at Lawrence Livermore National Laboratory, promises to accelerate the exploration of the food (bio)chemical–proteome space (40).
4.3. Combinatorial Mechanisms of Action of Food Molecules and Comparison with Drug Combinations
Dietary compounds are never consumed in isolation; instead, they enter the body as complex mixtures of numerous (bio)chemicals. Consequently, their impact on human health is not isolated but rather occurs in conjunction with other bioactive compounds within the food matrix. Network medicine not only predicts therapeutic applications for individual chemicals but also helps assess the simultaneous action of multiple compounds potentially pursued as combination therapies. For example, Cheng et al. (31) found that drugs that are effective in combination tend to target nonoverlapping pathways within the same disease module. In contrast, drugs with adverse reactions when used in combination tend to have targets that are proximal to one another within the disease module, affecting overlapping pathways (112). Note, however, that while the proximity of drugs to disease modules holds predictive value for drug indications, the extent of overlap in drug modules alone falls short in quantifying compatibility in terms of efficacy. This ambiguity likely arises from unaccounted-for pharmacodynamic factors, encompassing dose-dependent effects influenced by the presence of multiple bioactive molecules with varying concentrations, and alterations in the binding landscape of drugs, resulting from direct competition for targets or secondary perturbations of the PPI (108).
While drugs and dietary compounds share similarities as small molecules, protein targets for drugs are highly specific and are deliberately designed to limit associations and mitigate potential side effects. In contrast, natural compounds in food exhibit greater target promiscuity and structural redundancy, binding to a broad pool of shared targets that perturb similar biological pathways with concentrations that span several orders of magnitude and thereby adding a layer of complexity to the assessment of compatibility.
Recent experimental advances, exemplified by Elgart & Loscalzo’s (45) technique for examining local drug combinations, offer the prospect of assessing an extensive array of chemical combinations within a single-cell culture by establishing independent transient chemical gradients across the culture. This approach promises to provide insights into how the concentrations of various combinations of food (bio)chemicals, as observed in different dietary patterns, perform in comparison to a broader spectrum of potential concentration scenarios, as well as how to do so efficiently.
5. CONCLUSIONS AND FUTURE DIRECTIONS
In this review, we have explored the current state of knowledge on the detailed network science and AI-based molecular composition of food and its effects on health. We have highlighted the challenges and opportunities for improving the quality and accuracy of food chemical composition data, as well as the applications and limitations of various methods for analyzing and predicting the health effects of food molecules. We believe that high-resolution food composition is a vital prerequisite of nutrition science and that further efforts are needed to enhance its reliability, accessibility, and coverage, with the ultimate goal of capturing all small molecules with potential bioactivity.
LLMs such as GPT-3.5 and GPT-4 have revolutionized our everyday life thanks to their astounding adaptability to a wide range of tasks, from generating poems to copyediting an essay. Their strength lies in extensive training on data rich in signals, enabling them to generate advanced insights by inferring latent structures. For example, after processing several petabytes of text, chatbots such as ChatGPT and Microsoft Copilot can engage in elaborate conversations across a broad spectrum of topics. Similarly, text-to-image models such as DALL-E and Midjourney, trained on billions of images, can create unique pictures from a simple text prompt.
Since their introduction in 2018, LLMs have seen a significant growth in both parameters and functionalities (e.g., GPT-4 has more than 100 trillion parameters and has the ability to handle both text and images) (19). The numerous parameters learned during training include text embeddings, which act as high-dimensional vectors capturing the semantic meaning of words, and attention weights, which determine the relationships between words and how they should be translated into output text.
Beyond human language, a remarkable long-term opportunity for LLMs entails the language of biology (146). Indeed, recent efforts such as ESM-2/ESMFold from Meta have shown that LLMs trained on amino acid protein sequences have a remarkable ability to predict the protein tertiary structure and to identify key amino acids that will affect the folding (23). Furthermore, GeneFormer, trained on 30 million single-cell expression data, can predict processes related to network medicine (144). Note, however, that LLMs can hallucinate by generating sensible output that is detached from reality. Yet, with proper validation and active learning, hallucinations could help design novel proteins, as pioneered by the ProGen algorithm (15, 88).
LLMs could also be applied to the molecular fingerprints characterizing drugs and food molecules, with the objective of modeling as complex sentences the combinatorial effects of compound mixtures present in food. Furthermore, LLMs trained and tuned on combined information from mass spectra, food composition, and species taxonomy could boost the annotation of mass spectra by embedding ingredients with similar chemical composition and genomic profile close to one another, as sentences with a similar meaning. The availability of considerable computational resources and curation of large-scale repositories of food composition data and mass spectra will be essential in order to include nutrition in the ongoing LLM scientific revolution. We hope that this review will stimulate more interest and collaboration among researchers, practitioners, and policy makers in advancing the mapping of the DMN, helping us unveil the precise role each food molecule plays in our health, and leading to novel drugs and therapies.
Acknowledgments
This work was supported, in part, by National Institutes of Health (NIH) grants U01 HG007691, R01 HL155107, and R01 HL 155096 (Co-I) to J.L.; American Heart Association grants AHA9577729, 24MERIT 1185447, and European Union (EU) Horizon Health 2021 101057619 to J.L.; and 24MERIT 1185447 (Co-I) to G.M. G.M. is supported by NIH/NHLBI grant K25HL173665. A.-L.B. is supported by the Veteran’s Affairs Medical Center of Boston contract 36C24122N0769 and the EU’s Horizon 2020 research and innovation program under grant agreement 810115-DYNASNET.
The authors thank Michael Sebek for helpful discussions on mass spectrometry and food databases, Gordana Ispirova for helpful discussions on natural language processing and large language models, Daria Koshkina for help with the illustration design, and Stephanie Tribuna for expert technical assistance.
DISCLOSURE STATEMENT
A.-L.B. and J.L. are scientific cofounders of Scipher Medicine, Inc., which focuses on network medicine approaches to disease biomarker and drug target discovery. This research was supported in part by a Scipher-sponsored research agreement at Northeastern University (21-C-01472). G.M. is not aware of any affiliations, memberships, funding, or financial holdings that might be perceived as affecting the objectivity of this review.
LITERATURE CITED
- 1.Adjibade M, Julia C, Allès B, Touvier M, Lemogne C, et al. 2019. Prospective association between ultra-processed food consumption and incident depressive symptoms in the French NutriNet-Santé cohort. BMC Med. 17(1):78. [DOI] [PMC free article] [PubMed] [Google Scholar]
- 2.Afendi FM, Okada T, Yamazaki M, Hirai-Morita A, Nakamura Y, et al. 2012. KNApSAcK family databases: integrated metabolite–plant species databases for multifaceted plant research. Plant Cell Physiol. 53(2):e1. [DOI] [PubMed] [Google Scholar]
- 3.Aguilera JM. 2019. The food matrix: implications in processing, nutrition and health. Crit. Rev. Food Sci. Nutr 59(22):3612–29 [DOI] [PubMed] [Google Scholar]
- 4.Alonso-Pedrero L, Ojeda-Rodríguez A, Martínez-González MA, Zalba G, Bes-Rastrollo M, Marti A. 2020. Ultra-processed food consumption and the risk of short telomeres in an elderly population of the Seguimiento Universidad de Navarra (SUN) Project. Am. J. Clin. Nutr 111(6):1259–66 [DOI] [PubMed] [Google Scholar]
- 5.Int AOAC. 2023. Official Methods of Analysis of AOAC International, Vols. 1–2. Washington, DC: Oxford Univ. Press. 22nd ed. [Google Scholar]
- 6.Ara T, Sakurai N, Takahashi S, Waki N, Suganuma H, et al. 2021. TOMATOMET: A metabolome database consists of 7118 accurate mass values detected in mature fruits of 25 tomato cultivars. Plant Direct 5(4):e00318. [DOI] [PMC free article] [PubMed] [Google Scholar]
- 7.Aronica L, Levine AJ, Brennan K, Mi J, Gardner C, et al. 2017. A systematic review of studies of DNA methylation in the context of a weight loss intervention. Epigenomics 9(5):769–87 [DOI] [PubMed] [Google Scholar]
- 8.Baldridge AS, Huffman MD, Taylor F, Xavier D, Bright B, et al. 2019. The healthfulness of the US packaged food and beverage supply: a cross-sectional study. Nutrients 11(8):1704. [DOI] [PMC free article] [PubMed] [Google Scholar]
- 9.Banerjee P, Erehman J, Gohlke B-O, Wilhelm T, Preissner R, Dunkel M. 2015. Super Natural II: a database of natural products. Nucleic Acids Res. 43(D1):D935–39 [DOI] [PMC free article] [PubMed] [Google Scholar]
- 10.Bar-Even A, Noor E, Flamholz A, Buescher JM, Milo R. 2011. Hydrophobicity and charge shape cellular metabolite concentrations. PLOS Comput. Biol 7(10):e1002166. [DOI] [PMC free article] [PubMed] [Google Scholar]
- 11.Barabási A-L. 2016. Network Science. Cambridge, UK: Cambridge Univ. Press [Google Scholar]
- 12.Barabási A-L, Gulbahce N, Loscalzo J. 2011. An integrative systems medicine approach to mapping human metabolic diseases. Nat. Rev. Genet 12(1):56–68 [DOI] [PMC free article] [PubMed] [Google Scholar]
- 13.Barabási A-L, Menichetti G, Loscalzo J. 2020. The unmapped chemical complexity of our diet. Nat. Food 1(1):33–37 [Google Scholar]
- 14.Barabási AL, Gulbahce N, Loscalzo J. 2011. Network medicine: a network-based approach to human disease. Nat. Rev. Genet 12(1):56–68 [DOI] [PMC free article] [PubMed] [Google Scholar]
- 15.Belanger D, Colwell LJ. 2023. Hallucinating functional protein sequences. Nat. Biotechnol 41(8):1073–74 [DOI] [PubMed] [Google Scholar]
- 16.Berry SEE, Tydeman EA, Lewis HB, Phalora R, Rosborough J, et al. 2008. Manipulation of lipid bioaccessibility of almond seeds influences postprandial lipemia in healthy human subjects. Am. J. Clin. Nutr 88(4):922–29 [DOI] [PubMed] [Google Scholar]
- 17.Bertelli A, Biagi M, Corsini M, Baini G, Cappellucci G, Miraldi E. 2021. Polyphenols: from theory to practice. Foods 10(11):2595. [DOI] [PMC free article] [PubMed] [Google Scholar]
- 18.Beslay M, Srour B, Méjean C, Allès B, Fiolet T, et al. 2020. Ultra-processed food intake in association with BMI change and risk of overweight and obesity: a prospective analysis of the French NutriNet-Santé cohort. PLOS Med. 17(8):e1003256. [DOI] [PMC free article] [PubMed] [Google Scholar]
- 19.Birhane A, Kasirzadeh A, Leslie D, Wachter S. 2023. Science in the age of large language models. Nat. Rev. Phys 5(5):277–80 [Google Scholar]
- 20.Blasco T, Pérez-Burillo S, Balzerani F, Hinojosa-Nogueira D, Lerma-Aguilera A, et al. 2021. An extended reconstruction of human gut microbiota metabolism of dietary compounds. Nat. Commun 12:4728. [DOI] [PMC free article] [PubMed] [Google Scholar]
- 21.Bose C, Alves I, Singh P, Palade PT, Carvalho E, et al. 2020. Sulforaphane prevents age-associated cardiac and muscular dysfunction through Nrf2 signaling. Aging Cell 19(11):e13261. [DOI] [PMC free article] [PubMed] [Google Scholar]
- 22.Braesco V, Souchon I, Sauvant P, Haurogné T, Maillot M, et al. 2022. Ultra-processed foods: How functional is the NOVA system? Eur. J. Clin. Nutr 76:1245–53 [DOI] [PMC free article] [PubMed] [Google Scholar]
- 23.Callaway E 2022. AlphaFold’s new rival? Meta AI predicts shape of 600 million proteins. Nature 611(7935):211–12 [DOI] [PubMed] [Google Scholar]
- 24.Capuano E, Oliviero T, van Boekel MAJS. 2018. Modeling food matrix effects on chemical reactivity: challenges and perspectives. Crit. Rev. Food Sci. Nutr 58(16):2814–28 [DOI] [PubMed] [Google Scholar]
- 25.Cenikj G, Popovski G, Stojanov R, Seljak BK, Eftimov T. 2020. BuTTER: bidirectional LSTM for food named-entity recognition. In 2020 IEEE International Conference on Big Data (Big Data), pp. 3550–56. Piscataway, NJ: IEEE [Google Scholar]
- 26.Chareonrungrueangchai K, Wongkawinwoot K, Anothaisintawee T, Reutrakul S. 2020. Dietary factors and risks of cardiovascular diseases: an umbrella review. Nutrients 12(4):1088. [DOI] [PMC free article] [PubMed] [Google Scholar]
- 27.Chatterjee A, Walters R, Shafi Z, Ahmed OS, Sebek M, et al. 2023. Improving the generalizability of protein-ligand binding predictions with AI-Bind. Nat. Commun 14:1989. [DOI] [PMC free article] [PubMed] [Google Scholar]
- 28.Chen L, Lu W, Wang L, Xing X, Chen Z, et al. 2021. Metabolite discovery through global annotation of untargeted metabolomics data. Nat. Methods 18(11):1377–85 [DOI] [PMC free article] [PubMed] [Google Scholar]
- 29.Chen X, Zhang Z, Yang H, Qiu P, Wang H, et al. 2020. Consumption of ultra-processed foods and health outcomes: a systematic review of epidemiological studies. Nutr. J 19(1):86. [DOI] [PMC free article] [PubMed] [Google Scholar]
- 30.Cheng F, Desai RJ, Handy DE, Wang R, Schneeweiss S, et al. 2018. Network-based approach to prediction and population-based validation of in silico drug repurposing. Nat. Commun 9:2691. [DOI] [PMC free article] [PubMed] [Google Scholar]
- 31.Cheng F, Kovács IA, Barabási AL. 2019. Network-based prediction of drug combinations. Nat. Commun 10:1197. [DOI] [PMC free article] [PubMed] [Google Scholar]
- 32.Corbin KD, Carnero EA, Dirks B, Igudesman D, Yi F, et al. 2023. Host-diet-gut microbiome interactions influence human energy balance: a randomized clinical trial. Nat. Commun 14:3161. [DOI] [PMC free article] [PubMed] [Google Scholar]
- 33.Cordain L, Eaton SB, Sebastian A, Mann N, Lindeberg S, et al. 2005. Origins and evolution of the Western diet: health implications for the 21st century. Am. J. Clin. Nutr 81(2):341–54 [DOI] [PubMed] [Google Scholar]
- 34.D’Archivio M, Filesi C, Varì R, Scazzocchio B, Masella R. 2010. Bioavailability of the polyphenols: status and controversies. Int. J. Mol. Sci 11(4):1321–42 [DOI] [PMC free article] [PubMed] [Google Scholar]
- 35.Da Silva Oliveira MS, Silva-Amparo L. 2018. Food-based dietary guidelines: a comparative analysis between the Dietary Guidelines for the Brazilian Population 2006 and 2014. Public Health Nutr. 21(1):210–17 [DOI] [PMC free article] [PubMed] [Google Scholar]
- 36.Davis AP, Wiegers TC, Johnson RJ, Sciaky D, Wiegers J, Mattingly CJ. 2023. Comparative Toxicogenomics Database (CTD): update 2023. Nucleic Acids Res. 51(D1):D1257–62 [DOI] [PMC free article] [PubMed] [Google Scholar]
- 37.Debras C, Chazelas E, Sellem L, Porcher R, Druesne-Pecollo N, et al. 2022. Artificial sweeteners and risk of cardiovascular diseases: results from the prospective NutriNet-Santé cohort. BMJ 378:e071204. [DOI] [PMC free article] [PubMed] [Google Scholar]
- 38.do Valle IF, Roweth HG, Malloy MW, Moco S, Barron D, et al. 2021. Network medicine framework shows that proximity of polyphenol targets and disease proteins predicts therapeutic effects of polyphenols. Nat. Food 2(3):143–55 [DOI] [PubMed] [Google Scholar]
- 39.Dooley DM, Griffiths EJ, Gosal GS, Buttigieg PL, Hoehndorf R, et al. 2018. FoodOn: a harmonized food ontology to increase global food traceability, quality control and data integration. npj Sci. Food 2:23. [DOI] [PMC free article] [PubMed] [Google Scholar]
- 40.Drew Bennett WF, He S, Bilodeau CL, Jones D, Sun D, et al. 2020. Predicting small molecule transfer free energies by combining molecular dynamics simulations and deep learning. J. Chem. Inf. Model 60(11):5375–81 [DOI] [PubMed] [Google Scholar]
- 41.Dührkop K, Fleischauer M, Ludwig M, Aksenov AA, Melnik AV, et al. 2019. SIRIUS 4: a rapid tool for turning tandem mass spectra into metabolite structure information. Nat. Methods 16(4):299–302 [DOI] [PubMed] [Google Scholar]
- 42.Eaton SB. 2006. The ancestral human diet: What was it and should it be a paradigm for contemporary nutrition? Proc. Nutr. Soc 65(1):1–6 [DOI] [PubMed] [Google Scholar]
- 43.EFSA (Eur. Food Saf. Auth.). 2015. The Food Classification and Description System FoodEx2 (revision 2). Tech. Rep., Support. Publ. 2015–804E, EFSA, Parma, Italy. https://efsa.onlinelibrary.wiley.com/doi/epdf/10.2903/sp.efsa.2015.EN-804 [Google Scholar]
- 44.EFSA (Eur. Food Saf. Auth.). 2020. Food classification standardization—the FoodEx2 system. Fact Sheet, EFSA, Parma, Italy. https://www.efsa.europa.eu/en/data/data-standardisation [Google Scholar]
- 45.Elgart V, Loscalzo J. 2023. Local generation and efficient evaluation of numerous drug combinations in a single sample. eLife 12:e85439. [DOI] [PMC free article] [PubMed] [Google Scholar]
- 46.Evans PC. 2011. The influence of sulforaphane on vascular health and its relevance to nutritional approaches to prevent cardiovascular disease. EPMA J. 2(1):9–14 [DOI] [PMC free article] [PubMed] [Google Scholar]
- 47.Fardet A, Rock E, Bassama J, Bohuon P, Prabhasankar P, et al. 2015. Current food classifications in epidemiological studies do not enable solid nutritional recommendations for preventing diet-related chronic diseases: the impact of food processing. Adv. Nutr 6(6):629–38 [DOI] [PMC free article] [PubMed] [Google Scholar]
- 48.Fernandes AC, Rieger DK, Proença RPC. 2019. Public health nutrition policies should focus on healthy eating, not on calorie counting, even to decrease obesity. Adv. Nutr 10(4):549–56 [DOI] [PMC free article] [PubMed] [Google Scholar]
- 49.Fiolet T, Srour B, Sellem L, Kesse-Guyot E, Allès B, et al. 2018. Consumption of ultra-processed foods and cancer risk: results from NutriNet-Santé prospective cohort. BMJ 360:k322. [DOI] [PMC free article] [PubMed] [Google Scholar]
- 50.Fukagawa NK, McKillop K, Pehrsson PR, Moshfegh A, Harnly J, Finley J. 2022. USDA’s FoodData Central: What is it and why is it needed today? Am. J. Clin. Nutr 115(3):619–24 [DOI] [PubMed] [Google Scholar]
- 51.Fung TT, Willett WC, Stampfer MJ, Manson JAE, Hu FB. 2001. Dietary patterns and the risk of coronary heart disease in women. Arch. Intern. Med 161(15):1857–62 [DOI] [PubMed] [Google Scholar]
- 52.Ghiassian SD, Menche J, Barabási A-L. 2015. A DIseAse MOdule Detection (DIAMOnD) algorithm derived from a systematic analysis of connectivity patterns of disease proteins in the human interactome. PLOS Comput. Biol 11(4):e1004120. [DOI] [PMC free article] [PubMed] [Google Scholar]
- 53.Ghiassian SD, Menche J, Chasman DI, Giulianini F, Wang R, et al. 2016. Endophenotype network models: common core of complex diseases. Sci. Rep 6:27414. [DOI] [PMC free article] [PubMed] [Google Scholar]
- 54.Gibney MJ, Forde CG. 2022. Nutrition research challenges for processed food and health. Nat. Food 3:104–9 [DOI] [PubMed] [Google Scholar]
- 55.Grassby T, Mandalari G, Grundy MML, Edwards CH, Bisignano C, et al. 2017. In vitro and in vivo modeling of lipid bioaccessibility and digestion from almond muffins: the importance of the cell-wall barrier mechanism. J. Funct. Foods 37:263–71 [DOI] [PMC free article] [PubMed] [Google Scholar]
- 56.Guney E, Menche J, Vidal M, Barábasi AL. 2016. Network-based in silico drug efficacy screening. Nat. Commun 7:10331. [DOI] [PMC free article] [PubMed] [Google Scholar]
- 57.Halgren TA, Murphy RB, Friesner RA, Beard HS, Frye LL, et al. 2004. Glide: a new approach for rapid, accurate docking and scoring. 2. Enrichment factors in database screening. J. Med. Chem 47(7):1750–59 [DOI] [PubMed] [Google Scholar]
- 58.Haut Cons. Santé Publique. 2018. Avis relatif aux objectifs de santé publique quantifiés pour la politique nutritionnelle de santé publique (PNNS) 2018–2022. Rep., HCSP, Paris, France. https://www.hcsp.fr/Explore.cgi/avisrapportsdomaine?clefr=648 [Google Scholar]
- 59.Hooton F, Menichetti G, Barabási A-L. 2020. Exploring food contents in scientific literature with FoodMine. Sci. Rep 10:16191. [DOI] [PMC free article] [PubMed] [Google Scholar]
- 60.Hu FB. 2002. Dietary pattern analysis: a new direction in nutritional epidemiology. Curr. Opin. Lipidol 13(1):3–9 [DOI] [PubMed] [Google Scholar]
- 61.Huang K, Fu T, Glass LM, Zitnik M, Xiao C, Sun J. 2021. DeepPurpose: a deep learning library for drug-target interaction prediction. Bioinformatics 36(22/23):5545–47 [DOI] [PMC free article] [PubMed] [Google Scholar]
- 62.Huang K, Xiao C, Glass LM, Sun J. 2021. MolTrans: molecular interaction transformer for drug–target interaction prediction. Bioinformatics 37(6):830–36 [DOI] [PMC free article] [PubMed] [Google Scholar]
- 63.Huttlin EL, Bruckner RJ, Navarrete-Perea J, Cannon JR, Baltier K, et al. 2021. Dual proteome-scale networks reveal cell-specific remodeling of the human interactome. Cell 184(11):3022–40.e28 [DOI] [PMC free article] [PubMed] [Google Scholar]
- 64.Ioannidis JPA. 2005. Why most published research findings are false. PLOS Med. 2(8):e124. [DOI] [PMC free article] [PubMed] [Google Scholar]
- 65.Ioannidis JPA. 2018. The challenge of reforming nutritional epidemiologic research. JAMA 320(10):969–70 [DOI] [PubMed] [Google Scholar]
- 66.Irwin JJ, Tang KG, Young J, Dandarchuluun C, Wong BR, et al. 2020. ZINC20—a free ultralarge-scale chemical database for ligand discovery. J. Chem. Inf. Model 60(12):6065–73 [DOI] [PMC free article] [PubMed] [Google Scholar]
- 67.Janda M, Seah BKB, Jakob D, Beckmann J, Geier B, Liebeke M. 2021. Determination of abundant metabolite matrix adducts illuminates the dark metabolome of MALDI–mass spectrometry imaging datasets. Anal. Chem 93(24):8399–407 [DOI] [PMC free article] [PubMed] [Google Scholar]
- 68.Jeong H, Tombor B, Albert R, Oltvai ZN, Barabási AL. 2000. The large-scale organization of metabolic networks. Nature 407(6804):651–54 [DOI] [PubMed] [Google Scholar]
- 69.Jew S, Abumweis SS, Jones PJH. 2009. Evolution of the human diet: linking our ancestral diet to modern functional foods as a means of chronic disease prevention. J. Med. Food 12(5):925–34 [DOI] [PubMed] [Google Scholar]
- 70.Johnston N 2004. Sulforaphane halts breast cancer cell growth. Drug Discov. Today 9(21):908. [DOI] [PubMed] [Google Scholar]
- 71.Kalakoti Y, Yadav S, Sundar D. 2022. TransDTI: transformer-based language models for estimating DTIs and building a drug recommendation workflow. ACS Omega 7(3):2706–17 [DOI] [PMC free article] [PubMed] [Google Scholar]
- 72.Katidi A, Vlassopoulos A, Noutsos S, Kapsokefalou M. 2023. Ultra-processed foods in the Mediterranean diet according to the NOVA classification system; a food level analysis of branded foods in Greece. Foods 12(7):1520. [DOI] [PMC free article] [PubMed] [Google Scholar]
- 73.Kaufman-Szymczyk A, Majewski G, Lubecka-Pietruszewska K, Fabianowska-Majewska K. 2015. The role of sulforaphane in epigenetic mechanisms, including interdependence between histone modification and DNA methylation. Int. J. Mol. Sci 16(12):29732–43 [DOI] [PMC free article] [PubMed] [Google Scholar]
- 74.Kelli HM, Kim JH, Tahhan AS, Liu C, Ko YA, et al. 2019. Living in food deserts and adverse cardiovascular outcomes in patients with cardiovascular disease. J. Am. Heart Assoc 8(4):e010694. [DOI] [PMC free article] [PubMed] [Google Scholar]
- 75.Khera AV, Emdin CA, Drake I, Natarajan P, Bick AG, et al. 2016. Genetic risk, adherence to a healthy lifestyle, and coronary disease. N. Engl. J. Med 375(24):2349–58 [DOI] [PMC free article] [PubMed] [Google Scholar]
- 76.Kiely M, Black LJ, Plumb J, Kroon PA, Hollman PC, et al. 2010. EuroFIR eBASIS: application for health claims submissions and evaluations. Eur. J. Clin. Nutr 64(Suppl. 3):S101–7 [DOI] [PubMed] [Google Scholar]
- 77.Kolonel LN, Yoshizawa CN, Hankin JH. 1988. Diet and prostatic cancer: a case-control study in Hawaii. Am. J. Epidemiol 127(5):999–1012 [DOI] [PubMed] [Google Scholar]
- 78.Koscielny G, An P, Carvalho-Silva D, Cham JA, Fumis L, et al. 2017. OpenTargets: a platform for therapeutic target identification and validation. Nucleic Acids Res. 45(D1):D985–94 [DOI] [PMC free article] [PubMed] [Google Scholar]
- 79.Kubo R, Ichimura H, Usui T, Hashitsume N. 1990. Statistical Mechanics. Amsterdam: North-Holland [Google Scholar]
- 80.Kuhn M, Szklarczyk D, Pletscher-Frankild S, Blicher TH, Von Mering C, et al. 2014. STITCH 4: integration of protein–chemical interactions with user data. Nucleic Acids Res. 42(D1):D401–7 [DOI] [PMC free article] [PubMed] [Google Scholar]
- 81.Lacroix S, Klicic Badoux J, Scott-Boyer MP, Parolo S, Matone A, et al. 2018. A computationally driven analysis of the polyphenol–protein interactome. Sci. Rep 8:2232. [DOI] [PMC free article] [PubMed] [Google Scholar]
- 82.Lane MM, Davis JA, Beattie S, Gómez-Donoso C, Loughman A, et al. 2020. Ultraprocessed food and chronic noncommunicable diseases: a systematic review and meta-analysis of 43 observational studies. Obes. Rev 22(3):e13146. [DOI] [PubMed] [Google Scholar]
- 83.Le Marchand L, Hankin JH, Kolonel LN, Wilkens LR. 1991. Vegetable and fruit consumption in relation to prostate cancer risk in Hawaii: a reevaluation of the effect of dietary β-carotene. Am. J. Epidemiol 133(3):215–19 [DOI] [PubMed] [Google Scholar]
- 84.Li Y, Zhang T, Korkaya H, Liu S, Lee H-F, et al. 2010. Sulforaphane, a dietary component of broccoli/broccoli sprouts, inhibits breast cancer stem cells. Clin. Cancer Res 16(9):2580–90 [DOI] [PMC free article] [PubMed] [Google Scholar]
- 85.Liu T, Lin Y, Wen X, Jorissen RN, Gilson MK. 2007. BindingDB: a web-accessible database of experimentally determined protein-ligand binding affinities. Nucleic Acids Res. 35(Suppl. 1):D198–201 [DOI] [PMC free article] [PubMed] [Google Scholar]
- 86.Loscalzo J, Barabási A-L, Silverman EK. 2017. Network Medicine: Complex Systems in Human Disease and Therapeutics. Cambridge, MA: Harvard Univ. Press [Google Scholar]
- 87.Luck K, Kim DK, Lambourne L, Spirohn K, Begg BE, et al. 2020. A reference map of the human binary protein interactome. Nature 580(7803):402–8 [DOI] [PMC free article] [PubMed] [Google Scholar]
- 88.Madani A, Krause B, Greene ER, Subramanian S, Mohr BP, et al. 2023. Large language models generate functional protein sequences across diverse families. Nat. Biotechnol 41(8):1099–106 [DOI] [PMC free article] [PubMed] [Google Scholar]
- 89.Mallmann LP, O Rios A, Rodrigues E. 2023. MS-FINDER and SIRIUS for phenolic compound identification from high-resolution mass spectrometry data. Food Res. Int 163:112315. [DOI] [PubMed] [Google Scholar]
- 90.Mandalari G, Parker ML, Grundy MML, Grassby T, Smeriglio A, et al. 2018. Understanding the effect of particle size and processing on almond lipid bioaccessibility through microstructural analysis: from mastication to faecal collection. Nutrients 10(2):213. [DOI] [PMC free article] [PubMed] [Google Scholar]
- 91.Maron BA, Wang RS, Shevtsov S, Drakos SG, Arons E, et al. 2021. Individualized interactomes for network-based precision medicine in hypertrophic cardiomyopathy with implications for other clinical pathophenotypes. Nat. Commun 12:873. [DOI] [PMC free article] [PubMed] [Google Scholar]
- 92.Mazzio EA, Soliman KFA. 2014. Epigenetics and nutritional environmental signals. Integr. Comp. Biol 54(1):21. [DOI] [PMC free article] [PubMed] [Google Scholar]
- 93.Medvedeva YA, Lennartsson A, Ehsani R, Kulakovskiy IV, Vorontsov IE, et al. 2015. EpiFactors: a comprehensive database of human epigenetic factors and complexes. Database 2015:bav067. [DOI] [PMC free article] [PubMed] [Google Scholar]
- 94.Menche J, Sharma A, Kitsak M, Ghiassian SD, Vidal M, et al. 2015. Uncovering disease-disease relationships through the incomplete interactome. Science 347(6224):1257601. [DOI] [PMC free article] [PubMed] [Google Scholar]
- 95.Mendez D, Gaulton A, Bento AP, Chambers J, De Veij M, et al. 2019. ChEMBL: towards direct deposition of bioassay data. Nucleic Acids Res. 47(D1):D930–40 [DOI] [PMC free article] [PubMed] [Google Scholar]
- 96.Menichetti G, Barabási AL. 2022. Nutrient concentrations in food display universal behaviour. Nat. Food 3(5):375–82 [DOI] [PubMed] [Google Scholar]
- 97.Menichetti G, Ravandi B, Mozaffarian D, Barabási A-L. 2023. Machine learning prediction of the degree of food processing. Nat. Commun 14:2312. [DOI] [PMC free article] [PubMed] [Google Scholar]
- 98.Mensink RP, Zock PL, Kester ADM, Katan MB. 2003. Effects of dietary fatty acids and carbohydrates on the ratio of serum total to HDL cholesterol and on serum lipids and apolipoproteins: a meta-analysis of 60 controlled trials. Am. J. Clin. Nutr 77(5):1146–55 [DOI] [PubMed] [Google Scholar]
- 99.Micha R, Wallace SK, Mozaffarian D. 2010. Red and processed meat consumption and risk of incident coronary heart disease, stroke, and diabetes mellitus: a systematic review and meta-analysis. Circulation 121(21):2271–83 [DOI] [PMC free article] [PubMed] [Google Scholar]
- 100.Milanlouei S, Menichetti G, Li Y, Loscalzo J, Willett WC, Barabási AL. 2020. A systematic comprehensive longitudinal evaluation of dietary factors associated with acute myocardial infarction and fatal coronary heart disease. Nat. Commun 11:6074. [DOI] [PMC free article] [PubMed] [Google Scholar]
- 101.Monteiro CA, Cannon G, Lawrence M, Louzada Costa ML, Pereira Machado P. 2019. Ultra-processed foods, diet quality, and health using the NOVA classification system. Rep., Food Agric. Organ., Rome. https://www.fao.org/3/ca5644en/ca5644en.pdf [Google Scholar]
- 102.Monteiro CA, Cannon G, Moubarac JC, Levy RB, Louzada Costa ML, Jaime PC. 2018. The UN Decade of Nutrition, the NOVA food classification and the trouble with ultra-processing. Public Health Nutr. 21(1):5–17 [DOI] [PMC free article] [PubMed] [Google Scholar]
- 103.Moubarac J-C, Parra DC, Cannon G, Monteiro CA. 2014. Food classification systems based on food processing. Significance and implications for policies and actions: a systematic literature review and assessment. Curr. Obes Rep 3(2):256–72 [DOI] [PubMed] [Google Scholar]
- 104.Mozaffarian D, Clarke R. 2009. Quantitative effects on cardiovascular risk factors and coronary heart disease risk of replacing partially hydrogenated vegetable oils with other fats and oils. Eur. J. Clin. Nutr 63(Suppl. 2):22–33 [DOI] [PubMed] [Google Scholar]
- 105.Mozaffarian D, Fleischhacker S, Andrés JR. 2021. Prioritizing nutrition security in the US. JAMA 325(16):1605–6 [DOI] [PubMed] [Google Scholar]
- 106.Mozaffarian D, Rosenberg I, Uauy R. 2018. History of modern nutrition science—implications for current research, dietary guidelines, and food policy. BMJ 361:k2392. [DOI] [PMC free article] [PubMed] [Google Scholar]
- 107.Naimi S, Viennois E, Gewirtz AT, Chassaing B. 2021. Direct impact of commonly used dietary emulsifiers on human gut microbiota. Microbiome 9:66. [DOI] [PMC free article] [PubMed] [Google Scholar]
- 108.Nasirian F, Menichetti G. 2023. Molecular interaction networks and cardiovascular disease risk: the role of food bioactive small molecules. Arterioscler. Thromb. Vasc. Biol 43:813–23 [DOI] [PubMed] [Google Scholar]
- 109.Natl. Food Inst. 2016. Frida, version 2, Tech. Univ. Denmark, Lyngby, updated Nov. 30, 2023. https://frida.fooddata.dk/
- 110.Novotny JA, Gebauer SK, Baer DJ. 2012. Discrepancy between the Atwater factor predicted and empirically measured energy values of almonds in human diets. Am. J. Clin. Nutr 96(2):296–301 [DOI] [PMC free article] [PubMed] [Google Scholar]
- 111.Ofaim S, Menichetti G, Sebek M, Barabási A-L. 2022. Genomics-based annotations help unveil the molecular composition of edible plants. bioRxiv 2022.01.24.477528. 10.1101/2022.01.24.477528 [DOI] [Google Scholar]
- 112.Paci P, Fiscon G, Conte F, Wang RS, Handy DE, et al. 2022. Comprehensive network medicine-based drug repositioning via integration of therapeutic efficacy and side effects. npj Syst. Biol. Appl 8(1):12. [DOI] [PMC free article] [PubMed] [Google Scholar]
- 113.Pagliai G, Dinu M, Madarena MP, Bonaccio M, Iacoviello L, Sofi F. 2021. Consumption of ultra-processed foods and health status: a systematic review and meta-analysis. Br. J. Nutr 125(3):308–18 [DOI] [PMC free article] [PubMed] [Google Scholar]
- 114.PAHO (Pan Am. Health Organ.), WHO (World Health Organ.). 2019. Ultra-processed food and drink products in Latin America: trends, impact on obesity, policy implications. Rep., PAHO, Washington, DC. https://iris.paho.org/handle/10665.2/51094 [Google Scholar]
- 115.Patel CJ, Ioannidis JPA. 2014. Studying the elusive environment in large scale. JAMA 311(21):2173–74 [DOI] [PMC free article] [PubMed] [Google Scholar]
- 116.Patel CJ, Manrai AK. 2015. Development of exposome correlation globes to map out environment-wide associations. Pac. Symp. Biocomput 20:231–42 [PMC free article] [PubMed] [Google Scholar]
- 117.Patten JJ, Keiser PT, Morselli-Gysi D, Menichetti G, Mori H, et al. 2022. Identification of potent inhibitors of SARS-CoV-2 infection by combined pharmacological evaluation and cellular network prioritization. iScience 25(9):104925. [DOI] [PMC free article] [PubMed] [Google Scholar]
- 118.Pence HE, Williams A. 2010. ChemSpider: an online chemical information resource. J. Chem. Educ 87(11):1123–24 [Google Scholar]
- 119.Placzek S, Schomburg I, Chang A, Jeske L, Ulbrich M, et al. 2017. BRENDA in 2017: new perspectives and new tools in BRENDA. Nucleic Acids Res. 45(D1):D380–88 [DOI] [PMC free article] [PubMed] [Google Scholar]
- 120.Popovski G, Seljak BK, Eftimov T. 2019. FoodBase corpus: a new resource of annotated food entities. Database 2019:baz121. [DOI] [PMC free article] [PubMed] [Google Scholar]
- 121.Raikos V 2017. Food matrix: natural barrier or vehicle for effective delivery of carotenoids from processed foods? Insights Nutr. Metab 1(1):3–8 [Google Scholar]
- 122.Ravandi B, Mehler P, Barabási A-L, Menichetti G. 2022. GroceryDB: prevalence of processed food in grocery stores. medRxiv 2022.04.23.22274217. 10.1101/2022.04.23.22274217 [DOI] [PMC free article] [PubMed] [Google Scholar]
- 123.Rees JS, Castellano S, Andrés AM. 2020. The genomics of human local adaptation. Trends Genet. 36(6):415–28 [DOI] [PubMed] [Google Scholar]
- 124.Rothwell JA, Perez-Jimenez J, Neveu V, Medina-Remón A, M’Hiri N, et al. 2013. Phenol-Explorer 3.0: a major update of the Phenol-Explorer database to incorporate data on the effects of food processing on polyphenol content. Database 2013:bat070. [DOI] [PMC free article] [PubMed] [Google Scholar]
- 125.Ruiz-Carmona S, Alvarez-Garcia D, Foloppe N, Garmendia-Doval AB, Juhos S, et al. 2014. rDock: a fast, versatile and open source program for docking ligands to proteins and nucleic acids. PLOS Comput. Biol 10(4):e1003571. [DOI] [PMC free article] [PubMed] [Google Scholar]
- 126.Sadler CR, Grassby T, Hart K, Raats M, Sokolović M, Timotijevic L. 2021. Processed food classification: conceptualisation and challenges. Trends Food Sci. Technol 112:149–62 [Google Scholar]
- 127.Sebek M, Menichetti G. 2024. Network science and machine learning for precision nutrition. In Precision Nutrition, ed Heber D, Li Z, Ordovas J, pp. 367–402. Cambridge, MA: Academic Press [Google Scholar]
- 128.Sebek ML, Menichetti G, Barabási A-L. 2022. Estimating nutrient concentration in food using untargeted metabolomics. bioRxiv 2022.12.02.518912. 10.1101/2022.12.02.518912 [DOI] [Google Scholar]
- 129.Sellem L, Srour B, Javaux G, Chazelas E, Chassaing B, et al. 2023. Food additive emulsifiers and risk of cardiovascular disease in the NutriNet-Santé cohort: prospective cohort study. BMJ 382:e076058. [DOI] [PMC free article] [PubMed] [Google Scholar]
- 130.Sensoy I 2014. A review on the relationship between food structure, processing, and bioavailability. Crit. Rev. Food Sci. Nutr 54(7):902–9 [DOI] [PubMed] [Google Scholar]
- 131.Sharma A, Menche J, Chris Huang C, Ort T, Zhou X, et al. 2014. A disease module in the interactome explains disease heterogeneity, drug response and captures novel pathways and genes in asthma. Hum. Mol. Genet 24(11):3005–20 [DOI] [PMC free article] [PubMed] [Google Scholar]
- 132.Shrivastava AD, Swainston N, Samanta S, Roberts I, Muelas MW, Kell DB. 2021. MassGenie: a transformer-based deep learning method for identifying small molecules from their mass spectra. Biomolecules 11(12):1793. [DOI] [PMC free article] [PubMed] [Google Scholar]
- 133.Slimani N, Deharveng G, Southgate DAT, Biessy C, Chajès V, et al. 2009. Contribution of highly industrially processed foods to the nutrient intakes and patterns of middle-aged populations in the European Prospective Investigation into Cancer and Nutrition study. Eur. J. Clin. Nutr 63(Suppl. 4):206–25 [DOI] [PubMed] [Google Scholar]
- 134.Smith CA, O’Maille G, Want EJ, Qin C, Trauger SA, et al. 2005. METLIN: a metabolite mass spectral database. Ther. Drug Monit 27(6):747–51 [DOI] [PubMed] [Google Scholar]
- 135.Sorokina M, Merseburger P, Rajan K, Yirik MA, Steinbeck C. 2021. COCONUT online: Collection of Open Natural Products database. J. Cheminform 13:2. [DOI] [PMC free article] [PubMed] [Google Scholar]
- 136.Souza AL, Patti GJ. 2021. A protocol for untargeted metabolomic analysis: from sample preparation to data processing. Methods Mol. Biol 2276:357–82 [DOI] [PMC free article] [PubMed] [Google Scholar]
- 137.Srour B, Fezeu LK, Kesse-Guyot E, Allès B, Debras C, et al. 2020. Ultraprocessed food consumption and risk of type 2 diabetes among participants of the NutriNet-Santé prospective cohort. JAMA Intern. Med 180(2):283–91 [DOI] [PMC free article] [PubMed] [Google Scholar]
- 138.Srour B, Fezeu LK, Kesse-Guyot E, Allès B, Méjean C, et al. 2019. Ultra-processed food intake and risk of cardiovascular disease: prospective cohort study (NutriNet-Santé). BMJ 365:l1451. [DOI] [PMC free article] [PubMed] [Google Scholar]
- 139.Stojanov R, Popovski G, Cenikj G, Seljak BK, Eftimov T. 2021. A fine-tuned bidirectional encoder representations from transformers model for food named-entity recognition: algorithm development and validation. J. Med. Internet Res 23(8):e28229. [DOI] [PMC free article] [PubMed] [Google Scholar]
- 140.Stricker T, Bonner R, Lisacek F, Hopfgartner G. 2021. Adduct annotation in liquid chromatography/high-resolution mass spectrometry to enhance compound identification. Anal. Bioanal. Chem 413:503–17 [DOI] [PMC free article] [PubMed] [Google Scholar]
- 141.Suez J, Cohen Y, Valdés-Mas R, Mor U, Dori-Bachash M, et al. 2022. Personalized microbiome-driven effects of non-nutritive sweeteners on human glucose tolerance. Cell 185(18):3307–28.e19 [DOI] [PubMed] [Google Scholar]
- 142.Swain MC, Cole JM. 2016. ChemDataExtractor: a toolkit for automated extraction of chemical information from the scientific literature. J. Chem. Inf. Model 56(10):1894–904 [DOI] [PubMed] [Google Scholar]
- 143.Tang J, Tanoli ZUR, Ravikumar B, Alam Z, Rebane A, et al. 2018. Drug Target Commons: a community effort to build a consensus knowledge base for drug–target interactions. Cell Chem. Biol 25(2):224–29.e2 [DOI] [PMC free article] [PubMed] [Google Scholar]
- 144.Theodoris CV, Xiao L, Chopra A, Chaffin MD, Al Sayed ZR, et al. 2023. Transfer learning enables predictions in network biology. Nature 618(7965):616–24 [DOI] [PMC free article] [PubMed] [Google Scholar]
- 145.Tobler M 2023. Evolutionary medicine I: aging and diseases of civilization. In A Primer of Evolution, chapter 12. https://michitobler.github.io/primer-of-evolution/evolutionary-medicine-i-aging-and-diseases-of-civilization.html [Google Scholar]
- 146.Toews R 2023. The next frontier for large language models is biology. Forbes, July 16. https://www.forbes.com/sites/robtoews/2023/07/16/the-next-frontier-for-large-language-models-is-biology/ [Google Scholar]
- 147.Trott O, Olson AJ. 2010. AutoDock Vina: improving the speed and accuracy of docking with a new scoring function, efficient optimization, and multithreading. J. Comput. Chem 31(2):455–61 [DOI] [PMC free article] [PubMed] [Google Scholar]
- 148.Tsugawa H, Kind T, Nakabayashi R, Yukihira D, Saito K, et al. 2015. MS-FINDER: strategy for structure elucidation on LC-MS/MS based metabolomics by using chemo- and bioinformatics resources. In 63rd Annual Conference on Mass Spectrometry. Tsukuba, Japan: Mass Spectrom. Soc. Japan [Google Scholar]
- 149.Ungar PS. 2007. Evolution of the Human Diet: The Known, the Unknown, and the Unknowable. New York: Oxford Univ. Press [Google Scholar]
- 150.UNICEF. 2018. The state of food security and nutrition in the world 2018. Rep., UNICEF, New York. https://www.unicef.org/reports/state-food-security-and-nutrition-world-2018 [Google Scholar]
- 151.Wang D, Barabási A-L. 2021. The Science of Science. Cambridge, UK: Cambridge Univ. Press [Google Scholar]
- 152.Wang M, Carver JJ, Phelan VV, Sanchez LM, Garg N, et al. 2016. Sharing and community curation of mass spectrometry data with Global Natural Products Social Molecular Networking. Nat. Biotechnol 34(8):828–37 [DOI] [PMC free article] [PubMed] [Google Scholar]
- 153.Willett W 2013. Nutritional Epidemiology. New York: Oxford Univ. Press [Google Scholar]
- 154.Willett W, Rockström J, Loken B, Springmann M, Lang T, et al. 2019. Food in the Anthropocene: the EAT-Lancet Commission on healthy diets from sustainable food systems. Lancet 393(10170):447–92 [DOI] [PubMed] [Google Scholar]
- 155.Willett WC, Stampfer MJ, Manson JE, Colditz GA, Speizer FE, et al. 1993. Intake of trans fatty acids and risk of coronary heart disease among women. Lancet 341(8845):581–85 [DOI] [PubMed] [Google Scholar]
- 156.Wyatt P, Berry SE, Finlayson G, O’Driscoll R, Hadjigeorgiou G, et al. 2021. Postprandial glycaemic dips predict appetite and energy intake in healthy individuals. Nat. Metab 3(4):523–29 [DOI] [PMC free article] [PubMed] [Google Scholar]
- 157.Yannai S 2013. Dictionary of Food Compounds. Boca Raton, FL: CRC [Google Scholar]
- 158.Yu W, Clyne M, Khoury MJ, Gwinn M. 2009. Phenopedia and genopedia: disease-centered and gene-centered views of the evolving knowledge of human genetic associations. Bioinformatics 26(1):145–46 [DOI] [PMC free article] [PubMed] [Google Scholar]