Abstract
Sweat bees have repeatedly gained and lost eusociality, a transition from individual to group reproduction. Here, we generate chromosome-length genome assemblies for 17 species and identify genomic signatures of evolutionary trade-offs associated with transitions between social and solitary living. Both young genes and regulatory regions show enrichment for these molecular patterns. We also identify loci that show evidence of complementary signals of positive and relaxed selection linked specifically to the convergent gains and losses of eusociality in sweat bees. This includes two pleiotropic proteins that bind and transport juvenile hormone (JH) – a key regulator of insect development and reproduction. We find one of these proteins is primarily expressed in subperineurial glial cells that form the insect blood-brain barrier and that brain levels of JH vary by sociality. Our findings are consistent with a role of JH in modulating social behavior and suggest eusocial evolution was facilitated by alteration of the proteins that bind and transport JH, revealing how an ancestral, developmental hormone may have been co-opted during one of life’s major transitions. More broadly, our results highlight how evolutionary trade-offs have structured the molecular basis of eusociality in these bees and demonstrate how both directional selection and release from constraint can shape trait evolution.
Organisms situated at the inflection point of life’s major evolutionary transitions provide a powerful framework to examine the factors shaping the evolution of traits associated with these transitions1–4. Halictid bees (“sweat bees”, Hymenoptera: Halictidae) offer a unique opportunity to study the evolution of eusociality (social colonies with overlapping generations and non-productive workers), since within this group there have been two independent gains5 and a dozen losses6 of eusociality.
The term eusocial was originally coined to describe sweat bee societies7, whose colonies typically consist of a single, reproductive female and a small number of non-reproductive workers (most often ranging between 2-12 individuals, Extended Data Fig. 18). Colony sizes can be quite variable, with up to 400 workers documented in Lasioglossum marginatum colonies9. Unlike honey bees and ants, sweat bee workers are totipotent — castes are not developmentally determined and all adult females are capable of mating and reproduction in the absence of a queen10. Due to the independent gains and losses of eusociality in this group, closely related halictid species encompass a broad spectrum of social behavior, from solitary individuals that live and reproduce independently to eusocial nests where individuals cooperate to reproduce as a group, and even polymorphic species that produce both solitary and social nests2. This evolutionary replication enables a comparative approach to identify the core factors that shape the emergence and breakdown of eusociality.
To identify these factors, we generated 15 de novo genome assemblies and updated 2 additional assemblies in halictids3,11, all with chromosome-length scaffolds (Fig. 1; Extended Data Fig. 2). We also included two previously-published genomes12,13. We selected species with well-characterized social behaviors that encompass both origins and six repeated losses of eusociality (these gains and losses were previously established based on a much broader phylogeny used to reconstruct the origins of eusociality in this group5), as well as four socially polymorphic species. Sampling closely-related eusocial and solitary species alongside known non-eusocial outgroups provides a powerful framework to examine the molecular mechanisms shaping the evolution of social behavior in these bees1–4.
Fig. 1. Comparative genomic resources for halictid bees.
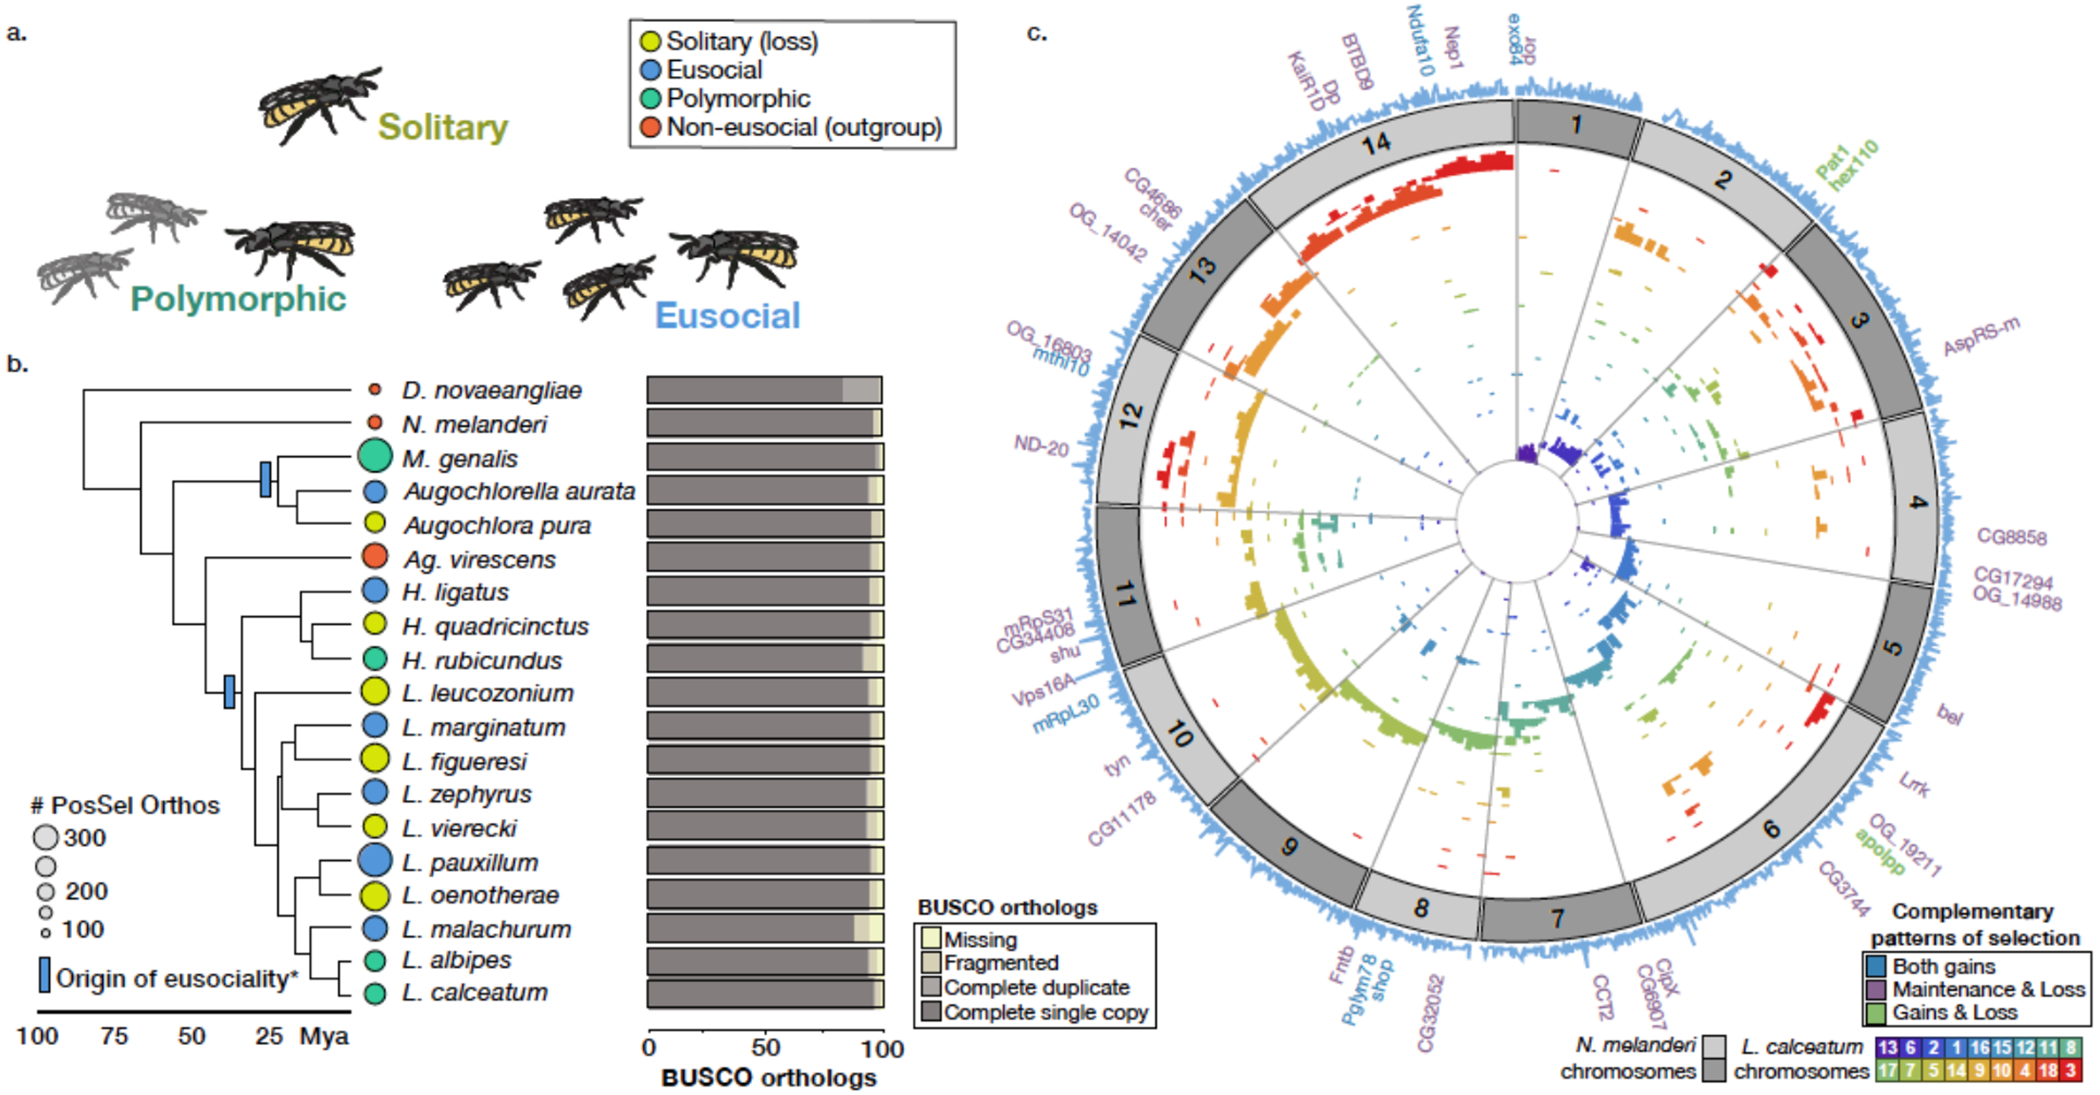
(A) Halictid bees encompass a wide range of behaviors, including solitary (yellow), eusocial (blue) and polymorphic species (green) capable of both solitary and eusocial reproduction. Non-eusocial outgroups (red) reproduce independently. (B) Pruned tree showing taxa included in this dataset. Colors at tips indicate species’ behavior, circle sizes proportional to the number of orthologs under positive selection on each terminal branch (abSREL, HyPhy133 FDR<0.05). Light blue rectangles denote gains of eusociality (*inferred from much broader phylogenies than shown here5). Proportions of complete/fragmented/missing BUSCO orthologs are shown for each genome. (C) Genomic data aligned to Nomia melanderi (NMEL). The 14 NMEL chromosomes are represented as a circular ideogram with consecutive chromosomes shown in alternating dark/light gray. The inner spiral comprises 18 color-coded tracks, each corresponding to one L. calceatum (LCAL) chromosome; the y-axis represents the frequency of regions aligning to the corresponding region in NMEL. Most alignments fall into a single “wedge”, indicating that each LCAL chromosome corresponds to just one NMEL chromosome, a pattern typical for sweat bees and unlike that of mammals (Extended Data Figs. 3–4). Outer blue line plot indicates number of branches where positive selection was detected at each gene (abSREL, FDR<0.05), and gene names shown are those with convergent/complementary patterns of selection: positive selection at both origins (blue), intensification of selection in extant eusocial lineages and relaxation of selection in secondarily solitary species (HyPhy RELAX, FDR<0.1; purple), and complementary patterns of both positive selection on the origin branches and convergent relaxation of selection with losses of eusociality (green). Not all genes in these categories are annotated in NMEL and some are therefore not labeled.
We searched for signatures of positive selection associated with the convergent gains of eusociality as well as signatures of relaxed selection when eusociality is lost. These complementary patterns indicate genomic loci that are associated with costs or trade-offs underlying the maintenance of social traits. We find that some of the targets of selection implicated in the origins and elaborations of eusociality, such as young, taxonomically restricted genes14–21 and gene regulatory elements12,20,22,23, also show relaxation of selective pressures when social behavior is lost. In addition, we uncovered four genes strongly associated with the evolution of eusociality in halictid bees, including two genes that encode primary juvenile hormone binding proteins (JHBPs): apolipoprotein24–26 and hexamerin11027,28. Using single-cell RNA-sequencing, we localized the expression of apolipoprotein in the brain to glial cells involved in forming the insect “blood-brain barrier” (BBB)29,30. In addition, we find evidence that eusocial reproductive females have increased levels of JH III in their brains compared to their solitary counterparts; this could potentially be mediated by changes in the transport of JH. These results provide new insights into how JH signaling may have been modified to shape the evolution of eusociality.
Results
We generated new comparative genomic resources for studying the evolution of eusociality in halictid bees. Genome assemblies of 17 species ranged in size from 267 to 470 Mb, with estimated numbers of chromosomes ranging from 9 to 38 (Supplementary Table 1). Broadly, we found that, in contrast to mammalian species (Extended Data Fig. 3), genomic rearrangements among the bee species occur disproportionately within rather than between chromosomes (see Fig. 1c, Extended Data Fig. 4). Consequently, loci that are on the same chromosome in one bee species also tend to occur on the same chromosome in other bee species. This observation is similar to previous findings in dipteran genomes31,32 and may indicate a broader trend during the evolution of insect chromosomes. To increase the quality of genome annotations, we generated tissue-specific transcriptomes for 11 species. In addition, because of new roles emerging for microRNAs (miRs) in social plasticity and eusocial evolution33–40, we also sequenced and characterized 1269 microRNAs (miRs) expressed in the brains of 15 species (Supplementary Table 2). The number of annotated genes ranged from 11,060 to 14,982, and BUSCO41 analyses estimated the completeness of our annotations to range from 93.4 to 99.1% (Fig. 1b; Supplementary Table 1). Whole-genome alignments were generated with progressiveCactus42 (Fig. 1c), which we then used to identify 52,421 conserved, non-exonic elements present in 10 or more species. All genomes, annotations, and alignments can be viewed and downloaded from the Halictid Genome Browser (https://beenomes.princeton.edu).
Signatures of trade-offs on young genes and gene regulation
Previous studies of eusociality have suggested that, similar to their importance in the evolution of other novel traits43, younger or taxonomically-restricted genes (TRGs) may play key roles in the evolution of eusocial behavior14–21. To test this hypothesis, we examined the relationship between gene age and selection associated with eusocial origins, maintenance, and reversions to solitary life histories. We found a greater proportion of young genes compared with old genes experience relaxed selection when eusociality is subsequently lost (Fig. 2a; Pearson’s r=0.869, p=0.002). This relationship does not hold for orthologs showing evidence of relaxed selection on eusocial branches, nor are younger genes more likely than older genes to experience intensified selection associated with either the origins or maintenance of eusociality (Extended Data Fig. 5; Supplementary Table 3). We note that we did not include polymorphic species as focal branches in any of these or subsequent analyses of selection because we could not classify these lineages as either eusocial or solitary.
Figure 2. The maintenance of eusociality is associated with young genes and gene regulation.
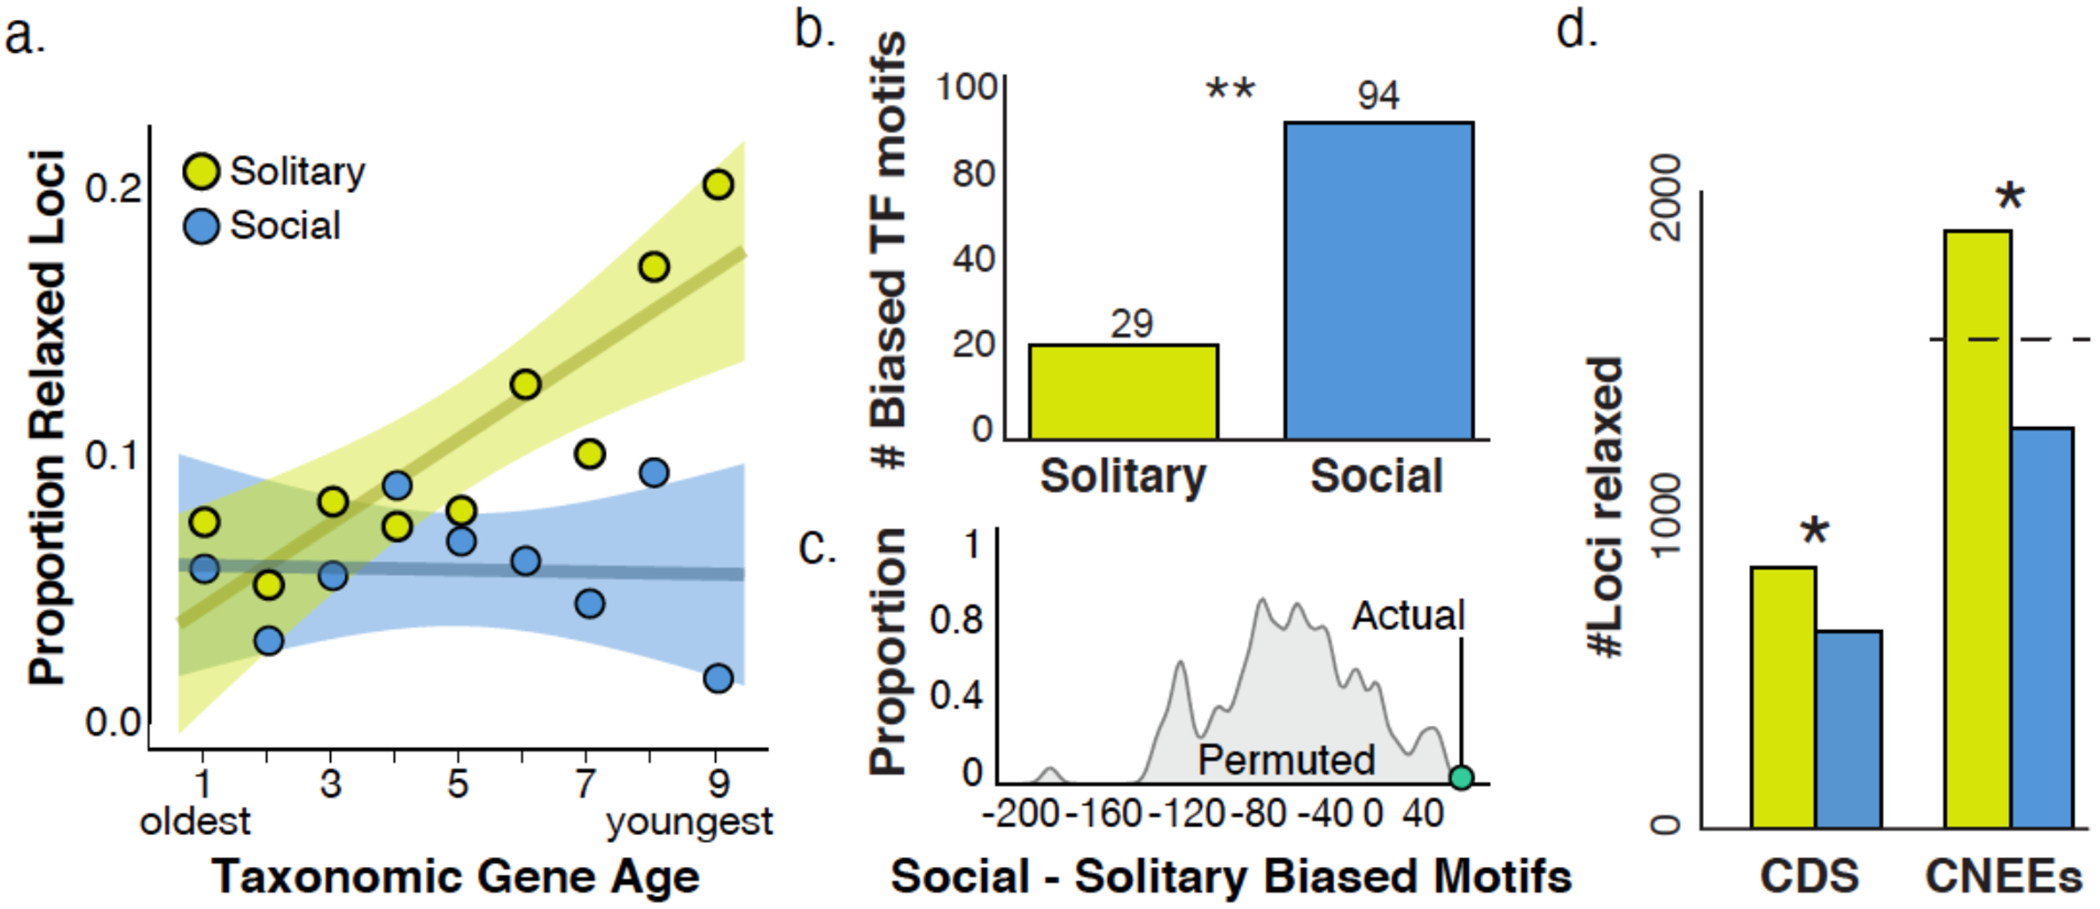
(A) Younger genes are more likely to show signatures of relaxed selection when social behavior is lost. Circles show the proportion of genes in each age class that show evidence of relaxed selection in solitary (yellow) or social (blue) lineages, from the oldest Bilaterian group (Age=1) to the youngest, halictid-specific taxonomically restricted genes (Age=9). For solitary lineages, gene age is significantly correlated with the proportion of those genes with evidence of relaxed selection (Pearson correlation, r=0.869, p=0.002; social lineages: r=−0.0447, p=0.91). Shading represents 95% confidence intervals. (B) Stubb scores44 were calculated for 223 Drosophila transcription factor binding motifs in each genome, and each motif was tested for overrepresentation in solitary/social genomes; 94 motifs were enriched in social genomes compared to 29 enriched in solitary genomes. “**” indicates p<0.01 for permutation test as shown in C. (C) Permutation tests reveal the ~3-fold enrichment in (B) is unlikely to occur by chance (empirical p<0.01). (D) Taxa that have lost eusociality have higher proportions of loci experiencing relaxed selection after phylogenetic correction, both for coding sequences (CDS; Fisher’s exact, p=2.42x10⁻⁷, odds-ratio=1.48) and for conserved, non-exonic elements (CNEEs). Social lineages have fewer fast-evolving CNEEs than chance (Binomial test, p<1x10⁻¹⁰), while solitary taxa have more than chance (Binomial test, p=5.27x10⁻⁹). The dashed line indicates the null expectation for CNEEs, and * indicates significant differences in the number of loci between eusocial and solitary species.
Gene regulatory changes have also been implicated in eusocial evolution12,20,22,23, including the expansion of transcription factor (TF) motifs in the genomes of eusocial species compared with distantly-related solitary species12. To assess the degree to which changes in gene regulation may facilitate the evolution of social behavior in halictids, we characterized TF motifs in putative promoter regions in each halictid genome. For each species, we defined these regions as 5kb upstream and 2kb downstream of the transcription start site for each gene12 and calculated a score for a given TF in each region that reflects the number and/or strength of predicted binding sites44.
If social species have a greater capacity for gene regulation compared to lineages that have reverted to solitary nesting, then we would expect to find more motifs with scores (reflecting both strength and number of binding sites) that are higher in social taxa compared to secondarily solitary taxa. In support of this hypothesis, we find a greater than 3-fold enrichment of TF motifs that are positively correlated with social lineages compared to secondarily solitary lineages after phylogenetic correction (Fig. 2b; Supplementary Table 4), and permutation tests indicate that this difference is highly significant (Fig. 2c). Five of these socially-biased motifs were previously identified as associated with eusocial evolution in bees12, including the motifs for Lola, Hairy, CrebA, CG5180, and the Met/Tai complex, which initiates downstream transcriptional responses to JH.
In addition to changes in TF motif presence, we also tested for signatures of selection on noncoding regions of the genome that potentially play a role in gene regulation45. Specifically, we used whole genome alignments to identify conserved, non-exonic elements (CNEEs), and found that CNEEs showed a bias toward faster rates of evolution in secondarily solitary species compared with eusocial lineages (Fig. 2d). This acceleration is likely to be a signature of relaxed constraint in solitary lineages, further supporting the role of gene regulation in the maintenance of eusocial traits.
Convergent, complementary selection across social transitions
To determine if specific loci show convergent signatures of selection associated with the evolution of eusociality, we identified genes with positive selection on each branch representing a gain of eusociality. We found 309 genes on the Augochlorini origin branch and 62 genes on the Halictini origin branch with evidence of position selection (Fig. 3; Supplementary Table 5). On the Augochlorini branch, genes with signatures of positive selection were enriched for cell adhesion (GO:0007155, Fisher’s Exact, q=2.01e-4; enrichment=2.92; Supplementary Table 6). This list included taiman, which encodes a protein that co-activates the bHLH-PS transcription factor and JH receptor, Met46–49 (Supplementary Table 5). There was no detectable gene ontology (GO) enrichment among positively-selected genes on the Halictini branch (Fisher’s Exact, q>0.1). Nine genes showed signatures of positive selection on both branches (Supplementary Table 5). These genes include shopper, which encodes a protein involved in neuronal network function and the ensheathing of glial cells50, and ND-42, encoding a suppressor of Pink1 which is associated with neurocognitive functioning51.
Figure 3. Signatures of selection associated with the gains and losses of eusociality in halictids.
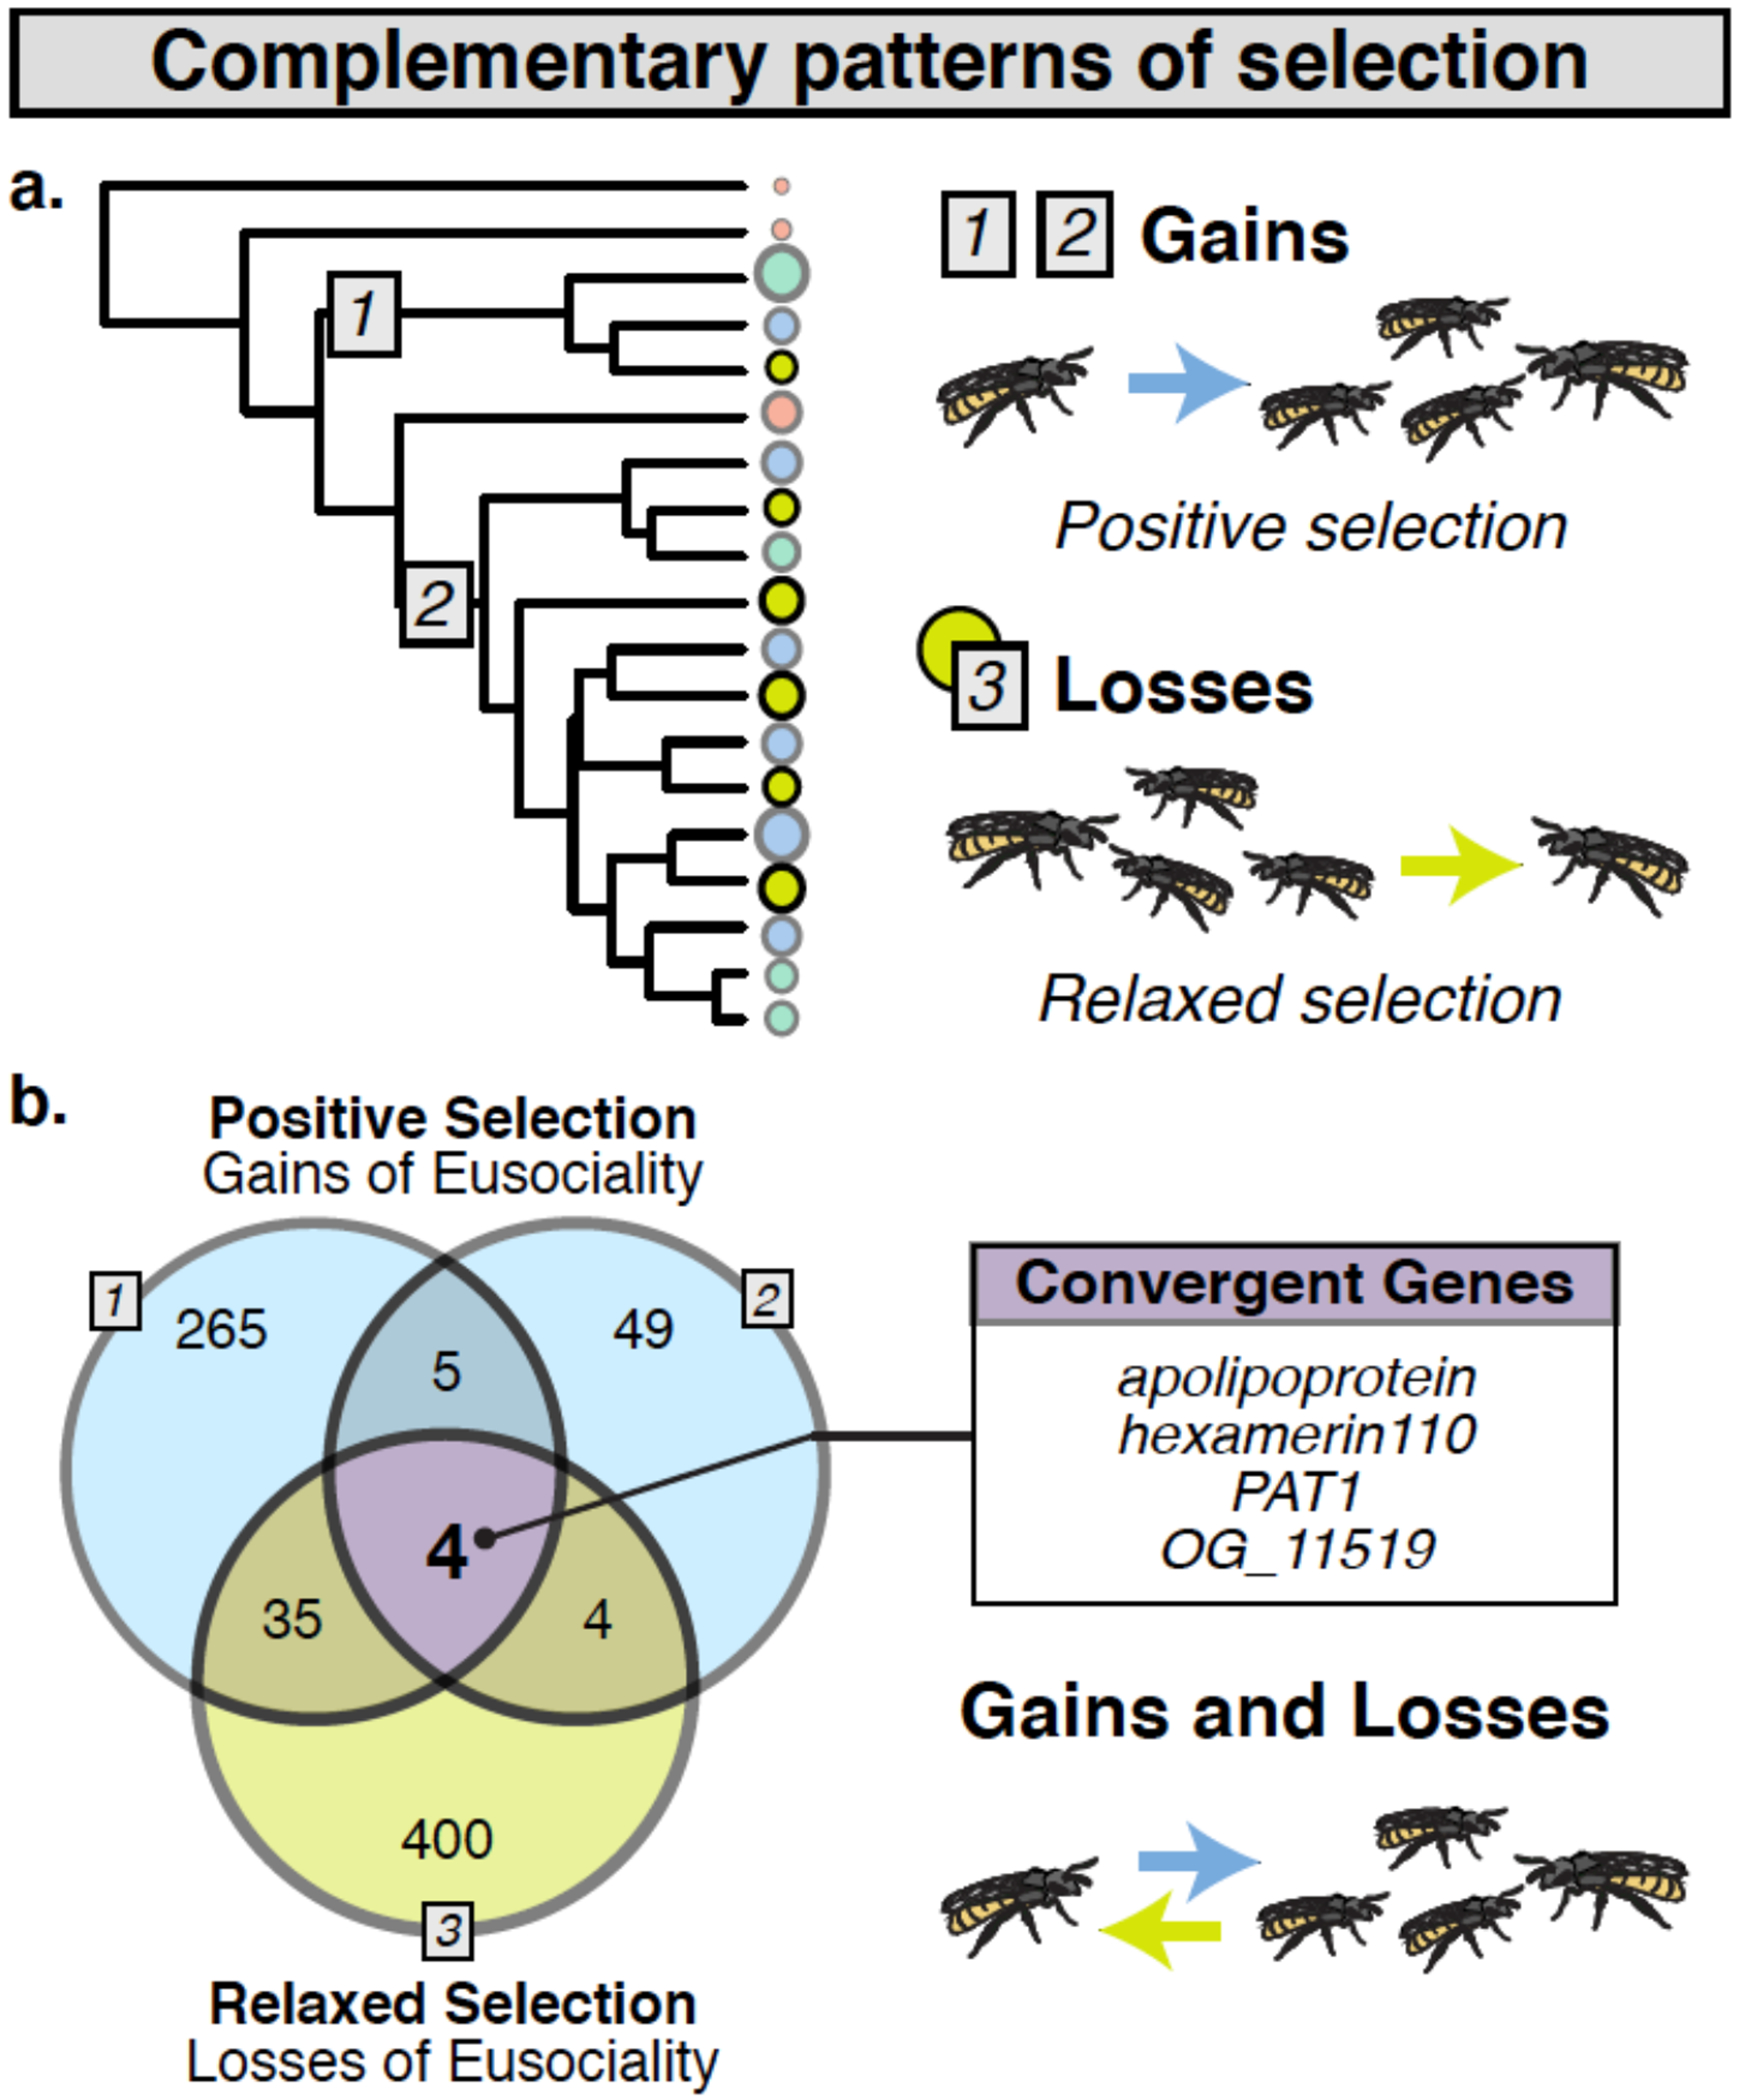
(A) Orthologs were tested for evidence that dN/dS >1 at a proportion of sites on focal branches (Gains 1 and 2 denoted with blue squares 1-2; abSREL133 tests in HyPhy, FDR<0.05) and for evidence of relaxed selection (gray square 3, yellow circles; HyPhy RELAX54, FDR<0.1). (B) Nine loci overlapped both origins (enrichment ratio=3.97, Fisher’s exact p=0.004). Four orthologs overlapped all 3 tests (Multi-set Exact Test57; fold-enrichment=8.85, p=0.001). Socially polymorphic species were not included as focal branches in either test.
A unique attribute of halictid bees is that, in addition to repeated gains5, there have also been a number of independent losses of eusociality4. These reversals provide a powerful lens to identify key genomic factors needed for the maintenance of social living because organisms are expected to minimize investment in traits when social behaviors are lost or unexpressed. This results in the reduction or removal of selective pressures previously maintaining these costly but essential traits52,53. Thus, we predicted that genes associated with trade-offs or costly roles in maintaining eusocial societies should show relaxation of constraint in species that have secondarily reverted to solitary nesting. Consistent with this hypothesis, we found 443 genes showing evidence of convergent, relaxed selection on the six branches representing independent losses of eusociality (HyPhy RELAX54, FDR<0.1; Supplementary Table 5). In contrast, we did not find any genes with evidence of convergent, positive selection on all of the solitary loss branches. Genes showing evidence of relaxed selection with eusocial losses are enriched for chromosome condensation (GO:0030261, Fisher’s Exact, q=0.067, enrichment=4.09), indicating that they may play a role in chromosome accessibility and gene regulation55. They are also enriched for vacuolar transport (GO:0007034, Fisher’s Exact, q=0.067, enrichment=3.11; Supplementary Table 6).
To determine whether or not this pattern is unique to the loss of eusociality, we ran the same tests for relaxed selection using extant eusocial lineages as the focal branches. We found 305 genes with signatures of relaxation in eusocial species (HyPhy RELAX54, FDR<0.1; Supplementary Table 5) enriched for four GO terms related to metabolism (Supplementary Table 6). This is a significantly lower proportion of genes experiencing relaxed selection in eusocial species compared to those experiencing relaxed selection among solitary species (Fisher’s exact test p=2.42x10⁻⁷, odds-ratio=1.48), suggesting that the loss of eusociality is more often associated with a release of constraint compared with eusocial maintenance or elaboration.
We also identified 34 genes that show intensification of selection on extant eusocial lineages and relaxation in secondarily solitary species (HyPhy RELAX, FDR<0.1 for both tests). The convergent intensification of selection on eusocial lineages suggests that these genes are likely to be particularly relevant to the maintenance or elaboration of eusociality. They are enriched for regulation of SNARE complex assembly (GO:0035542, Fisher’s Exact, q=0.074, enrichment=80.91; Supplementary Table 6), which is a key component of synaptic transmission that has also been implicated with variation in social behavior in L. albipes3 and wasps56.
By comparing genes associated with the emergence of eusociality to those associated with its loss, we have the unique ability to identify some of the most consequential molecular mechanisms shaping social evolution. If a shared set of genes is associated with the emergence and maintenance of social behavior in this group, then we would expect to find genes experiencing both positive selection when eusociality emerges and relaxed selection when social behavior is lost (Fig. 3b). Indeed, we find four genes matching these criteria: OG_11519, a gene with no known homologs outside of Hymenoptera, Protein interacting with APP tail-1 (PAT1), apolipoprotein (apolpp), and hexamerin110 (hex110; Fig. 3b). This overlap is significantly more than expected by chance (Multi-set Exact Test57; fold-enrichment=8.85, p=0.001). OG_11519 has no identifiable protein domains but is conserved throughout the Hymenoptera. PAT1 modulates mRNA transport and metabolism58, and ApoLpp and Hex110 are pleiotropic proteins with roles in storage and lipid transport. Hex110 and ApoLpp have also been established as the primary JH binding proteins (JHBPs) across multiple insect orders25–27,59. These complementary patterns of positive selection when eusociality arises and relaxation of selection when it is lost suggests that this small but robust set of genes is associated with costly trade-offs linked to the evolution of eusociality53.
Selection on juvenile hormone binding and transport
Two of the four genes that show signatures of both positive selection when eusociality is gained and relaxed selection when eusociality is lost (apolpp and hex110) encode the primary binding proteins for JH, an arthropod-specific hormone with pleiotropic effects on numerous insect life history traits60. While ApoLpp and Hex110 have been characterized primarily in non-hymenopteran insects61,62, they function as JH binding proteins in a wide range of species25–27,59, suggesting their function is conserved. In addition to binding JH, these proteins have additional pleiotropic functions related to nutrient storage63, lipid transport62, and cuticular hydrocarbon transport64–67, all of which may also play important roles in the evolution of social traits27,68–73.
To further investigate the evidence for selection on these genes, we implemented a mixed-effects maximum likelihood approach (MEME74) and found region-specific, faster rates of evolution on eusocial branches compared to non-eusocial outgroups for both proteins. Sites with evidence of positive selection are present in the functional regions of both proteins (Extended Data Fig. 6), including the receptor binding domain and predicted binding pocket for ApoLpp as well as in all three Hemocyanin domains of Hex110 (associated with storage functions61) and its predicted binding pocket. More broadly, our analyses and previous studies61 demonstrate these proteins are rapidly evolving within the Hymenoptera (Extended Data Fig. 7). Though both of these proteins are highly pleiotropic61,62, their shared role in JH binding and transport suggests that positive selection may have shaped JHBP function as eusociality emerged in two independent lineages of halictids and that some of these changes may also be associated with costs when eusociality is lost.
apolpp expression patterns and JH III levels in the brain
While associations between circulating JH levels and division of labor are well established in the social insects71,75–79, we still do not understand which components of JH signaling pathways have been targeted by natural selection to decouple JH from its ancestral role in development and reproductive maturation80 and generate new links between JH and social traits. Because ApoLpp delivers cargo to target tissues and has been shown to cross the BBB81, we hypothesized that differences in ApoLpp transport and the availability of JH in the brain can help generate novel relationships between JH and behavior. To examine the potential role of cell type-specific expression of apolpp in modulating JH signaling in the brain, we generated a single-cell RNA-Sequencing (scRNAseq) brain dataset using two sweat bee species: L. albipes and L. zephyrus (Fig. 4a). We identified one cluster, characterized by markers of glial cells, to be the primary location of apolpp brain expression (Fig. 4b). In addition, three related lipid transfer-associated genes, apolipoprotein lipid transfer particle (apoLTP), megalin (mgl; experiencing relaxed selection in solitary lineages; Supplementary Table 5), and Lipophorin receptor 1 (LpR1), as well the gene encoding the JH degradation enzyme, Jheh2, are expressed primarily in these glial cells (Fig. 4b). Further subclustering demonstrates that both apolpp and apoLTP are primarily expressed in a subperineurial glia-like cluster (Fig. 4b); subperineurial glia, along with perineurial glia, form and regulate the permeability of the BBB in D. melanogaster29,30.
Figure 4. apolpp and associated lipid transport genes are expressed in glial cells.
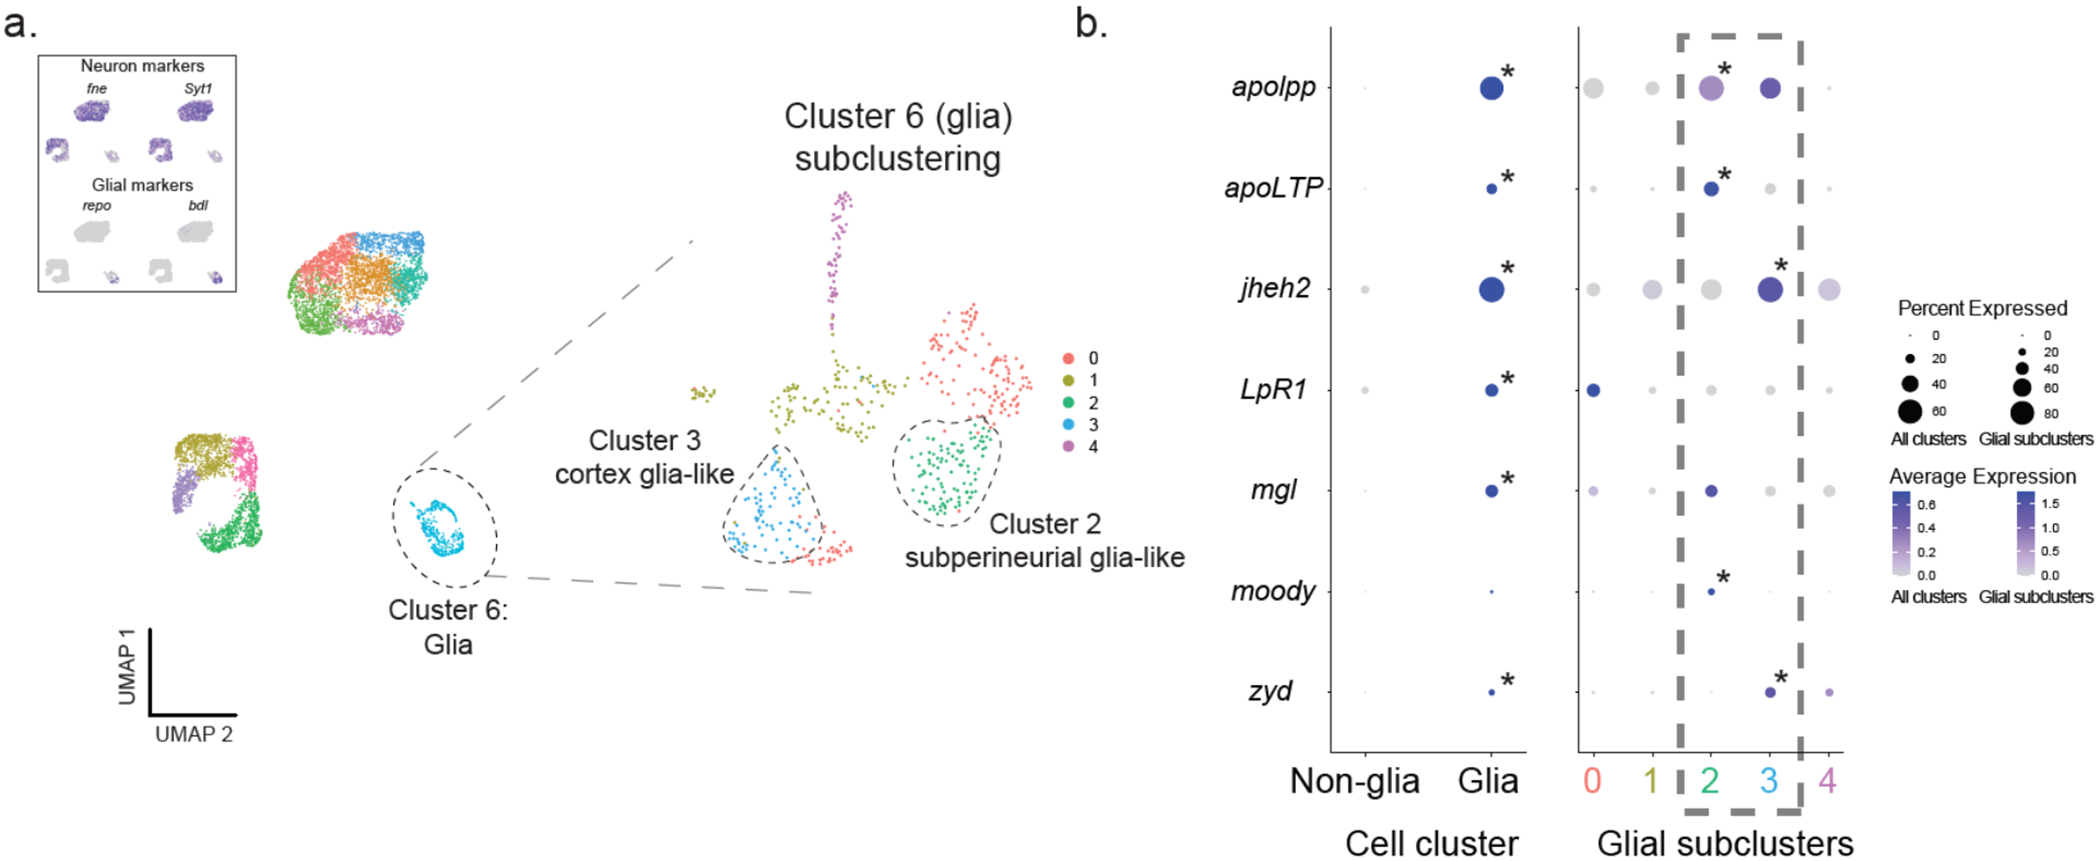
(A) Single-cell RNA sequencing (scRNAseq) of the halictid brain. Grouping and visualization of ~7,000 cells from 4 halictid brain samples revealed 11 cell clusters in reduced dimensionality (UMAP) space. (Top left) Expression of canonical markers of insect brain-cell types showed that only a single cluster, Cluster 6, had low expression levels of neuronal markers fne and Syt1 and high expression levels of glial markers repo and bdl, suggesting that Cluster 6 is composed of glial cells. Focal subclustering of Cluster 6 identified five cell subclusters, two of which contained known markers of insect cortex or subperineurial glia. Purple coloration in top left-hand figure corresponds to normalized expression levels of the gene listed above the plot, with darker color representing higher expression. (B) Four genes associated with lipid binding, including apolpp, apoLTP, LpR1, and mgl, as well as jheh2, were co-expressed in Cluster 6 (“glia”) compared to remaining cell clusters (“non-glia”). Focal subclustering of Cluster 6 into five subclusters (colored numbers 0-4 correspond to subclusters in (A)) revealed that apolpp and Apoltp are co-expressed with moody, a marker of subperineurial glia (glia Subcluster 2), and jheh2 is co-expressed with zyd, a marker of cortex glia (glia Subcluster 3). Circle diameter corresponds to the percentage of cells within a given cell type/subcluster (column) that express a given gene (row), and circle color corresponds to that gene’s average expression within a given cell type/subcluster following sequencing depth normalization. Asterisks in the top-right of some circles indicate that a specific gene is also significantly upregulated in a given cell type/subcluster compared to others following differential expression testing with the MAST algorithm.
The actions of JH on the brain are sometimes assumed to be indirect82, and while JH has previously been quantified in whole-insect heads83 it has not yet been quantified directly in the insect brain. We used liquid chromatography–mass spectrometry (LC-MS) to measure JH III titers in dissected brains (see Methods; Extended Data Figs. 8–10) and found higher concentrations of JH III in social (A. aurata) foundresses compared with solitary (A. pura) foundresses; social A. aurata workers appear to have intermediate levels of JH III (Fig. 5a). Next, we used topical, abdominal applications of isotopically labeled JH III-d3 to demonstrate that the bee brain is permeable to JH III (Fig. 5b). Taken together, our results suggest differential responses to JH in the brain and other tissues could be associated with behavioral polyphenisms among the social insects80.
Figure 5. JH is higher in brains of eusocial foundresses and crosses the blood-brain barrier.
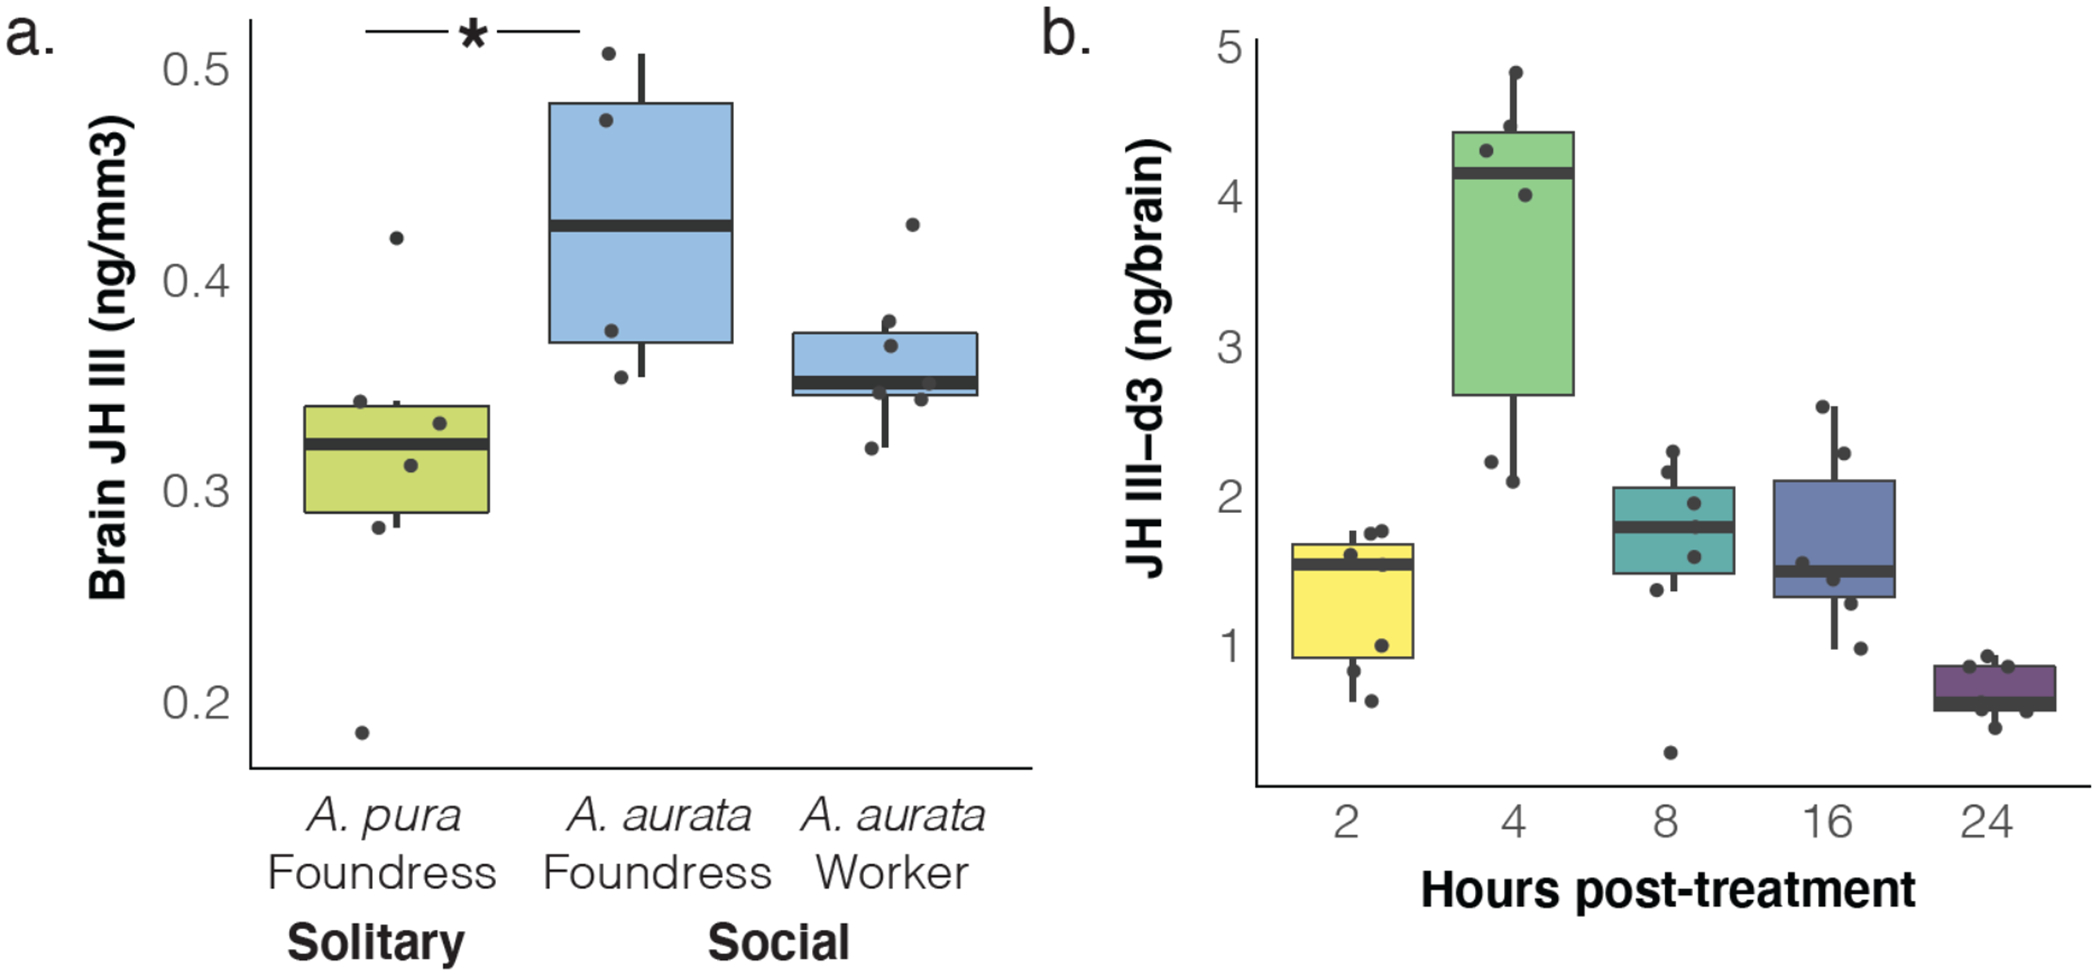
(A) LC-MS quantification of JH III in the brains of solitary A. pura (n=6) and eusocial A. aurata foundresses (n=4) and workers (n=7) reveal higher endogenous levels of JH III in social foundresses (Wilcoxon rank sums test, p=0.029; *asterisks indicate post-hoc, pairwise comparisons, p<0.05). (B) Isotopically-labeled JH III-d3 applied to the abdomens of A. aurata is detected in the brain as soon as 2h later and peaks at 4 hours post-treatment (n=7 for 2,8,24h; n=6 for 4h and 16h). Boxes show median, 25th and 75th percentiles. Whiskers show minimum and maximum values without outliers.
Discussion
We leveraged the powerful natural variation in social behavior of sweat bees and developed new comparative genomic resources to characterize the mechanisms that shape transitions in social evolution. In addition to multiple gains of eusociality, halictids provide an excellent opportunity to study genomic signatures of eusocial loss, with repeated, recent reversions from eusocial to solitary life history strategies1,2,4. By studying both gains and losses within this group, we have uncovered multiple genome-wide patterns as well as specific targets of selection associated with eusociality.
First, we tested for broad patterns in genome evolution that have previously been implicated in the elaboration or maintenance of eusociality, including a role for younger or taxonomically-restricted genes (TRGs)14–21 and changes in gene regulation12,20. We found several lines of evidence suggesting these patterns extend to social evolution in sweat bees. Our finding that TRGs are disproportionately experiencing a relaxation of selection pressure when social behavior is lost suggests that, in addition to influencing the maintenance of eusociality, younger genes are associated with costs or trade-offs linked to eusociality. These findings support studies of complex eusocial hymenopterans, including honey bees, ants, and wasps, in which young TRGs have been linked to the evolution of non-reproductive workers14–21. Our work extends this body of evidence to suggest that evolutionary changes in these TRGs may also incur costs when lineages revert to solitary strategies. We also find evidence that, similar to other eusocial lineages12,20,84, changes in gene regulation are associated with the elaboration of eusocial traits in halictids. TF motifs are expanded in social halictid genomes compared with secondarily solitary lineages, implicating more complex gene regulatory networks associated with eusociality. Further, many putative regulatory regions of halictid genomes (CNEEs45) show faster rates of evolution in secondarily solitary lineages. This acceleration is likely to be a signature of relaxed constraint in solitary lineages, further supporting the role of gene regulation in the maintenance of eusocial traits.
In addition to the genome-wide patterns associated with eusocial transitions, the repeated gains and losses of eusociality among halictids enabled us to probe the most consequential molecular mechanisms associated with social evolution. We identified genes experiencing positive selection when eusociality was gained and relaxation of selection when eusociality is lost. Our results suggest that the loss of eusociality is associated with a release of selective constraint on a shared set of genes in halictid bees. A similar comparative genomic analysis of social spiders also linked relaxation of selection with social evolution, though in spiders, there is greater relaxed selection in social lineages, where social species have elevated genome-wide rates of molecular evolution. These elevated rates are likely to be driven largely by demographic factors, including a reduced effective population size and increased inbreeding linked to a social life history in this group85.
We identified a small but robust set of genes with complementary signatures of selection associated with both the gains and losses of eusociality in sweat bees. These patterns highlight the importance of these genes in eusocial lineages: complementary signatures of positive selection when eusociality is gained and relaxed selection when eusociality is lost suggest they are also associated with costly trade-offs53. Strikingly, 2 of these 4 genes (apolpp and hex110) encode the primary binding proteins for juvenile hormone (JH), a hormone that regulates many aspects of insect life history including development, reproduction, diapause and polyphenism75,86. Together, ApoLpp and Hex110 are thought to bind nearly all JH in insect hemolymph59. We identified positive selection on sites present in the functional regions of both ApoLpp and Hex110, with faster rates of evolution on eusocial branches compared with non-eusocial lineages. Evolutionary changes to ApoLpp and Hex110 that modify binding affinity and/or cellular uptake could alter levels of JH87, potentially leading to discrete behavioral phenotypes80.
In Drosophila, ApoLpp forms a complex with other lipoprotein particles and can cross the BBB81. Our single-cell transcriptomics dataset reveals that apolpp is expressed in the brain (in addition to the fat body; Supplementary Table 7) and enriched in the cell cluster expressing markers of subperineurial glia, a glial subtype that contributes to the formation and permeability of the BBB. Thus, our data suggest that ApoLpp may have a similar role in mediating transport of cargo to the brain in bees. Whether glial-expressed ApoLpp has unique isoforms or different functions compared with ApoLpp expressed in other tissue types is unknown, but the interaction between ApoLpp and other glial-expressed proteins could facilitate brain-specific responses to JH signaling and other cargo mediated by ApoLpp.
These findings suggest a model where glial expression of ApoLpp and other lipid transport proteins may work in concert with JH degradation enzymes to modulate the uptake and availability of JH to the brain in a way that could differentiate social behaviors in halictids. This model is consistent with theory suggesting that conditional expression of a trait (i.e. eusociality) leads to independent selection pressures and evolutionary divergence88; evolution of JHBPs may be one example of such divergence associated with conditional expression of social behavior. Lending support to this hypothesis, we found that endogenous levels of JH III are higher in the brains of social compared with closely-related solitary female foundresses. Because the effects of JH on the brain are sometimes assumed to be indirect82, we also used isotopically labeled JH to demonstrate that JH is able to cross the BBB in bees, including halictids.
Similar hormonal gatekeeping mechanisms have also been recently proposed in ants89, suggesting that the regulation of JH in the brain may be a convergently evolved feature of caste differentiation in the social insects. In addition, modifications to JH response-elements may have also helped to fine-tune JH signaling in this group of bees. For example, following transport to relevant tissues, JH binds to the JH receptor, Met/Gce, which coupled to a co-receptor, Taiman, initiates downstream effects47. We found evidence for positive selection on taiman linked to the origin of eusociality in the Augochlorini as well as expansion of the Met/Tai TF motif in eusocial lineages. Future studies are needed to test each of these hypotheses and elucidate the relative influences of modulating JH availability versus refining downstream responses to JH in the origins and elaboration of social traits.
JH is essential to reproductive maturation in solitary insects, but this signaling system has also been frequently co-opted during major life history transitions60,86,90,91, including eusociality75. In relatively small eusocial societies like halictids76,92, paper wasps77 and bumblebees93,94, JH has maintained its association with reproductive maturation, but has also gained a new role in mediating aggression and dominance. In the more elaborate social colonies of honey bees, modifications to JH pathways have also resulted in novel relationships between JH and vitellogenin95–97, and the reproductive ground plan hypothesis (RGPH)95–97 has been proposed to explain this secondary decoupling of JH in workers independent of its ancestral, reproductive role75. More generally, it has been hypothesized that the origins of queen and worker castes in social insects can be linked to an evolutionary decoupling of reproductive and non-reproductive behavioral programs plastically expressed throughout the life cycle of a solitary ancestor98–100. This hypothesis, known as the ovarian ground plan hypothesis (OGPH), specifically implicates modification to hormone signaling as a major route for the evolution of social insect castes. Our finding of convergent selection associated with social transitions on genes that bind and transport JH adds another layer of support to these predictions.
We identified a shared set of genes experiencing selection associated with the origins of eusociality in sweat bees, supporting the hypothesis that a shared genetic toolkit could facilitate the evolution of social behavior101–106. Moreover, the sweat bee system provides a unique opportunity to identify convergent and complementary patterns of selection associated with gains and losses of this trait. Our findings demonstrate a role for both directional selection and release from constraint in social evolution and reveal how evolutionary trade-offs can structure the molecular underpinnings of eusociality.
Conclusions
Sweat bees repeatedly traversed an evolutionary inflection point between a solitary lifestyle and a caste-based eusocial one with multiple gains and losses of this trait. We developed new comparative genomic resources for this group and identified complementary signatures of convergent selection associated with the emergence and breakdown of eusociality. Factors associated with the origins or maintenance of eusociality are also associated with its loss, indicating that there may be trade-offs, constraints, or costs associated with these genomic changes. Strikingly, we find that the functional domains of two proteins implicated in juvenile hormone binding and transport show convergent and complementary signatures of selection as eusociality has been gained and lost in halictids. Coupled with our finding that JH is present in the insect brain, our results help to explain how novel linkages between social behaviors and endocrine signaling could convergently shape the evolution of eusociality.
Methods
Detailed methods are provided in the Supplementary Materials.
Sequencing datasets
We built 10x Genomics linked-read libraries for 15 species and updated two additional assemblies with Hi-C (Supplementary Table 1). Bulk mRNA transcriptome sequencing of four tissues and miRNA sequencing was also conducted for most species. Four single cell (scRNAseq) libraries were also prepared from whole brains of Lasioglossum zephyrus and Lasiogossum albipes. Detailed information on all 194 sequencing libraries generated is provided in Supplementary Table 8.
Genome assembly
Genomes were assembled with Supernova version 1.0.0107 and evaluated for completeness using BUSCO241,108,109 with Apis mellifera as the seed species and the set of 4,415 Hymenoptera genes from OrthoDB v9. Gaps were closed with ABySS 2.0110, scaffolds of likely bacterial origin were filtered, and repetitive elements were masked. Hi-C scaffolding was used to error-correct, order, orient, and anchor the draft genomic sequences to chromosomes32,111. Candidate chromosome-length genome assemblies were generated using 3D-DNA32 followed by additional finishing using Juicebox Assembly Tools32.
Coding sequence annotation
We generated gene predictions for each genome using BRAKER v2.1.0112,113 with RNAseq reads mapped to repeat-masked genomes using HISAT v.2.0.5114. MAKER v3.00.0115,116 was run on the repeat-masked genomes. The GFF files of aligned ESTs from PASA117,118 were used as EST evidence. All high-quality protein predictions from Transdecoder119 from all species were combined and used as protein evidence for each genome. In addition, OGSv3.2 from Apis mellifera, OGSv5.42 from Lasioglossum albipes, and all UniProt proteins were included as protein evidence. An Official Gene Set v2.1 was created for each genome. These gene sets are relatively complete as measured by BUSCO2 when comparing with the 4,415 genes expected to be present in all Hymenoptera species based on OrthoDB v9120 (Fig. 1, Supplementary Table 1).
Orthology and gene ages
We used OrthoFinder v2.3.2121,122 to identify orthologous groups of genes across the 19 species analyzed. Gene names, orthologous D. melanogaster genes, and orthologous A. mellifera genes were assigned based on OrthoDB groups. Gene Ontology terms were assigned to orthogroups using Trinotate v3.0.1123 as well as GO terms of both D. melanogaster and A. mellifera orthologs determined by OrthoDB mapping. GOATOOLS (v. 1.0.3)124 was used with our custom orthogroup to GO mapping table for GO enrichment analysis. Transcription factors (TFs) in halictids were identified from orthology to A. mellifera genes identified as TFs in the Regulator database125. We used the Phylostratigraphy pipeline (https://github.com/AlexGa/Phylostratigraphy)126,127 to identify the approximate evolutionary age of origin for orthogroups in our study with proteins from 11 species as a reference set. To assign an age to an orthogroup, we required that representative genes from at least five species be assigned an age by Phylostratigraphy and that the majority of the genes with an assigned age be assigned to the same age. To test for correlations with ages, we extracted the crown age of taxonomic levels from the literature128–130.
Coding sequence evolution
Coding sequences were aligned using the codon-aware version of Fast Statistical Aligner v1.15.9131, then extensively filtered to exclude poorly aligned regions as in Sackton et al.132. We used HyPhy RELAX v2.3.1154 to identify genes experiencing relaxed selection in secondarily solitary species, requiring that at least 12 taxa be present and at least one closely related pair of social and solitary species from each of the three social clades was included. In addition to examining signatures of relaxation in solitary species, we performed a parallel test on the extant lineages of social species to represent a null baseline. We also used HyPhy aBSREL133 tests to identify signatures of selection on individual branches.
Transcriptomic analyses
For each bulk RNAseq sample, transcript per million (TPM) values were calculated for each gene using Salmon v0.9.1134 with quasi-mapping and controlling for GC bias, with quantile normalized TPMs used for subsequent analyses. We calculated the specificity of expression of each orthogroup across four tissues using these normalized expression levels135, requiring data from at least eight species and all four tissues in order to calculate a specificity index for each gene. We also performed phylogenetic generalized least squares (PGLS) analyses using the R package geiger v2.0136 to identify correlations between sociality and expression level for each orthogroup, excluding species with polymorphic social behaviors.
Whole brain expressed miRNAs were identified from each species using miRDeep2 (v. 2.0.0.8)137. We detected known and novel miRNAs in each species using a reference set of miRNAs from 10 other insect species33,34,138. Expression was quantified and novel miRNAs were filtered based on no similarity to rRNA/tRNA, minimum of five reads each on mature and star strands of the hairpin sequence, and a randfold p-value<0.05. To identify homologous miRNAs across species, we added this filtered set to the list of known miRNAs and repeated the miRDeep2 detection step. We predicted gene targets of each miRNA using a combination of miRanda (v.3.3)139 and RNAhybrid (v. 2.12)140, keeping only those miRNA-target pairs that were predicted by both programs.
Single cell RNA-seq libraries of L. albipes and L. zephyrus were aligned to the respective genomes with CellRanger V6 (10X Genomics). We performed normalization and integration to combine scRNAseq data across species using the SCTransform pipeline with default settings in Seurat V4141,142. Dimensionality reduction was performed with the Uniform Manifold Approximation and Projection (UMAP) technique, and cell clusters were identified with shared nearest-neighbor Louvain modularity optimization, with cell-type-specific genes identified using the MAST algorithm143 (Supplementary Tables 9–10).
Associations between promoter TFBSs and sociality
For each of 223 transcription factor (TF) motifs (identified in Drosophila and filtered for presence in bee genomes, as in 4), a “stubb” score44 was calculated across windows in each genome, and the highest score for each motif within 5kb upstream and 2kb downstream of the transcription start site was assigned to each gene within a species. We then examined correlations between rank-normalized stubb scores for a given motif and social behavior using PGLS as implemented in geiger v2.0136 after excluding all socially polymorphic taxa. We excluded motifs for a given orthogroup which did not have a normalized rank of at least 0.95 in one species, and required that the number of genes with significant correlations of a motif be at least five. We then counted the numbers of significant (PGLS p-value<0.01) correlations detected with higher stubb scores in social taxa and with higher stubb scores in solitary taxa for each motif. Those motifs for which there were differences in numbers of significant correlations between social and solitary taxa of at least 20% were considered associated with the behavior with which they more often correlated.
Conserved non-exonic elements (CNEEs)
Repeat-masked genomes of each of the 19 species included in our study were aligned using Cactus42,144. Fourfold degenerate sites were extracted from the alignment using halTools v2.1. phyloFit, part of the PHAST package145, and phastCons146 was used to identify conserved non-exonic elements (CNEEs). The coordinates of the resulting CNEEs were identified in each species using halLiftover. Coding sequences were removed from the CNEEs in each species individually and sequences of less than 100 bases were discarded. CNEEs were aligned with FSA131 and alignments were filtered using TrimAl v1.4.rev22147. To identify CNEEs associated with social evolution, we examined differences in the rates of evolution in CNEEs among extant taxa. For each locus, branch lengths were calculated on the species topology using BASEML v4.9148,149. Resulting branch lengths were standardized to average rates of evolution in each genome using the branch lengths estimated by RAxML150 and fourfold degenerate sites extracted using CODEML v4.9148,149. We compared the standardized branch lengths of the five pairs of closely related social and solitary species in our study. Loci for which the branch lengths were longer in all social taxa than the most closely related solitary taxa were considered fast-evolving in social species and vice versa.
JH extraction, LC-MS and stable isotope tracing
Bee brains and other tissues were flash frozen in liquid nitrogen, then ground and centrifuged before adding extraction solvent supplemented with 0.2 μg/ml valine-D8 as an internal standard. LC-MS was carried out following previously described protocols151 using a Xbridge BEH amide HILIC column (Waters) with a Vanquish UHPLC system (Thermo Fisher). Chemical structure of JH III, parent and fragment m/z values for labeled and unlabeled forms, chromatograms and absolute quantification of JH III and JH III-D3 are shown in Extended Data Fig. 10. JH III-D3 treatments were applied to abdominal sternites of both Bombus impatiens workers as well as Augochlorella aurata foundresses. For LC-MS of B. impatiens, bees were chill anesthetized and then decapitated. For LC-MS of A. aurata, heads were lyophilized at −80°C and 300 mTorr for 30 minutes, after which brains were dissected and stored at −80°C until analysis. Data were analyzed using El-MAVEN Software (Elucidata, LLC., elucidata.io). Chromatographs and mass spectra were exported from El-MAVEN and plotted using MATLAB, and peak areas were exported, processed and plotted using R. Peak areas were all normalized to the valine-D8 (Cambridge Isotopes Laboratories Cambridge, MA) internal standard. Absolute quantification of JH III and JH III-D3 was carried out using a standard curve of purified JH III (Sigma, Cat. #J2000) and JH III-D3 (Toronto Research Chemicals, Cat. # E589402), respectively. For social A. aurata and solitary A. pura comparisons, JH III quantities were standardized to ng/mm3 using brain volumes previously-quantified for each species152.
ApoLpp evolution
We examined sliding windows across the apolpp alignment for our 19 halictid species and inferred branch lengths on the species tree using RaxML v7.3.0150 with the PROTGAMMAWAG model of evolution. We then calculated the branch length between each tip species and the outgroup species, D. novaeangliae. To identify changes in evolutionary rates associated with transitions in social behavior, we compared the 16 species with shifts in social behavior (either gains or losses) to N. melanderi and Ag. virescens, two species without such shifts. We also used fpocket2153, as implemented in the Phyre2154,155 Investigator tool, to predict the likely active sites of ApoLpp (and Hex110) in halictids. We next explored ApoLpp evolution across insects to place patterns of evolution within Halictidae into a broader context. We collected apolpp sequences from 78 additional Neopteran insect species (Supplementary Table 11), aligned them with MUSCLE v3.8.31156, and filtered and backtranslated to nucleotides with trimAl v1.4.rev22147. We ran aBSREL as implemented in HyPhy v2.3.11 on the resulting nucleotide alignment, testing all 191 branches within the phylogeny to detect branches experiencing selection in each major clade examined. We also examined shifts in rates of protein evolution during the evolution of Halictidae using PAML and likelihood ratio tests between five pairs of sister taxa on both the entire protein sequence as well as just functional pockets predicted by fpocket2. Finally, we used the branch model of PAML v4.9148,149 to estimate dN/dS ratios for each of the major clades examined.
Extended Data
Extended Data Fig. 1: Typical life cycle for solitary and eusocial sweat bees.
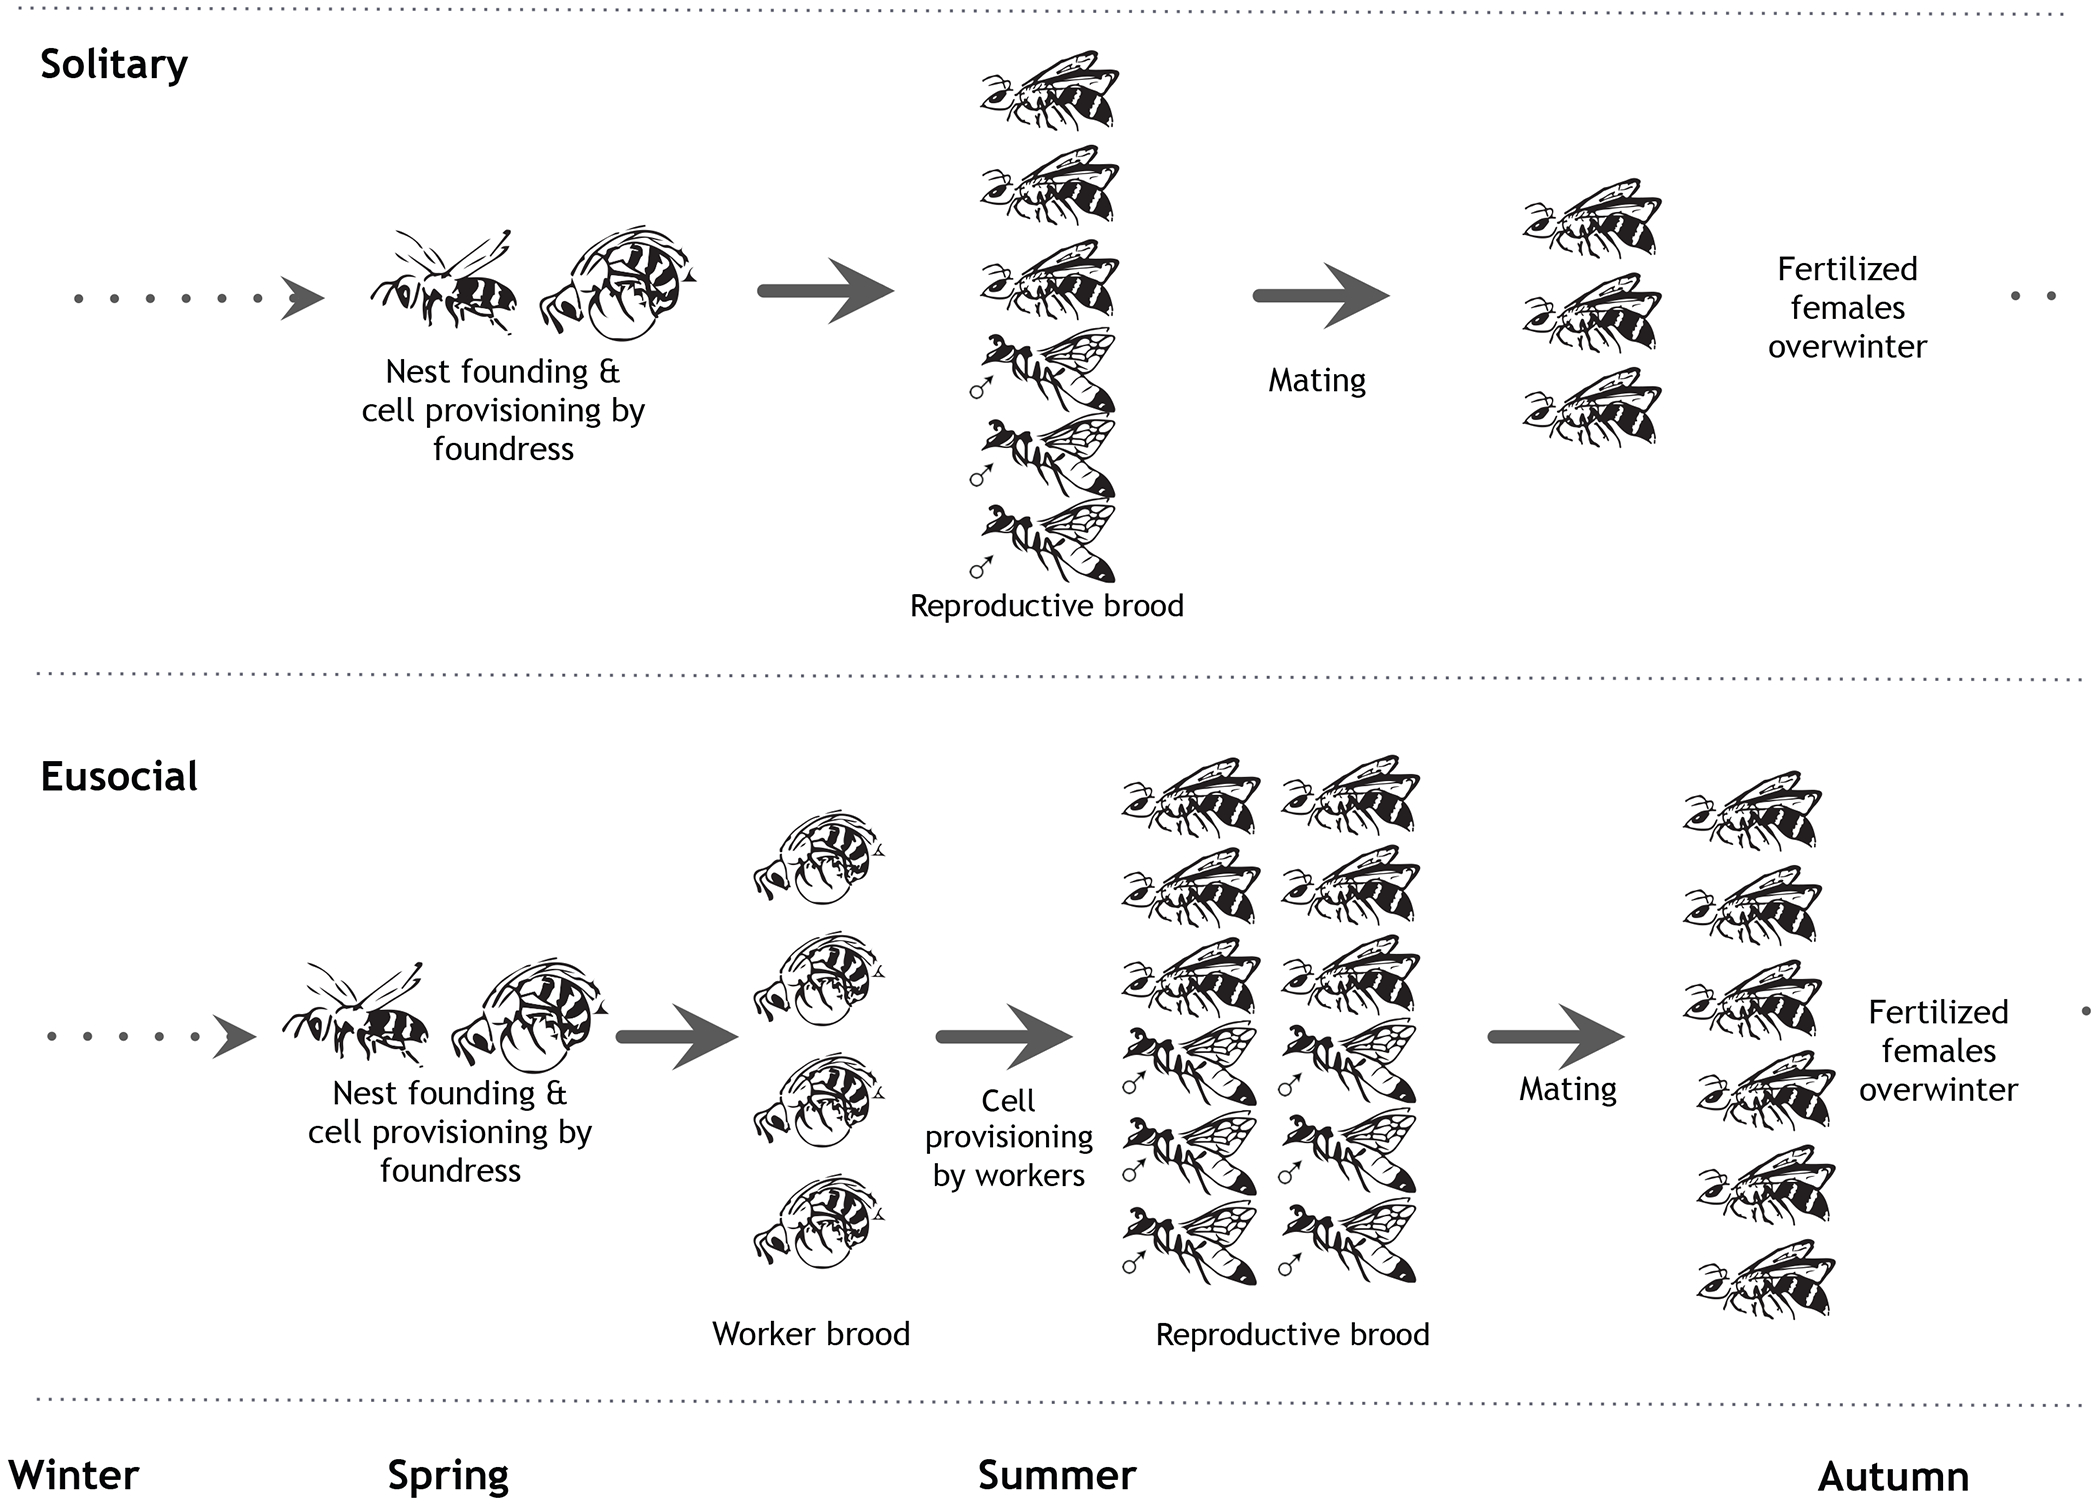
In a typical solitary species, reproductive females produce a single brood that is a mix of males and females. However, some solitary species are multivoltine and can produce multiple reproductive broods in a year. In typical eusocial halictid species, females produce two broods: first workers, then reproductives. At the end of the season, females mate and overwinter as adults.
Extended Data Fig. 2: Genome assembly statistics.
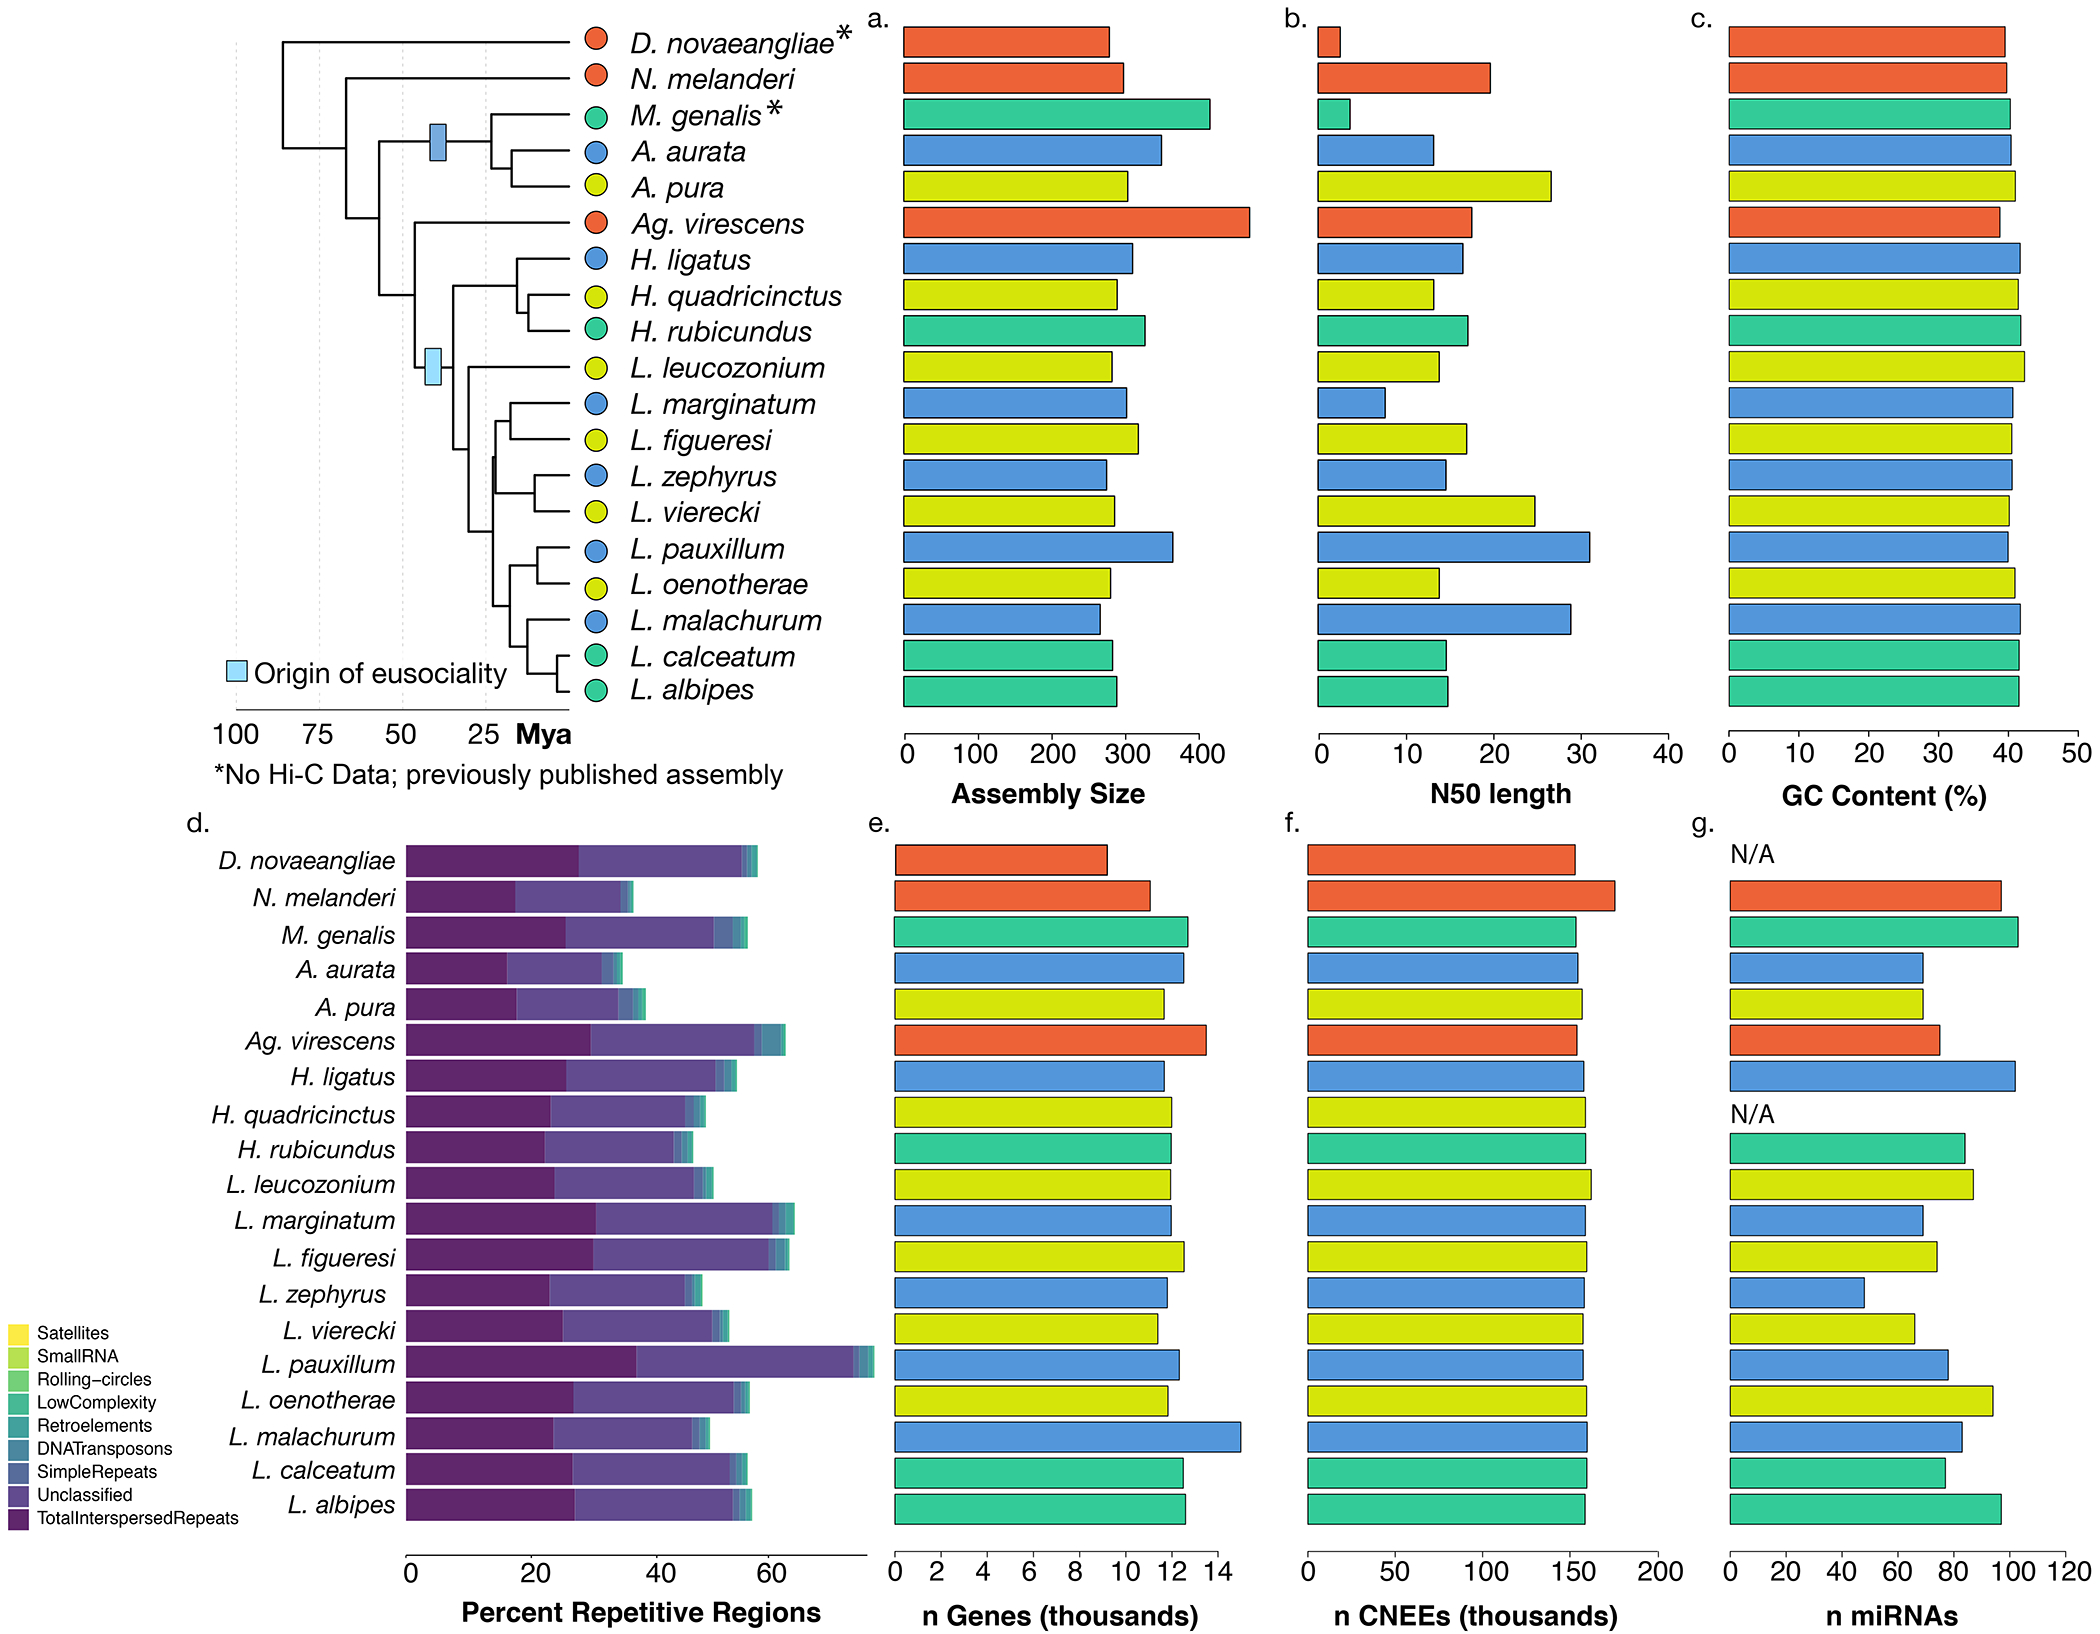
Nineteen genomes are included in this comparative dataset. 15 de novo assemblies were generated using a combination of 10x genomics and/or Hi-C, and 2 previously-published genomes (N. melanderi11, L. albipes3) were improved by scaNolding with Hi-C data. M. genalis13 and D. novaeangliae12 were used as-is. (a) Genome assembly lengths ranged from ~300 to 420 Mb. (b) ScaNold N50s for each species following Hi-C scaNolding, and (c) GC content was consistent across species. (d) RepeatModeler was used to characterize diNerent types of repeats in the halictid assemblies. (e) Numbers of genes (in thousands) for each species following individual annotation. (f) Conserved non-exonic elements (CNEEs) were called using phastCons on a progressive Cactus alignment. (g) microRNAs were also characterized using brain tissue from available species and from34. For some species, fresh tissue was not available (N/A).
Extended Data Fig. 3: Human-mouse chromosomal dotplot.
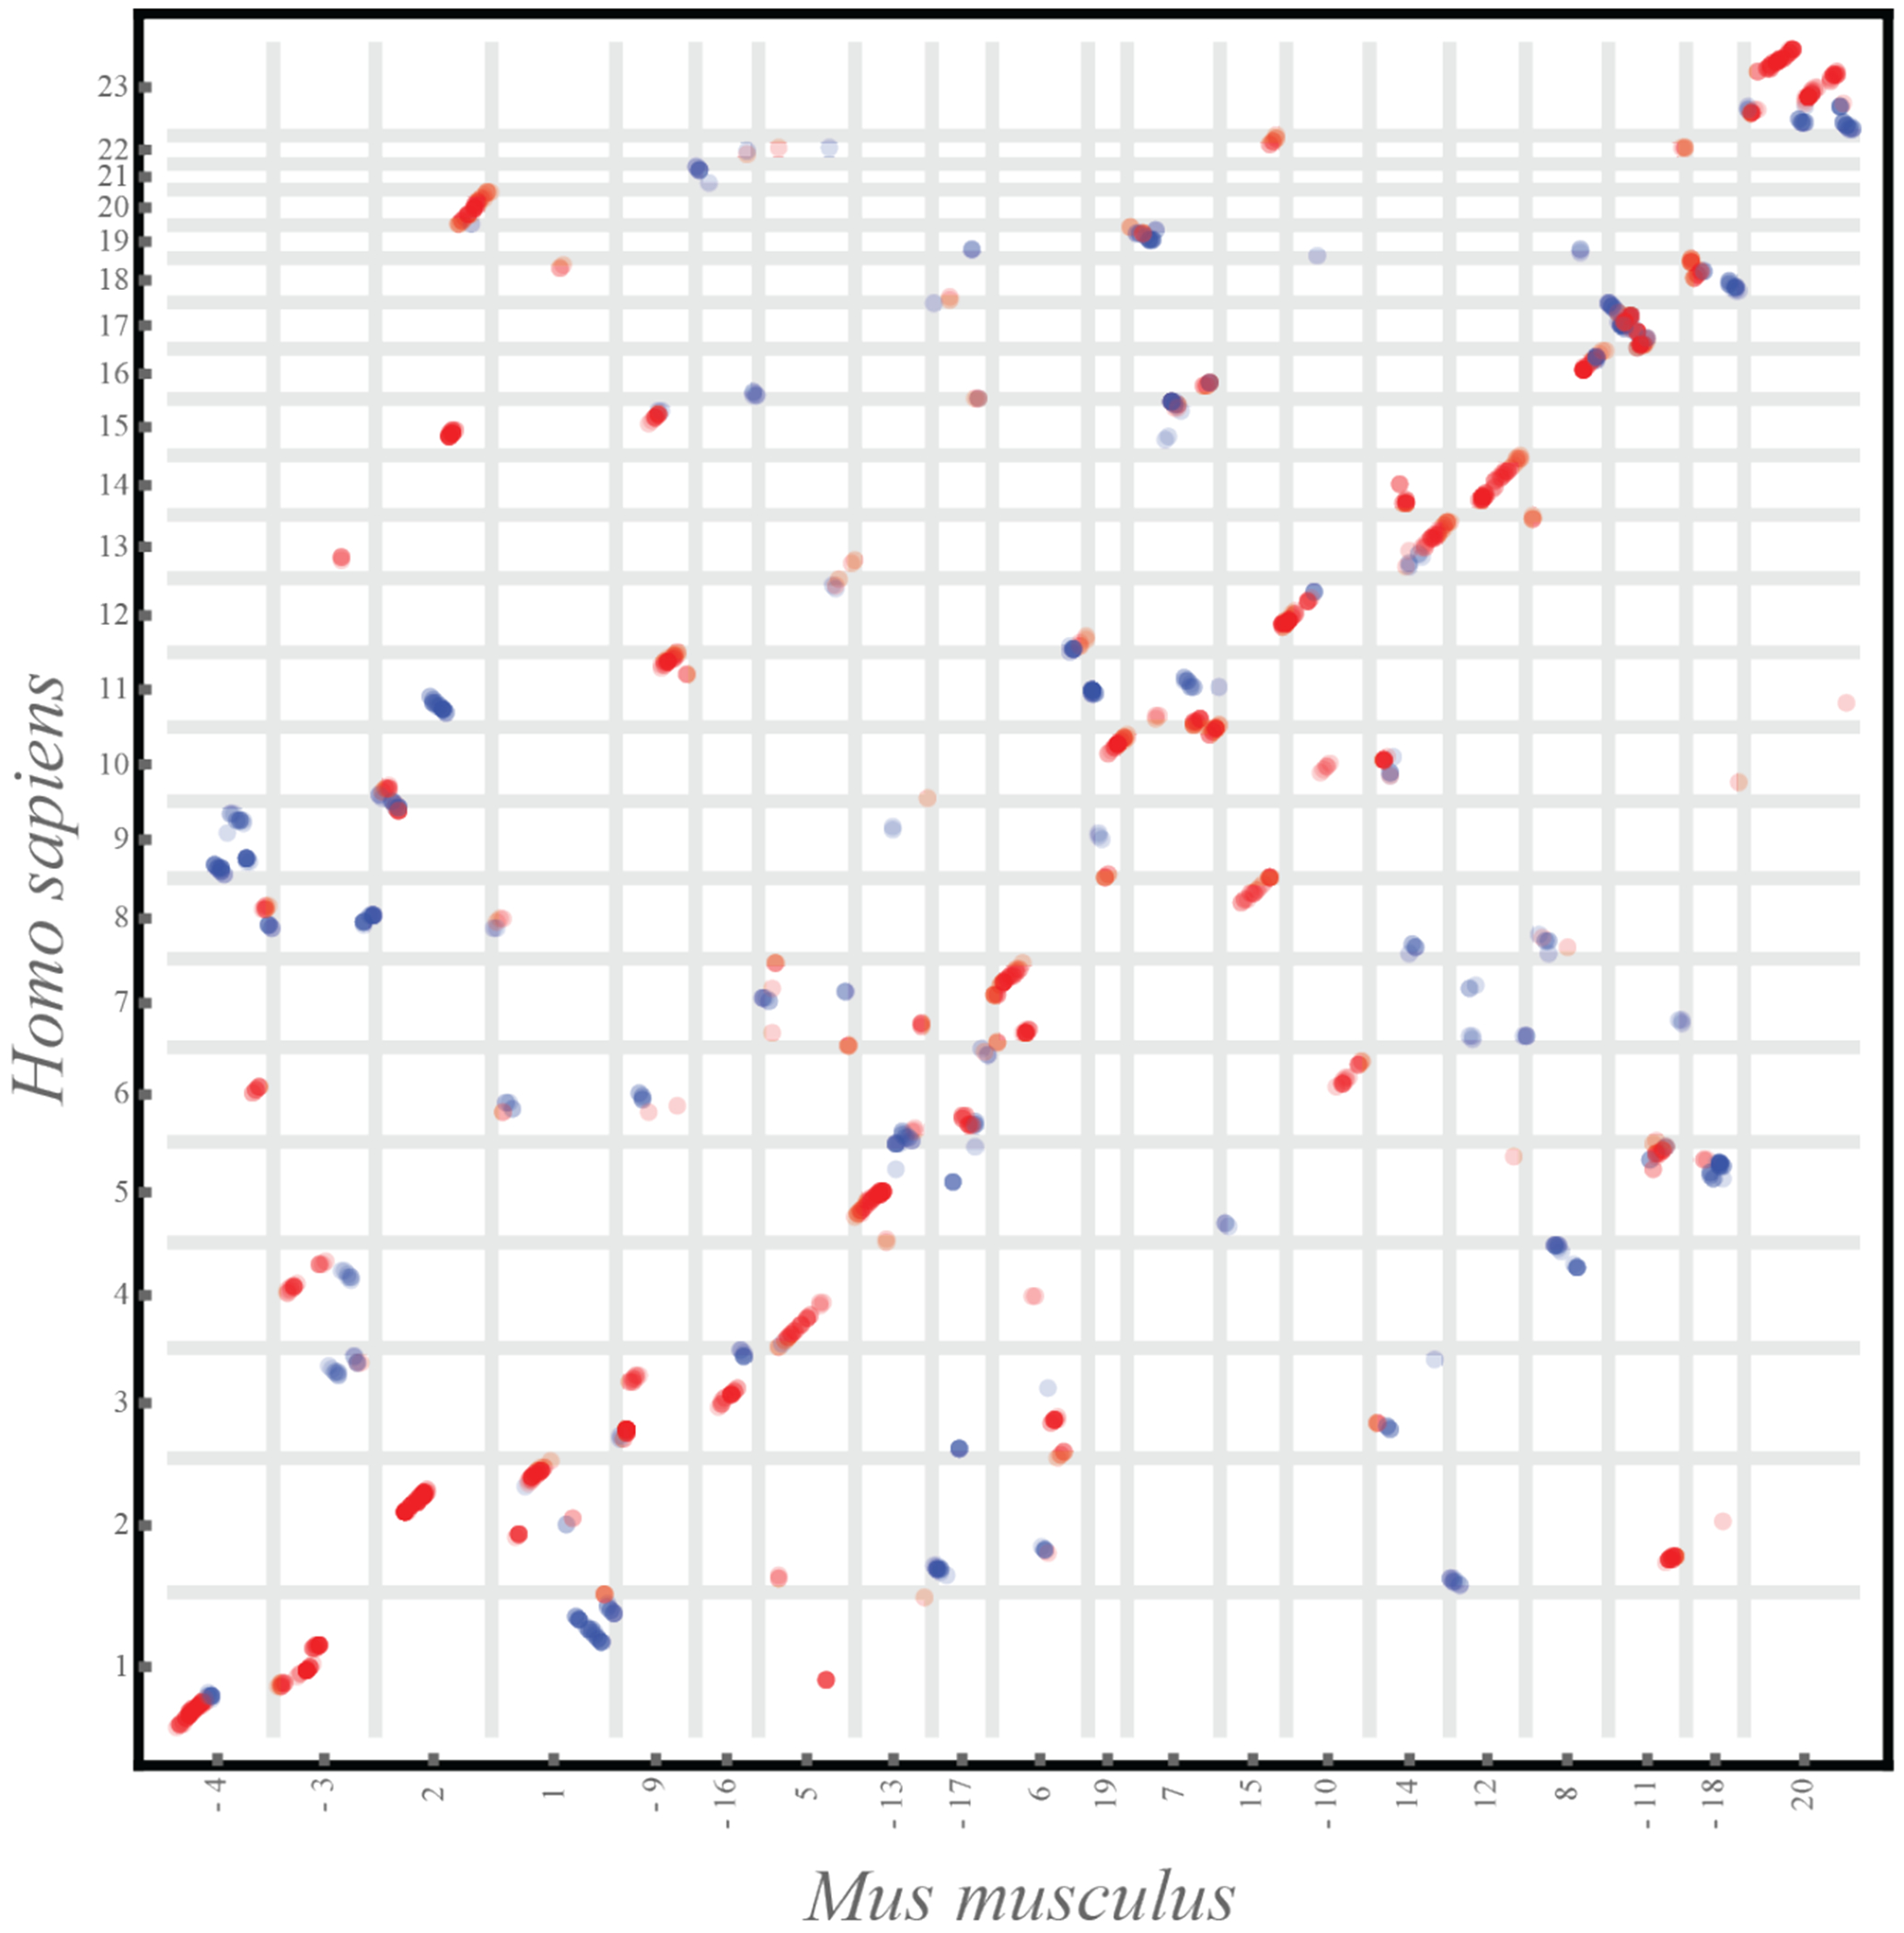
Dotplots comparing the chromosomes of two mammalian species, human and mouse, separated by comparable evolutionary distance to the bees examined in this study (~80MY to common ancestor). The vertical and horizontal lines outline the boundaries of chromosomes in respective species, and the numbers on the axes mark the relevant chromosome name and orientation, with ‘-’ in front of the chromosome name representing a reverse complement to the chromosome sequence as reported in the assembly. See Extended Data Fig. 4 for more details. The human-mouse one-to-one alignments file was downloaded from https://github.com/mcfrith/last-genome-alignments.
Extended Data Fig. 4: Pairwise chromosomal dotplots for halictid species.
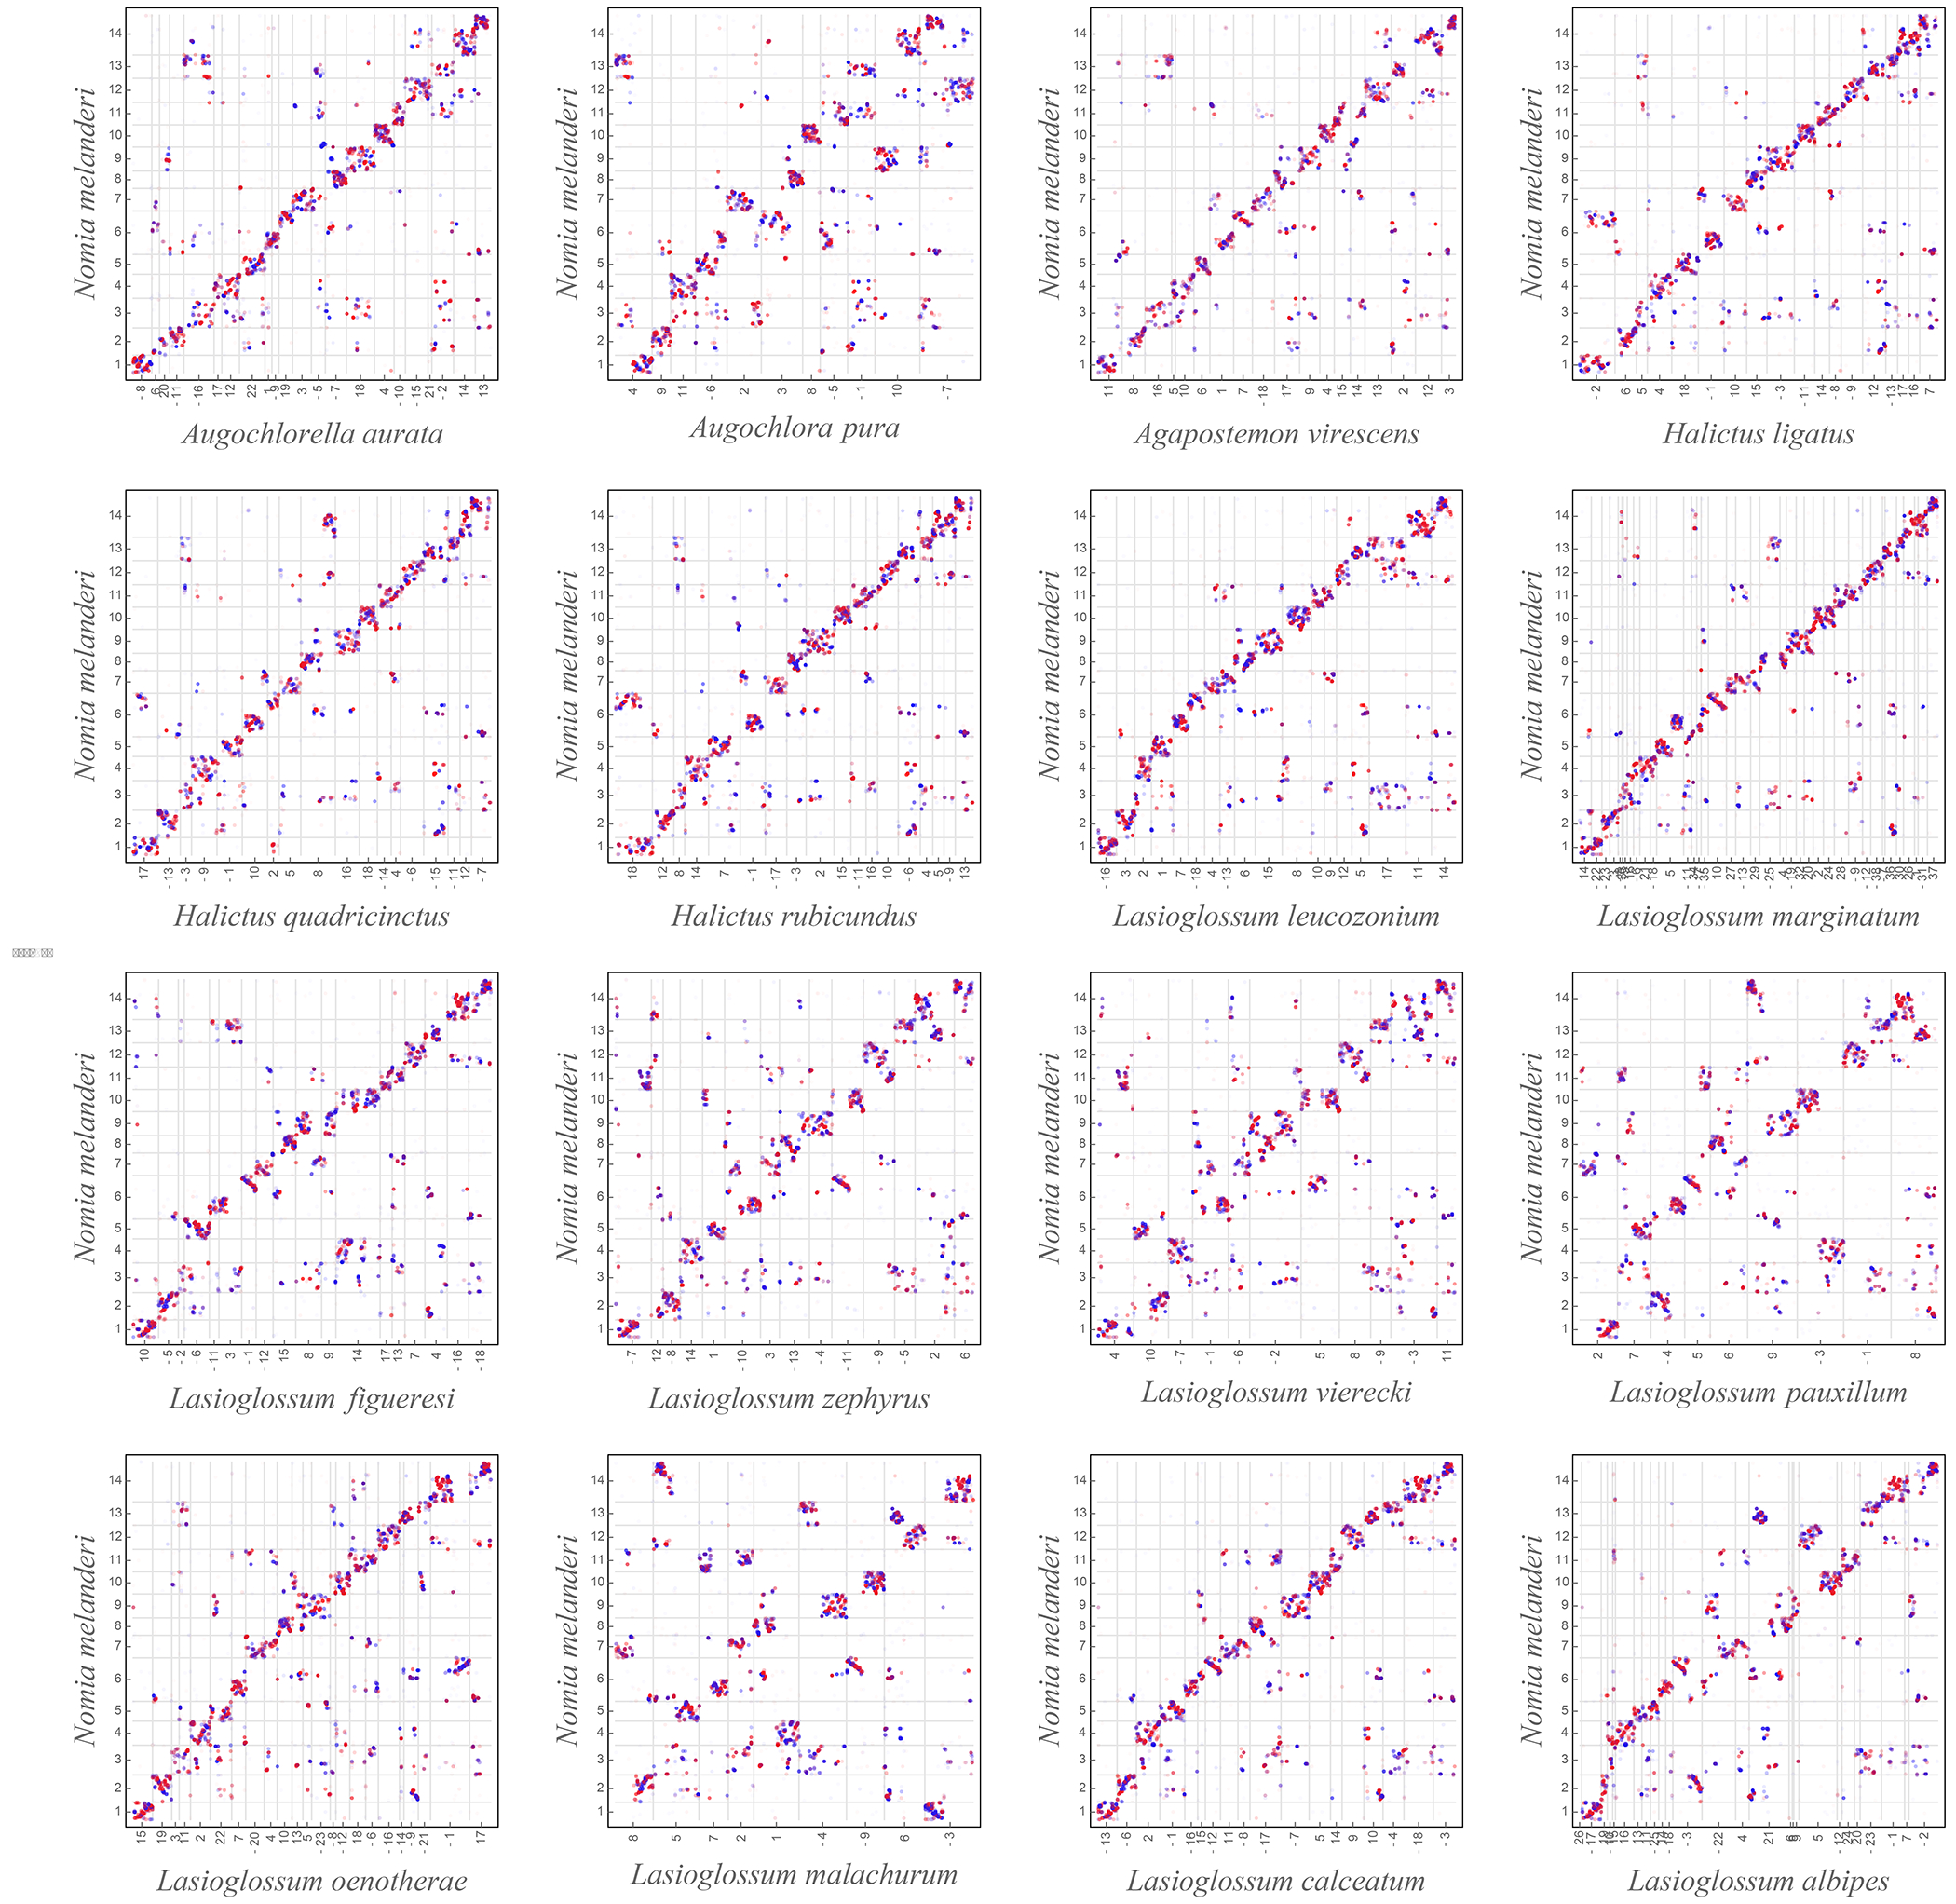
Dotplots showing alignment of chromosome-length scaNolds from 16 bee assemblies against the N. melanderi (NMEL) chromosome-length genome assembly. The NMEL reference (generated as part of this study) is shown on the y-axis. The x-axis shows the chromosome-length scaNolds in the respective bee assemblies that have been ordered and oriented to best match the NMEL chromosomes in order to facilitate comparison. The vertical and horizontal lines outline the boundaries of chromosomes in respective species, and the numbers on the axes mark the relevant chromosome name and orientation, with ‘-’ in front of the chromosome name representing a reverse complement to the chromosome sequence as reported in the assembly. Each dot represents the position of a 1000 bp syntenic stretch between the two genomes identified by Progressive Cactus alignments. The colour of the dots reflects the orientation of individual alignments with respect to NMEL (red indicates collinearity, whereas blue indicates inverted orientation). The dotplots illustrate that, with the exception of a few species, highly conserved regions belonging to the same chromosome in one species tend to lie on the same chromosome in other bee species, even though their relative position within a chromosome may change dramatically. This rearrangement pattern accounts for the characteristic appearance of the dotplots with large diNuse blocks of scrambled chromosome-to-chromosome alignments appearing along the diagonal. The pattern is visibly diNerent from those characteristic of mammalian chromosome evolution (for example, see Extended Data Fig. 3). The few exceptions are species with multiple fissions (L. marginatum, L. albipes) and fusions (Augochlora pura, L. vierecki, L. pauxillum, L. malachurum) events. In the fission species, the syntenic regions that belonged to two diNerent chromosomes in one bee species tend to belong to diNerent chromosomes after the fission. The analysis of the fusion species suggests that the regions corresponding to separate chromosomes in the closely related species (and likely the ancestral species) remain separate in the new genome, possibly corresponding to the two chromosome arms. The alignments have been extracted from the hal file using the cactus hal2maf utility with the following parameters: –maxRefGap 500 – maxBlockLen 1000 –refGenome NMEL.
Extended Data Fig. 5: Relationship between selection and gene age associated with eusocial origins, maintenance, and reversions to solitary life histories.
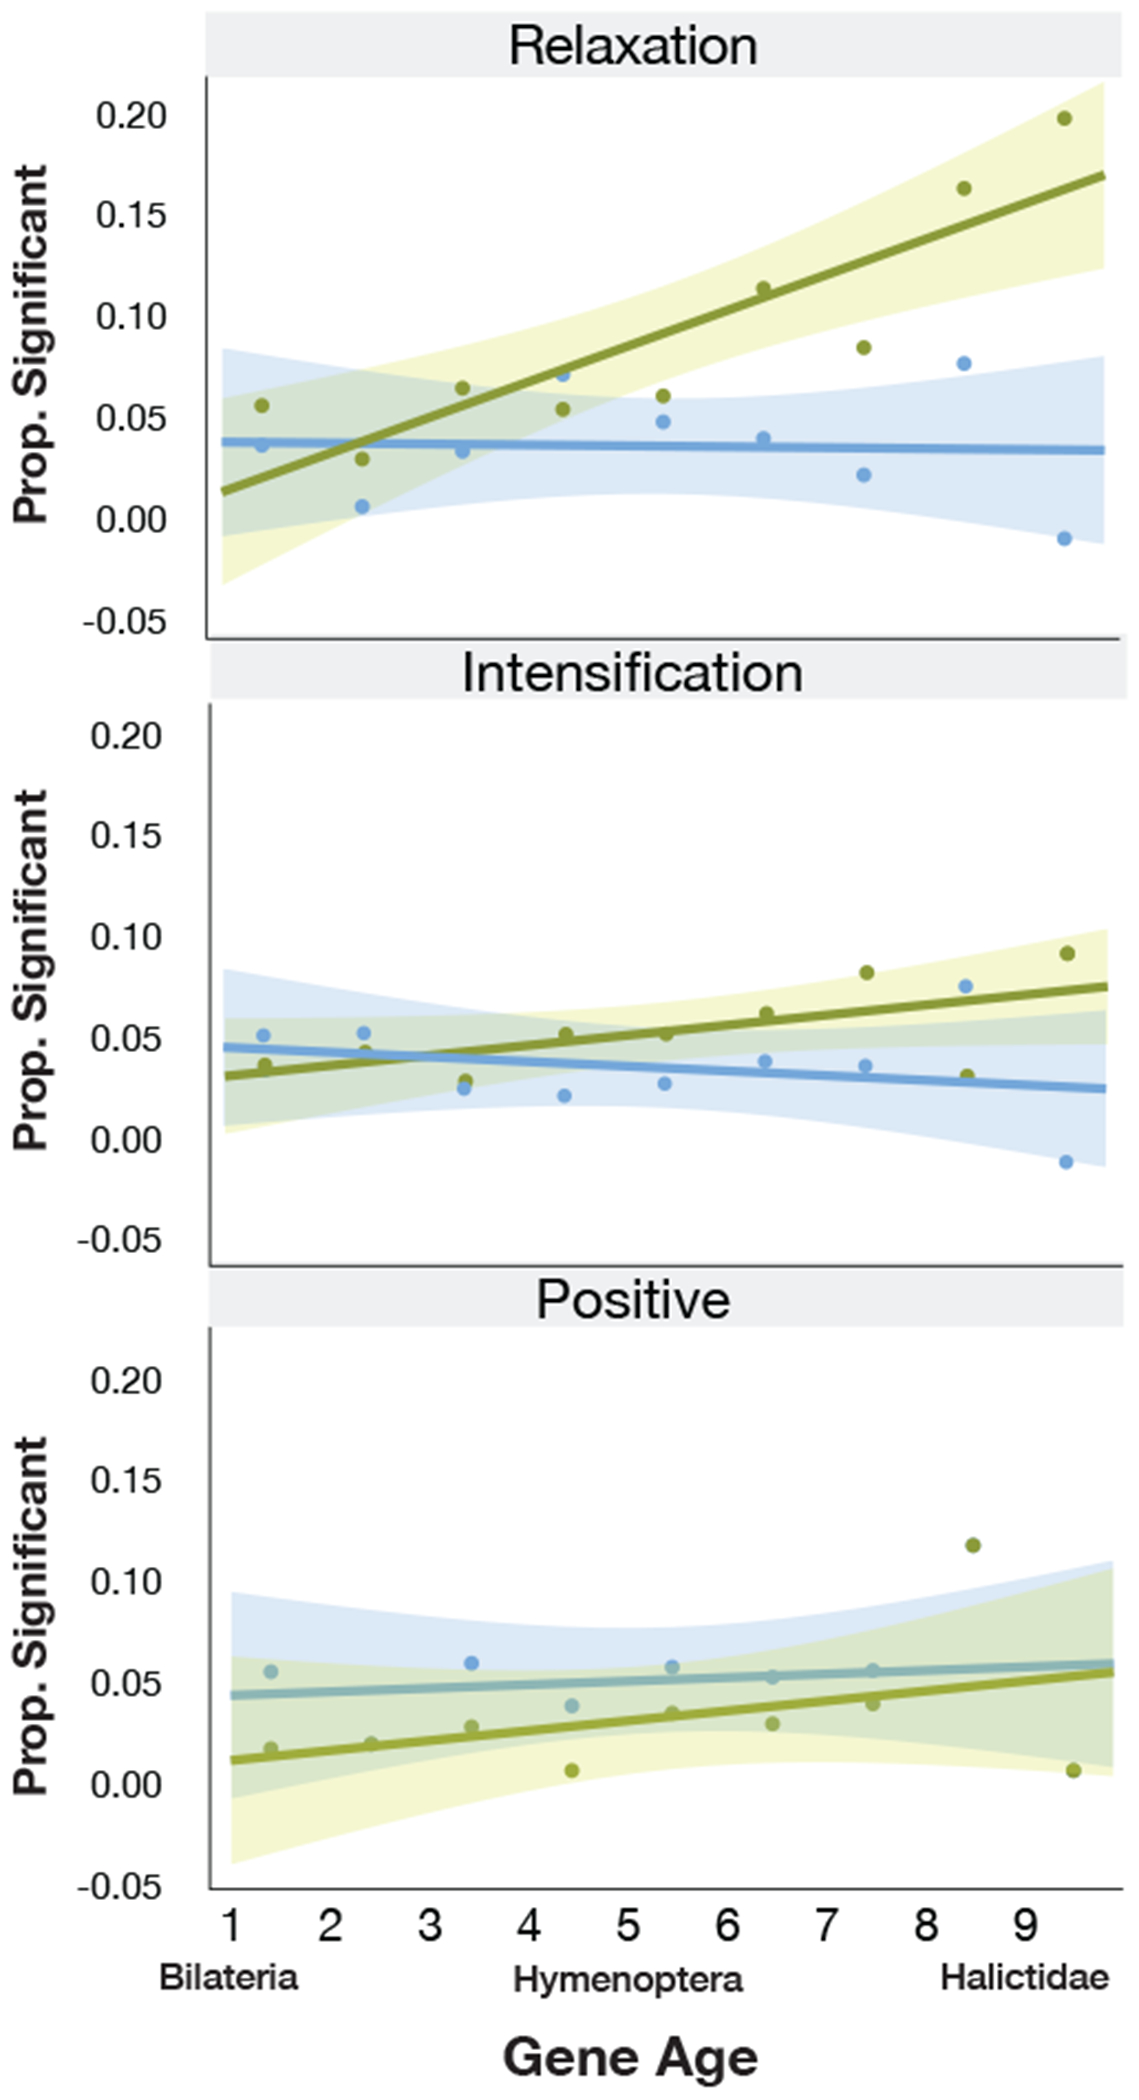
Gene age ranges from the oldest Bilaterian group (Age=1) to the youngest, halictid-specific taxonomically restricted genes (Age=9). The relaxation panel demonstrates that there is a greater proportion of young genes experiencing relaxed selection when eusociality is lost (HyPhy RELAX, FDR < 0.1; Pearson’s r = 0.869, p = 0.002); we find no significant association with relaxation on extant, eusocial branches (Pearson correlation, r = −0.044, p = 0.91). Next, we looked at the sets of genes that show intensification of selection pressures (HyPhy RELAX, FDR < 0.1), but neither of these sets showed any significant association with gene age (Eusocial: Pearson correlation, r = 0.244, p = 0.492; Solitary: Pearson correlation, r = 0.627, p = 0.071). Finally, we looked at genes that showed evidence of positive selection (HyPhy aBSREL, FDR < 0.05). We found no relationship between gene age and the proportion of genes with evidence of positive selection on at least 1 branch representing the origins of eusociality (Positive, gains: Pearson correlation, r = 0.156, p = 0.688). Likewise, there was no relationship between gene age and the proportion of genes with evidence for positive selection (HyPhy aBSREL, FDR < 0.05) on at least 1 loss branch in the Halictini and on 1 loss branch in the Augochlorini (Positive, losses: Pearson correlation, r = 0.403, p = 0.283). Shading represents the 95% confidence intervals.
Extended Data Fig. 6: Evidence of positive selection in domains of Hex110 and ApoLpp.
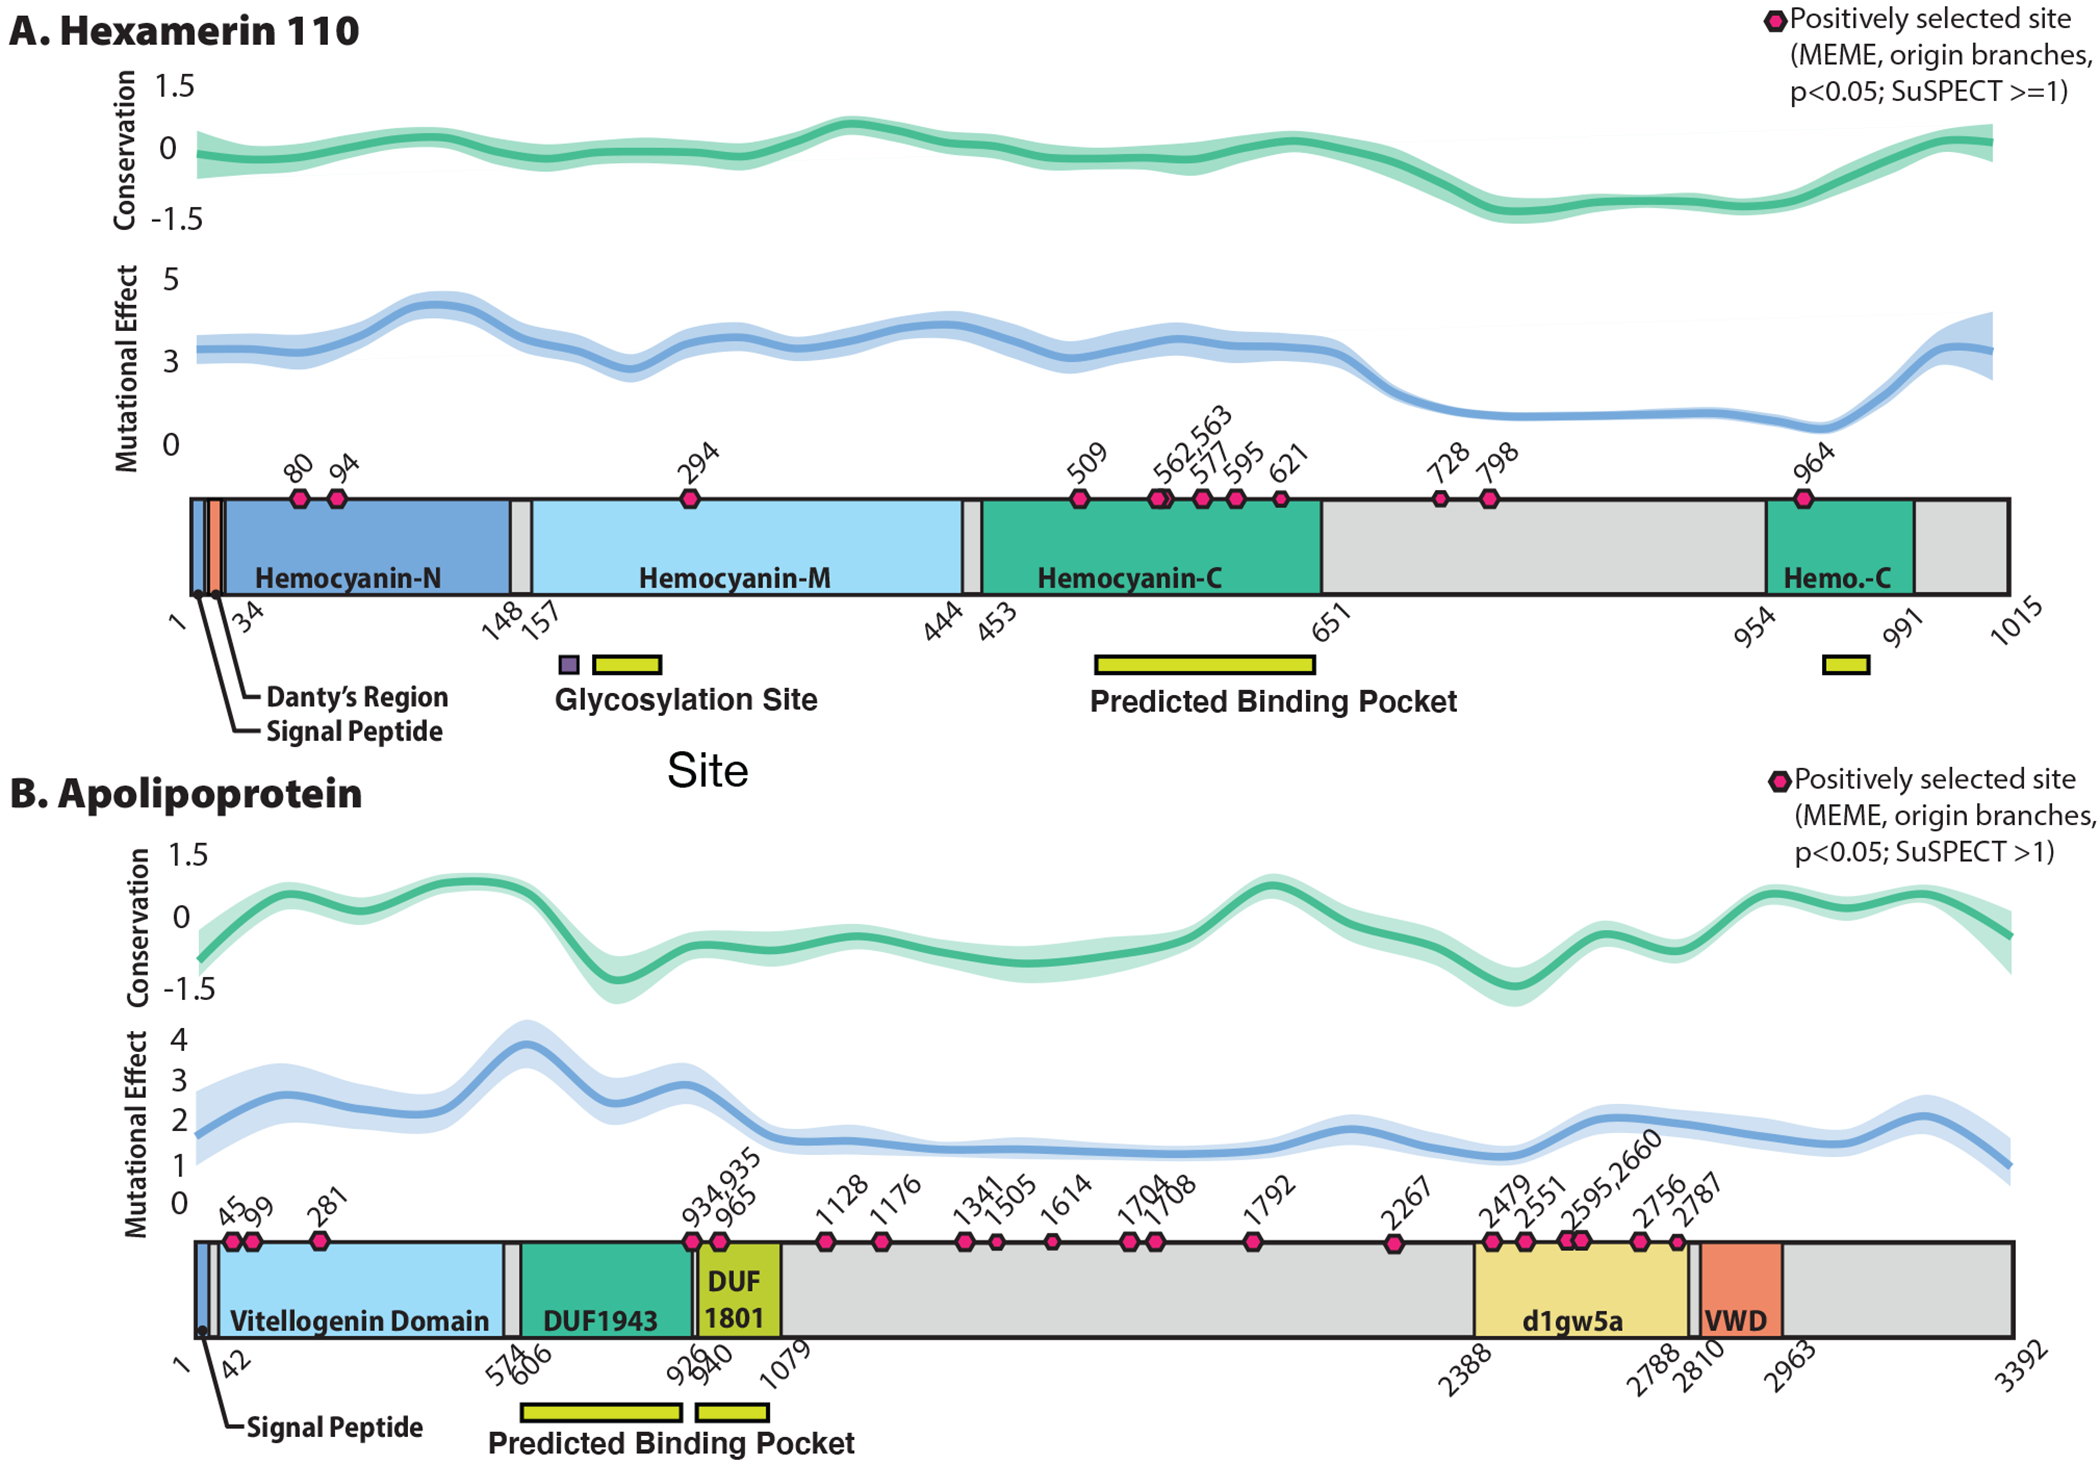
Both Hex110 (a) and ApoLpp (b) show evidence for domain-specific positive selection associated with the origins of eusociality. Predicted binding pockets by PHYRE are shown with pink rectangles, glycosylation sites in orange squares. Pink hexagons denote MEME-identified sites that also had a mutational eNect score > =1 for Hex110 and >1 for ApoLpp. In both JHBPs, MEME identifies sites in functional regions of the protein, including the receptor binding domain and predicted binding pocket for ApoLpp as well as in all three Hemocyanin domains (associated with storage functions in these proteins) and in the predicted binding pocket of Hex110. Moreover, for both proteins, we also find region-specific, faster rates of evolution on eusocial branches compared to non-eusocial outgroups in this phylogeny: the predicted binding pocket for ApoLpp and all Hemocyanin domains for Hex110. Taken together, these results suggest that positive selection shaped protein function as eusociality emerged in this group of bees.
Extended Data Fig. 7: Apolipoprotein has experienced pervasive positive selection throughout the insects.
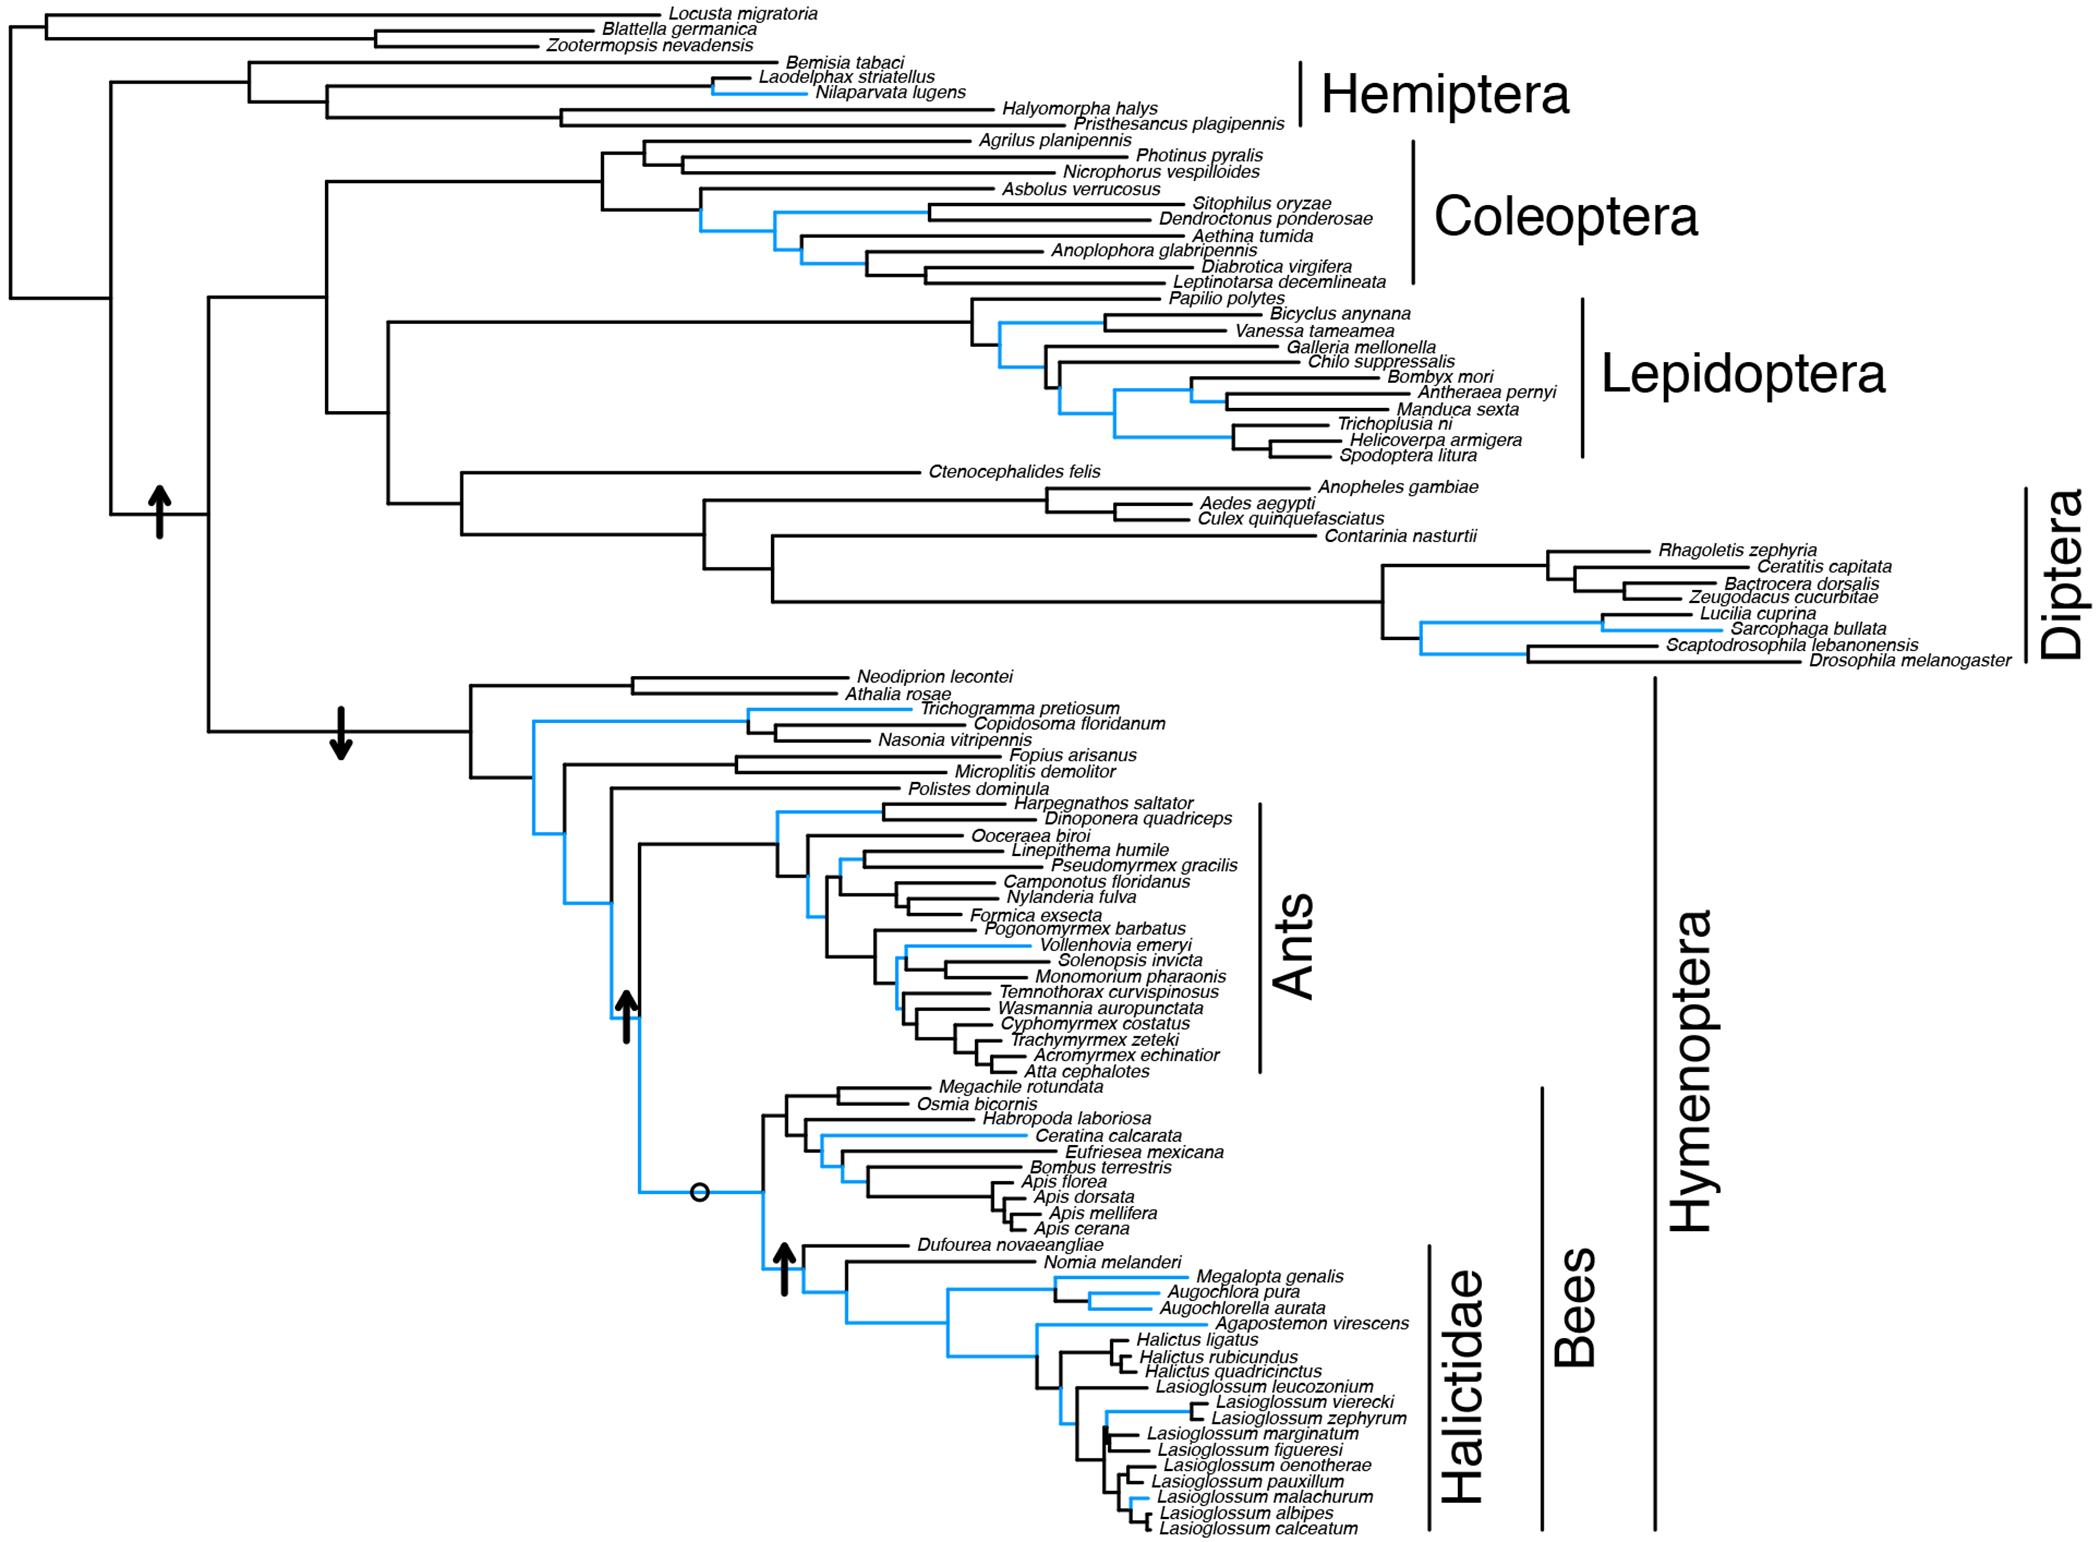
HyPhy aBSREL was used to identify branches with evidence of positive selection (highlighted in blue). Arrows indicate the direction of significant rate shifts detected on relevant branches. The only branch tested that did now show a significant rate shift is indicated by an ‘o’.
Extended Data Fig. 8: JH III is present in multiple bumblebee tissue types, including the brain.
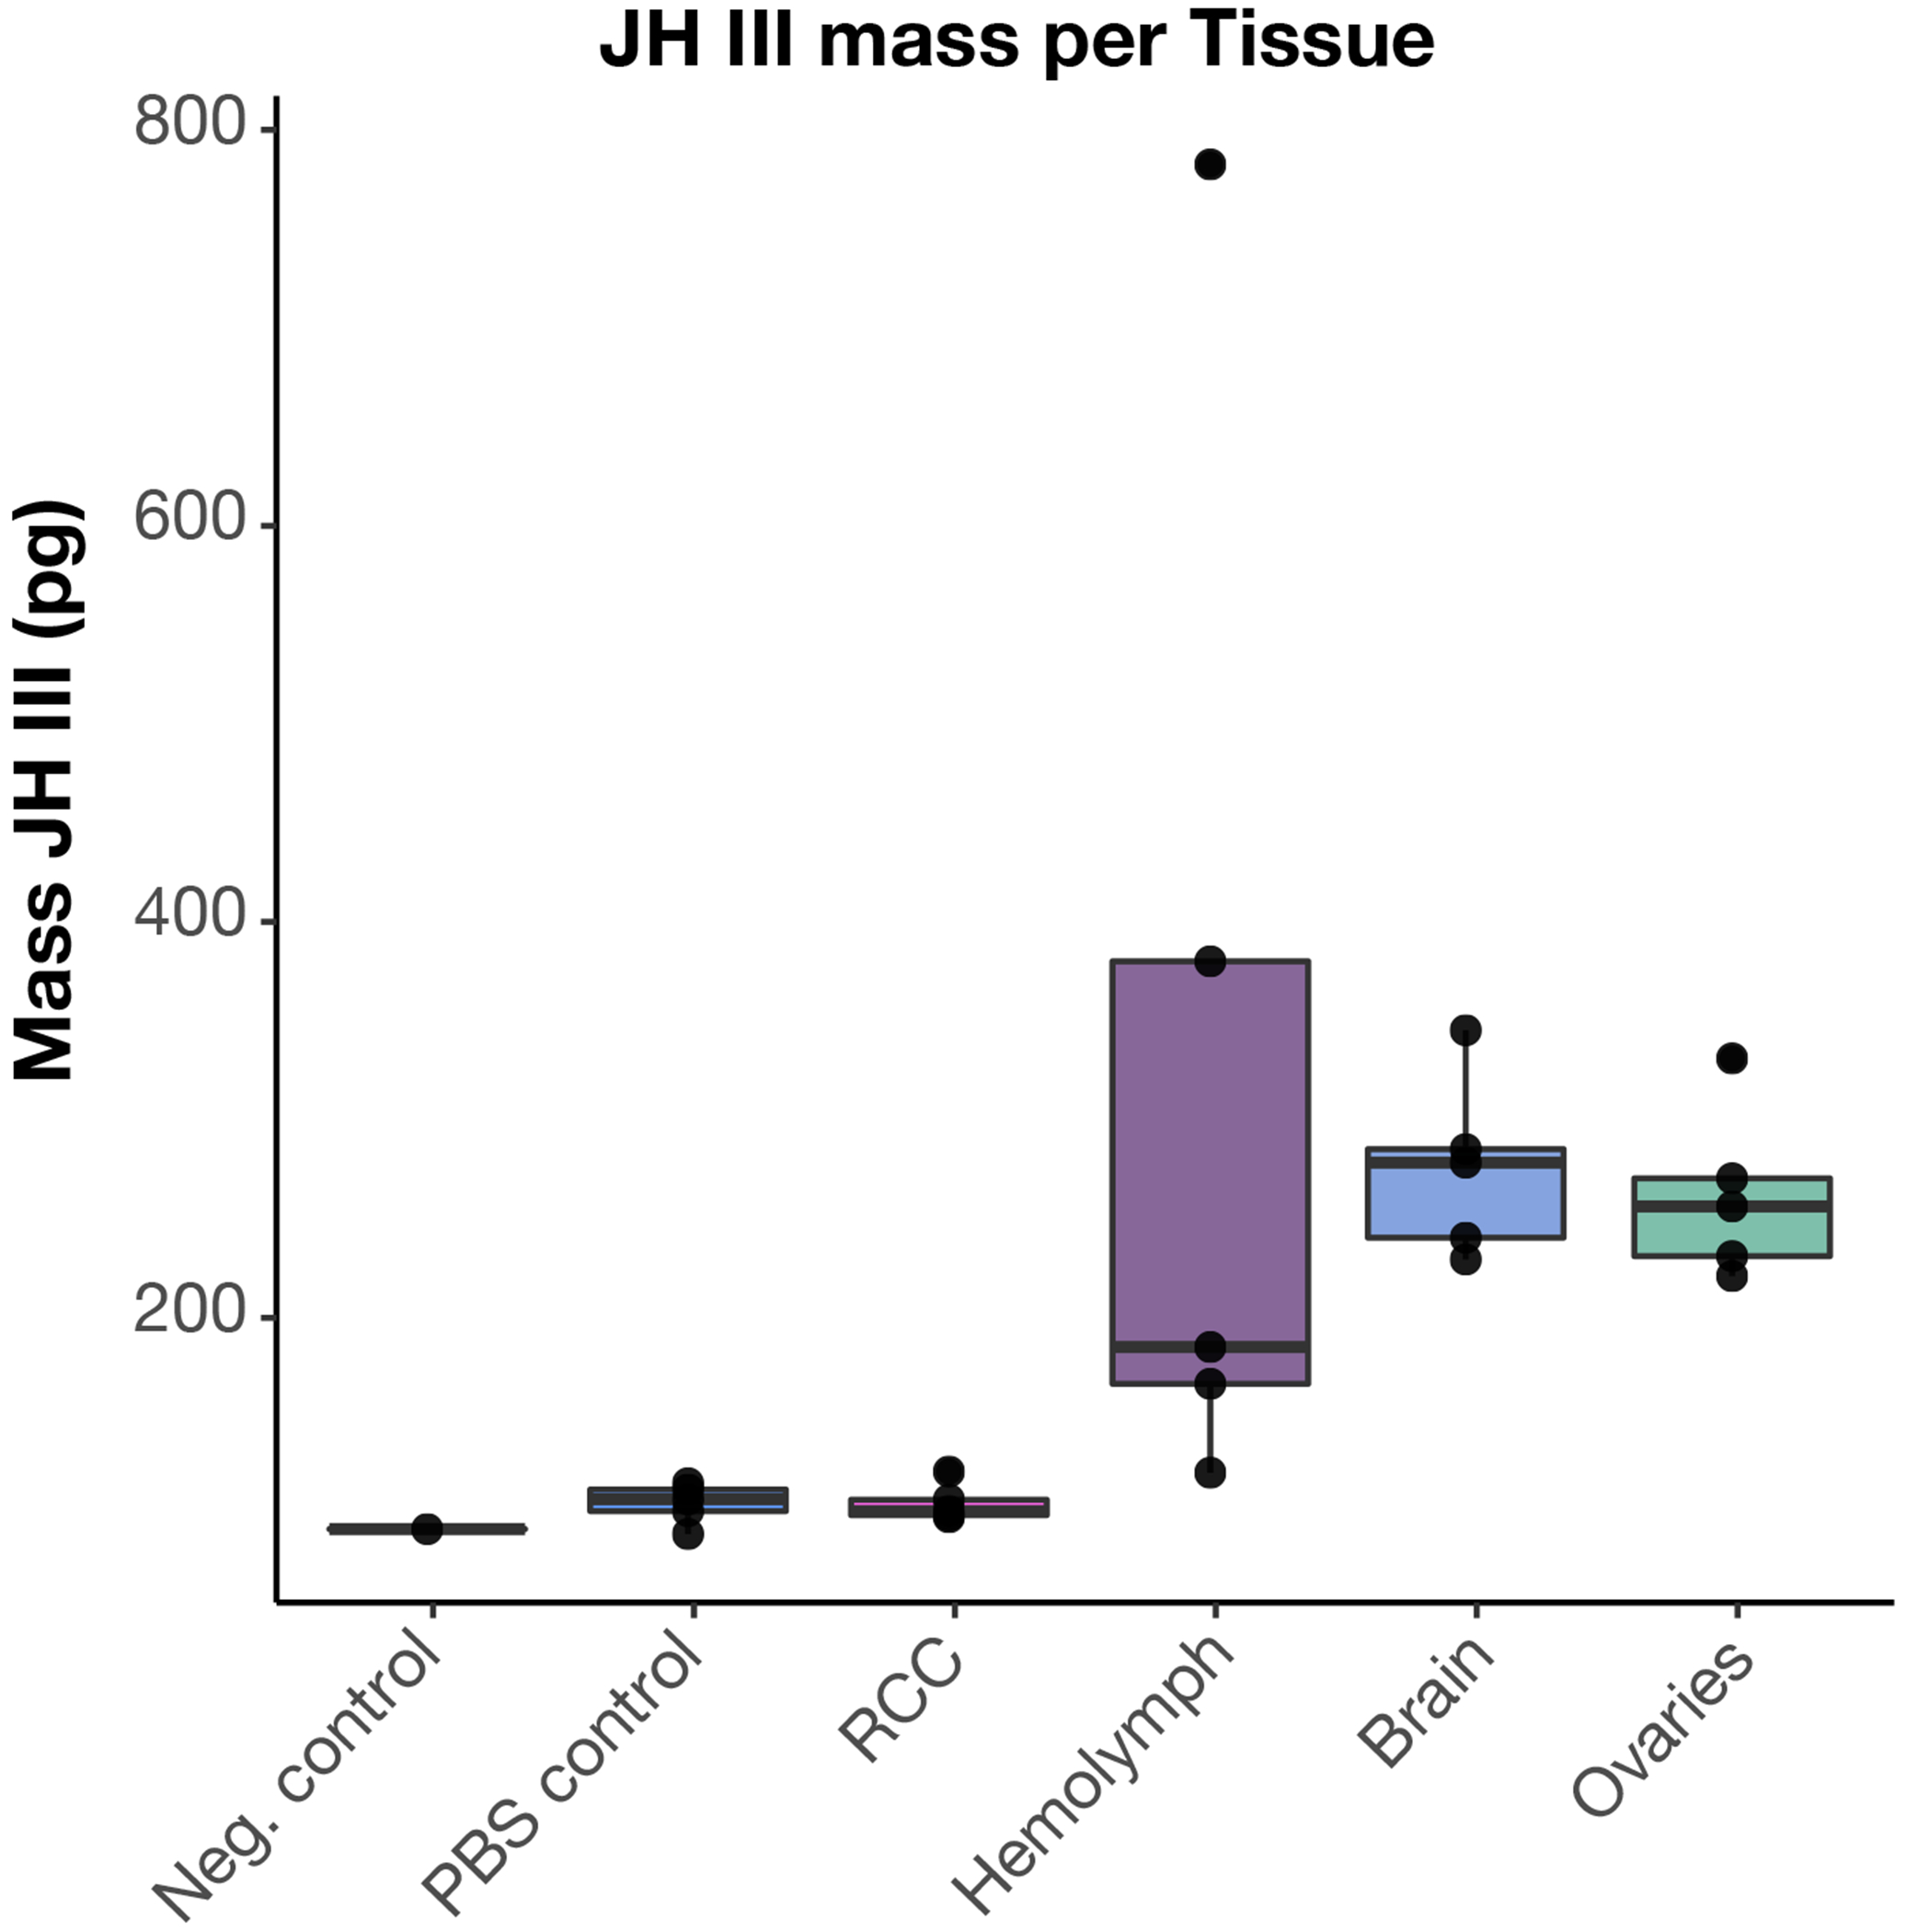
LC-MS was used to measure JH III levels in dissected brain tissue and hemolymph from worker bumblebees (Koppert). Tissues were dissected in PBS. Negative control=fresh PBS, PBS control=3uL of buNer collected following brain dissections from each sample. RCC = retrocerebral complex. The RCC synthesizes JH and immediately releases it, it is not known to store JH78. Hemolymph (3uL) was collected by centrifuging thorax tissue from each sample. Ovaries and brains were dissected in PBS and the entire organ was used for JH III quantification. In all samples, we find detectable levels of JH III in the hemolymph, brain, and ovaries. N = 5 for all sample/tissue types except negative control, where n = 1. Note that because all samples were generated by extraction in a constant volume of buNer from the total input tissue, estimated amounts are not directly comparable across diNerent tissue types. Boxes show median, 25th and 75th percentiles. Whiskers show minimum and maximum values without outliers.
Extended Data Fig. 9: Stable Isotope Tracing of Juvenile Hormone (JH).
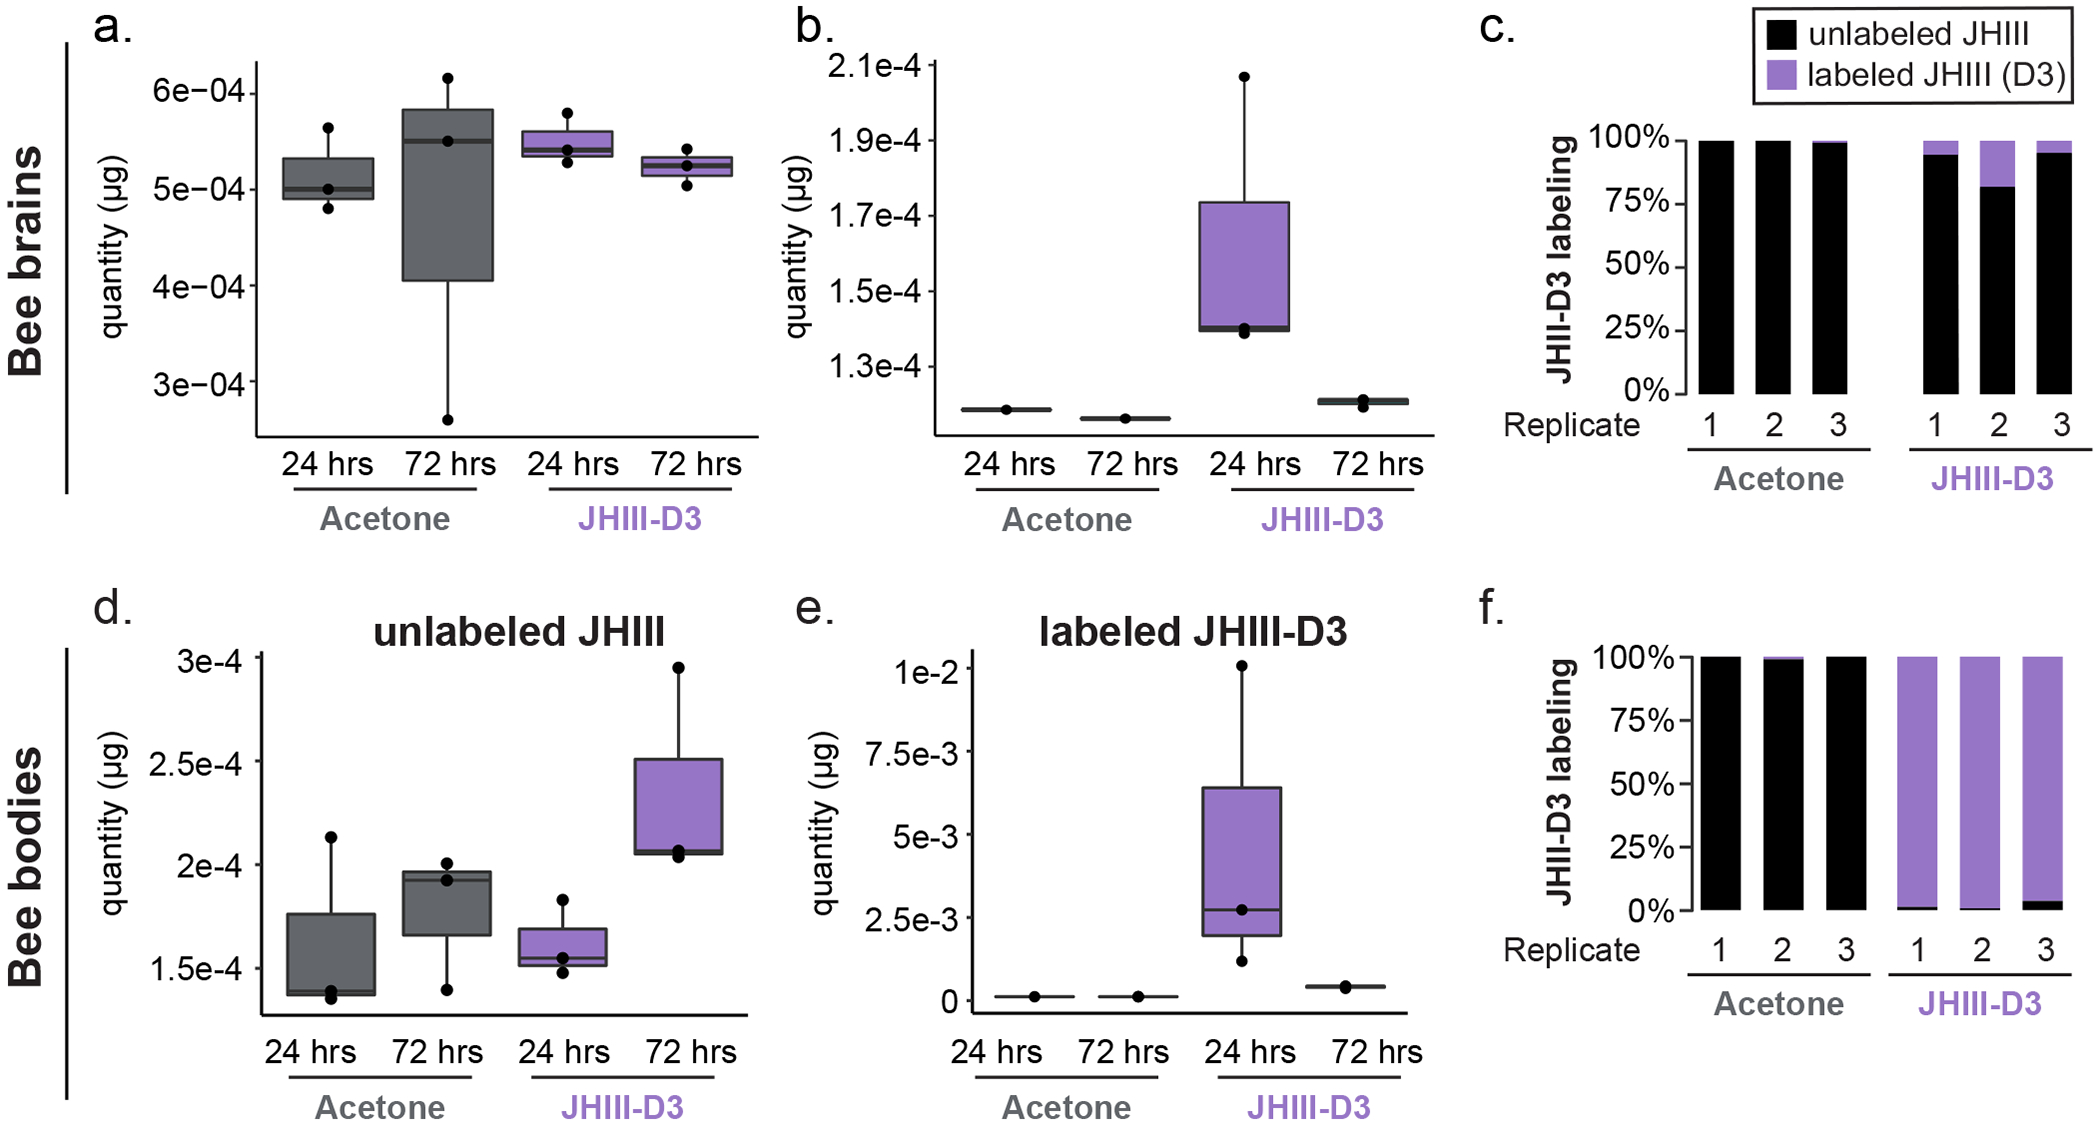
Absolute quantification of JH III in the brain (a) and bodies (d) of bumblebees treated with acetone or JH III-D3. Absolute quantification of labelled JH III in the brains (b) and bodies (e) of bees treated with acetone or JH III-D3. Labelled JH III-D3 levels are high after 24 hours, but decay significantly by 72 hours. (c) Labelled JH III-D3 applied to abdomens of bumblebees is detectable in brains 24 h later (acetone is control). n = 3 tissues/condition. (f) JH III-D3 accounts for nearly all the total JH III in bee bodies after 24 hours, indicating that the labelled compound is well-absorbed by the bee. n = 3 bumblebee workers for each experimental condition. Boxes show median, 25th and 75th percentiles. Whiskers show minimum and maximum values.
Extended Data Fig. 10: JH III and JH III-D3 quantification.
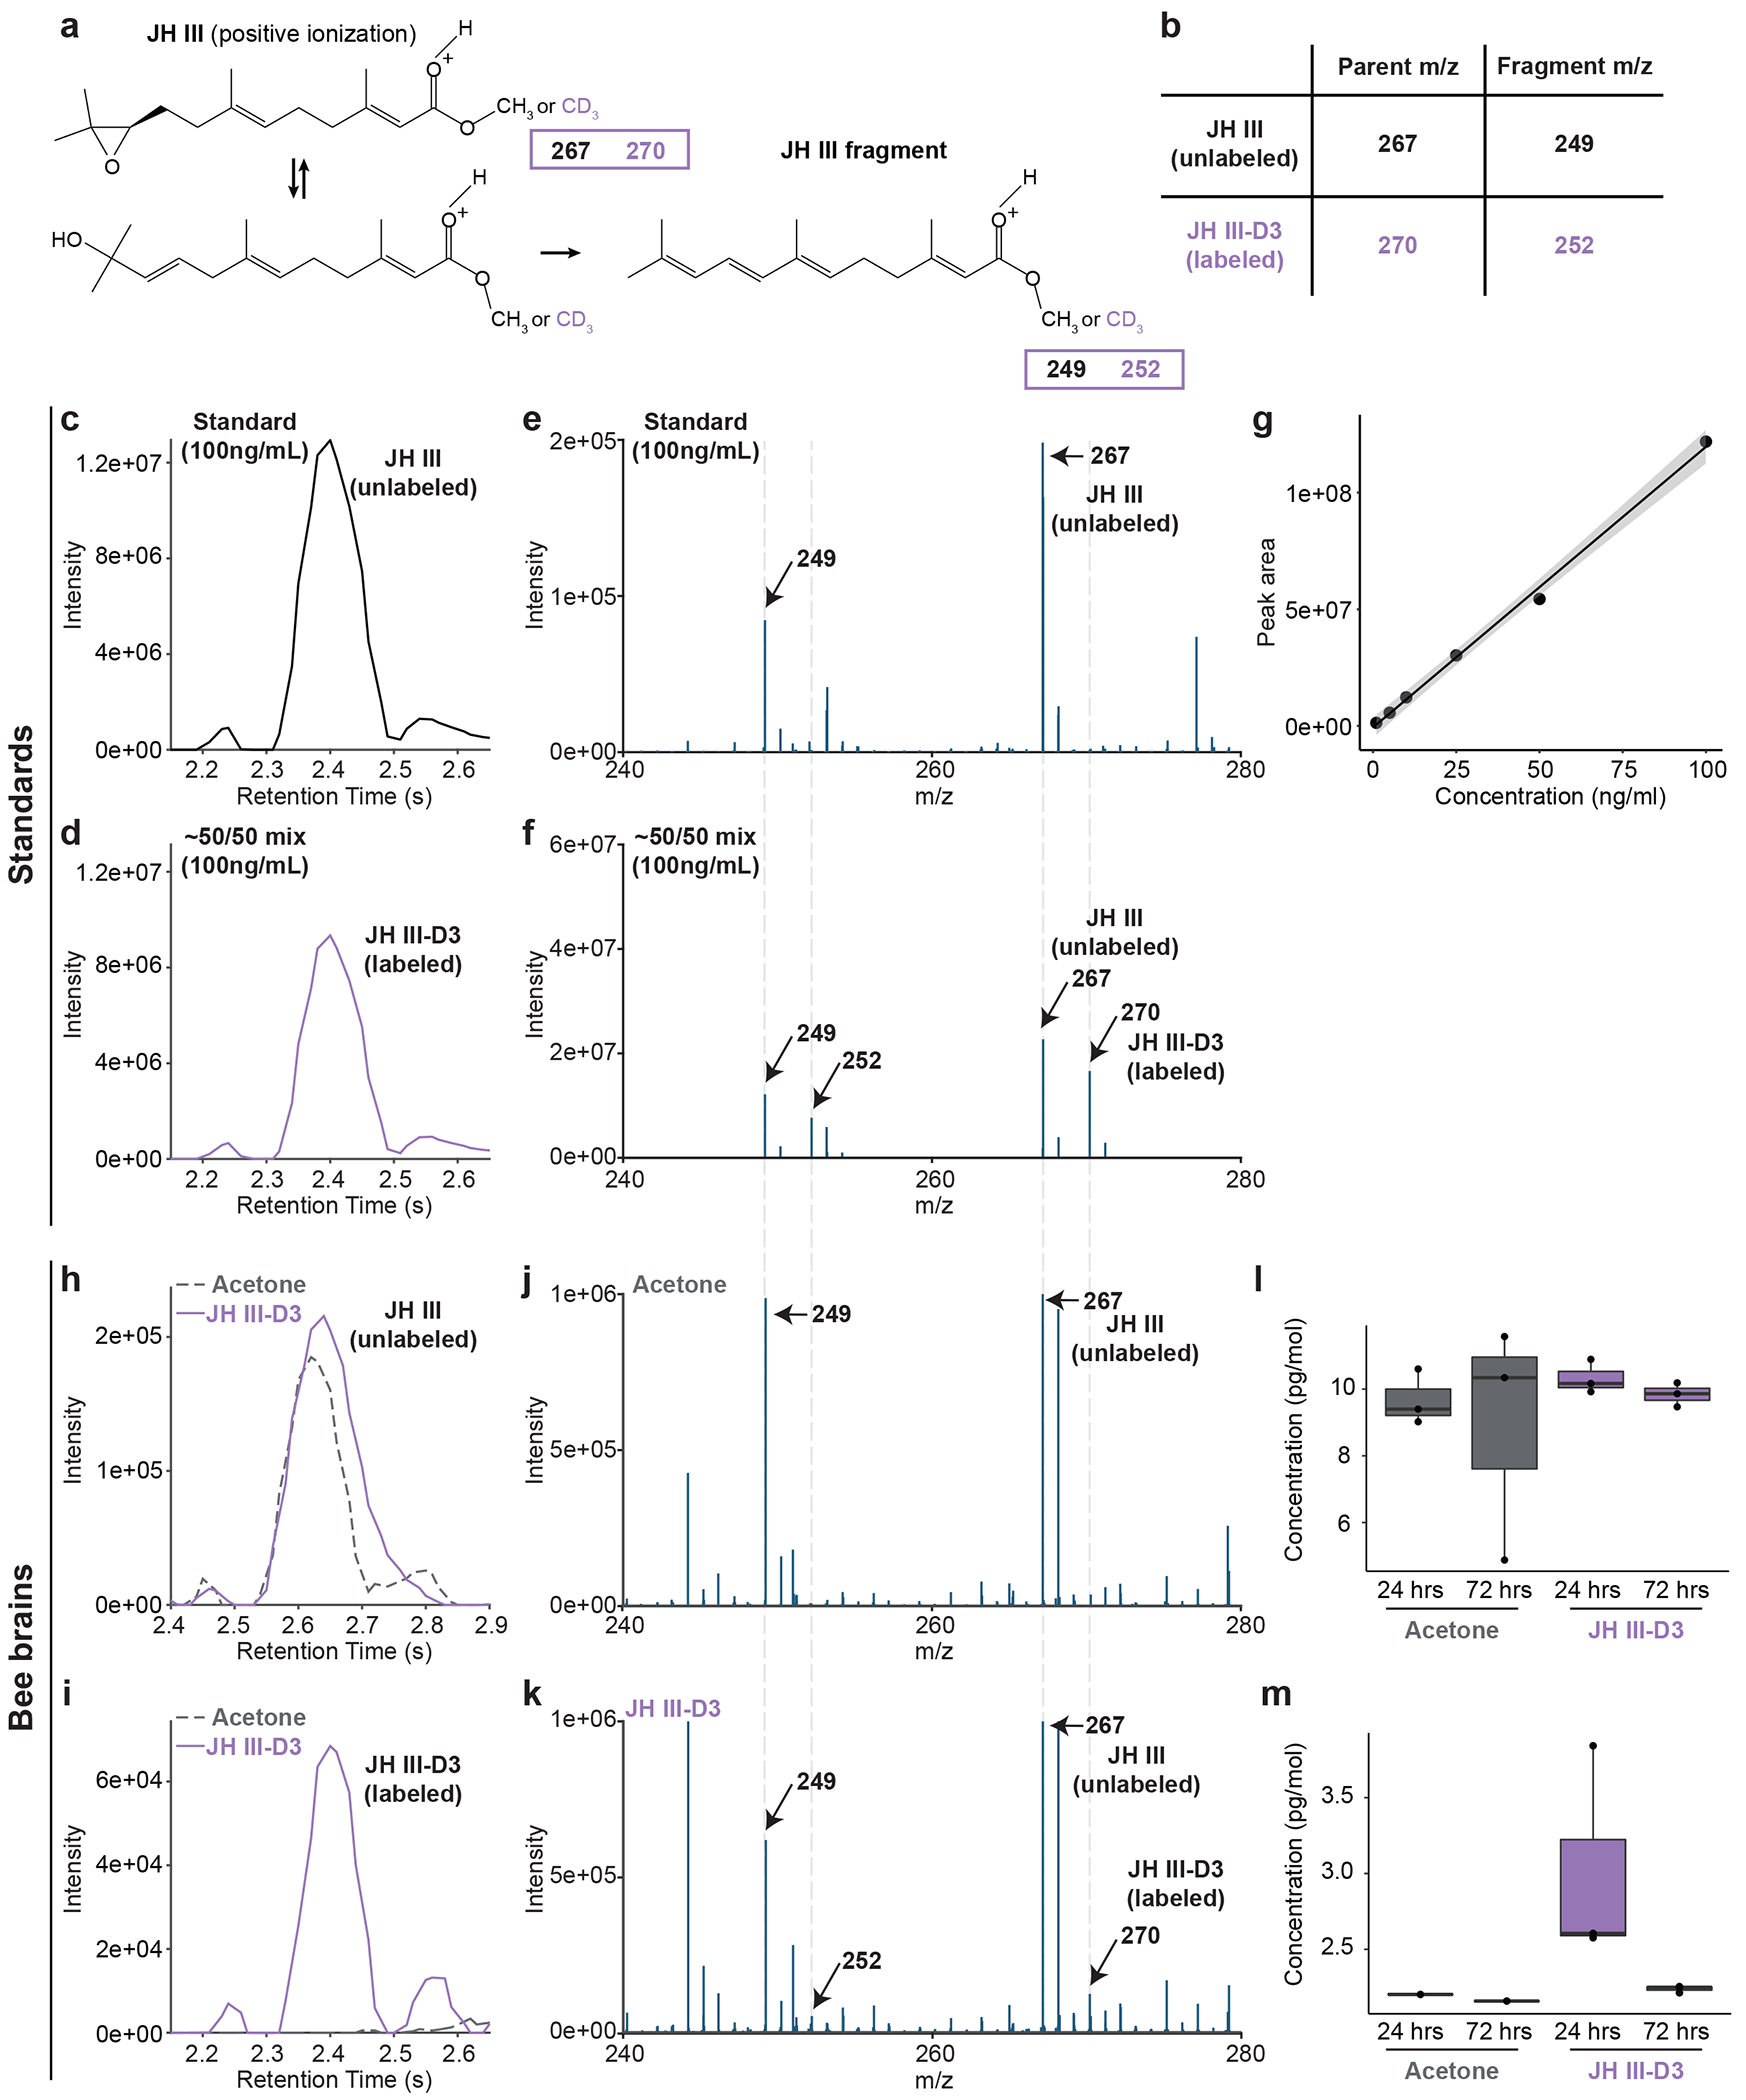
(a) Chemical structure of JH III in positive ionization. JH III can exist in two forms of equal m/z and produces one fragment that retains the D3 label. (b) Parent and fragment m/z values for unlabelled and labelled JH III. (c) Chromatograph of unlabelled JH III. (d) Chromatograph of labelled JH III showing similar retention time to unlabelled JH III. (e) Mass spectra of unlabelled JH III showing the expected masses based on B. (f) Mass spectra of a 50/50 mix of labelled and unlabelled JH III showing the expected masses based on B. (g) Standard curve demonstrating a range of detection of JH III. (h) Chromatograph of unlabelled JH III in the brains of bees painted with acetone (grey dotted line) or with JH III-D3 (purple solid line). (i) Chromatograph of labelled JH III in the brains of bees painted with acetone (grey dotted line) or with JH III-D3 (purple solid line). (j) Mass spectra of JH III in bee brains painted with acetone showing the expected masses based on B. (k) Mass spectra of JH III in bee brains painted with JH III-D3 showing the expected masses based on B. (l) Absolute quantification of JH III in the brains of bees painted with acetone or JH III-D3. (m) Absolute quantification of JH III-D3 in the brains of bees painted with acetone or JH III-D3. n = 3 replicates for each panel. Boxes show median and 25th and 75th percentiles. Whiskers show minimum and maximum values.
Supplementary Material
Acknowledgments:
We would like to thank our many colleagues that contributed samples and field support to this dataset, including: Jason Gibbs, Sam Droege, Raphael Jeanson, Joan Milam, Jakub Straka, Marion Podolak, James Cane, and Mallory Hagadorn. We also thank Miriam Richards, Cecile Plateaux-Quenu, Jason Gibbs, and Laurence Packer for discussion and insights on halictid life history and behavior. Tim Sackton, Russ Corbett-Detig, Nathan Clark, Adam Siepel, and Xander Xue provided discussion and advice on data analysis. We also thank Wenfei Tong for the bee drawings and Michael Sheehan for assistance with RNA library preparation. Finally, thank you to Joshua Rabinowitz and lab for support and access to LC-MS equipment. This work was supported by NSF-DEB1754476 awarded to SDK and BGH, NIH 1DP2GM137424-01 to SDK, USDA NIFA postdoctoral fellowship 2018-67012-28085 to BERR, DFG PA632/9 to RJP, a Smithsonian Global Genome Initiative award GGI-Peer-2016-100 to WTW and CK, a Smithsonian Institution Competitive Grants Program for Biogenomics (WTW, KMK, BMJ), a Smithsonian Tropical Research Institute fellowship to CK, and a gift from Jennifer and Greg Johnson to WTW. MFO was supported by Vicerrectoría de Investigación, UCR, project B7287. ELA was supported by an NSF Physics Frontiers Center Award (PHY1427654), the Welch Foundation (Q-1866), a USDA Agriculture and Food Research Initiative Grant (2017-05741), and an NIH Encyclopedia of DNA Elements Mapping Center Award (UM1HG009375). Sampling permit details: SDK, ESW, and MFO (R-055-2017-OT-CONAGEBIO), SDK (P526P-15-04026), and RJP (Belfast City Council, Parks & Leisure Dept).
Footnotes
Code Availability: Repository with code is on github at https://github.com/kocherlab/HalictidCompGen.
Competing interests: The authors declare no competing interests.
Data Availability:
Raw sequencing data is available NCBI under the following accession numbers: PRJNA613468, PRJNA629833, PRJNA718331, and PRJNA512907 (Hi-C). Hi-C data is also available at www.dnazoo.org. Genomes and browsers can be accessed at beenomes.princeton.edu and on NCBI: SUB9464533. Please address inquiries or material requests to skocher@princeton.edu.
References
- 1.Kocher SD & Paxton RJ Comparative methods offer powerful insights into social evolution in bees. Apidologie 45, 289–305 (2014). [Google Scholar]
- 2.Schwarz MP, Richards MH & Danforth BN Changing paradigms in insect social evolution: insights from halictine and allodapine bees. Annu. Rev. Entomol 52, 127–150 (2007). [DOI] [PubMed] [Google Scholar]
- 3.Kocher SD et al. The genetic basis of a social polymorphism in halictid bees. Nat. Commun 9, 4338 (2018). [DOI] [PMC free article] [PubMed] [Google Scholar]
- 4.Wcislo WT & Danforth BN Secondarily solitary: the evolutionary loss of social behavior. Trends Ecol. Evol 12, 468–474 (1997). [DOI] [PubMed] [Google Scholar]
- 5.Gibbs J, Brady SG, Kanda K & Danforth BN Phylogeny of halictine bees supports a shared origin of eusociality for Halictus and Lasioglossum (Apoidea: Anthophila: Halictidae). Mol. Phylogenet. Evol 65, 926–939 (2012). [DOI] [PubMed] [Google Scholar]
- 6.Danforth BN, Conway L & Ji S Phylogeny of eusocial Lasioglossum reveals multiple losses of eusociality within a primitively eusocial clade of bees (Hymenoptera: Halictidae). Syst. Biol 52, 23–36 (2003). [DOI] [PubMed] [Google Scholar]
- 7.Batra SWT Nests and social behavior of halictine bees of India (Hymenoptera: Halictidae). Indian J. Entomol 28, 375 (1966). [Google Scholar]
- 8.Michener CD The Social Behavior of the Bees. A Comparative Study (1974). [Google Scholar]
- 9.Plateaux-Quénu C Un nouveau type de société d’Insectes: Halictus marginatus Brullé (Hym., Apoidea). In Annales Biologiques vol. 35 325–455 (ci.nii.ac.jp, 1959). [Google Scholar]
- 10.Michener CD Comparative social behavior of bees. Annu. Rev. Entomol (1969). [Google Scholar]
- 11.Kapheim KM et al. Draft genome assembly and population genetics of an agricultural pollinator, the solitary alkali bee (Halictidae: Nomia melanderi). G3: Genes, Genomes, Genetics 9, 625–634 (2019). [DOI] [PMC free article] [PubMed] [Google Scholar]
- 12.Kapheim KM et al. Genomic signatures of evolutionary transitions from solitary to group living. Science 348, 1139–1143 (2015). [DOI] [PMC free article] [PubMed] [Google Scholar]
- 13.Kapheim KM et al. Developmental plasticity shapes social traits and selection in a facultatively eusocial bee. Proc. Natl. Acad. Sci. U. S. A 117, 13615–13625 (2020). [DOI] [PMC free article] [PubMed] [Google Scholar]
- 14.Johnson BR Taxonomically restricted genes are fundamental to biology and evolution. Front. Genet 9, 407 (2018). [DOI] [PMC free article] [PubMed] [Google Scholar]
- 15.Jasper WC et al. Large-scale coding sequence change underlies the evolution of postdevelopmental novelty in honey bees. Mol. Biol. Evol 32, 334–346 (2015). [DOI] [PubMed] [Google Scholar]
- 16.Johnson BR & Linksvayer TA Deconstructing the superorganism: social physiology, groundplans, and sociogenomics. Q. Rev. Biol 85, 57–79 (2010). [DOI] [PubMed] [Google Scholar]
- 17.Feldmeyer B, Elsner D & Foitzik S Gene expression patterns associated with caste and reproductive status in ants: worker-specific genes are more derived than queen-specific ones. Mol. Ecol 23, 151–161 (2014). [DOI] [PubMed] [Google Scholar]
- 18.Ferreira PG et al. Transcriptome analyses of primitively eusocial wasps reveal novel insights into the evolution of sociality and the origin of alternative phenotypes. Genome Biol. 14, R20 (2013). [DOI] [PMC free article] [PubMed] [Google Scholar]
- 19.Johnson BR & Tsutsui ND Taxonomically restricted genes are associated with the evolution of sociality in the honey bee. BMC Genomics 12, 164 (2011). [DOI] [PMC free article] [PubMed] [Google Scholar]
- 20.Simola DF et al. Social insect genomes exhibit dramatic evolution in gene composition and regulation while preserving regulatory features linked to sociality. Genome Res. 23, 1235–1247 (2013). [DOI] [PMC free article] [PubMed] [Google Scholar]
- 21.Warner MR, Qiu L, Holmes MJ, Mikheyev AS & Linksvayer TA Convergent eusocial evolution is based on a shared reproductive groundplan plus lineage-specific plastic genes. Nat. Commun. 10, 2651 (2019). [DOI] [PMC free article] [PubMed] [Google Scholar]
- 22.Molodtsova D, Harpur BA, Kent CF, Seevananthan K & Zayed A Pleiotropy constrains the evolution of protein but not regulatory sequences in a transcription regulatory network influencing complex social behaviors. Front. Genet 5, 431 (2014). [DOI] [PMC free article] [PubMed] [Google Scholar]
- 23.Søvik E, Bloch G & Ben-Shahar Y Function and evolution of microRNAs in eusocial Hymenoptera. Front. Genet 6, 193 (2015). [DOI] [PMC free article] [PubMed] [Google Scholar]
- 24.Engelmann F & Mala J The interactions between juvenile hormone (JH), lipophorin, vitellogenin, and JH esterases in two cockroach species. Insect Biochem. Mol. Biol 30, 793–803 (2000). [DOI] [PubMed] [Google Scholar]
- 25.de Kort CAD & Koopmanschap AB Molecular characteristics of lipophorin, the juvenile hormone-binding protein in the hemolymph of the Colorado potato beetle. Arch. Insect Biochem. Physiol 5, 255–269 (1987). [Google Scholar]
- 26.Sevala VL, Bachmann JAS & Schal C Lipophorin: A hemolymph juvenile hormone binding protein in the german cockroach, Blattella germanica. Insect Biochem. Mol. Biol 27, 663–670 (1997). [Google Scholar]
- 27.Martins JR, Nunes FMF, Cristino AS, Simões ZLP & Bitondi MMG The four hexamerin genes in the honey bee: structure, molecular evolution and function deduced from expression patterns in queens, workers and drones. BMC Mol. Biol 11,23 (2010). [DOI] [PMC free article] [PubMed] [Google Scholar]
- 28.Ismail SM & Gillott C Identification, characterization, and developmental profile of a high molecular weight, juvenile hormone-binding protein in the hemolymph of the migratory grasshopper, Melanoplus sanguinipes. Arch. Insect Biochem. Physiol. 29, 415–430 (1995). [Google Scholar]
- 29.Daneman R & Barres BA The blood-brain barrier--lessons from moody flies. Cell 123, 9–12 (2005). [DOI] [PubMed] [Google Scholar]
- 30.Stork T et al. Organization and function of the blood-brain barrier in Drosophila. J. Neurosci 28, 587–597 (2008). [DOI] [PMC free article] [PubMed] [Google Scholar]
- 31.Nene V. et al. Genome sequence of Aedes aegypti, a major arbovirus vector. Science 316, 1718–1723 (2007). [DOI] [PMC free article] [PubMed] [Google Scholar]
- 32.Dudchenko O et al. De novo assembly of the Aedes aegypti genome using Hi-C yields chromosome-length scaffolds. Science 356, 92–95 (2017). [DOI] [PMC free article] [PubMed] [Google Scholar]
- 33.Ashby R, Forêt S, Searle I & Maleszka R MicroRNAs in honey bee caste determination. Sci. Rep 6, 18794 (2016). [DOI] [PMC free article] [PubMed] [Google Scholar]
- 34.Kapheim KM et al. Brain microRNAs among social and solitary bees. R Soc Open Sci 7, 200517 (2020). [DOI] [PMC free article] [PubMed] [Google Scholar]
- 35.Collins DH et al. MicroRNAs associated with caste determination and differentiation in a primitively eusocial insect. Sci. Rep 7, 1–9 (2017). [DOI] [PMC free article] [PubMed] [Google Scholar]
- 36.Behura SK & Whitfield CW Correlated expression patterns of microRNA genes with age-dependent behavioural changes in honeybee. Insect Mol. Biol 19, 431–439 (2010). [DOI] [PubMed] [Google Scholar]
- 37.Liu F et al. Next-generation small RNA sequencing for microRNAs profiling in Apis mellifera: comparison between nurses and foragers. Insect Mol. Biol 21, 297–303 (2012). [DOI] [PubMed] [Google Scholar]
- 38.Greenberg JK et al. Behavioral plasticity in honey bees is associated with differences in brain microRNA transcriptome. Genes Brain Behav. 11, 660–670 (2012). [DOI] [PMC free article] [PubMed] [Google Scholar]
- 39.Nunes FMF, Ihle KE, Mutti NS, Simões ZLP & Amdam GV The gene vitellogenin affects microRNA regulation in honey bee (Apis mellifera) fat body and brain. J. Exp. Biol 216, 3724–3732 (2013). [DOI] [PubMed] [Google Scholar]
- 40.Bendena WG, Hui JHL, Chin-Sang I & Tobe SS Neuropeptide and microRNA regulators of juvenile hormone production. Gen. Comp. Endocrinol 295, 113507 (2020). [DOI] [PubMed] [Google Scholar]
- 41.Simåo FA, Waterhouse RM, Ioannidis P, Kriventseva EV & Zdobnov EM BUSCO: assessing genome assembly and annotation completeness with single-copy orthologs. Bioinformatics 31, 3210–3212 (2015). [DOI] [PubMed] [Google Scholar]
- 42.Armstrong J et al. Progressive alignment with Cactus: a multiple-genome aligner for the thousand-genome era. Cold Spring Harbor Laboratory 730531 (2019) doi: 10.1101/730531. [DOI] [Google Scholar]
- 43.Chen S, Krinsky BH & Long M New genes as drivers of phenotypic evolution. Nat. Rev. Genet 14, 645–660 (2013). [DOI] [PMC free article] [PubMed] [Google Scholar]
- 44.Sinha S, Liang Y & Siggia E Stubb: a program for discovery and analysis of cis-regulatory modules. Nucleic Acids Res. 34, W555–9 (2006). [DOI] [PMC free article] [PubMed] [Google Scholar]
- 45.Lowe CB et al. Three periods of regulatory innovation during vertebrate evolution. Science 333, 1019–1024 (2011). [DOI] [PMC free article] [PubMed] [Google Scholar]
- 46.Miura K, Oda M, Makita S & Chinzei Y Characterization of the Drosophila Methoprene-tolerant gene product: Juvenile hormone binding and ligand-dependent gene regulation. FEBS J. 272, 1169–1178 (2005). [DOI] [PubMed] [Google Scholar]
- 47.Charles J-P et al. Ligand-binding properties of a juvenile hormone receptor, Methoprene-tolerant. Proc. Natl. Acad. Sci. U. S. A 108, 21128–21133 (2011). [DOI] [PMC free article] [PubMed] [Google Scholar]
- 48.Li M, Mead EA & Zhu J Heterodimer of two bHLH-PAS proteins mediates juvenile hormone-induced gene expression. Proc. Natl. Acad. Sci. U. S. A 108, 638–643 (2011). [DOI] [PMC free article] [PubMed] [Google Scholar]
- 49.Zhang Z, Xu J, Sheng Z, Sui Y & Palli SR Steroid receptor co-activator is required for juvenile hormone signal transduction through a bHLH-PAS transcription factor, Methoprene Tolerant. J. Biol. Chem 286, 8437–8447 (2011). [DOI] [PMC free article] [PubMed] [Google Scholar]
- 50.Otto N et al. The sulfite oxidase Shopper controls neuronal activity by regulating glutamate homeostasis in Drosophila ensheathing glia. Nat. Commun 9, 3514 (2018). [DOI] [PMC free article] [PubMed] [Google Scholar]
- 51.Quinn PMJ, Moreira PI, Ambrósio AF & Alves CH PINK1/PARKIN signalling in neurodegeneration and neuroinflammation. Acta Neuropathol Commun 8, 189 (2020). [DOI] [PMC free article] [PubMed] [Google Scholar]
- 52.Wittwer B. et al. Solitary bees reduce investment in communication compared with their social relatives. Proc. Natl. Acad. Sci. U. S. A 114, 6569–6574 (2017). [DOI] [PMC free article] [PubMed] [Google Scholar]
- 53.Lahti DC et al. Relaxed selection in the wild. Trends Ecol. Evol 24, 487–496 (2009). [DOI] [PubMed] [Google Scholar]
- 54.Wertheim JO, Murrell B, Smith MD, Kosakovsky Pond SL & Scheffler K RELAX: detecting relaxed selection in a phylogenetic framework. Mol. Biol. Evol 32, 820–832 (2015). [DOI] [PMC free article] [PubMed] [Google Scholar]
- 55.Martin RM & Cardoso MC Chromatin condensation modulates access and binding of nuclear proteins. FASEB J. 24, 1066–1072 (2010). [DOI] [PMC free article] [PubMed] [Google Scholar]
- 56.Wyatt CDR et al. Genetic toolkit for sociality predicts castes across the spectrum of social complexity in wasps. Cold Spring Harbor Laboratory 2020.12.08.407056 (2020) doi: 10.1101/2020.12.08.407056. [DOI] [Google Scholar]
- 57.Wang M, Zhao Y & Zhang B Efficient test and visualization of multi-set intersections. Sci. Rep 5, 16923 (2015). [DOI] [PMC free article] [PubMed] [Google Scholar]
- 58.Loiseau P, Davies T, Williams LS, Mishima M & Palacios IM Drosophila PAT1 is required for Kinesin-1 to transport cargo and to maximize its motility. Development 137, 2763–2772 (2010). [DOI] [PMC free article] [PubMed] [Google Scholar]
- 59.Hidayat P & Goodman WG Juvenile hormone and hemolymph juvenile hormone binding protein titers and their interaction in the hemolymph of fourth stadium Manduca sexta. Insect Biochem. Mol. Biol 24, 709–715 (1994). [Google Scholar]
- 60.Hartfelder K & Emlen DJ 11 - Endocrine Control of Insect Polyphenism. in Insect Endocrinology (ed. Gilbert LI) 464–522 (Academic Press, 2012). [Google Scholar]
- 61.Burmester T. Evolution and function of the insect hexamerins. Eur. J. Entomol 96, 213–226 (1999). [Google Scholar]
- 62.Smolenaars MMW, Madsen O, Rodenburg KW & Van der Horst DJ Molecular diversity and evolution of the large lipid transfer protein superfamilys. J. Lipid Res 48, 489–502 (2007). [DOI] [PubMed] [Google Scholar]
- 63.Telfer WH & Kunkel JG The function and evolution of insect storage hexamers. Annu. Rev. Entomol 36, 205–228 (1991). [DOI] [PubMed] [Google Scholar]
- 64.Fan Y, Schal C, Vargo EL & Bagnères A-G Characterization of termite lipophorin and its involvement in hydrocarbon transport. J. Insect Physiol 50, 609–620 (2004). [DOI] [PubMed] [Google Scholar]
- 65.Gu X, Quilici D, Juarez P, Blomquist GJ & Schal C Biosynthesis of hydrocarbons and contact sex pheromone and their transport by lipophorin in females of the German cockroach (Blattella germanica). J. Insect Physiol 41, 257–267 (1995). [Google Scholar]
- 66.Fan Y, Chase J, Sevala VL & Schal C Lipophorin-facilitated hydrocarbon uptake by oocytes in the German cockroach Blattella germanica (L.). J. Exp. Biol 205, 781–790 (2002). [DOI] [PubMed] [Google Scholar]
- 67.Schal C. et al. Tissue distribution and lipophorin transport of hydrocarbons and sex pheromones in the house fly, Musca domestica. J. Insect Sci 1, 12 (2001). [PMC free article] [PubMed] [Google Scholar]
- 68.Zhou X, Oi FM & Scharf ME Social exploitation of hexamerin: RNAi reveals a major caste-regulatory factor in termites. Proc. Natl. Acad. Sci. U. S. A 103, 4499–4504 (2006). [DOI] [PMC free article] [PubMed] [Google Scholar]
- 69.Scharf ME, Buckspan CE, Grzymala TL & Zhou X Regulation of polyphenic caste differentiation in the termite Reticulitermes flavipes by interaction of intrinsic and extrinsic factors. J. Exp. Biol 210, 4390–4398 (2007). [DOI] [PubMed] [Google Scholar]
- 70.Hunt JH et al. A diapause pathway underlies the gyne phenotype in Polistes wasps, revealing an evolutionary route to caste-containing insect societies. Proc. Natl. Acad. Sci. U. S. A 104, 14020–14025 (2007). [DOI] [PMC free article] [PubMed] [Google Scholar]
- 71.Hawkings C, Calkins TL, Pietrantonio PV & Tamborindeguy C Caste-based differential transcriptional expression of hexamerins in response to a juvenile hormone analog in the red imported fire ant (Solenopsis invicta). PLoS One 14, e0216800 (2019). [DOI] [PMC free article] [PubMed] [Google Scholar]
- 72.Hunt JH et al. Differential gene expression and protein abundance evince ontogenetic bias toward castes in a primitively eusocial wasp. PLoS One 5, e10674 (2010). [DOI] [PMC free article] [PubMed] [Google Scholar]
- 73.Zhou X, Tarver MR & Scharf ME Hexamerin-based regulation of juvenile hormone-dependent gene expression underlies phenotypic plasticity in a social insect. Development 134, 601–610 (2007). [DOI] [PubMed] [Google Scholar]
- 74.Murrell B. et al. Detecting individual sites subject to episodic diversifying selection. PLoS Genet. 8, e1002764 (2012). [DOI] [PMC free article] [PubMed] [Google Scholar]
- 75.Hartfelder K. Insect juvenile hormone: from “status quo” to high society. Braz. J. Med. Biol. Res 33, 157–177 (2000). [DOI] [PubMed] [Google Scholar]
- 76.Smith AR, Kapheim KM, Pérez-Ortega B, Brent CS & Wcislo WT Juvenile hormone levels reflect social opportunities in the facultatively eusocial sweat bee Megalopta genalis (Hymenoptera: Halictidae). Horm. Behav 63, 1–4 (2013). [DOI] [PubMed] [Google Scholar]
- 77.Tibbetts EA & Izzo AS Endocrine mediated phenotypic plasticity: condition-dependent effects of juvenile hormone on dominance and fertility of wasp queens. Horm. Behav 56, 527–531 (2009). [DOI] [PubMed] [Google Scholar]
- 78.Frederik Nijhout H. Insect Hormones. (Princeton University Press, 1998). [Google Scholar]
- 79.Bloch G, Wheeler DE & Robinson GE 40 - Endocrine Influences on the Organization of Insect Societies. in Hormones, Brain and Behavior (eds. Pfaff DW, Arnold AP, Fahrbach SE, Etgen AM & Rubin RT) 195–235 (Academic Press, 2002). [Google Scholar]
- 80.West-Eberhard MJ Wasp societies as microcosms for the study of development and evolution. Natural history and evolution of paper wasps 290, 317 (1996). [Google Scholar]
- 81.Brankatschk M & Eaton S Lipoprotein particles cross the blood-brain barrier in Drosophila. J. Neurosci 30, 10441–10447 (2010). [DOI] [PMC free article] [PubMed] [Google Scholar]
- 82.Pandey A & Bloch G Juvenile hormone and ecdysteroids as major regulators of brain and behavior in bees. Current Opinion in Insect Science 12, 26–37 (2015). [Google Scholar]
- 83.Glastad KM et al. Epigenetic regulator CoREST controls social behavior in ants. Mol. Cell 77, 338–351.e6 (2020). [DOI] [PMC free article] [PubMed] [Google Scholar]
- 84.Rubin BER, Jones BM, Hunt BG & Kocher SD Rate variation in conserved noncoding DNA reveals regulatory pathways associated with social evolution. Cold Spring Harbor Laboratory 461079 (2018) doi: 10.1101/461079. [DOI] [Google Scholar]
- 85.Tong C, Avilés L, Rayor LS, Mikheyev AS & Linksvayer TA Genomic signatures of recent convergent transitions to social life in spiders. bioRxiv (2021) doi: 10.1101/2021.01.27.428473. [DOI] [PMC free article] [PubMed] [Google Scholar]
- 86.Nijhout HF & Wheeler DE Juvenile hormone and the physiological basis of insect polymorphisms. Q. Rev. Biol 57, 109–133 (1982). [Google Scholar]
- 87.Nijhout HF & Reed MC A mathematical model for the regulation of juvenile hormone titers. J. Insect Physiol 54, 255–264 (2008). [DOI] [PubMed] [Google Scholar]
- 88.West-Eberhard MJ Phenotypic Plasticity and the origins of diversity. Annu. Rev. Ecol. Syst 20, 249–278 (1989). [Google Scholar]
- 89.Ju L. et al. Hormonal gatekeeping via the blood brain barrier governs behavior. bioRxiv 2022.12.01.518733 (2022) doi: 10.1101/2022.12.01.518733. [DOI] [PMC free article] [PubMed] [Google Scholar]
- 90.Corbitt TS & Hardie J Juvenile hormone effects on polymorphism in the pea aphid, Acyrthosiphon pisum. Entomol. Exp. Appl 38, 131–135 (1985). [Google Scholar]
- 91.Zera AJ & Denno RF Physiology and ecology of dispersal polymorphism in insects. Annu. Rev. Entomol 42, 207–230 (1997). [DOI] [PubMed] [Google Scholar]
- 92.Bell WJ Factors controlling initiation of vitellogenesis in a primitively social bee, Lasioglossum zephyrum (Hymenoptera: Halictidae). Insectes Soc. 20, 253–260 (1973). [Google Scholar]
- 93.Shpigler HY et al. Juvenile hormone regulates brain-reproduction tradeoff in bumble bees but not in honey bees. Horm. Behav 126, 104844 (2020). [DOI] [PubMed] [Google Scholar]
- 94.Pandey A, Motro U & Bloch G Juvenile hormone interacts with multiple factors to modulate aggression and dominance in groups of orphan bumble bee (Bombus terrestris) workers. Horm Behav 117, 104602 (2020). [DOI] [PubMed] [Google Scholar]
- 95.Amdam GV, Csondes A, Fondrk MK & Page RE Jr. Complex social behaviour derived from maternal reproductive traits. Nature 439, 76–78 (2006). [DOI] [PMC free article] [PubMed] [Google Scholar]
- 96.Amdam GV, Norberg K, Fondrk MK & Page RE Jr. Reproductive ground plan may mediate colony-level selection effects on individual foraging behavior in honey bees. Proc. Natl. Acad. Sci. U. S. A 101, 11350–11355 (2004). [DOI] [PMC free article] [PubMed] [Google Scholar]
- 97.Page RE, Scheiner R, Erber J & Amdam GV The development and evolution of division of labor and foraging specialization in a social insect (Apis mellifera L.). in Current Topics in Developmental Biology vol. 74 253–286 (Academic Press, 2006). [DOI] [PMC free article] [PubMed] [Google Scholar]
- 98.Turillazzi S & West-Eberhard MJ Natural history and evolution of paper-wasps. (Oxford University Press Oxford, 1996). [Google Scholar]
- 99.West-Eberhard MJ Flexible strategy and social evolution. Animal societies. Theories and facts (1987). [Google Scholar]
- 100.West-Eberhard MJ Developmental Plasticity and Evolution. (Oxford University Press, 2003). [Google Scholar]
- 101.Toth AL & Robinson GE Evo-devo and the evolution of social behavior. Trends Genet. 23, 334–341 (2007). [DOI] [PubMed] [Google Scholar]
- 102.Toth AL et al. Brain transcriptomic analysis in paper wasps identifies genes associated with behaviour across social insect lineages. Proc. Biol. Sci 277, 2139–2148 (2010). [DOI] [PMC free article] [PubMed] [Google Scholar]
- 103.Berens AJ, Hunt JH & Toth AL Comparative transcriptomics of convergent evolution: different genes but conserved pathways underlie caste phenotypes across lineages of eusocial insects. Mol. Biol. Evol 32, 690–703 (2015). [DOI] [PubMed] [Google Scholar]
- 104.Rittschof CC & Robinson GE Behavioral genetic toolkits: toward the evolutionary origins of complex phenotypes. Curr. Top. Dev. Biol 119, 157–204 (2016). [DOI] [PubMed] [Google Scholar]
- 105.Qiu B. et al. Towards reconstructing the ancestral brain gene-network regulating caste differentiation in ants. Nat Ecol Evol 2, 1782–1791 (2018). [DOI] [PMC free article] [PubMed] [Google Scholar]
- 106.Feldmeyer B. et al. Evidence for a conserved queen-worker genetic toolkit across slave-making ants and their ant hosts. Mol. Ecol 31, 4991–5004 (2022). [DOI] [PubMed] [Google Scholar]
- 107.Weisenfeld NI, Kumar V, Shah P, Church DM & Jaffe DB Direct determination of diploid genome sequences. Genome Res. 27, 757–767 (2017). [DOI] [PMC free article] [PubMed] [Google Scholar]
- 108.Waterhouse RM et al. BUSCO Applications from quality assessments to gene prediction and phylogenomics. Mol. Biol. Evol 35, 543–548 (2018). [DOI] [PMC free article] [PubMed] [Google Scholar]
- 109.Seppey M, Manni M & Zdobnov EM BUSCO: Assessing genome assembly and annotation completeness. Methods Mol. Biol 1962, 227–245 (2019). [DOI] [PubMed] [Google Scholar]
- 110.Jackman SD et al. ABySS 2.0: resource-efficient assembly of large genomes using a Bloom filter. Genome Res. 27, 768–777 (2017). [DOI] [PMC free article] [PubMed] [Google Scholar]
- 111.Burton JN et al. Chromosome-scale scaffolding of de novo genome assemblies based on chromatin interactions. Nat. Biotechnol 31, 1119–1125 (2013). [DOI] [PMC free article] [PubMed] [Google Scholar]
- 112.Hoff KJ, Lange S, Lomsadze A, Borodovsky M & Stanke M BRAKER1: Unsupervised RNA-Seq-Based genome annotation with GeneMark-ET and AUGUSTUS. Bioinformatics 32, 767–769 (2016). [DOI] [PMC free article] [PubMed] [Google Scholar]
- 113.Hoff KJ, Lomsadze A, Borodovsky M & Stanke M Whole-genome annotation with BRAKER. in Gene Prediction: Methods and Protocols (ed. Kollmar M) 65–95 (Springer; New York, 2019). [DOI] [PMC free article] [PubMed] [Google Scholar]
- 114.Kim D, Paggi JM, Park C, Bennett C & Salzberg SL Graph-based genome alignment and genotyping with HISAT2 and HISAT-genotype. Nat. Biotechnol 37, 907–915 (2019). [DOI] [PMC free article] [PubMed] [Google Scholar]
- 115.Holt C & Yandell M MAKER2: an annotation pipeline and genome-database management tool for second-generation genome projects. BMC Bioinformatics 12, 491 (2011). [DOI] [PMC free article] [PubMed] [Google Scholar]
- 116.Cantarel BL et al. MAKER: an easy-to-use annotation pipeline designed for emerging model organism genomes. Genome Res. 18, 188–196 (2008). [DOI] [PMC free article] [PubMed] [Google Scholar]
- 117.Haas BJ et al. Improving the Arabidopsis genome annotation using maximal transcript alignment assemblies. Nucleic Acids Res. 31 , 5654–5666 (2003). [DOI] [PMC free article] [PubMed] [Google Scholar]
- 118.Haas BJ, Zeng Q, Pearson MD, Cuomo CA & Wortman JR Approaches to fungal genome annotation. Mycology 2, 118–141 (2011). [DOI] [PMC free article] [PubMed] [Google Scholar]
- 119.Haas BJ et al. De novo transcript sequence reconstruction from RNA-seq using the Trinity platform for reference generation and analysis. Nat. Protoc 8, 1494–1512 (2013). [DOI] [PMC free article] [PubMed] [Google Scholar]
- 120.Zdobnov EM et al. OrthoDB v9.1: cataloging evolutionary and functional annotations for animal, fungal, plant, archaeal, bacterial and viral orthologs. Nucleic Acids Res. 45, D744–D749 (2017). [DOI] [PMC free article] [PubMed] [Google Scholar]
- 121.Emms DM & Kelly S OrthoFinder: solving fundamental biases in whole genome comparisons dramatically improves orthogroup inference accuracy. Genome Biol. 16, 157 (2015). [DOI] [PMC free article] [PubMed] [Google Scholar]
- 122.Emms DM & Kelly S OrthoFinder: phylogenetic orthology inference for comparative genomics. Genome Biol. 20, 238 (2019). [DOI] [PMC free article] [PubMed] [Google Scholar]
- 123.Bryant DM et al. A tissue-mapped axolotl de novo transcriptome enables identification of limb regeneration factors. Cell Rep. 18, 762–776 (2017). [DOI] [PMC free article] [PubMed] [Google Scholar]
- 124.Klopfenstein DV et al. GOATOOLS: A python library for gene ontology analyses. Sci. Rep 8, 10872 (2018). [DOI] [PMC free article] [PubMed] [Google Scholar]
- 125.Wang K & Nishida H REGULATOR: a database of metazoan transcription factors and maternal factors for developmental studies. BMC Bioinformatics 16, 114 (2015). [DOI] [PMC free article] [PubMed] [Google Scholar]
- 126.Domazet-Lošo T, Brajković J & Tautz D A phylostratigraphy approach to uncover the genomic history of major adaptations in metazoan lineages. Trends Genet. 23, 533–539 (2007). [DOI] [PubMed] [Google Scholar]
- 127.Drost H-G, Gabel A, Grosse I & Quint M Evidence for active maintenance of phylotranscriptomic hourglass patterns in animal and plant embryogenesis. Mol. Biol. Evol 32, 1221–1231 (2015). [DOI] [PMC free article] [PubMed] [Google Scholar]
- 128.Misof B. et al. Phylogenomics resolves the timing and pattern of insect evolution. Science 346, 763–767 (2014). [DOI] [PubMed] [Google Scholar]
- 129.Branstetter MG et al. Phylogenomic insights into the evolution of stinging wasps and the origins of ants and bees. Curr. Biol 27, 1019–1025 (2017). [DOI] [PubMed] [Google Scholar]
- 130.Dohrmann M & Wörheide G Dating early animal evolution using phylogenomic data. Sci. Rep 7, 3599 (2017). [DOI] [PMC free article] [PubMed] [Google Scholar]
- 131.Bradley RK et al. Fast statistical alignment. PLoS Comput. Biol 5, e1000392 (2009). [DOI] [PMC free article] [PubMed] [Google Scholar]
- 132.Sackton TB et al. Convergent regulatory evolution and loss of flight in paleognathous birds. Science 364, 74–78 (2019). [DOI] [PubMed] [Google Scholar]
- 133.Smith MD et al. Less Is more: an adaptive branch-site random effects model for efficient detection of episodic diversifying selection. Mol. Biol. Evol 32, 1342–1353 (2015). [DOI] [PMC free article] [PubMed] [Google Scholar]
- 134.Patro R, Duggal G, Love MI, Irizarry RA & Kingsford C Salmon provides fast and bias-aware quantification of transcript expression. Nat. Methods 14, 417–419 (2017). [DOI] [PMC free article] [PubMed] [Google Scholar]
- 135.Yanai I. et al. Genome-wide midrange transcription profiles reveal expression level relationships in human tissue specification. Bioinformatics 21, 650–659 (2005). [DOI] [PubMed] [Google Scholar]
- 136.Pennell MW et al. geiger v2.0: an expanded suite of methods for fitting macroevolutionary models to phylogenetic trees. Bioinformatics 30, 2216–2218 (2014). [DOI] [PubMed] [Google Scholar]
- 137.Friedländer MR, Mackowiak SD, Li N, Chen W & Rajewsky N miRDeep2 accurately identifies known and hundreds of novel microRNA genes in seven animal clades. Nucleic Acids Res. 40, 37–52 (2012). [DOI] [PMC free article] [PubMed] [Google Scholar]
- 138.Kozomara A & Griffiths-Jones S miRBase: annotating high confidence microRNAs using deep sequencing data. Nucleic Acids Res. 42, D68–73 (2014). [DOI] [PMC free article] [PubMed] [Google Scholar]
- 139.Enright AJ et al. MicroRNA targets in Drosophila. Genome Biol. 5, R1 (2003). [DOI] [PMC free article] [PubMed] [Google Scholar]
- 140.Krüger J & Rehmsmeier M RNAhybrid: microRNA target prediction easy, fast and flexible. Nucleic Acids Res. 34, W451–4 (2006). [DOI] [PMC free article] [PubMed] [Google Scholar]
- 141.Hao Y. et al. Integrated analysis of multimodal single-cell data. Cell 184, 3573–3587.e29 (2021). [DOI] [PMC free article] [PubMed] [Google Scholar]
- 142.Hafemeister C & Satija R Normalization and variance stabilization of single-cell RNA-seq data using regularized negative binomial regression. Genome Biol. 20, 296 (2019). [DOI] [PMC free article] [PubMed] [Google Scholar]
- 143.Finak G. et al. MAST: a flexible statistical framework for assessing transcriptional changes and characterizing heterogeneity in single-cell RNA sequencing data. Genome Biol. 16, 278 (2015). [DOI] [PMC free article] [PubMed] [Google Scholar]
- 144.Paten B. et al. Cactus: Algorithms for genome multiple sequence alignment. Genome Res. 21, 1512–1528 (2011). [DOI] [PMC free article] [PubMed] [Google Scholar]
- 145.Hubisz MJ, Pollard KS & Siepel A PHAST and RPHAST: phylogenetic analysis with space/time models. Brief. Bioinform 12, 41–51 (2011). [DOI] [PMC free article] [PubMed] [Google Scholar]
- 146.Siepel A. et al. Evolutionarily conserved elements in vertebrate, insect, worm, and yeast genomes. Genome Res. 15, 1034–1050 (2005). [DOI] [PMC free article] [PubMed] [Google Scholar]
- 147.Capella-Gutiérrez S, Silla-Martínez JM & Gabaldón T trimAl: a tool for automated alignment trimming in large-scale phylogenetic analyses. Bioinformatics 25, 1972–1973 (2009). [DOI] [PMC free article] [PubMed] [Google Scholar]
- 148.Yang Z. PAML: a program package for phylogenetic analysis by maximum likelihood. Comput. Appl. Biosci 13, 555–556 (1997). [DOI] [PubMed] [Google Scholar]
- 149.Yang Z. PAML 4: phylogenetic analysis by maximum likelihood. Mol. Biol. Evol 24, 1586–1591 (2007). [DOI] [PubMed] [Google Scholar]
- 150.Stamatakis A. RAxML-VI-HPC: maximum likelihood-based phylogenetic analyses with thousands of taxa and mixed models. Bioinformatics 22, 2688–2690 (2006). [DOI] [PubMed] [Google Scholar]
- 151.Wang L. et al. Peak annotation and verification engine (PAVE) for untargeted LC-MS metabolomics. Anal. Chem 91, 1838–1846 (2019). [DOI] [PMC free article] [PubMed] [Google Scholar]
- 152.Pahlke S, Seid MA, Jaumann S & Smith A The loss of sociality is accompanied by reduced neural investment in mushroom body volume in the sweat bee Augochlora pura (Hymenoptera: Halictidae). Ann. Entomol. Soc. Am 114, 637–642 (2021). [DOI] [PMC free article] [PubMed] [Google Scholar]
- 153.Le Guilloux V, Schmidtke P & Tuffery P Fpocket: an open source platform for ligand pocket detection. BMC Bioinformatics 10, 168 (2009). [DOI] [PMC free article] [PubMed] [Google Scholar]
- 154.Kelley LA, Mezulis S, Yates CM, Wass MN & Sternberg MJE The Phyre2 web portal for protein modeling, prediction and analysis. Nat. Protoc 10, 845–858 (2015). [DOI] [PMC free article] [PubMed] [Google Scholar]
- 155.Kelley LA & Sternberg MJE Protein structure prediction on the Web: a case study using the Phyre server. Nat. Protoc 4, 363–371 (2009). [DOI] [PubMed] [Google Scholar]
- 156.Edgar RC MUSCLE: a multiple sequence alignment method with reduced time and space complexity. BMC Bioinformatics 5, 113 (2004). [DOI] [PMC free article] [PubMed] [Google Scholar]
Associated Data
This section collects any data citations, data availability statements, or supplementary materials included in this article.
Supplementary Materials
Data Availability Statement
Raw sequencing data is available NCBI under the following accession numbers: PRJNA613468, PRJNA629833, PRJNA718331, and PRJNA512907 (Hi-C). Hi-C data is also available at www.dnazoo.org. Genomes and browsers can be accessed at beenomes.princeton.edu and on NCBI: SUB9464533. Please address inquiries or material requests to skocher@princeton.edu.


