Abstract
Background
Non-functioning adrenal adenomas (NFA) are prevalent tumors often associated with metabolic disturbances compared to the general population. This study aimed to evaluate cardiovascular disease (CVD) risk in 106 patients with NFA using SCORE2 and SCORE2-OP algorithms.
Material/Methods
The study sample comprised of 106 patients with NFA. CVD risk was assessed using SCORE2 and SCORE2-OP charts. The study population was divided across different categories: low-to-moderate risk, high-risk, very high-risk of CVD. Anthropometric measurements, metabolic indices, lipid profiles, and carbohydrate metabolism parameters were analyzed across different CVD risk groups.
Results
Very high-risk patients had a higher waist-to-hip ratio (WHR) value (0.95; 0.89–0.98) compared to low-to-moderate risk patients (0.89; 0.84–0.91; P=0.0049). Also, high-risk patients had a higher WHR value (0.92; 0.87–0.97) compared to low-to-moderate risk patients (0.89; 0.84–0.91; P=0.032). Patients with low-to-moderate CVD risk had significantly lower fasting glucose levels compared to patients with high CVD risk (5.35; 5.08–5.61 vs 5.78; 5.39–6.03; P=0.0093) as well as compared to patients with very high risk (5.35; 5.08–5.61 vs 5.83; 5.22–6.28; P=0.0230). There was no significant difference in lipid parameters and atherogenic indices between the groups based on CVD risk according to SCORE2 and SCORE2-OP.
Conclusions
Elevated fasting glucose levels are significantly associated with higher CVD risk in NFA patients, particularly in high and very high-risk group. Systolic blood pressure and WHR were identified as cost-effective measures for predicting of CVD among NFA patients. Metabolic indices did not show any significant differences across CVD risk groups.
Keywords: Adrenal Gland Neoplasms, Carbohydrate Metabolism, Cardiometabolic Risk Factors, Dyslipidemias, Hypertension, Waist-Hip Ratio
Introduction
An adrenal incidentaloma (AI) is a randomly discovered mass of greater than 1 cm in size [1] which can be categorized as functional (hormone-secreting) and silent (benign or malignant) lesions [2]. Non-functional adenomas (NFA) are typically detected during imaging procedures and are classified as an AI following an endocrine exclusion procedure, with no secretory capacity [1,3,4]. The rate of NFA is estimated to be between 71% and 84% of all AI cases [1,5–7]. It has been reported that non-functioning adrenal incidentalomas were the most frequent tumor type identified in both clinical (75%) and surgical (69%) studies [8]. Although NFA are considered non-functional, they have been deemed clinically relevant [9]. Numerous instances of hypertension, dyslipidemia, insulin resistance (IR), impaired glucose tolerance, metabolic syndrome (MetS), obesity, and osteoporosis, have been observed in patients with NFA [3,9–14]. It has been remarked that such complications are related to an increased frequency in AI patients of hypercortisolemia, including its subclinical [14,15]. Moreover, it has been reported that some glucose metabolism disturbances (IR, and impaired glucose tolerance) are significantly higher in patients with NFA, regardless of their body mass index (BMI) [10,16,17]. The prevalence of disturbed glucose tolerance among patients with NFA has been reported to be remarkably higher than in the general population [16,17]. The World Health Organization (WHO), the National Cholesterol Education Program-Adult Treatment Panel III (NCEP-ATP III) and the American Association of Clinical Endocrinologists/American College of Endocrinology (AACE/ACE) classification have revealed that NFA are independent predictors of MetS [10]. Cardiovascular diseases are prevalent in the general population, and they are the leading cause of death in developed countries. Studies of the cardiovascular risk in patients with AI in comparison with the background population could be of a special interest [14,15].
The European Society of Cardiology (ESC) has developed Systematic Coronary Risk Evaluation (SCORE2) model designed to predict the 10-year risk of initial cardiovascular events in individuals aged 40–69 years without prior CVD or diabetes, recalibrated to European population target across 4 risk regions [18]. For populations aged over 70, ESC has provided a SCORE2 for Older Persons (SCORE2-OP) utilizing similar methodologies. SCORE2 incorporates risk estimates for fatal and non-fatal CVD events [19]. Depending on the established model of diagnosis, it is expected that between 5% and 28% of NFA will develop mild autonomous cortisol secretion (MACS) [20]. MACS is considered to be related to an increased cardiometabolic risk [5,20,21]. Patients with NFA have a higher risk of developing atherosclerosis compared to patients with healthy adrenal glands and low-intermediate CVD risk profiles [22]. It has been suggested that the evaluation of the coronary-artery-calcium (CAC) score may serve as a valuable predictor of atherosclerosis risk in elderly patients [22]. Furthermore, increased carotid intima-media thickness [14], higher D-dimer levels, and elevated uric acid levels have been observed in patients with NFA [12]. Patients with NFA and those with secreting adenomas have been presented with a higher prevalence of cardiometabolic risks compared to individuals with normal adrenal glands [23,24]. Given this discrepancy, the precise diagnosis of adenomas is crucial to reaching treatment goals and implementing measures to address the prevalence of cardiometabolic risks in these patients, using simple methods such as the SCORE2 risk prediction algorithms.
Therefore, this study aimed to evaluate cardiovascular risk in 106 patients with non-functioning adrenal adenomas using the SCORE2 and SCORE2-OP algorithms, and to evaluate metabolic deregulation, and inflammation in patients with NFA.
Material and Methods
The study was approved by the bioethics board KNW/0022/KB1/143/15 at the Medical University of Silesia and conforms to the Declaration of Helsinki. Data analysis consent was obtained from all participants.
Participants
Retrospective analysis evaluated 408 NFA patients (283 females, 69.36%) with incidentally found adrenal adenoma/s referred to the Department of Endocrinology, Piekary Medical Centre, St. Luke’s Local Hospital in Piekary Slaskie, Poland.
Inclusion criteria were: 1) age: 40 or older 2) no signs or symptoms of cortisol hypersecretion; 3) normal early morning basal serum ACTH and cortisol levels, preservation of ACTH and cortisol circadian rhythm, and normal 24-hour urinary free cortisol (UFC) concentration.
Exclusion criteria were: 1) history of previous malignancy and/or inflammation, 2) medication known to affect any of the measured parameters, 3) presence of secreting adenoma or adrenals insufficiency, and 4) renal and liver failure define as: eGFR <60 ml/min/1.73 m2/bilirubin >2 mg/dL; INR >1.5 and albumin <3.5 g/dL.
After exclusion criteria, 106 patients were eligible for final analysis.
Diagnosis of NFA
Morning cortisol level after dexamethasone suppression test below <1.8 ng/mL. When the post-dexamethasone serum cortisol concentration was over 1.8 ug/dL, the absence of cortisol excess in other tests confirmed:
normal 24-h urinary free cortisol, morning adrenocorticotropin (ACTH), and midnight cortisol measurements
normal plasma renin activity and aldosterone levels during postural change
normal 24-h urinary excretion of catecholamines
computed tomography (CT) characteristics suggested adenoma (lesion with a radiation attenuation coefficient ≤10 IU)
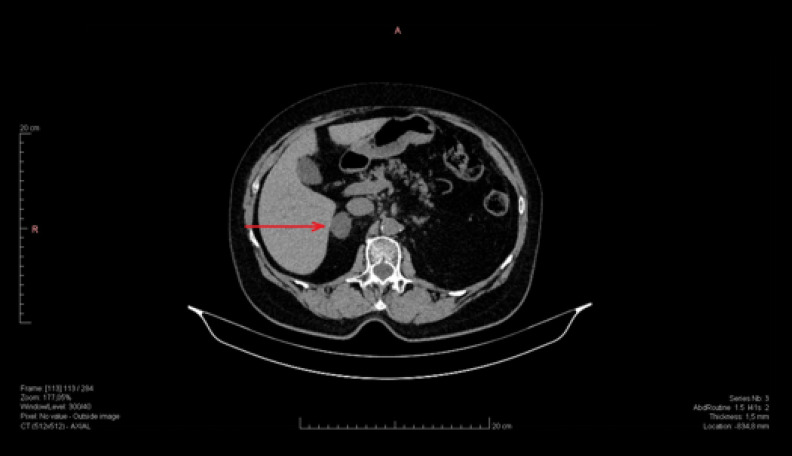
Figure 1 shows CT a non-functional right adrenal adenoma.
Figure 1.
Non-functional right adrenal adenoma (dimension 27×19 mm, density 5–10 j.H.).
SCORE2 and SCORE2-OP Algorithm
Systematic Coronary Risk Evaluation Model 2 (SCORE2) is an algorithm derived to predict an individual’s 10-year risk of fatal and non-fatal CVD in individuals aged 40–69 years in Europe. For healthy population aged >69 years, the SCORE-Older Persons (SCORE2-OP) algorithm estimates 5-year and 10-year fatal and non-fatal CVD across Europe [18,19]. For Poland, the algorithm is specifically tailored for a high-risk region. To estimate cardiovascular (CV) risk using SCORE2 and SCORE-2OP algorithms, the following predictors were selected: sex, age, current smoking status, history of diabetes mellitus, systolic blood pressure (SBP), and non-HDL cholesterol levels. Based on these parameters and information, the algorithms classify patients into 3 categories of CV event risk: 1) low-to-moderate risk, 2) high risk, and 3) very high risk. In our study, 16 patients were in the low-to-moderate risk group, 28 patients were in the high-risk group, and 62 patients were in the very high-risk group. The CVD risk categories based on SCORE2 and SCORE2-OP in study population are presented in Figure 2.
Figure 2.
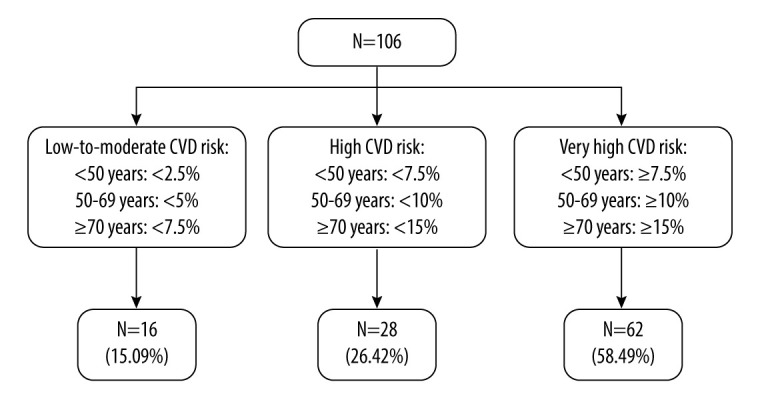
CVD risk categories based on SCORE2 and SCORE2-OP in study population based on [16,31].
CV risk based on the SCORE2, and SCORE2-OP algorithms was estimated using data obtained from patient medical history assessments and laboratory test results. To calculate the risk, we collected information on sex, age, smoking status, history of diabetes mellitus, SBP, and non-HDL cholesterol levels, which were calculated using laboratory results for total cholesterol (TC) and low-density lipoprotein cholesterol (LDL). Patients aged <50 with an estimated CV event risk of <2.5% were classified as low-to-moderate risk, 2.5% to <7.5% as high risk, and ≥7.5% as very high risk. For patients aged 50–69 years, risks <5% were low-to-moderate risk, 5% to <10% were high risk, and ≥10% were very high risk [18]. The SCORE2-OP algorithm, used for patients ≥70 years old, classified risks <7.5% as low-to-moderate, <7.5% to <15% as high risk, and ≥15% as very high risk [19].
Laboratory Measurements
The study consisted of 2 parts: a structured medical interview and a physical examination. The medical assessment covered age, sex, medical history (smoking status), and measurements of anthropometric and biochemical parameters. All biochemical tests were performed after fasting, in the morning. Fasting blood glucose [mmol/L], total cholesterol (TC) [mmol/L], HDL cholesterol [mmol/L], LDL cholesterol [mmol/L], non-HDL cholesterol [mmol/L], and triglycerides [mmol/L] were measured. Blood pressure [mmHg] was measured in a seated position, after waking up. Based in medical history and the latest test results, patients were categorized into those with diabetes and those without. Patients with diabetes were excluded according to the guidelines of the Polish Diabetes Society (PTD), which define diabetes as: fasting plasma glucose ≥7.0 mmol/l, random plasma glucose ≥11.1 mmol/l with symptoms of hyperglycemia, 2-h post-load glucose ≥11.1 mmol/l during an oral glucose tolerance test (OGTT), and HbA1c ≥6.5% [25].
Anthropometric Indices
Height and weight were measured by standard methods in the morning, and body mass index (BMI) was calculated by the following formula:
WHR was calculated as:
Atherogenic Indices
Atherogenic indices was computed as:
Triglyceride-glucose body mass index (TyG BMI index) was defined as:
Lipoprotein Combine Index (LCI) was computed using the following formula:
Castelli’s risk index-I was computed as:
Castelli’s risk index-II was computed as:
Atherogenic coefficient (AC) was calculated as:
Atherogenic index of plasma (AIP) was computed as:
Triglyceride to HDL cholesterol was calculated as:
The metabolic score for insulin resistance (METS-IR) was computed as:
Statistical Analysis
Data distribution was assessed using the Shapiro-Wilk test. Analyzed variables are shown as a median with interquartile range when the deviations from Gaussian distribution were significant, and as a mean and standard deviation (SD) for normally distributed data. Differences in each variable at the 3 groups of patients (low-to-moderate CVD risk, high CVD risk, very high CVD risk) were determined using the Kruskall-Wallis test with the post hoc multiple comparison test performed for non-normally distributed data. Differences in evaluated parameters were visualized with boxplots showing interquartile range of variables and significance levels of post hoc comparisons. Correlations between the examined variables were evaluated using Pearson’s or Spearman’s coefficients, for normally and non-normally distributed data, respectively. The chi-square test was used to determine associations between categorical variables. A receiver operating characteristic (ROC) analysis was performed to evaluate laboratory parameters as potential biomarkers for high and very high risks of CVD. Youden Index method was used to determine optimal cut-off value. Significance was defined at P values ≤0.05. The statistical analysis was conducted using STATISTICA 13 software (StatSoft, Tulsa, OK, USA) and R Studio (Integrated Development for R. RStudio, PBC, Boston, MA, USA).
Results
Characteristic of the Study Group
A total of 106 patients with NFA diagnosis were included in the study. The mean age of patients was significantly different between the analyzed groups of CVD risk based on SCORE2 and SCORE2-OP (P<0.0001). Among the groups of low and moderate CVD risk based on SCORE2 and SCORE2-OP the mean age was 47.94±5.37 years. In the high-risk group the mean age was 59.21±6.45 years, and in the very high-risk group the mean age was 66.22±7.48 years.
Baseline Clinical Parameters Between SCORE2 and SCORE2-OP
There was no statistically significant difference between the analyzed groups of CVD risk in most clinical parameters except for sodium (P=0.034), hemoglobin (0.016), urinary cortisol levels (0.0347) and systolic blood pressure (P=0.001). A comparison of baseline clinical parameters between the SCORE2 and SCORE2-OP groups is shown in Table 1 and Figures 2–6.
Table 1.
Comparison of baseline clinical characteristics between the SCORE2 and SCORE2-OP groups.
| Parameter | CVD risk based on SCORE-OP/SCORE-OP2 | P value | ||
|---|---|---|---|---|
| Low and moderate risk (N=16) | High risk (N=28) | Very high risk (N=62) | ||
| Sex: Women, n (%) | 16 (100) | 21 (75) | 41 (66.13) | 0.003 |
| Age [years] | 47.94 (5.37) | 59.21 (6.45) | 66.22 (7.48) | <0.0001a,b,c |
| TSH [uIU/ml] | 1.48 (0.86–1.96) | 1.10 (0.69–1.91) | 1.45 (0.94–1.96) | 0.2826 |
| fT3 [pmol/L] | 2.71 (2.60–2.92) | 3.07 (2.69–3.39) | 2.84 (2.58–3.13) | 0.4033 |
| fT4 [pmol/L] | 1.02 (0.94–1.05) | 0.97 (0.91–1.06) | 1.02 (0.93–1.10) | 0.67 |
| Na [mmol/L] | 139.5 (138.5–141.0) | 141.0 (140.0–143.0) | 140.0 (138.0–142.0) | 0.034b,c |
| K [mmol/L] | 4.16±0.46 | 4.28±0.39 | 4.33±0.47 | 0.48 |
| Leucocytes [103/mm3] | 6.07 (5.715–7.16) | 6.75 (5.15–7.65) | 7.20 (6.24–8.54) | 0.058 |
| Erythrocytes [106/mm3] | 4.64 (4.48–4.86) | 4.72 (4.42–4.88) | 4.78 (4.54–5.06) | 0.412 |
| Hemoglobin [g/dl] | 13.60 (13.05–14.15) | 14.05 (12.70–14.70) | 14.40 (13.50–15.30) | 0.0044 a |
| Hematocrit [%] | 41.20 (39.60–42.30) | 42.55 (39.90–44.40) | 42.90 (41.05–45.10) | 0.11 |
| Plates [103/mm3] | 285.00 (253.00–322.00) | 248.50 (208.00–292.00) | 238.50 (203.50–294.50) | 0.2394 |
| CRP [mg/l] | 2.0 (0.80–3.9) | 1.3 (0.53–2.3) | 1.75 (0.94–2.8) | 0.29 |
| Cortisol 8: 00 a.m. [nmol/L] | 9.25 (7.35–10.65) | 10.90 (8.50–14.45) | 11.60 (9.20–13.50) | 0.0857 |
| Cortisol 6: 00 p.m. [nmol/L] | 5.60 (3.40–6.45) | 5.90 (4.60–6.90) | 5.60 (3.85–7.7) | 0.5271 |
| Cortisol 0: 00 a.m. [nmol/L] | 1.80 (1.35–3.25) | 2.55 (1.15–4.15) | 2.30 (1.70–4.00) | 0.4255 |
| ACTH 8.00 a.m. [pmol/L] | 9.50 (7.60–15.00) | 11.40 (9.20–21.60) | 14.60 (10.60–21.40) | 0.2414 |
| ACTH 6.00 p.m. [pmol/L] | 8.80 (6.94–12.20) | 9.25 (6.10–14.40) | 9.40 (7.10–14.00) | 0.8334 |
| Cortisol in urine [μg/24 h] | 27.60 (15.00–36.00) | 45.40 (31.60–60.10) | 36.80 (24.30–58.00) | 0.0347 |
| Aldosterone while the person is at rest [nmol/L] | 9.75 (7.40–37.50) | 8.50 (5.50–70.00) | 10.60 (5.70–59.00) | 0.9153 |
| Aldosterone while the person is in motion [nmol/L] | 19.1 (10.90–39.30) | 20.15 (6.40–84.30) | 17.45 (6.75–66.25) | 0.9616 |
| Renin while the person is at rest [nmol/L] | 7.61 (1.05–12.00) | 2.21 (0.81–13.40) | 8.11 (3.56–45.39) | 0.0736 |
| Renin while the person is motion [nmol/L] | 11.94 (2.36–28.00) | 2.83 (0.81–25.19) | 16.06 (6.38–87.03) | 0.0546 |
| DHEAS [μmol/L] | 95.70 (66.80–162.80) | 102.45 (59.30–146.15) | 85.10 (65.40–165.20) | 0.8402 |
| Systolic blood pressure [mmHg] | 130.00 (120.00–130.00) | 130.00 (130.00–140.00) | 140.00 (130.00–150.00) | 0.001a,b,c |
| Diastolic blood pressure [mmHg] | 80.00 (75.00–80.00) | 80.00 (80.00) | 80.00 (80.00–90.00) | 0.55 |
| Hypertension, n (%) | 5 (31.25) | 6 (21.42) | 29 (46.77) | 0.1 |
| Impaired fasting glucose, n (%) | 2 (1.25) | 8 (28.57) | 9 (14.52) | 0.21 |
| Impaired glucose tolerance, n (%) | 1 (0.06) | 5 (17.86) | 10 (16.13) | 0.51 |
| Insulin resistance, n (%) | 3 (18.75) | 2 (0.070 | 2 (3.26) | 0.10 |
| Hypothyroidism, n (%) | 3 (18.75) | 1 (0.04) | 9 (14.52) | 0.25 |
| Hyperthyroidism, n (%) | 0 (0) | 3 (10.71) | 0 (0) | 0.01 |
| Chronic autoimmune thyroiditis, n (%) | 3 (18.75) | 1 (0.04) | 9 (14.52) | 0.25 |
TSH – thyroid stimulating hormone; FT3 – free triiodothyronine; FT4 – free thyroxine; Na – sodium; K – potassium; CRP – C-reactive protein; ACTH – adrenocorticotropic hormone; DHEAS – dehydroisoandrosterone sulphate.
Kruskall-Wallis test: significant difference for: low risk vs high risk;
Kruskall-Wallis test: significant difference for: low risk vs moderate risk;
Kruskall-Wallis test: significant difference for: moderate risk vs high risk.
Figure 3.
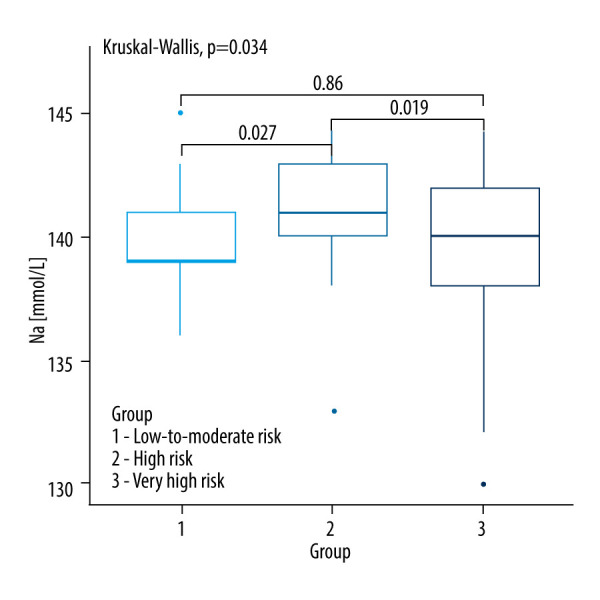
Kruskall-Wallis test with the post hoc multiple comparison test for sodium concentrations in CVD risk groups.
Figure 4.
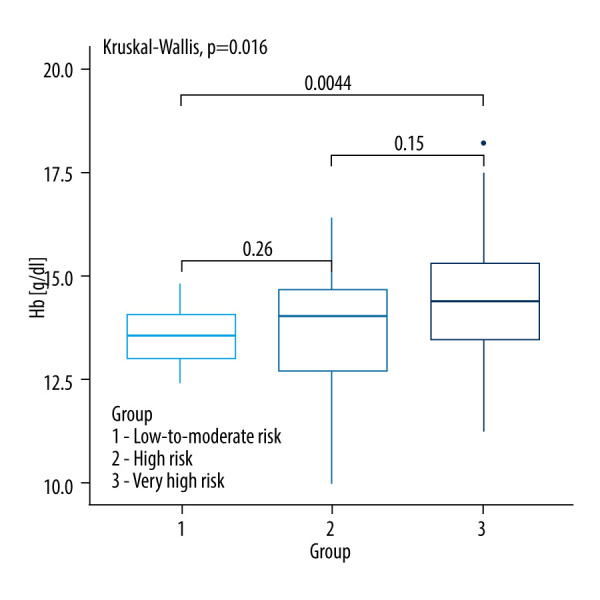
Kruskall-Wallis test with the post hoc multiple comparison test for hemoglobin concentrations in CVD risk groups.
Figure 5.
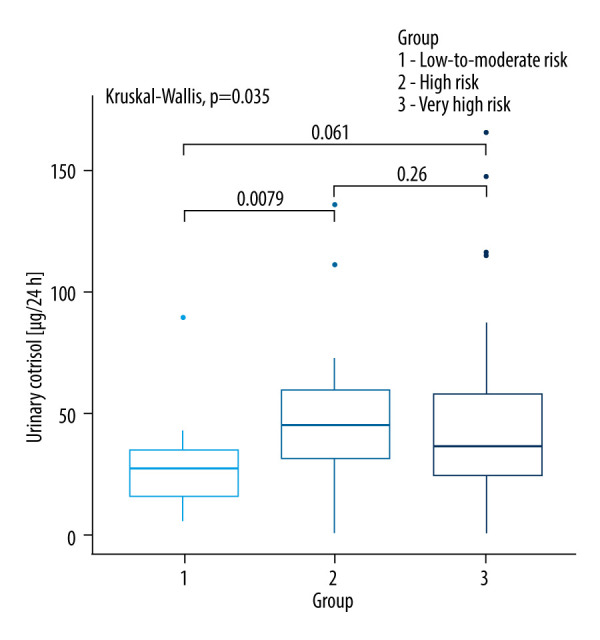
Kruskall-Wallis test with the post hoc multiple comparison test for urinary cortisol levels in CVD risk groups.
Figure 6.
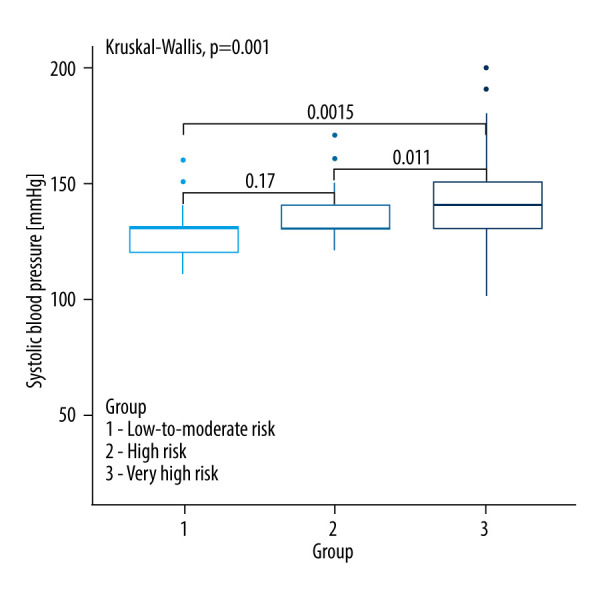
Kruskall-Wallis test with the post hoc multiple comparison test for systolic blood pressure in CVD risk groups.
Anthropometric Parameters and Indices Between SCORE2 and SCORE2-OP Groups
A comparison of baseline anthropometric parameters and indices between the SCORE2 and SCORE2-OP groups is shown in Table 2. Among anthropometric parameters and indices, only the WHR index was significantly different between the analyzed groups (P=0.016). Very high-risk patients had a higher WHR value (0.95; 0.89–0.98) compared to low- and moderate-risk patients (0.89; 0.84–0.91; P=0.0049). Also, high-risk patients had a higher WHR value (0.92; 0.87–0.97) compared to low and moderate risk patients (0.89; 0.84–0.91; P=0.0032) (Figure 7).
Table 2.
Comparison of anthropometric parameters and indices between the SCORE2 and SCORE2-OP groups.
| Parameter | CVD risk based on SCORE-OP/SCORE-OP2 | P value | ||
|---|---|---|---|---|
| Low and moderate risk (N=16) | High risk (N=28) | Very high risk (N=62) | ||
| Body weight [kg] | 82.20 (68.45–95.00) | 74.4 (65.75–79.75) | 71.50 (65.20–80.70) | 0.2337 |
| Height [cm] | 165.75 (159.50–170.00) | 162.25 (157.75–169.75) | 162.00 (156.00–168.00) | 0.3764 |
| BMI index [kg/m2] | 29.45 (24.75–33.35) | 28.10 (25.05–29.80) | 28.10 (25.30–30.80) | 0.64 |
| Waist circumference [cm] | 98.25 (87.50–106.50) | 95.50 (88.50–104.00) | 99.25 (89.00–108.00) | 0.5676 |
| Hip circumference [cm] | 107.50 (100.50–116.00) | 102.00 (98.00–108.00) | 103.00 (99.00–110.00) | 0.2388 |
| WHR | 0.89 (0.84–0.91) | 0.92 (0.87–0.97) | 0.95 (0.89–0.98) | 0.016 b |
BMI – body mass index; WHR – waist-to-hip ratio.
Kruskall-Wallis test: significant difference for: low risk vs moderate risk.
Figure 7.
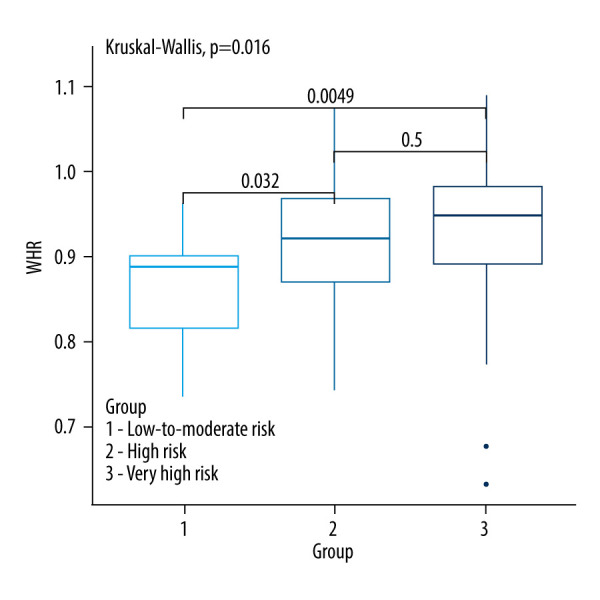
Kruskall-Wallis test with the post hoc multiple comparison test for WHR in CVD risk groups.
Glucose Metabolism Parameters Between the SCORE2 and SCORE2-OP Groups
Table 3 shows a comparison of glucose metabolism parameters between the SCORE2 and SCORE2-OP groups. Only fasting glucose [mmol/L] was significantly different between the analyzed groups (P=0.035). Patients with low and moderate CVD risk had significantly lower fasting glucose levels compared to patients with high CVD risk (5.35; 5.08–5.61 vs 5.78; 5.39–6.03; P=0.0093) as well as compared to patients with very high risk (5.35; 5.08–5.61 vs 5.83; 5.22–6.28; P=0.0230). There was no significant difference between patients with low and moderate CVD risk compared to those with very high CVD risk (P=0.85), as shown in Figure 8.
Table 3.
Comparison of glucose metabolism parameters between the SCORE2 and SCORE2-OP groups.
| Parameter | CVD risk based on SCORE-OP/SCORE-OP2 | P value | ||
|---|---|---|---|---|
| Low and moderate risk (N=16) | High risk (N=28) | Very high risk (N=62) | ||
| Fasting glucose [mmol/L] | 5.35 (5.08–5.61) | 5.78 (5.39–6.03) | 5.83 (5.22–6.28) | 0.035a,b |
| Glucose after 120 min [mmol/L] (glucose tolerance test) | 7.20 (6.33–7.92) | 7.19 (5.87–8.75) | 6.39 (5.61–7.92) | 0.5449 |
| Glucose after 60 min [mmol/L] (glucose tolerance test) | 11.92 (9.25–12.28) | 9.85 (9.61–12.21) | 9.42 (7.83–11.22) | 0.2054 |
| Fasting insulin [pmol/L] | 12.30 (7.20–13.40) | 6.60 (4.60–35.80) | 6.15 (4.30–9.65) | 0.08 |
| Insulin after 60 min [pmol/L] (glucose tolerance test) | 139.40 (38.50–170.90) | 53.85 (35.80–90.40) | 55.05 (40.70–76.60) | 0.1225 |
| HbA1C [%] | 5.59±0.33 | 5.74±0.28 | 5.92±0.67 | 0.29 |
| HOMA-IR index | 1.07 (1.01–3.40) | 1.61 (1.07–2.46) | 2.28 (1.4–3.04) | 0.2735 |
HbA1C – glycated hemoglobin; HOMA-IR – homeostatic model assessment for insulin resistance. Kruskall-Wallis test with the post hoc multiple comparison test.
Kruskall-Wallis test: significant difference for: low risk vs high risk;
Kruskall-Wallis test: significant difference for: low risk vs moderate risk.
Figure 8.
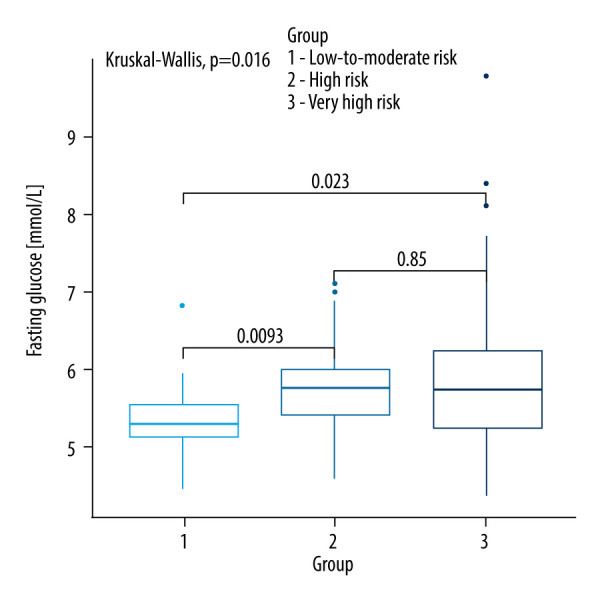
Kruskall-Wallis test with the post hoc multiple comparison test for fasting glucose in CVD risk groups.
Lipid Parameters Between the SCORE2 and SCORE2-OP Groups
There was no significant difference in lipid parameters between the groups based on CVD risk according to SCORE2 and SCORE2-OP (Table 4).
Table 4.
Comparison of lipid parameters between the SCORE2 and SCORE2-OP groups.
| Parameter | CVD risk based on SCORE-OP/SCORE-OP2 | P value | ||
|---|---|---|---|---|
| Low and moderate risk (N=16) | High risk (N=28) | Very high risk (N=62) | ||
| Total cholesterol [mmol/L] | 5.49±0.88 | 5.33±1.05 | 5.55±1.33 | 0.7 |
| LDL cholesterol [mmol/L] | 3.39±0.73 | 2.97±0.89 | 3.28±1.23 | 0.41 |
| HDL cholesterol [mmol/L] | 1.52 (1.24–1.67) | 1.71 (1.36–1.99) | 1.48 (1.22–1.98) | 0.30 |
| Non-HDL cholesterol [mmol/L] | 3.90 (3.64–4.36) | 3.39 (2.49–4.29) | 3.97 (2.66–4.84) | 0.2704 |
| Triglycerides [mmol/L] | 1.21 (0.89–1.56) | 1.24 (0.94–1.68) | 1.16 (0.89–1.58) | 0.86 |
LDL cholesterol – low-density lipoproteins; HDL cholesterol – high-density lipoprotein. Kruskall-Wallis test with the post hoc multiple comparison test.
Atherogenic Indices Between the SCORE2 and SCORE2-OP Groups
There was no significant difference in atherogenic indices between the groups based on CVD risk according to SCORE2 and SCORE2-OP (Table 5).
Table 5.
Comparison of atherogenic indices between the SCORE2 and SCORE2-OP groups.
| Parameter | CVD risk based on SCORE-OP/SCORE-OP2 | P value | ||
|---|---|---|---|---|
| Low and moderate risk (N=16) | High risk (N=28) | Very high risk (N=62) | ||
| Castelli’s risk index-I | 3.83 (3.23–4.46) | 3.06 (2.30–3.91) | 3.35 (2.49–4.77) | 0.15 |
| Castelli’s risk index-II | 2.43 (1.94–2.96) | 1.74 (1.12–2.53) | 2.06 (1.28–3.12) | 0.12 |
| Atherogenic Index of plasma (AIP) | −0.07±0.25 | −0.13±0.28 | −0.09±0.29 | 0.84 |
| Atherogenic coefficient (AC) | 2.83 (2.23–3.46) | 2.07 (1.30–2.91) | 2.35 (1.49–3.77) | 0.15 |
| Lipoprotein combine index (LCI) | 12.0 (10.28–28.86) | 12.09 (4.52–18.89) | 14.53 (5.03–26.49) | 0.65 |
| TG/HDL-C ratio | 1.90 (1.25–2.57) | 1.69 (1.16–2.44) | 1.76 (1.11–3.04) | 0.8122 |
| METS-IR | 42.47±9.96 | 37.48 (33.89–41.52) | 38.52 (34.19–45.55) | 0.53 |
| TyG Index | 8.56±0.41 | 8.67±0.52 | 8.65±0.52 | 0.57 |
| TyG BMI index | 250.25 (207.95–293.39) | 240.21 (214.38–261.75) | 238.94 (208.03–270.25) | 0.89 |
TG/HDL ratio – the triglyceride/high-density lipoprotein cholesterol ratio; METS-IR – metabolic score for insulin resistance; TyG index – triglyceride-glucose index; TyG BMI index – triglyceride-glucose-body mass index. Kruskall-Wallis test with the post hoc multiple comparison test.
The ROC analysis demonstrated poor predictive value of fasting glucose in identifying high and very high risk of CVD (Table 6, Figure 9).
Table 6.
Receiver operating characteristic (ROC) curves identifying high and very high risk of CVD.
| Parameters | Parameters cut-off | AUC (95% CI) | Sensitivity (%) | Specificity (%) | PPV (%) | NPV (%) | P |
|---|---|---|---|---|---|---|---|
| Fasting glucose [mmol/L] | 5.61 | 0.69 (0.57–0.82) | 0.61 | 0.76 | 0.93 | 0.27 | 0.0100 |
AUC – area under the curve; CI – confidence interval; PPV – positive predictive value; NPV – negative predictive value; ROC – receiver operating characteristic.
Figure 9.
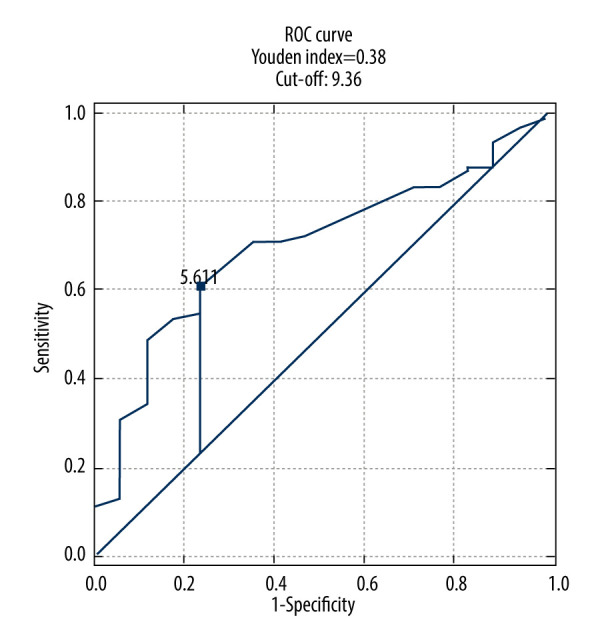
Fasting glucose receiver operating characteristic (ROC) curve for prediction high and very high risk of CVD.
Discussion
In this study, which included 106 patients, we aimed to assess CVD risk using SCORE2 and SCORE2-OP charts in individuals with NFA. We also analyzed metabolic disorders and various inflammatory and atherogenic indices (TyG index, TyG BMI, LCI, AIP, AC, Castelli risk-I, Castelli risk-II, TG/HDL ratio) across groups with varying CVD risk (low, high, very high). To our knowledge, this is the first study to analyze CVD risk groups according to the updated SCORE2 and SCORE2-OP charts, which is a notable strength of our work. Our analyses demonstrated statistical significance for variables such as WHR (P=0.016), very high-risk patients had a higher WHR value (0.95; 0.89–0.98) compared to low-to-moderate-risk patients (0.89; 0.84–0.91), P=0.0049, and high-risk patients had a higher WHR value (0.92; 0.87–0.97) compared to low and moderate risk patients (0.89; 0.84–0.91), (P=0.032), fasting glucose (P=0.035), urinary cortisol levels (P=0.0347), serum sodium concentration (P=0.034), hemoglobin levels (P=0.016), and systolic blood pressure (P=0.001).
We observed a significant correlation between WHR and CVD risk, with higher WHR associated with increased risk in the high-risk (P=0.032) and very high-risk group (P=0.0049) compared to the low-risk group (P=0.016). This finding aligns with the results of Cavalari et al [10]. Our study did not find a significant correlation between CVD risk groups based on BMI, WC, and hip circumference, consistent with findings in other studies [10,16,17]. The WHR, reflecting both central and peripheral fat distribution, may provide a more comprehensive assessment of CVD risk compared to individual measurements of WC or hip circumference.
Previous research has indicated significant associations between NFA and glucose metabolism parameters, such as IR and MetS [26,27]. Emral et al [28] demonstrated increased risk of IR and MetS in patients with NFA. However, our study did not find statistically significant correlations between the prevalence of IR or impaired glucose tolerance, glucose, and insulin levels at 60 minutes and 120 minutes after the glucose tolerance test, fasting insulin levels, HbA1C, and HOMA-IR index. Notably, our study excluded patients with diagnosed diabetes, as diabetes is not considered in the SCORE2 and SCORE2-OP risk assessment charts. Fasting glucose levels were significantly higher in patients with high (P=0.0093) and very high (P=0.023) CVD risk groups compared to those with low risk (P=0.035). Although a ROC analysis for fasting glucose suggested a moderate discriminative ability for assessing CVD risk (Youden index value of 0.38), it highlights the need for further exploration of glucose metabolism in NFA patients. Araujo-Castro et al [27,29] suggested that patients with MACS have a higher risk of diabetes compared to those with NFA. In line with Krzyżewska et al’s [16] findings, we observed that the prevalence of impaired fasting glucose was significantly higher in NFA patients. Additionally, they identified diabetes in nearly 30% of their NFA patients [16].
No significant differences were observed between CVD risk groups concerning dyslipidemia and atherogenic indices. Cavalari et al [10] reported higher non-HDL levels among NFA patients compared to a control population. Our results did not include non-HDL in the analysis, as it is part of the SCORE2 and SCORE2-OP charts. The presence of lipid-lowering treatments among some patients may have influenced our results. Mintziori et al [30] investigated whether lipid parameters could predict autonomous cortisol secretion, finding no significant differences in the prevalence of dyslipidemia between NFA patients and those with cortisol-secreting adenomas. Lipid disorders among NFA patients may be associated with subclinical hypercortisolism [30,31]. There are reports suggesting improvements in lipid profile, glycemic profile, and blood pressure control after adrenalectomy [27,32,33], which may indicate that subtle cortisol hypersecretion occurs in NFA patients, potentially impacting CVD risk [31].
In our study, significant alterations in urinary cortisol levels were observed among CVD risk groups (P=0.035), particularly between the low- and high-risk groups (P=0.0079). This finding may suggest that assessing the steroid profile in urine among NFA patients could help identify those with glucocorticoid pathway hyperactivity [11].
Hypertension remains a major risk factor for CVD. The prevalence of hypertension in the adult population is estimated at around 31–32.5% and increases with age. In our study, the average age differed between CVD risk groups: low CVD risk (47.94 years), high CVD risk (59.21 years), and very high CVD risk (66.22 years). SCORE2 and SCORE2-OP risk assessment account for increased blood pressure with age. Our study demonstrated significant differences in systolic blood pressure (SBP) between the low and very high CV risk groups (P=0.0015) and between the high and very high CV risk groups (P=0.011). While many studies have reported higher SPB values in NFA patients [11,16,26,34], some studies did not find significant correlations [29]. This discrepancy may be attributed to the use of antihypertensive medications among some patients in our study. Despite this, our findings highlight a significant correlation between higher SPB and CVD risk, underscoring the need for effective blood pressure management in NFA patients.
Our study also identified significant differences in serum sodium concentration (P=0.02), aligning with finding from other study [26]. Electrolyte balance, particularly sodium is an intriguing area for further research on NFA.
Lastly, significant differences in hemoglobin levels were observed between the low and very high CV risk groups (P=0.0044). However, the role of hemoglobin in CVD in NFA patients requires further investigation.
The results of our study should be viewed in light of its limitations, including lack of a control group, and its relatively small sample size, resulting from strict inclusion criteria, which is common in studies involving NFA. Despite these limitations, our study makes a valuable contribution to research on NFA and CVD risk.
Conclusions
The use of SCORE2 and SCORE2-OP charts in 106 patients with NFA reveals that elevated fasting glucose levels are significantly associated with higher cardiovascular risk in this group, particularly in those classified in high- or very high-risk categories. Additionally, SBP and WHR were identified as cost-effective, simple measures for predicting of CVD among NFA patients. However, other metabolic markers and indices did not show any significant differences across CVD risk groups. Recognizing that NFA patients may exhibit elevated fasting glucose levels, higher SBP, and increased WHR highlights the need for increased vigilance and regular assessment. Monitoring these parameters may prompt clinicians to consider earlier pharmacological or surgical interventions.
Acknowledgements
The authors thank the dedicated faculty and staff who contributed to this study.
Footnotes
Conflict of interest: None declared
Declaration of Figures’ Authenticity: All figures submitted have been created by the authors, who confirm that the images are original with no duplication and have not been previously published in whole or in part.
Financial support: This study was funded by the Medical University of Silesia grant (PCN-2-039/N/2/Z)
References
- 1.Karatas S, Hacioglu Y, Beysel S. Metabolic syndrome and Visceral Adiposity Index in non-functional adrenal adenomas. Arch Endocrinol Metab. 2023;67(3):323–29. doi: 10.20945/2359-3997000000547. [DOI] [PMC free article] [PubMed] [Google Scholar]
- 2.Torti JF, Correa R. StatPearls [Internet[ Treasure Island (FL): StatPearls Publishing; 2024. Adrenal cancer. [Updated 2023 Aug 7[ Available from: https://www.ncbi.nlm.nih.gov/books/NBK546580/ [PubMed] [Google Scholar]
- 3.Trandafir A-I, Stanciu M, Albu SE, et al. Management of adrenal cortical adenomas: Assessment of bone status in patients with (non-functioning) adrenal incidentalomas. J Clin Med. 2023;12(13):4244. doi: 10.3390/jcm12134244. [DOI] [PMC free article] [PubMed] [Google Scholar]
- 4.Fassnacht M, Arlt W, Bancos I, et al. Management of adrenal incidentalomas: European Society of Endocrinology Clinical Practice Guideline in collaboration with the European Network for the Study of Adrenal Tumors. Eur J Endocrinol. 2016;175:G1–G34. doi: 10.1530/EJE-16-0467. [DOI] [PubMed] [Google Scholar]
- 5.Barzon L, Sonino N, Fallo F, et al. Prevalence and natural history of adrenal incidentalomas. Eur J Endocrinol. 2003;149:273–85. doi: 10.1530/eje.0.1490273. [DOI] [PubMed] [Google Scholar]
- 6.Yener S. Metabolic and cardiovascular impact of non-functioning adrenal adenomas: A clinical dilemma. Eur J Intern Med. 2013;6:520–24. doi: 10.1016/j.ejim.2013.02.005. [DOI] [PubMed] [Google Scholar]
- 7.Comlekci A, Yener S, Ertilav S, et al. Adrenal incidentaloma, clinical, metabolic, follow-up aspects: single centre experience. Endocrine. 2010;37(1):40–46. doi: 10.1007/s12020-009-9260-5. [DOI] [PubMed] [Google Scholar]
- 8.Terzolo M, Stigliano A, Chiodini I, P, et al. Italian Association of Clinical Endocrinologists. AME Position Statement on adrenal incidentaloma. Eur J Endocrinol. 2011;164:851–70. doi: 10.1530/EJE-10-1147. [DOI] [PubMed] [Google Scholar]
- 9.Di Dalmazi G, Vicennati V, Rinaldi E, et al. Progressively increased patterns of subclinical cortisol hypersecretion in adrenal incidentalomas differently predict major metabolic and cardiovascular outcomes: A large cross-sectional study. Eur J Endocrinol. 2012;166(4):669–77. doi: 10.1530/EJE-11-1039. [DOI] [PubMed] [Google Scholar]
- 10.Cavalari EMR, de Paula MP, Arruda M, et al. Nonfunctioning adrenal incidentaloma: A novel predictive factor for metabolic syndrome. Clin Endocrinol. 2018;89:586–95. doi: 10.1111/cen.13822. [DOI] [PubMed] [Google Scholar]
- 11.Araujo-Castro M. Cardiometabolic profile and urinary metabolomic alterations in non-functioning adrenal incidentalomas: A review. Clin Endocrinol (Oxf) 2022;97(6):693–701. doi: 10.1111/cen.14745. [DOI] [PubMed] [Google Scholar]
- 12.Peppa M, Bouti E, Koliaki C, et al. Insulin resistance and metabolic syndrome in patients with nonfunctioning adrenal incidentalomas: A cause-effect relationship? Metabolism. 2010;59:1435–41. doi: 10.1016/j.metabol.2010.01.007. [DOI] [PubMed] [Google Scholar]
- 13.Thompson LH, Ranstam J, Almquist M, et al. Impact of adrenalectomy on morbidity in patients with non-functioning adrenal cortical tumours, mild hypercortisolism and Cushing’s syndrome as assessed by National and Quality Registries. World J Surg. 2021;45(10):3099–107. doi: 10.1007/s00268-021-06214-0. [DOI] [PMC free article] [PubMed] [Google Scholar]
- 14.Szychlińska M, Rzeczkowska M, Matuszewski W, Bandurska-Stankiewicz E. Could a nonfunctional adrenal incidentaloma be a risk factor for increased carotid intima-media thickness and 10-year cardiovascular mortality based on the SCORE algorithm? A study from a single centre in Poland. Endokrynol Pol. 2023;74(6):95139. doi: 10.5603/ep.95139. [DOI] [PubMed] [Google Scholar]
- 15.Khan U. Nonfunctioning and subclinical cortisol secreting adrenal incidentalomas and their association with metabolic syndrome: A systematic review. Indian J Endocrinol Metab. 2019;23(3):332–46. doi: 10.4103/ijem.IJEM_52_19. [DOI] [PMC free article] [PubMed] [Google Scholar]
- 16.Krzyżewska K, Niemczuk E, Myśliwiec B, Junik R. Glucose metabolism disorders in patients with non-functioning adrenal adenomas – single centre experience. Endokrynol Pol. 2017;68(4):416–21. doi: 10.5603/EP.a2017.0034. [DOI] [PubMed] [Google Scholar]
- 17.Muscogiuri G, Mezza T, Cipolla C, et al. The size of adrenal incidentalomas correlates with insulin resistance. Is there a cause-effect relationship? Clin Endocrinol. 2011;74(3):300–5. doi: 10.1111/j.1365-2265.2010.03928.x. [DOI] [PubMed] [Google Scholar]
- 18.SCORE2 Working Group and ESC Cardiovascular Risk Collaboration. SCORE2 risk prediction algorithms: New models to estimate 10-year risk of cardiovascular disease in Europe. Eur Heart J. 2021;42(25):2439–54. doi: 10.1093/eurheartj/ehab309. [DOI] [PMC free article] [PubMed] [Google Scholar]
- 19.SCORE2-OP Working Group and ESC Cardiovascular Risk Collaboration. SCORE2-OP risk prediction algorithms: Estimating incident cardiovascular event risk in older persons in four geographical risk regions. Eur Heart J. 2021;42(25):2455–67. doi: 10.1093/eurheartj/ehab312. [DOI] [PMC free article] [PubMed] [Google Scholar]
- 20.Araujo-Castro M, Parra Ramírez P, Robles Lázaro C, et al. Predictors of tumour growth and autonomous cortisol secretion development during follow-up in non-functioning adrenal incidentalomas. J Clin Med. 2021;10(23):5509. doi: 10.3390/jcm10235509. [DOI] [PMC free article] [PubMed] [Google Scholar]
- 21.Araujo-Castro M, Sampedro Núñez MA, Marazuela M. Autonomous cortisol secretion in adrenal incidentalomas. Endocrine. 2019;64(1):1–13. doi: 10.1007/s12020-019-01888-y. [DOI] [PubMed] [Google Scholar]
- 22.Akkus O, Akkus G, Kaypakli O, et al. Increased rates of coronary artery calcium score in patients with non – functioning adrenal incidentaloma. Endocr Metab Immune Disord Drug Targets. 2021;21(7):1319–25. doi: 10.2174/1871530320666200910110337. [DOI] [PubMed] [Google Scholar]
- 23.Rebelo JFD, Costa JM, Junqueira FD, et al. Adrenal incidentaloma: Do patients with apparently nonfunctioning mass or autonomous cortisol secretion have similar or different clinical and metabolic features? Clin Endocrinol (Oxf) 2023;98(5):662–69. doi: 10.1111/cen.14861. [DOI] [PubMed] [Google Scholar]
- 24.Sereg M, Szappanos A, Toke J, et al. Atherosclerotic risk factors and complications in patients with non-functioning adrenal adenomas treated with or without adrenalectomy: A long-term follow-up study. Eur J Endorcinol. 2009;160:647–55. doi: 10.1530/EJE-08-0707. [DOI] [PubMed] [Google Scholar]
- 25.Araszkiewicz A, Bandurska-Stankiewicz E, Borys S, et al. Standards of care in diabetes. The position of Diabetes Poland – 2024. Current Topics in Diabetes. 2023;3(3–4):1–348. [Google Scholar]
- 26.Szychlińska M, Rzeczkowska M, Gontarz-Nowak K, et al. Do non-functional adrenal adenomas affect metabolic profile and carotid intima-media thickness? A single centre study from Poland. J Clin Med. 2023;12(14):4612. doi: 10.3390/jcm12144612. [DOI] [PMC free article] [PubMed] [Google Scholar]
- 27.Araujo-Castro M, Mínguez Ojeda C, Sánchez Ramírez MN, et al. Adrenalectomy improves blood pressure control in nonfunctioning adrenal incidentalomas and glycemic and lipid control in patients with autonomous cortisol secretion. Endocrine. 2022;78(1):142–50. doi: 10.1007/s12020-022-03120-w. [DOI] [PubMed] [Google Scholar]
- 28.Emral R, Aydoğan Bİ, Köse AD, et al. Could a nonfunctional adrenal incidentaloma be a risk factor for increased carotid intima-media thickness and metabolic syndrome. Endocrinol Diabetes Nutr (Engl Ed) 2019;66(7):402–9. doi: 10.1016/j.endinu.2019.01.007. [DOI] [PubMed] [Google Scholar]
- 29.Araujo-Castro M, Robles Lázaro C, Parra Ramírez P, et al. Cardiometabolic profile of non-functioning and autonomous cortisol-secreting adrenal incidentalomas. Is the cardiometabolic risk similar or are there differences? Endocrine. 2019;66(3):650–59. doi: 10.1007/s12020-019-02066-w. [DOI] [PubMed] [Google Scholar]
- 30.Mintziori G, Georgiou T, Anagnostis P, et al. Could lipid profile be used as a marker of autonomous cortisol secretion in patients with adrenal incidentalomas? Horm Metab Res. 2018;50(7):551–55. doi: 10.1055/a-0630-1397. [DOI] [PubMed] [Google Scholar]
- 31.Chen AX, Radhakutty A, Drake SM, et al. Cardiovascular risk markers in adults with adrenal incidentaloma and mild autonomous cortisol secretion. J Clin Endocrinol Metab. 2024;109(3):e1020–e28. doi: 10.1210/clinem/dgad665. [DOI] [PubMed] [Google Scholar]
- 32.Li X, Xiao S, Zhan X, Yu Y, et al. For small (1–3cm) nonfunctional adrenal incidentaloma (NFAI), which option is more appropriate for conservative treatment or surgery? Front Endocrinol (Lausanne) 2023;14:1119251. doi: 10.3389/fendo.2023.1119251. [DOI] [PMC free article] [PubMed] [Google Scholar]
- 33.Hamidi O. Cardiovascular and metabolic consequences in patients with asymptomatic adrenal adenomas. Curr Opin Endocrinol Diabetes Obes. 2021;28(3):277–82. doi: 10.1097/MED.0000000000000628. [DOI] [PubMed] [Google Scholar]
- 34.Akkus G, Evran M, Sert M, Tetiker T. Adipocytokines in non-functional adrenal incidentalomas and relation with insulin resistance parameters. Endocr Metab Immune Disord Drug Targets. 2019;19(3):326–32. doi: 10.2174/1871530318666181009112042. [DOI] [PubMed] [Google Scholar]


