Abstract
Infection with the pathogenic bacterium Vibrio parahaemolyticus typically causes severe hepatopancreatic damage in Penaeus vannamei, often resulting in acute shrimp mortality. Therefore, protecting the shrimp's hepatopancreas is crucial for enhancing their disease resistance. Previous research has demonstrated that the probiotic strain Lactobacillus plantarum Ep-M17 inhibits the growth of V. parahaemolyticus E1 in vitro. However, it remains uncertain whether Ep-M17 can provide protective benefits to the shrimp's hepatopancreas. To address this knowledge gap, our present study investigated the histological changes, enzyme activity, gene transcription, and metabolite levels in the hepatopancreas of shrimp after a 4-week diet supplemented with Ep-M17. The results revealed that incorporating Ep-M17 into the shrimp's diet alleviated the damage by V. parahaemolyticus E1 infection in hepatopancreatic cells. In addition, the inclusion of Ep-M17 notably boosted the effectiveness of immunodigestive enzymes such as SOD, AKP, and CAT. Furthermore, Ep-M17 stimulated gene transcription in crucial immune response-related signalling pathways like the mitogen-activated protein kinase signaling pathway and the antigen processing and presentation pathway. Moreover, the incorporation of Ep-M17 into shrimp diets increased the levels of β-alanine, and histidine in the hepatopancreas, enhancing anti-inflammatory capacity and improving the shrimp's immune response. Overall, the results indicate that incorporating Ep-M17 into the diet can enhance shrimp disease resistance by bolstering both immune response and metabolic activity within the hepatopancreas. These results underscore the importance of probiotics in controlling aquatic animal diseases and highlight Ep-M17 as a promising dietary supplement for enhancing shrimp health and immunity in aquaculture.
1. Introduction
Penaeus vannamei is known for its delectable taste and high nutritional value, making it an excellent choice for high-density factory farming due to its tolerance to a wide range of salinities. This species of shrimp is currently the most widely cultivated globally, accounting for 83% of all farmed shrimp [1, 2]. However, the expansion and intensification of aquaculture practices have rendered P. vannamei highly susceptible to various diseases. In addition to the white spot syndrome virus (WSSV), a plethora of emerging bacterial, fungal, and parasitic diseases have inflicted significant economic losses on the shrimp industry [3]. One such emerging disease is acute hepatopancreas necrosis disease (AHPND), which has been spreading rapidly across global P. vannamei farming regions since 2009. This disease exhibits wide and swift dissemination, with mortality rates surpassing 90% and discharge rates reaching 80%, consequently leading to a decline in global shrimp production [4]. AHPND shrimp displays distinctive histopathological features, including extensive necrotic and detached hepatopancreatic duct epithelia cells in the absence of bacterial colonization. Current studies have identified a link between acute hepatopancreas necrosis and V. parahaemolyticus infection carrying virulent plasmids pVHvo [5, 6].
While the use of antibiotics and other chemical drugs is effective in disease control within aquaculture, it raises concerns about safety and environmental impact, thereby hindering the industry's sustainable development [7–10]. As a result, there is a pressing necessity to investigate alternative approaches that ensure safety while also being environmental friendly. Probiotics have emerged as a widely recognized substitute that delivers health benefits to the host when consumed in adequate quantities [11–13]. In aquaculture, abundant research has demonstrated the positive effects of probiotics on the growth performance and immune defenses of shrimp [14–16]. Lactic acid bacteria (LAB), the predominant member of the LAB family, are frequently employed as probiotics in aquaculture due to their anaerobic, nonspore-forming, and acid-tolerant properties [17]. Notably, lactic acid bacteria exhibit adaptability to a broad range of temperatures, from 2°C to 53°C, facilitating colonization in various animal hosts [18]. Research has indicated that lactic acid bacteria hold promise in enhancing the health and immune function of aquatic animals, attributed to their ability to produce antimicrobial compounds that inhibit the proliferation of harmful bacteria in both the animal intestines and the surrounding aquatic environment [19–22].
The hepatopancreas of shrimp plays a vital role in nutrient absorption, as well as carbon and nitrogen metabolism, making it susceptible to damage from pathogenic bacteria [23, 24]. In previous investigations, the addition of L. plantarum Ep-M17 to the diets of P. vannamei resulted in improvements in the shrimp's gut microbiota and increased their resilience against V. parahaemolyticus E1 infection. This intervention resulted in a Relative percent survival (RPS) of 76.9% [25]. However, it remains unknown whether Ep-M17 can alleviate hepatopancreatic damage caused by V. parahaemolyticus. Hence, the intention of this study was to explore the hepatopancreatic protective properties of L. plantarum Ep-M17 in shrimp. This was pursued through histological examination, enzyme activity assessments, as well as transcriptomic and metabolomic sequencing analyses. We hope that these findings will provide valuable insights for the development of probiotic additives for disease control in shrimp aquaculture and environmental purification.
2. Materials and Methods
2.1. Bacterial Cultures
The L. plantarum strain Ep-M17 (BioProjects: PRJNA871793) was obtained from the intestine of a pearl gentian grouper. The strain was preserved at −80°C according to Du et al. [25]. Initially, the preserved L. plantarum Ep-M17 strains were thawed at room temperature, and an appropriate amount of bacterial solution was pipetted into 10 mL of de Man, Rogosa, and Sharpe (MRS) liquid medium for overnight incubation at 37°C. Following, the culture was transferred to a larger volume of MRS liquid medium to expand the culture.
2.2. Shrimp and Trial Diet
The experimental shrimp, with an average length of 4.5–5.5 cm per individual, were acquired from Xiangshan Aquatic Development Co., Ltd. in Ningbo, Zhejiang, China. Preceding the experiment, the shrimp were given a 1-week acclimate period in the new environment during which they were fed a basal diet. There were a total of 600 healthy shrimp randomly dispersed among six aquariums, each with a volume of 400 L and containing 100 shrimp. The control group (CDG group) was fed a commercial basal diet comprising fishmeal, soybean meal, canola meal, peanut meal, and corn protein powder. For the experimental group research design group (RDG group), the preserved L. plantarum Ep-M17 strain was thawed at room temperature. Subsequently, 100 μL of the strain was added to an MRS liquid medium for overnight incubation at 37°C. The culture was then transferred to a larger volume of MRS liquid medium for expansion. The cultured Ep-M17 strain was centrifuged, washed with PBS, and evenly sprayed onto the basal diet, making the final concentration of the bacteria reach 5 × 10⁸ CFU/g feed, and then fed to shrimp in the experimental RDG group. Both groups of shrimp were fed three times a day (8:00, 14:00, and 20:00) for a total of 4 weeks. During the feeding experiments, bait was provided at approximately 6% of the shrimp's body weight [26].
2.3. Challenge Assay
After four weeks of feeding the shrimp with Ep-M17, the challenge assay was conducted. During the test, the shrimp continued to consume the experimental diet. The V. parahaemolyticus E1 was obtained from a −80°C refrigerator, revived, and then inoculated at a concentration of 0.1% into fresh 2216E broth. The broth was then incubated at 28°C with continuous shaking for 18 hr. The resulting bacterial solution was centrifugated at 3,000 g for 10 min at 4°C. Based on preliminary experiments, it was determined that a concentration of 1.0 × 10⁷ CFU/mL of V. parahaemolyticus E1 was optimal. Therefore, the collected bacteria were diluted with sterile seawater to achieve a concentration of approximately 1.0 × 10⁷ CFU/mL. The infection of shrimp by immersion lasted for 48 hr, after which the hepatopancreas tissues from the surviving shrimp were taken for histopathology, enzyme activity, gene transcriptome, and metabolomics analyses.
2.4. Histopathology
Initially, three shrimp were randomly chosen from each group at three specific time intervals: 2 weeks and 4 weeks postfeeding with Ep-M17, followed by a 48-hr exposure to V. parahaemolyticus E1. Their hepatopancreases were carefully removed using a sterile scalpel. Subsequently, the samples underwent fixation in a 4% paraformaldehyde solution for a duration of 24 hr. Following fixation, the samples underwent dehydration using a series of graded alcohol concentrations (70%, 80%, 95%, and 100%) and were incorporated into paraffin. Subsequently, the tissue was sliced into 0.5 mm thick sections using a rotary sectioning machine and stained with hematoxylin-eosin. Finally, the samples were examined under a light microscope at a magnification of 200x to capture images.
2.5. Immunoenzymatic Activity Analysis
The hepatopancreas samples were dried using filter paper, weighed, and subsequently homogenized in a buffer solution according to the protocol provided by the enzyme-linked immunosorbent assay (ELISA) Assay Kit. Following homogenization, the samples were centrifuged at 3,000 g for 10 min, and the supernatant obtained after centrifugation was collected. The activities of alpha-amylase (AMS), digestive enzyme trypsin (TRY) and lipase (LIP), as well as alkaline phosphatase (AKP), catalase (CAT), and antioxidant enzyme superoxide dismutase (SOD) were measured according to the instructions provided in the kit. Subsequently, the absorbance at 450 nm was assessed for each well within a 96-well plate utilizing a Rayto RT-6100 ELISA plate reader.
2.6. RNA Separation and cDNA Library Construction
Following 4 weeks of cultivation, nine shrimp were randomly chosen from each group, with three shrimp selected from each aquarium for sampling purposes. Hepatopancreas tissues were excised using sterile scissors and forceps, washed with sterile PBS to remove impurities, and stored in liquid nitrogen for subsequent ribonucleic acid (RNA) extraction. Hepatopancreas samples were processed for total RNA extraction utilizing TRIzol reagent and the RNeasy Mini Kit. Subsequently, the concentration and purity of the extracted RNA were evaluated using a Nano 6000 detector from Bioanalytical systems. To synthesize cDNA, 30 μg of high-quality RNA was used in each group.
To isolate mRNA, Oligo (dT) magnetic beads were employed for enrichment, while ion interruption was utilized to fragment the RNA into fragments of approximately 300 bp in length. The initial phase involved the use of reverse transcriptase and six-base random primers to synthesize the first strand of cDNA. Following that, the second cDNA strand was produced, using the initial cDNA strand as a template. PCR amplification was performed to increase the abundance of library fragments, and subsequent selection of the library was guided by fragment size. The libraries were then quality assessed using the Agilent 2100 Bioanalyzer, followed by the determination of the overall library concentration and potent library concentration. Libraries featuring unique index sequences were mixed in suitable proportions determined by their concentrations and the desired sequencing depth. These combined libraries were uniformly dispersed to a concentration of 2 nm and subsequently converted into single-stranded libraries via alkali denaturation. Following RNA extraction and purification, library preparation ensued. The prepared libraries were then subjected to sequencing using Next-Generation Sequencing (NGS) technology on the Illumina HiSeq platform, employing Paired-end (PE) sequencing methodology.
2.7. Illumina Sequencing and Bioinformatics Analysis
To obtain the most authentic sequencing data file, the raw image data from Illumina HiSeq 4000 sequencing are processed through Base Calling and converted to FASTQ format. The Q30 value corresponds to an error rate of 0.001. Using statistical methods, the quality fluctuations of reads under all sequencing cycles were counted to visualize the quality of sequencing experimental data from a macroscopic perspective. The quality of bases, which is influenced by many elements including the sequencer itself, sequencing reagents, and samples, is connected to the error rate of sequencing for RNA-seq technology. To determine if sequencing is of good or terrible quality, the algorithm can be used to obtain a comprehensive number called quality (Q).
The transcript sequences were obtained by scratch splicing the obtained high-quality sequences, clustering the transcripts, selecting the longest transcripts as Unigene, and finally using Unigene for subsequent GO (Gene Ontology), KEGG (Kyoto Encyclopedia of Genes and Genomes) and other databases for prediction. Simultaneously, the filtered sequences were set against the Unigene database to determine the Reads Count for each Unigene. Using the filtered sequences, alignment to the Unigene database was performed to derive the Reads Count corresponding to each Unigene. Subsequently, expression differences and enrichment analyses were carried out based on this data for the samples.
2.8. Chromatography-Mass Spectrometry Analysis
The thawing process for hepatopancreas samples was conducted gradually at 4°C. Following thawing, an adequate amount of sample was combined with a precooled solution consisting of methanol, acetonitrile, and water in a ratio of 2 : 2 : 1 (v/v). Following agitation, the mixture was subjected to sonication at a low temperature for 30 min, followed by a 10-min incubation at −20°C. Subsequently, centrifugation was performed at 14,000 g for 20 min at 4°C, resulting in the separation of the supernatant. The supernatant was then subjected to vacuum drying before being mixed with a 100 μL solution of aqueous acetonitrile (with a ratio of acetonitrile to water of 1 : 1, v/v) for subsequent mass spectrometry analysis. After vortexing and centrifugation at 14,000 g for 15 min at 4°C, the resulting supernatant was utilized for further analysis.
2.8.1. Chromatographic Analysis Conditions
The separation of samples was conducted using an Agilent 1290 Infinity LC (UHPLC) system furnished with a hydrophilic interaction liquid chromatography (HILIC) column, operating at a temperature of 25°C and a flow rate of 0.5 mL/min. Injection of samples was carried out with a capacity of 2 μL. The mobile phase comprised water containing 25 mM ammonium acetate and 25 mM ammonia (referred to as mobile phase A), as well as acetonitrile (referred to as mobile phase B). The elution was performed using a gradient method: B was maintained at 95% from 0 to 0.5 min, followed by a linear change in B from 0.5 to 7 min (from 95% to 65%), and then a linear change in B from 7 to 8 min (from 65% to 40%). B was kept at 40% from 8 to 9 min, followed by a linear change in B from 9 to 9.1 min (from 40% to 95%). During the analysis, the proportion of mobile phase B was held constant at 95% between 9.1 and 12 min. Throughout the analysis, the samples were maintained at 4°C within the autosampler.
2.8.2. Mass Spectrometry Conditions
The AB Triple TOF 6600 mass spectrometer was utilized to acquire both the primary and secondary spectra of the samples. Prior to mass spectrometry analysis, the UHPLC system (the Agilent 1290 Infinity LC) was used to separate the samples. Analysis of the samples was conducted utilizing both negative and positive ion modes of electrospray ionization (ESI). The instrument was arranged with the following parameters: Gas 1 and Gas 2 were both set to 60, the gas curtain (CUR) was kept at 30 psi, the ion source temperature was set to 600°C, and the spray voltage (ISVF) was adjusted to ±5,500 V for both negative and positive modes. The mass-to-charge ratio detection range was set to 60–1,000 Da for primary ion detection and 25–1,000 Da for secondary ion detection. During the analysis, the primary mass spectrometry scan had an accumulation time of 0.20 s/spectra, while for the secondary mass spectrometry, it was 0.05 s/spectra. Secondary mass spectra were obtained using data-dependent acquisition mode (IDA) and peak intensity value screening mode. The declustering voltage (DP) was set at ±60 V for both negative and positive modes, with collision energy maintained at 35 ± 15 eV. The dynamic exclusion of isotope ions range was set to 4 Da, and 10 fragment profiles were acquired per scan.
2.9. Metabolomic Data Analysis and Processing
The data obtained from the mass spectrometer were initially processed into .mzXML format using ProteoWizard software. Following this, peak alignment, retention time correction, and extraction of peak areas were performed using the XCMS software. The resulting data underwent metabolite structure identification, quality evaluation, and preprocessing. A range of analytical methods were applied, encompassing univariate statistical analysis, multidimensional statistical analysis, differential metabolite screening, differential metabolite correlation analysis, and KEGG pathway analysis. These approaches were utilized to detect and assess noteworthy disparities in metabolites. Following initial processing, the data underwent comprehensive analysis employing various techniques, such as univariate and multidimensional statistical analysis, differential metabolite correlation analysis, differential metabolite screening, and KEGG pathway analysis. These methods were utilized to identify and assess significant variations in the metabolites.
2.10. Statistical Analysis
The data were represented as mean ± standard deviation, and statistical analysis was conducted using SPSS 25.0 software. Independent samples t-tests were employed to assess mean differences across various experimental groups. Statistical significance was determined with a threshold of P < 0.05 indicating significance, and P < 0.01 denoting extreme statistical significance.
3. Results
3.1. Histology of the Hepatopancreas
Histological studies were conducted to examine the influence of Ep-M17 on the hepatopancreas structure of shrimp, both at the end of the feeding trial and the challenge assay. The results indicated that feeding Ep-M17 for 2 or 4 weeks led to a more intact hepatopancreatic basement membrane and a more regular stellate duct lumen structure in comparison to the control group (Figures 1(a), 1(b), 1(d) and 1(e)). In addition, following the V. parahaemolyticus E1 attack, the control shrimp exhibited severe cellular damage, including disruption of the luminal structure of the stellate ducts and a reduction in R and B cells (Figure 1(c)). However, the Ep-M17-fed shrimp maintained an intact hepatopancreatic basement membrane and the hepatic tubules were well preserved without any signs of cell necrosis or severe cellular damage (Figure 1(f)).
Figure 1.
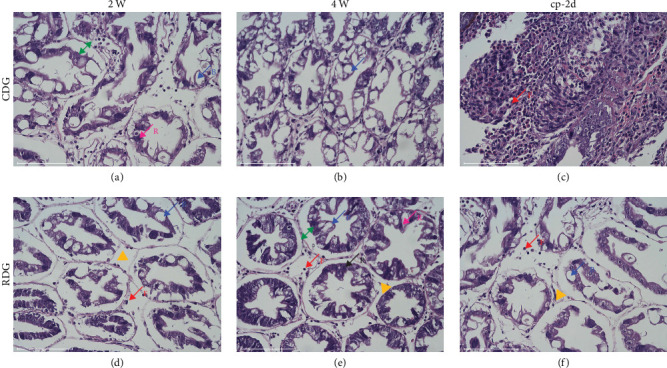
Hepatopancreas histology staining was performed using hematoxylin-eosin. Shrimp were divided into two groups and fed different diets: the CDG group fed basal diet, while the RDG group received a basal diet containing L. plantarum Ep-M17. Samples were collected at three different time points: the second (2 W) and fourth weeks (4 W) of feeding, and the 48 hr after the V. parahaemolyticus E1 attack (cp-2d). In the stained samples, R cells were observed to contain lipid vacuoles of varying sizes. F cells exhibited abundant ribosomes and well-developed endoplasmic reticulum. B cells typicall displayed a single large secretory vesicle. The green double arrows indicate the surface cell epithelium, while yellow triangles mark the cell interstices. Bar: 100 μm. (a) Feeding with basal diet for the second week (2 W); (b) feeding with basal diet for the fourth week (4 W); (c) control group at 48 hours after V. parahaemolyticus E1 challenge (cp-2d); (d) feeding with diet supplemented with L. plantarum Ep-M17 for the second week (2 W); (e) feeding with diet supplemented with L. plantarum Ep-M17 for the fourth week (4 W); and (f) experimental group at 48 hours after V. parahaemolyticus E1 challenge (cp-2d).
3.2. Immune and Digestive Enzyme Activity
The findings illustrated in Figure 2 suggest that the application of Ep-M17 probiotics to shrimp led to an elevation in the operation of immune- and digestion-related enzymes in the hepatopancreas. Within just one week of feeding, significant increases in the activity of SOD, AKP, and CAT were observed in the RDG group compared to the CDG group. Following the challenge with V. parahaemolyticus E1, the activity of AKP initially increased and then decreased in both groups, while the activity of SOD and CAT continued to increase. Notably, the activity of SOD, AKP, and CAT in the RDG group remained markedly greater than in the CDG group (Figure 2(a)–2(c)). In addition, after 2 weeks of feeding, the enzyme activities of LIP and AMS were significantly higher in the RDG group compared to the CDG group. TRY activity was also notably elevated in the RDG group after 4 weeks of feeding. Following the challenge with V. parahaemolyticus E1, TRY and AMS activities displayed a trend of rising and falling, whereas LIP activity continued to rise. Importantly, the enzyme activities of TRY, AMS, and LIP in the RDG group remained markedly greater than the CDG group (Figure 2 (d)–2(f)).
Figure 2.
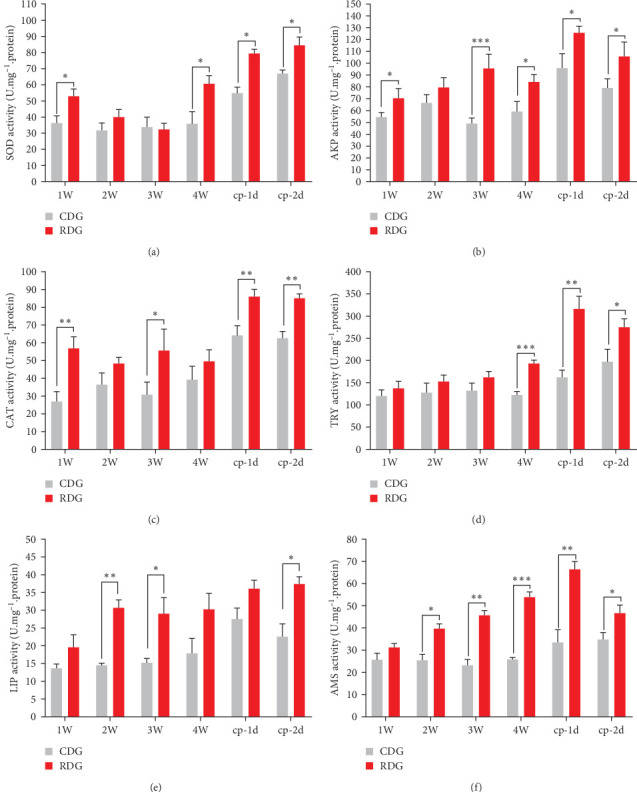
Measuring immune and digestive enzyme activity in P. vannamei's hepatopancreas. (a) SOD; (b) AKP; (c) CAT; (d) TRY; (e) LIP; (f) AMS. The data are presented as mean values and standard deviation (±SD) for each parameter (n = 5). Different letters indicate significant differences between means in the same row (∗P < 0.05, ∗∗P < 0.01, ∗∗∗P < 0.001). The X-axis represents the time points at 1, 2, 3, and 4 weeks after the start of the experiment, and cp-1d and cp-2d represent the 24 and 48 hr after the challenge, respectively.
3.3. Transcriptome Sequence Assembly
Transcriptome sequencing and assembly were conducted on six cDNA libraries generated from mRNA isolated from shrimp hepatopancreas. The shrimp were fed either a control diet or a diet enriched with Ep-M17 probiotics. After eliminating low-quality reads and adapter sequences, the average number of clean reads obtained for the CDG and RDG groups was 43.53 million and 41.92 million, respectively. This yielded 41.22 million and 39.69 million high-quality reads, representing 94.66% and 94.78% of the original data, respectively (Table 1). The sequencing exhibited high quality, ensuring the suitability of the data for robust downstream analysis.
Table 1.
Statics of sequencing.
| Sample | Reads no. | Bases (bp) | Q30 (bp) | N (%) | Q20 (%) | Q30 (%) | Clean reads no. | Clean data (bp) |
Clean reads (%) | Clean data (%) |
|---|---|---|---|---|---|---|---|---|---|---|
| CDG-1 | 44,944,802 | 6,786,665,102 | 6,255,074,092 | 0.000695 | 96.91 | 92.16 | 42,548,068 | 6,424,758,268 | 94.66 | 94.66 |
| CDG-2 | 46,489,684 | 7,019,942,284 | 6,496,633,473 | 0.000712 | 97.05 | 92.54 | 44,066,664 | 6,654,066,264 | 94.78 | 94.78 |
| CDG-3 | 39,163,888 | 5,913,747,088 | 5,413,467,606 | 0.000721 | 96.62 | 91.54 | 37,073,016 | 5,598,025,416 | 94.66 | 94.66 |
| RDG-1 | 39,916,996 | 6,027,466,396 | 5,577,144,286 | 0.000712 | 97.11 | 92.52 | 37,789,824 | 5,706,263,424 | 94.67 | 94.67 |
| RDG-2 | 45,287,730 | 6,838,447,230 | 6,274,854,056 | 0.000723 | 96.72 | 91.75 | 42,842,026 | 6,469,145,926 | 94.59 | 94.59 |
| RDG-3 | 40,577,070 | 6,127,137,570 | 5,610,999,013 | 0.000722 | 96.68 | 91.57 | 38,444,440 | 5,805,110,440 | 94.74 | 94.74 |
Sample: Sample name; No.: Total number of Reads; Bases (bp): Total number of Bases; Q30 (bp): Total number of bases for which recognition accuracy is above 99.9%; N (%): Percentage of fuzzy bases; Q20 (%): The percentage of bases for which recognition accuracy is above 99%; Q30 (%): Percentage of bases for which recognition accuracy is above 99.9%; Clean Reads No: High-quality sequence read number; Clean Data (bp): High-quality sequence base number; Clean Reads %: High-quality Reads take up the percentage of sequencing Reads; Clean Data %: The percentage of high-quality sequence bases in sequencing bases.
3.4. Identification of DEGs
Pearson's correlation coefficient was employed to assess the similarity in gene expression levels across the samples. The results showed that each sample exhibited a coefficient value >0.8, indicating a high degree of consistency in the gene expression patterns observed among the samples (Figure 3(a)). Differential expression genes (DEGs) were identified using DESeq, with a P-value threshold of <0.05 and |log2 fold change| > 1. The volcano plot in Figure 3(b) illustrates the correlation between the fold-change and P-value of DEGs that are either up or downregulated in each comparison. Compared to the CDG group, 38,637 unigenes exhibited no statistically significant variances, whereas shrimp fed with Ep-M17 demonstrated notable upregulation in 317 unigenes and downregulation in 234 unigenes. Cluster analysis of the transcriptional expression patterns revealed distinct clustering of CDG and RDG groups in the generated heat map (Figure 3(c)), indicating a significant influence of Ep-M17 supplementation on gene expression patterns in shrimp hepatopancreas.
Figure 3.
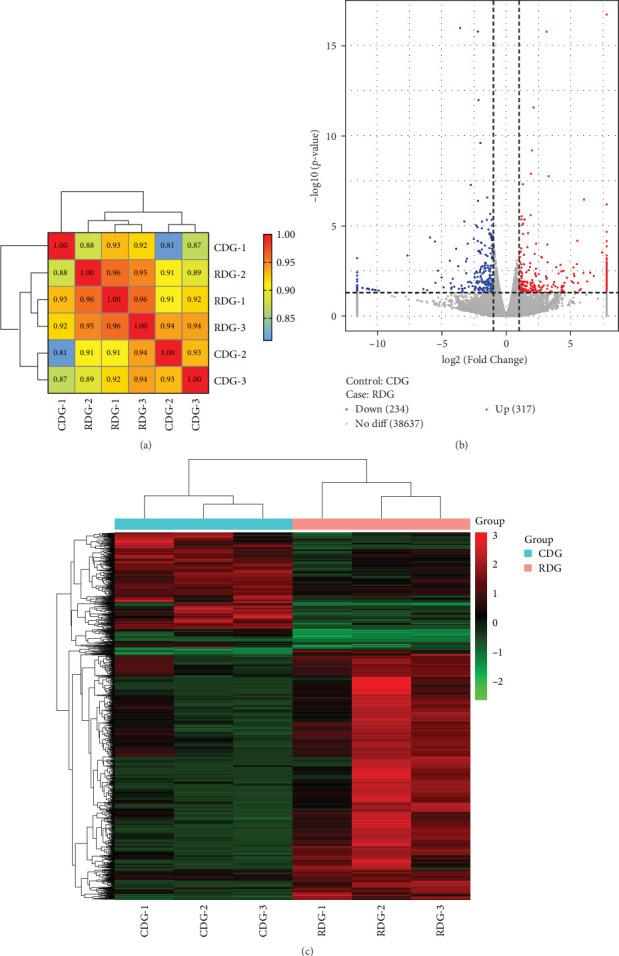
(a) Pearson correlation coefficients were calculated to assess the relationship among samples. (b) Volcano plot showing the differentially expressed genes in shrimp fed a basic commercial diet (CDG) compared to those supplemented with L. plantarum Ep-M17 (RDG). The X-axis represents the fold change in gene expression, while the Y-axis represents statistical significance. Red splashes indicate genes that are significantly upregulated, blue splashes indicate genes significantly downregulated, and shaded area splashes indicate genes without significant differences in expression. The corrected P-value is represented by—log10 (P-adjusted). (c) Heat map analysis.
3.5. GO Enrichment Analysis
Functional enrichment analysis using GO was conducted to determine the biological roles of the DEGs identified in the study (Figure 4). The analysis demonstrated that the upregulated DEGs after feeding Ep-M17 were predominantly enriched in the following categories, compared to the control group: cellular component (cytosolic ribosome, eukaryotic translation elongation factor 1 complex, cytoplasmic side of lysosomal membrane, ribosomal subunit, CatSper complex, ribosome, cytosolic large ribosomal subunit, myelin sheath, large ribosomal subunit, and side of membrane), molecular function (chaperone binding, unfolded protein binding, structural constituent of ribosome, progesterone receptor binding, glycolipid binding, drug binding, translation elongation factor activity, glyceryl-ether monooxygenase activity, acting on paired donors, oxidoreductase activity, and protein tag), and biological progress (cytoplasmic translation, protein folding, protein localization to endoplasmic reticulum, SRP-dependent cotranslational protein targeting, establishment of protein localization to endoplasm, protein targeting to ER, nuclear-transcribed mRNA catabolic process, cotranslational protein targeting to membrane, nonsen, organonitrogen compound biosynthetic process, and regulation of chaperone-mediated autophagy). According to the GO analysis, the immune genes that were found to be significantly differentially expressed in the hepatopancreas of shrimp fed Ep-M17 were mainly related to immune response, heat shock proteins, mitogen-activated protein kinase (MAPK) signaling pathway, and oxidoreductase activity (Table 2).
Figure 4.
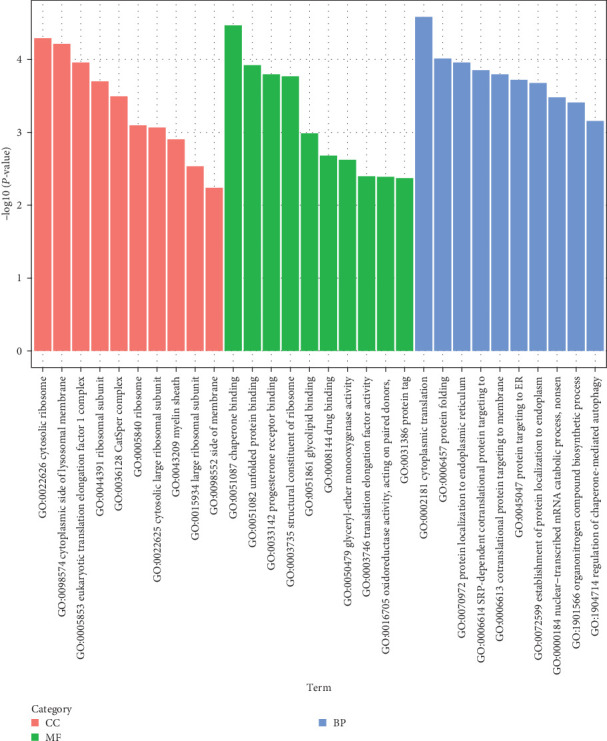
GO enrichment analysis of differentially expressed genes. Cellular component (CC), molecular function (MF), and biological process (BP).
Table 2.
GO enrichment of immune-related genes.
| ID | Fold change | P value | Homologues function | Species |
|---|---|---|---|---|
| Immune response | ||||
| TRINITY_DN13590_c0_g1 | 19.27 | 0.02729 | C-type lectin 1 | Penaeus vannamei |
| TRINITY_DN497_c2_g1 | 2.24 | 0.00137 | Dual 3',5'-cyclic-AMP and—GMP phosphodiesterase 11 | P. vannamei |
| TRINITY_DN6466_c1_g1 | 2.08 | 0.00054 | Caspase-8-like | Penaeus monodon |
| TRINITY_DN10125_c0_g1 | Inf | 0.00222 | Hypothetical protein EGW08_020278 | Elysia chlorotica |
| TRINITY_DN7113_c0_g1 | 63.04 | 0.00419 | Hypothetical protein L596_006287 | Steinernema carpocapsae |
| TRINITY_DN1907_c0_g1 | Inf | 0.00525 | Hypothetical protein CAPTEDRAFT_183889 | Capitella teleta |
| TRINITY_DN1625_c4_g1 | 76.72 | 0.01233 | Sequestosome-1 | Toxocara canis |
| TRINITY_DN18993_c3_g1 | Inf | 0.00343 | R27a protein | Phallusia mammillata |
| TRINITY_DN76030_c0_g1 | Inf | 0.03414 | Predicted protein | Nematostella vectensis |
| TRINITY_DN5401_c0_g1 | Inf | 0.04592 | Heat Shock 70kda Protein 5-like | Varroa destructor |
| TRINITY_DN2659_c0_g1 | 3.08 | 0.00015 | Tyrosine-protein phosphatase Lar-like | P. monodon |
| TRINITY_DN1605_c0_g1 | 2.48 | 0.00003 | Baculoviral IAP repeat-containing protein 8-like | Penaeus vannamei |
| Heat shock protein | ||||
| TRINITY_DN10612_c0_g3 | Inf | 0.00002 | Inducible heat shock protein 70 | Tigriopus japonicus |
| TRINITY_DN10612_c0_g2 | Inf | 0.00007 | Inducible heat shock protein 70 | T. japonicus |
| TRINITY_DN1801_c0_g1 | 173.92 | 0.00030 | Heat shock protein 90 | Plakobranchus ocellatus |
| TRINITY_DN31166_c0_g1 | Inf | 0.00130 | Heat shock cognate 70 kda protein 2-like | Artibeus jamaicensis |
| MAPK signaling pathway | ||||
| TRINITY_DN3105_c0_g1 | Inf | 0.00649 | Serine protease 2 | Costelytra zealandica |
| TRINITY_DN5232_c0_g1 | 2.59 | 0.00137 | LOW QUALITY PROTEIN: probable phosphoserine aminotransferase | P. vannamei |
| TRINITY_DN16109_c0_g1 | 2.44 | 0.04529 | N-terminal Xaa-Pro-Lys N-methyltransferase 1-like | P. monodon |
| Oxidoreductase activity | ||||
| TRINITY_DN85_c1_g1 | 2.65 | 0.00000 | Putative alkylglycerol monooxygenase-like | P. vannamei |
| TRINITY_DN4904_c2_g1 | 2.04 | 0.00052 | Alkylglycerol monooxygenase-like isoform X1 | P. monodon |
| TRINITY_DN5015_c0_g1 | 2.51 | 0.01219 | Gamma-butyrobetaine dioxygenase-like | P. vannamei |
| TRINITY_DN3014_c0_g1 | 2.33 | 0.01705 | LOW QUALITY PROTEIN: phenoloxidase 3-like | P. vannamei |
| TRINITY_DN3935_c0_g1 | Inf | 0.02168 | Unnamed protein product | Didymodactylos carnosus |
| TRINITY_DN4486_c0_g1 | Inf | 0.02479 | Glucosamine-6-phosphate isomerase 1 isoform X1 | Choloepus didactylus |
| TRINITY_DN9040_c0_g1 | 2.10 | 0.03642 | Protein disulfide-isomerase A4-like | P. vannamei |
| TRINITY_DN6586_c0_g1 | 19.81 | 0.03642 | Protein disulfide-isomerase | Elysia marginata |
| TRINITY_DN79418_c0_g1 | Inf | 0.03772 | Aldo-keto reductase family 1 member A1-B | Polypterus senegalus |
| TRINITY_DN6846_c0_g2 | 2.17 | 0.02998 | Hypothetical protein C7M84_010294 | P. vannamei |
| Transmembrane signaling receptor activity | ||||
| TRINITY_DN10469_c0_g1 | 3.21 | 0.03763 | Uncharacterized protein LOC113805974 | P. vannamei |
| TRINITY_DN13590_c0_g1 | 19.27 | 0.02729 | C-type lectin 1 | P. vannamei |
| TRINITY_DN14206_c0_g1 | 5.81 | 0.02378 | Octopamine receptor beta-2R-like | P. vannamei |
| TRINITY_DN1990_c0_g1 | 2.57 | 0.03178 | Insulin receptor-related protein-like | P. monodon |
| TRINITY_DN2659_c0_g1 | 3.08 | 0.00015 | Tyrosine-protein phosphatase Lar-like | P. monodon |
| TRINITY_DN33806_c0_g1 | 11.30 | 0.04639 | Hypothetical protein C7M84_001710 | P. vannamei |
| TRINITY_DN7471_c0_g1 | 4.83 | 0.03848 | G-protein coupled receptor moody-like | P. vannamei |
| Autophagy | ||||
| TRINITY_DN10125_c0_g1 | Inf | 0.00222 | Hypothetical protein EGW08_020278 | E. chlorotica |
| TRINITY_DN1625_c4_g1 | 76.72 | 0.01233 | Sequestosome-1 | T. canis |
| TRINITY_DN1907_c0_g1 | Inf | 0.00525 | Hypothetical protein CAPTEDRAFT_183889 | C. teleta |
| TRINITY_DN1990_c0_g1 | 2.57 | 0.03178 | Insulin receptor-related protein-like | P. monodon |
| TRINITY_DN23565_c0_g1 | 22.65 | 0.01439 | Elongation factor 1-alpha 1 | Microcaecilia unicolor |
| TRINITY_DN31166_c0_g1 | Inf | 0.00130 | Heat shock cognate 70 kda protein 2-like | A. jamaicensis |
| TRINITY_DN6466_c1_g1 | 2.08 | 0.00054 | Caspase-8-like | P. monodon |
| TRINITY_DN7035_c0_g1 | 3.74 | 0.00000 | LOW QUALITY PROTEIN: elongation factor 1-alpha-like | P. monodon |
| TRINITY_DN7113_c0_g1 | 63.04 | 0.00419 | Hypothetical protein L596_006287 | S. carpocapsae |
| TRINITY_DN8760_c0_g1 | 12.53 | 0.01795 | Recname: Full = Elongation factor 1-alpha 1; Short = EF-1-alpha-1 | Oscheius tipulae |
3.6. KEGG Enrichment Analysis
The top 20 KEGG pathways with the most significant enrichment, as determined by FDR values, were selected for display based on the results of KEGG enrichment analysis of differentially expressed genes. As depicted in Figure 5 (a) majority of the DEGs in the hepatopancreas of shrimp fed Ep-M17 showed enrichment in several pathways, including Protein processing in endoplasmic reticulum, Ribosome, Legionellosis, Antigen processing and presentation, Coronavirus disease-COVID-19, Mitophagy-animal, Toxoplasmosis, Cysteine and methionine metabolism, Longevity regulating pathway-multiple species, Leishmaniasis, Estrogen signaling pathway, Systemic lupus erythematosus, Measles, Lipid and atherosclerosis, MAPK signaling pathway, Ubiquitin mediated proteolysis, Glycolysis/Gluconeogenesis, Glycine, Ascorbate and aldarate metabolism, Necroptosis, serine and threonine metabolism, as compared to the control group. Further analysis displayed that immune-related genes exhibited significantly upregulated expression in each pathway (Table 3).
Figure 5.
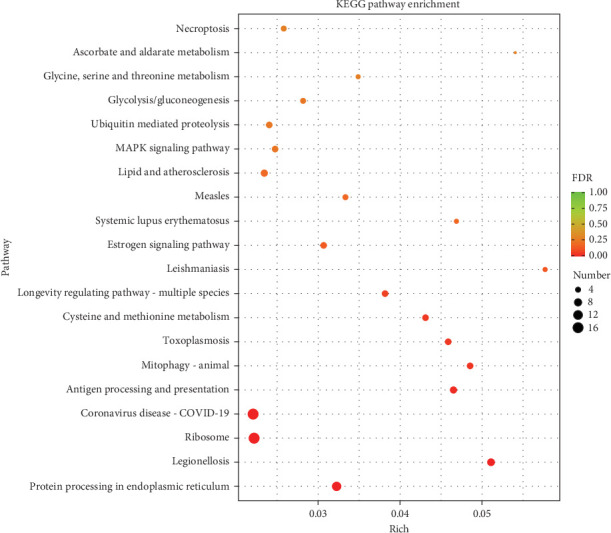
KEGG pathway analysis of the DEGs shown in scatterplots. The pathways are represented on the Y-axis, while the corresponding enrichment factor is represented on the X-axis. A darker shade of red indicates a smaller P-value, reflecting the significance of enrichment in a particular pathway. The size of the point indicates the number of DEGs in each pathway.
Table 3.
KEGG enrichment of immune-related pathways.
| ID | Fold change | P value | Homologues function | Species |
|---|---|---|---|---|
| Antigen processing and presentation | ||||
| TRINITY_DN1801_c0_g1 | 173.92 | 0.00030 | Heat shock protein 90 | P. ocellatus |
| TRINITY_DN5401_c0_g1 | Inf | 0.04592 | 78 kda glucose-regulated protein-like | Varroa jacobsoni |
| TRINITY_DN7113_c0_g1 | 63.04 | 0.00419 | Hypothetical protein L596_006287 | S. carpocapsae |
| TRINITY_DN10612_c0_g2 | Inf | 0.00007 | Inducible heat shock protein 70 | T. japonicus |
| TRINITY_DN10612_c0_g3 | Inf | 0.00002 | Inducible heat shock protein 70 | T. japonicus |
| TRINITY_DN31166_c0_g1 | Inf | 0.00130 | Heat shock cognate 70 kda protein 2-like | A. jamaicensis |
| MAPK signaling pathway | ||||
| TRINITY_DN1990_c0_g1 | 2.57 | 0.03178 | Insulin receptor-related protein-like | P. monodon |
| TRINITY_DN7113_c0_g1 | 63.04 | 0.00419 | Hypothetical protein L596_006287 | S. carpocapsae |
| TRINITY_DN10612_c0_g2 | Inf | 0.00007 | Inducible heat shock protein 70 | T. japonicus |
| TRINITY_DN10612_c0_g3 | Inf | 0.00002 | Inducible heat shock protein 70 | T. japonicus |
| TRINITY_DN31166_c0_g1 | Inf | 0.00130 | Heat shock cognate 70 kda protein 2-like | A. jamaicensis |
| PI3K-Akt signaling pathway | ||||
| TRINITY_DN1990_c0_g1 | 1.61 | 0.01739 | Uncharacterized protein LOC113801216 | P. vannamei |
| TRINITY_DN2659_c0_g1 | 3.08 | 0.00015 | Tyrosine-protein phosphatase Lar-like | P. monodon |
| TRINITY_DN1801_c0_g1 | 173.92 | 0.00030 | Heat shock protein 90 | P. ocellatus |
| Necroptosis | ||||
| TRINITY_DN1801_c0_g1 | 173.92 | 0.00030 | Heat shock protein 90 | P. ocellatus |
| TRINITY_DN1907_c0_g1 | Inf | 0.00525 | Hypothetical protein CAPTEDRAFT_183889 | C. teleta |
| TRINITY_DN3799_c0_g1 | Inf | 0.00076 | PREDICTED: histone H2A-like | Saccoglossus kowalevskii |
| TRINITY_DN6174_c0_g1 | 8.19 | 0.04836 | Glycogen phosphorylase, brain form isoform X1 | Chelonia mydas |
| Apoptosis-multiple species | ||||
| TRINITY_DN1605_c0_g1 | 2.48 | 0.00003 | Putative baculoviral IAP repeat-containing protein 7 isoform X2 | P. vannamei |
| TRINITY_DN6466_c1_g1 | 2.08 | 0.00054 | Caspase-8-like | P. monodon |
| Neutrophil extracellular trap formation | ||||
| TRINITY_DN3799_c0_g1 | Inf | 0.00076 | PREDICTED: histone H2A-like | S. kowalevskii |
| TRINITY_DN3863_c1_g1 | 11.65 | 0.04836 | Actin, clone 403 | Araneus ventricosus |
| TRINITY_DN9546_c0_g1 | Inf | 0.01737 | Putative histone H2B-like, partial | Cotesia chilonis |
| TRINITY_DN3778_c0_g1 | Inf | 0.00384 | PREDICTED: uncharacterized protein LOC105526835 | Colobus angolensis palliatus |
3.7. Metabolite Chemical Classification Attribution Statistics
Chemical classification attribute information was employed to categorize all identified metabolites, encompassing both negative and positive ions. As illustrated in Figure 6, it was observed that the predominant components of the various metabolites in the hepatopancreas of shrimp fed Ep-M17 included organic acids and their derivatives, lipids and lipid-like molecules, along with other substances.
Figure 6.
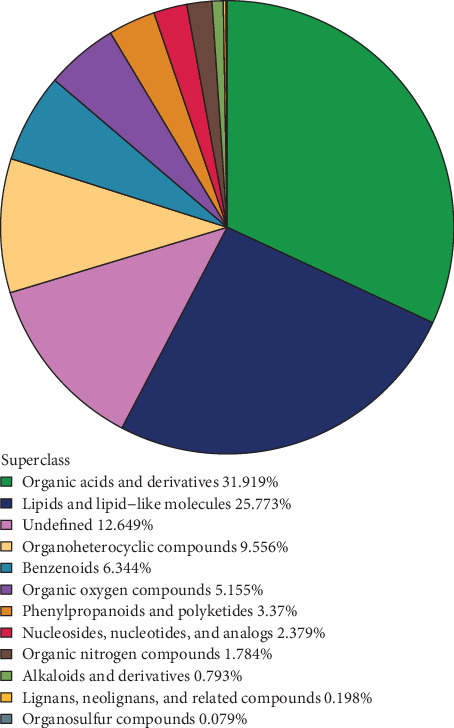
Metabolite chemical classification statistics. Each colored block represents a different chemical classification of metabolites, and the corresponding percentage indicates the proportion of metabolites in each category. The number of metabolites in each category is shown as a percentage of all identified metabolites. Metabolites that cannot be classified into any chemical category are labeled as “undefined”.
3.8. Analysis of Differences between Metabolic Groups
Significant metabolites between the groups were identified through a combination of univariate and multidimensional statistical analyses. The univariate analysis assessed differences in all detected metabolites in negative and positive ion modes, including unidentified metabolites. Differential metabolites with a fold change (FC) greater than 1.5 or less than 0.05 were illustrated in volcano plots (Figures 7(a) and 7(b)). The classification attribution of these differential metabolites was visualized using different colors (Figures 7(c) and 7(d)). Multidimensional statistical analysis was utilized to reduce the dimensionality of the collected data while retaining the maximum original information. Principal component analysis (PCA) was utilized to visualize the general distribution pattern of the samples among different groups and to assess the degree of variation among the samples within and between groups. The QC samples exhibited tighter clustering in both negative and positive ion modes, as depicted in Figures 8(a) and 8(b), indicating greater reproducibility across the experiments. In addition, orthogonal partial least-squares discriminant analysis (OPLS-DA) was conducted as a noise filtering method to improve the accuracy of the model. The scores from the OPLS-DA model in both negative and positive ion modes demonstrated a distinct differentiation between the experimental and control groups, with significant differences observed (Figures 8(c) and 8(d)). Furthermore, the model was subjected to a replacement test to ensure its validity and avoid overfitting. The results (Figures 8(e) and 8(f)) indicated a gradual decrease in both R2 and Q2 values of the stochastic model as the replacement retention decreased, affirming the reliability and robustness of the model.
Figure 7.
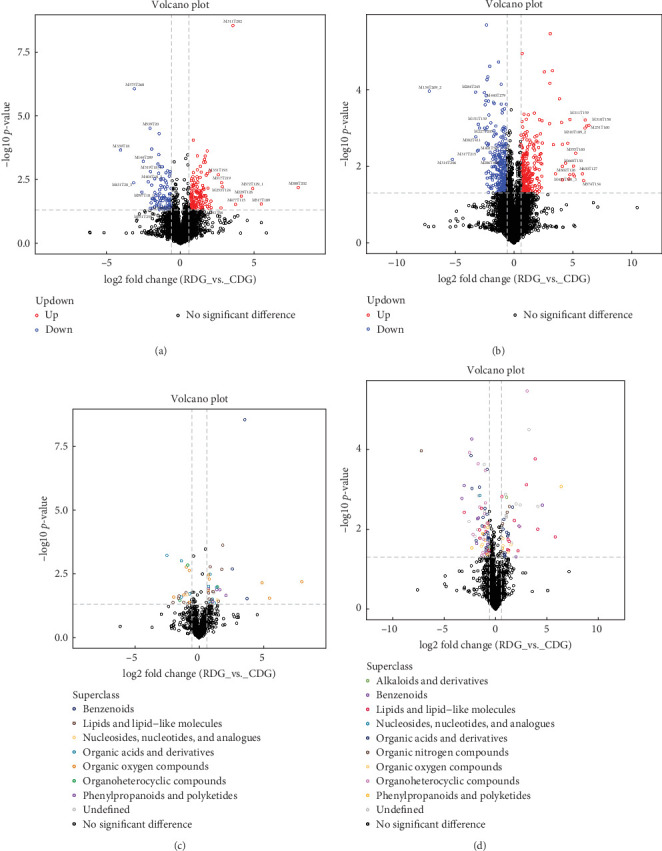
The differences between metabolic groups were analyzed using a negative/positive ion mode volcano map. (a and b): negative/positive ion mode volcano map. This plot shows the relationship between the fold change and the statistical significance of differentially expressed metabolites. The X-axis shows the fold change values and the Y-axis shows the—log10 transformed P-values. Metabolites that meet the criteria of FC > 1.5 and P-value < 0.05 are highlighted in red, while metabolites with FC < 0.05 are highlighted in blue. Metabolites that do not meet these criteria are shown in black. (c and d) negative/positive ion pattern volcano plot (colours correlate with differential metabolite chemical classification). The plot shows the logarithmic values of the fold change and the significance P-value for different metabolites. Metabolites with a fold change greater than 1.5 and a P-value less than 0.05 are shown in red, while metabolites with a fold change less than 0.05 are shown in blue. Metabolites that do not show significant differences are displayed in black. The chemical classification of metabolites is also represented by different colors.
Figure 8.
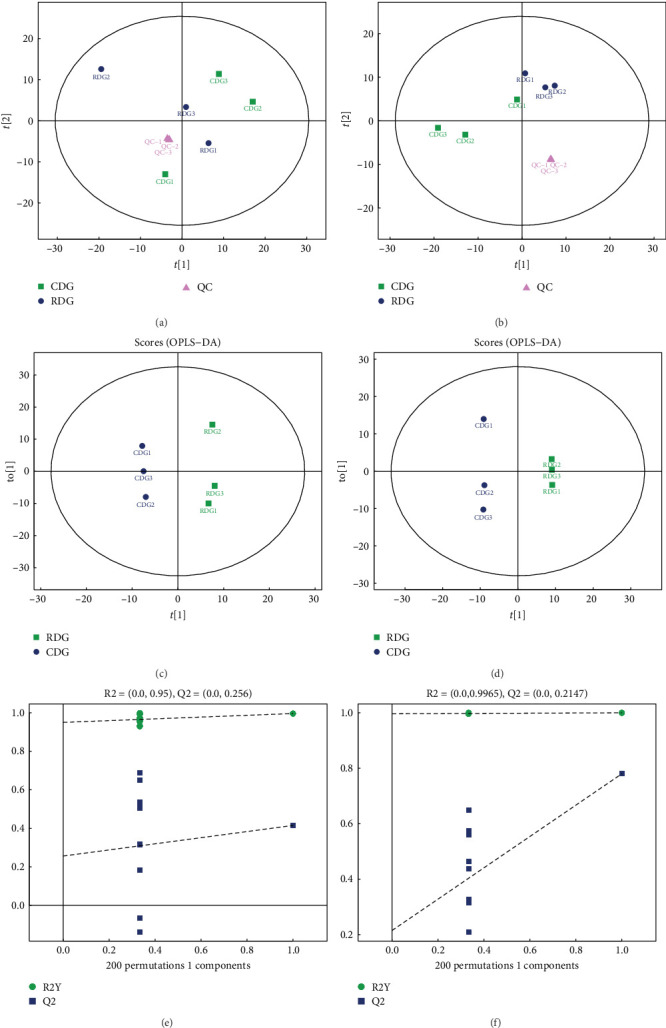
Multidimensional statistical analysis. (a and b) The figure shows a scatter plot where t [15] and t [19] represent the first and second principal components, respectively, and the ellipse represents the 95% confidence interval. Dots of the same color indicate individual biological replicates within a group, and the distribution of the dots reflects the variation between and within groups. (c and d): The figure shows the distribution of individual biological replicates within each group based on their variation in principal component 1 (t [15]) and principal component 2 (t [19]). Similar colors of dots represent individual biological replicates within the same group. (eand f) The figure shows the relationship between replacement retention (horizontal axis) and R2 and Q2 values (vertical axis). Green dots represent R2 values, blue dots represent Q2 values, and dashed lines represent regression lines for R2 and Q2. The upper right corner indicates the R2 and Q2 values of the original model where the replacement retention is equal to 1.
3.9. Bioinformatics Analysis of Differential Metabolites
To pinpoint metabolites that substantially contributed to model interpretation, Variable Importance for the Projection (VIP) values were extracted from the OPLS-DA model. Metabolites with VIP scores exceeding 1 were regarded as making significant contributions to model interpretation. The metabolites showing significant differences were visually represented with bar graphs, as shown in Figure 9. Progoitrin, Glucoraphanin, and Leukotriene d4 showed a marked increase in the negative ion mode, while Sinapine, 1-piperidinecarboxylic acid, 1-lignoceroyl-2-hydroxy-sn-glycero-3-phosphocholine, 4-(6-(4-((methoxycarbonyl)amino] phenyl)-4- (4-morpholinyl)-1h-pyrazolo(3,4-d)pyrimidin-1-yl)-, and methyl ester were significantly upregulated in the positive ion mode. These markedly different metabolites were further analyzed using cluster analysis, correlation analysis, and pathway analysis.
Figure 9.
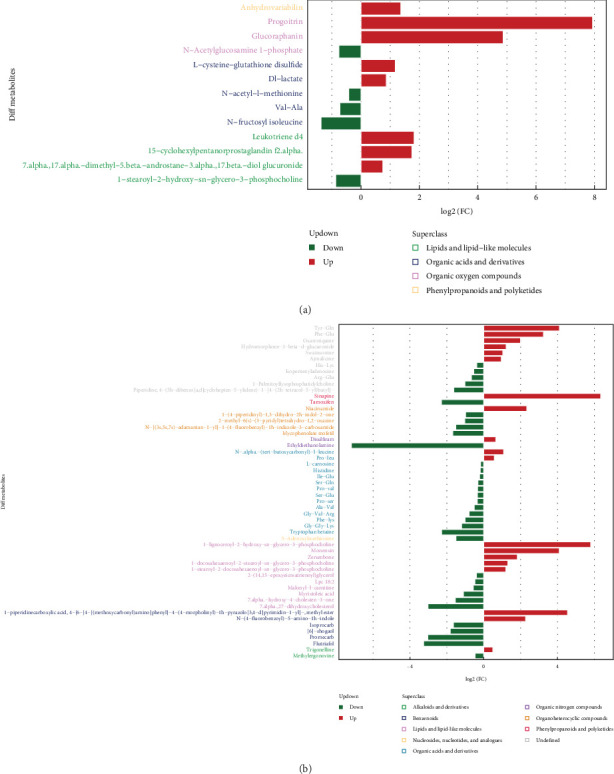
Significantly different metabolite expression differential ploidy analysis. (a and b) Negative/positive ion pattern significant differential metabolite expression differential multiplicity analysis. The horizontal coordinate of the graph indicates the log2FC value of the differential metabolite, which is the logarithmic value of the differential multiplier of the differential metabolite with a base of 2. The Y-axis of the plot represents significant differential metabolites. Upregulated metabolites are shown in red, and downregulated metabolites are shown in green.
3.9.1. Cluster Analysis
To deepen our comprehension of the associations among samples and the diversity in metabolite expression patterns across samples, we conducted a hierarchical cluster analysis utilizing distance matrix calculations. This approach facilitated the identification of clusters of metabolites with similar expression patterns, implying potential shared functions or involvement in common metabolic processes or cellular pathways. The analysis focused on metabolites showing statistical significance, characterized by VIP values > 1 and P-values < 0.05. The outcomes of the hierarchical cluster analysis are illustrated in Figure 10.
Figure 10.
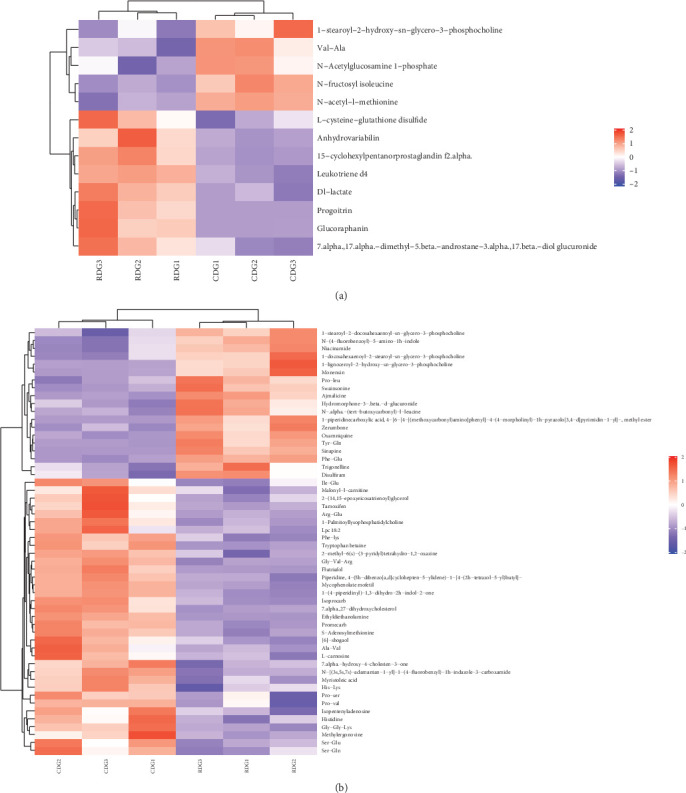
Heat map of hierarchical clustering for significantly different metabolites. (a and b) Negative/positive ion pattern significant difference metabolite hierarchical clustering heat map. The figure is a color-coded representation of differentially expressed metabolites (vertical axis) across a set of samples (horizontal axis). Red indicates upregulation, blue indicates downregulation and color intensity indicates the level of up or downregulation. Metabolites with similar expression patterns are clustered together on the left side of the figure.
3.9.2. Correlation Analysis
Correlation analysis serves as a valuable tool to explore the metabolic relationships among markedly different metabolites (VIP > 1, Pvalue < 0.05) and provides additional insights into how metabolites are interregulated during biological changes. To present the results of the correlation analysis more visually, we created correlation heat maps, as depicted in Figures 11(a) and 11(b). To enhance the understanding of coregulatory associations among different metabolites, the connection matrices were transformed into chord diagrams and network diagrams, as illustrated in Figure 11(c)–11(f).
Figure 11.
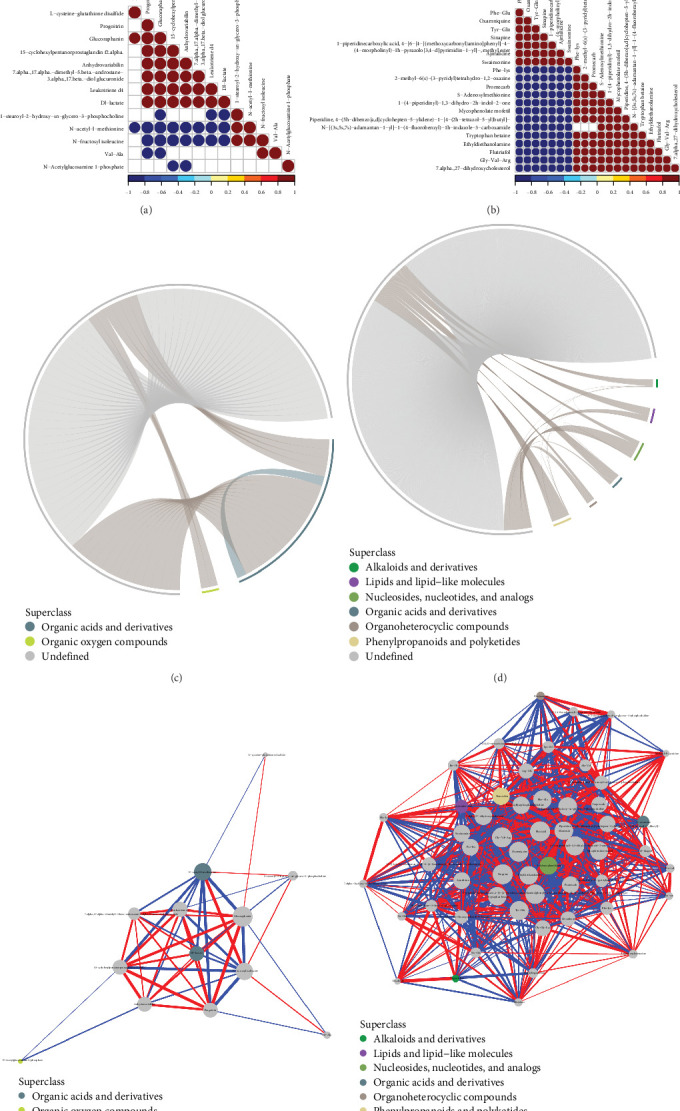
Correlation analysis. (a and b) The graph shows correlation coefficients between variables, where red indicates a positive correlation, blue indicates a negative correlation, and white indicates no correlation. The color shade indicates the strength of the correlation, whereas darker colors represent higher absolute values. The size of the dot indicates the significance of the correlation, where smaller P-values correspond to larger dots. (c and d) Each significantly different metabolite is represented by a starting point on the inner circle of the figure, and the outer circle shows the classification of these metabolites. colored arcs connecting the starting points indicate the correlation within each category of metabolites. The colors of the arcs match those of the corresponding subcategories. Gray arcs represent the correlations between metabolites of different categories. (e and f) The graph displays significantly different metabolites as dots, with their size indicating the degree of connectedness. The color of the line represents the correlation, with red indicating a positive correlation and blue indicating a negative correlation. The thickness of the line represents the strength of the correlation, with thicker lines representing larger correlation coefficients.
3.9.3. KEGG Pathway Analysis
The identified differential metabolites in the study underwent analysis using the KEGG database to explore the associated metabolic pathways. Heat maps were generated for KEGG metabolic pathways containing more than five differential metabolites, as illustrated in Figure 12 (a). Significant upregulation of Ajmalicine, Leukotriene d4, and Niacinamide metabolites were observed in the RDG group, while L-carnosine, Methylergonovine, and Histidine metabolites were markedly upregulated in the CDG group. Furthermore, metabolic pathways involving closely related species were used as a background for Fisher's Exact Test analysis to determine the significance level of metabolite enrichment for each pathway. The lower the P-value, the greater the significance of the variability of the metabolic pathway. The findings from the analysis (Figures 12(b) and 12(c)) revealed that the metabolic pathways were primarily enriched in beta-Alanine metabolism, Zeatin biosynthesis, Primary bile acid biosynthesis, Histidine metabolism, and Nicotinate and nicotinamide metabolism. Finally, the differential abundance scores were used to understand the trend of increasing/decreasing metabolites in a given pathway relative to the control samples. As shown in Figure 13 (a), one is increasing (>0.5 difference in abundance score, red) and four are decreasing (<−0.5, blue). The pathways that were elevated in the shrimp hepatopancreas involved the metabolism of nicotinic acid and nicotinamide, while most of the pathways that were decreased involved amino acid metabolism (Figure 13(a)). All the differential metabolic pathways were categorized by their upper-level Pathway_Hierarchy and then replotted as shown in Figure 13(b). The overall expression of metabolism of cofactors and vitamins pathways tended to be upregulated, while the metabolism of terpenoids and lipid metabolism, polyketides, metabolism of other amino acids, and amino acid metabolism pathways tended to be downregulated, as detailed in Table 4.
Figure 12.
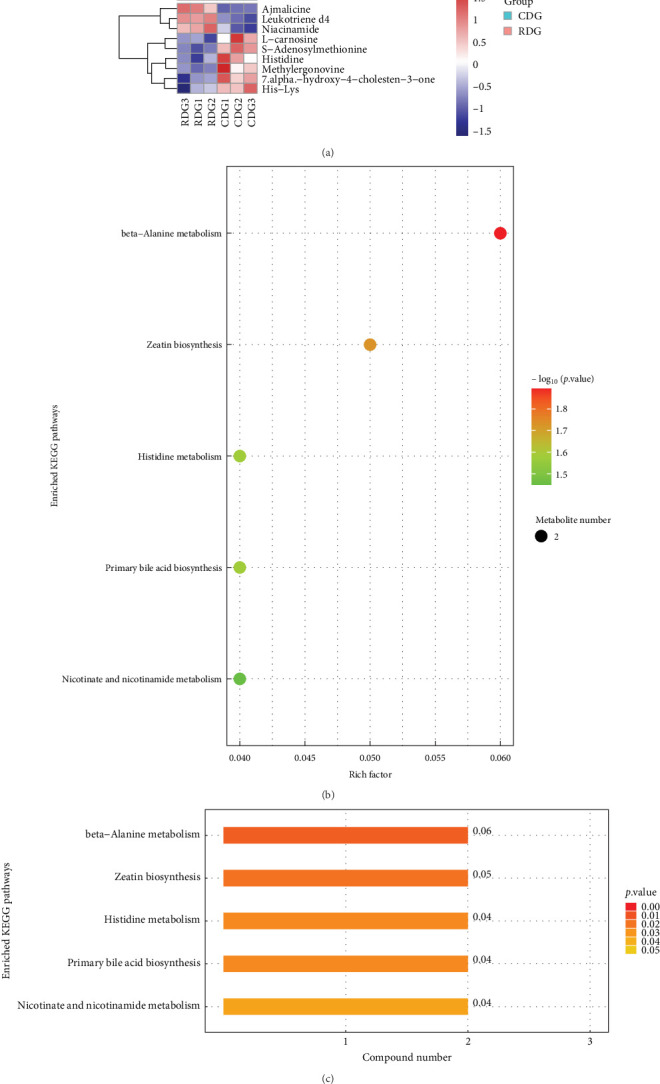
KEGG pathway analysis. (a) Heat map of differential metabolites for KEGG pathway clustering. Each row represents a differential metabolite with significant differential expression, while each column represents a sample set. The color scheme is as follows: red indicates upregulation, blue indicates downregulation and color shades indicate the degree of up and downregulation. The clustering of metabolites with similar expression patterns is represented on the left of the heatmap. (b) The bubble map shows KEGG pathways with significant enrichment. Each bubble represents a metabolic pathway, with size and horizontal position indicating the pathway's influence factor in topological analysis. The vertical position and color of the bubble represent the negative common logarithm of the P-value (i.e., −log10P-value), with darker colors indicating smaller P-values and more significant enrichment. (c) The bar graph shows the number of differentially expressed metabolites in each KEGG metabolic pathway, with each pathway represented on the vertical axis. The colour of the bars reflects the P-value of the enrichment analysis, with darker colours indicating more significant enrichment.
Figure 13.
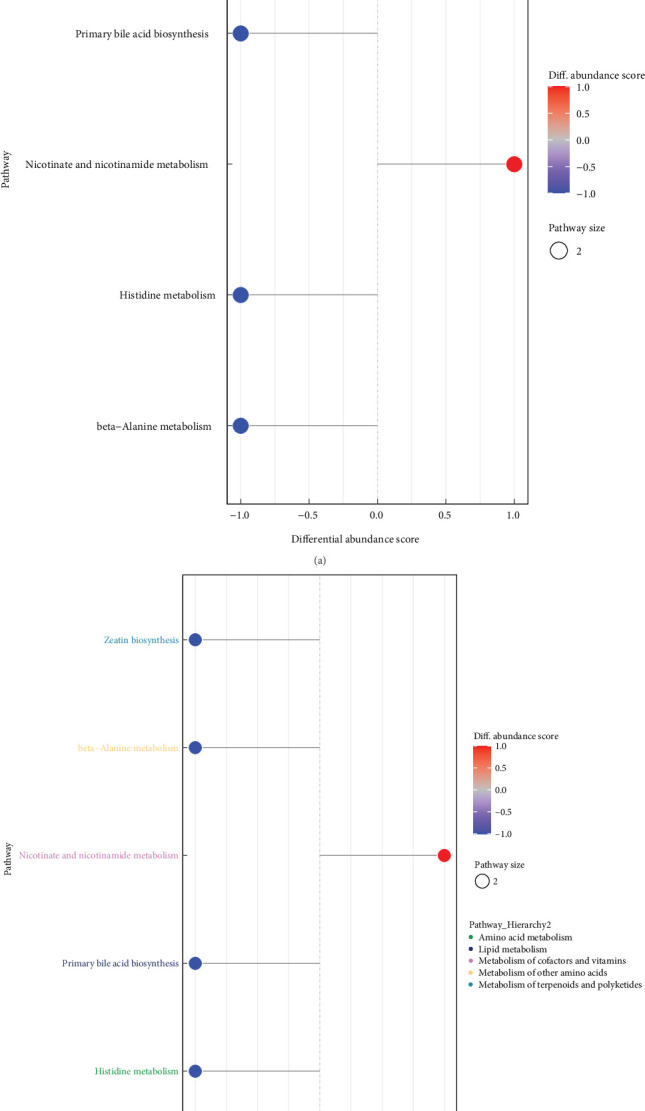
Differential abundance score analysis. (a and b) The plot shows the differential abundance scores of enriched metabolic pathways, categorized by pathway_Hierarchy. Each pathway is represented on the Y-axis, while the X-axis represents the differential abundance score (DA score), which reflects the total variation of all metabolites in the pathway. A score of 1 means all identified metabolites in the pathway are upregulated, while −1 means all metabolites are downregulated. The length of the line segment represents the absolute value of the DA score, and the dot size indicates the number of metabolites in the pathway. Darker red shades indicate upregulation of the pathway, while darker blue shades indicate downregulation.
Table 4.
KEGG metabolic pathway analysis.
| KEGG ID | Pathway | Name | Change |
|---|---|---|---|
| C16427 | Zeatin biosynthesis | Isopentenyladenosine | Down |
| C16427 | Biosynthesis of secondary metabolites | Isopentenyladenosine | Down |
| C10173 | Tropane, piperidine, and pyridine alkaloid biosynthesis | Swainsonine | Up |
| C09024 | Indole alkaloid biosynthesis | Ajmalicine | Up |
| C09024 | Metabolic pathways | Ajmalicine | Up |
| C09024 | Biosynthesis of secondary metabolites | Ajmalicine | Up |
| C07108 | Drug metabolism—cytochrome P450 | Tamoxifen | Down |
| C06341 | Primary bile acid biosynthesis | 7.alpha.,27-dihydroxycholesterol | Down |
| C05951 | Arachidonic acid metabolism | Leukotriene d4 | Up |
| C05951 | Metabolic pathways | Leukotriene d4 | Up |
| C05951 | Neuroactive ligand-receptor interaction | Leukotriene d4 | Up |
| C05951 | Fc epsilon RI signaling pathway | Leukotriene d4 | Up |
| C05455 | Primary bile acid biosynthesis | 7.alpha.-hydroxy-4-cholesten-3-one | Down |
| C05455 | Metabolic pathways | 7.alpha.-hydroxy-4-cholesten-3-one | Down |
| C04230 | Glycerophospholipid metabolism | 1-stearoyl-2-hydroxy-sn-glycero-3-phosphocholine | Down |
| C01004 | Nicotinate and nicotinamide metabolism | Trigonelline | Up |
| C00933 | Phenylpropanoid biosynthesis | Sinapine | Up |
| C00884 | Arginine and proline metabolism | Methylergonovine | Down |
| C00884 | Metabolic pathways | Methylergonovine | Down |
| C00387 | Purine metabolism | His-Lys | Down |
| C00387 | Metabolic pathways | His-Lys | Down |
| C00387 | ABC transporters | His-Lys | Down |
| C00386 | Histidine metabolism | L-carnosine | Down |
| C00386 | beta-Alanine metabolism | L-carnosine | Down |
| C00386 | Metabolic pathways | L-carnosine | Down |
| C00153 | Nicotinate and nicotinamide metabolism | Niacinamide | Up |
| C00153 | Metabolic pathways | Niacinamide | Up |
| C00153 | Longevity regulating pathway—worm | Niacinamide | Up |
| C00153 | Vitamin digestion and absorption | Niacinamide | Up |
| C00135 | Histidine metabolism | Histidine | Down |
| C00135 | Staurosporine biosynthesis | Histidine | Down |
| C00135 | beta-Alanine metabolism | Histidine | Down |
| C00135 | Aminoacyl-tRNA biosynthesis | Histidine | Down |
| C00135 | Metabolic pathways | Histidine | Down |
| C00135 | Biosynthesis of secondary metabolites | Histidine | Down |
| C00135 | Biosynthesis of amino acids | Histidine | Down |
| C00135 | ABC transporters | Histidine | Down |
| C00135 | Protein digestion and absorption | Histidine | Down |
| C00019 | Monobactam biosynthesis | S-Adenosylmethionine | Down |
| C00019 | Cysteine and methionine metabolism | S-Adenosylmethionine | Down |
| C00019 | Arginine and proline metabolism | S-Adenosylmethionine | Down |
| C00019 | Zeatin biosynthesis | S-Adenosylmethionine | Down |
| C00019 | Metabolic pathways | S-Adenosylmethionine | Down |
| C00019 | Biosynthesis of secondary metabolites | S-Adenosylmethionine | Down |
| C00019 | Biosynthesis of amino acids | S-Adenosylmethionine | Down |
| C00019 | Sulfur relay system | S-Adenosylmethionine | Down |
4. Discussion
Given its pivotal roles in both the digestive and immune systems of shrimp, the hepatopancreas serves as a dependable marker of crustacean well-being. It provides valuable information about the general well-being of the host [27, 28]. However, the hepatopancreas is susceptible to damage caused by pathogenic bacteria. For example, V. harveyi infection in P. vanname leads to abnormal arrangement of its hepatopancreas tubules and vacuolation of hepatocytes [29]. Infection with V. parahaemolyticus can cause hepatopancreas cell necrosis, abscission, and tissue degeneration in shrimp [30], ultimately resulting in AHPND and inhibiting the growth and health of shrimp. Historically, antibiotics have been commonly used to manage AHPND. However, emerging evidence suggests that probiotics can also be an effective approach to prevent and treat this disease [31, 32]. Nevertheless, the impact of probiotic Ep-M17 on shrimp hepatopancreas morphology remains unclear. Therefore, this study aimed to evaluate hepatopancreatic histology after both feeding and challenge trials to explore the impact of probiotic Ep-M17 on shrimp hepatopancreas. Contrasted with the control group, Ep-M17-fed shrimp exhibited a more intact hepatopancreatic basement membrane and a regular lumen structure of stellate ducts. Even after V. parahaemolyticus E1 infection, Ep-M17-fed shrimp maintained an intact hepatopancreatic basement membrane and well-preserved hepatic ducts, showing no signs of cell necrosis or severe cell damage. Therefore, feeding Ep-M17 could improve the morphology of the hepatopancreatic tissues and effectively reduce the damage caused by pathogenic bacteria to shrimp hepatopancreatic cells.
Increasing evidence demonstrates the advantageous impacts of probiotics on the growth performance, digestive enzyme activity, and disease resistance in aquatic animals. For instance, research has shown that dietary supplementation of Bacillus sp. enhanced feed conversion and growth performance in Barbonymus gonionotus [33]. An addition of B. coagulans and L. lactis was found could improve Procambarus clarkii's growth performance, modulate its gut microbiota and enhance disease resistance [34]. Clostridium butyricum contributed to the increase of digestive enzyme activity of P. vanname, the enhancement of antioxidant capacity and the improvement of intestinal flora [35]. In this investigation, we explored the impact of dietary Ep-M17 supplementation on the nutritional immune-related enzyme in the hepatopancreas of P. vannamei. Findings revealed that Ep-M17 supplementation increased the activities of SOD, AKP, CAT, AMS, TRY, and LIP. Antioxidant enzymes such as CAT and SOD have a pivotal role in preventing oxidative stress and maintaining homeostasis overall homeostasis, effectively alleviating oxidative damage, deoxyribonucleic acid (DNA) and cellular damage, and even tissue damage and impaired cellular function caused by excessive production of reactive oxygen species (ROS) [36]. AKP, on the other hand, is a nonspecific phosphate hydrolase that regulates the immune system and contributes to defense by inducing stress [37]. Therefore, Ep-M17 shows potential in effectively preventing oxidative stress in the hepatopancreas and modulating the body's immune system.
The addition of probiotics to shrimp feed has been found to influence gene transcription in the intestine [38] and immune and metabolic genes in the hepatopancreas tissue [39], thus activating the immune response in the hepatopancreas and intestinal tract of shrimp, ultimately improving their disease resistance. The transcriptome analysis performed in this study identified a noteworthy enrichment of differentially expressed genes associated with immune response, heat shock protein, MAPK signaling pathway, and oxidoreductase activity in response to Ep-M17. Heat shock proteins (Hsps) are commonly recognized as danger signal biomarkers that stimulate the immune system to respond to unfavourable conditions. In addition, Hsps influence both pro- and anti-inflammatory responses and exerts unique effects on immune cells [40]. Oxidative changes are known to regulate various aspects of the immune response, especially the inflammatory pathway [41, 42]. For instance, Alkylglycerol monooxygenase (AGMO) can regulate the production of macrophage platelet-activating factor (PAF) by modulating cytolytic-PAF levels [43]. The enriched expression of these genes demonstrated that Ep-M17 can significantly upregulate the immune genes in P. vanname hepatopancreas, facilitating an anti-inflammatory response in cells and effectively regulating the immune response, thereby improving the shrimp's immune capacity. Moreover, KEGG annotation and enrichment analysis revealed that Ep-M17 primarily affects antigen processing and presentation, MAPK signaling pathway, PI3K-Akt signaling pathway, and necrotic apoptotic cell death pathways. Antigen processing and presentation are critical for adaptive immunity [44] and the activation of T cells [45], which play essential roles in defending against pathogens [46]. The MAPK pathway is also important for host defense against pathogens [47]. Specifically, p38 MAPK signaling is required for the transcriptional activation of NF-κB [48], which triggers the production of inflammatory cytokines and initiates innate immune responses [49]. The enrichment of differential genes in these pathways suggests that Ep-M17 can regulate adaptive immunity in shrimp hepatopancreas through the antigen processing and presentation pathways. Furthermore, it can influence MAPK signaling pathways associated with the initiation of innate immunity and the secretion of inflammatory cytokines, thereby affecting the host's immune response.
Probiotics have been shown to modulate the host's immune system, reduce inflammation, and improve various aspects of the body's metabolism, growth, fatty acid profile, and oxidative stability [50]. In this study, the metabolomic analysis revealed that shrimp fed Ep-M17 had significantly higher levels of associated hepatopancreas metabolites involved in the metabolic pathways of beta-alanine metabolism, Zeatin biosynthesis, Histidine metabolism, Nicotinate and nicotinamide metabolism, and Primary bile acid biosynthesis. β-alanine is known to activate the NF-κB signaling pathway, which contributes to the inflammatory response, and it specifically activates G protein-coupled receptors (MrgprD) in the organism, thereby regulating inflammation triggered by bacterial infections [51]. Histidine decarboxylase is responsible for the production of histamine, which can activate various histamine receptors on target cells and modulate a range of physiological and immunological processes. Histamine has been observed to induce platelet aggregation and modulate Th2 cell activity by reducing IL-12 levels while increasing IL-10 production [52]. The upregulation of these metabolic pathways suggests that Ep-M17 can facilitate the production of β-alanine, activate the NF-κB signaling pathway, and thereby regulate inflammation. In addition, Ep-M17 may influence other key immune metabolites, ultimately enhancing the body's anti-inflammatory and antimicrobial capacity, which in turn promotes shrimp growth.
5. Conclusion
The principal purpose of this study was to explore the protective mechanism of L. plantarum Ep-M17 on the hepatopancreas of P. vannamei. The results demonstrated that supplementing P. vannamei's diet with L. plantarum Ep-M17 effectively improves the stability of the hepatopancreatic tissue. Furthermore, Ep-M17 elevates the activity of metabolism and immune-related enzymes in the hepatopancreas, while also significantly upregulating genes associated with immune response, antigen processing and presentation, and the MAPK signaling pathway. In addition, Ep-M17 promotes the activity of metabolites in the P. vannamei hepatopancreas that are known for their anti-inflammatory and cellular damage-preventive effects, particularly within the pathways of β-alanine metabolism and histidine metabolism. These findings highlight the promising potential of Ep-M17 as a probiotic agent for the prevention and management of aquatic diseases.
Acknowledgments
This research received funding from the National Natural Science Foundation of China under Grant Number 42376104, the Ningbo Citizen Natural Science Foundation of China under Grant Number 2023J105, the Zhejiang Provincial Natural Science Foundation of China under Grant Number LY23D060002, and Technological Grant of Zhejiang for Breeding New Agricultural Varieties under Grant Number 2021C02069-5.
Contributor Information
Yang Du, Email: duyang@nbu.edu.cn.
Jiong Chen, Email: chenjiong@nbu.edu.cn.
Data Availability
Data will be made available on request.
Conflicts of Interest
The authors announce that the research was performed in the lack of any commercial or financial relationships that could be interpreted as a potential conflicts of interest.
Authors' Contributions
Xiaoman Hu: Experimental data analysis and manuscript writing. Wenlong Xu: Shrimp farming and sample collection. Hao Li and Bowen Lu: Bacterial culture, sample processing, and tissue section preparation. Yang Du: Experimental design and manuscript revision. Jiong Chen: Experimental design and manuscript revision.
References
- 1.Ren X., Han Y., Zeng F., et al. Effects of dietary heat-killed Lactobacillus plantarum and compound probiotics on the growth performance, antioxidative capacity, intestinal morphology and microbiota of Pacific white shrimp Litopenaeus vannamei. Aquaculture Research . 2022;53(9):3516–3530. doi: 10.1111/are.15857. [DOI] [Google Scholar]
- 2.Fang H., Liu X., Shao X., et al. Molecular and functional characterization of Raptor in mTOR pathway from Litopenaeus vannamei. Aquaculture Research . 2020;51(6):2179–2189. doi: 10.1111/are.14522. [DOI] [Google Scholar]
- 3.Thornber K., Verner-Jeffreys D., Hinchliffe S., Rahman M. M., Bass D., Tyler C. R. Evaluating antimicrobial resistance in the global shrimp industry. Reviews in Aquaculture . 2020;12(2):966–986. doi: 10.1111/raq.12367. [DOI] [PMC free article] [PubMed] [Google Scholar]
- 4.Kumar R., Ng T. H., Wang H. C. Acute hepatopancreatic necrosis disease in penaeid shrimp. Reviews in Aquaculture . 2020;12(3):1867–1880. [Google Scholar]
- 5.Liang X., Zhou L., Yan S., Wang Y. Complete genome sequence analysis of the Vibrio owensii strain SH-14 isolated from shrimp with acute hepatopancreatic necrosis disease. Archives of Microbiology . 2020;202:1097–1106. doi: 10.1007/s00203-020-01824-z. [DOI] [PubMed] [Google Scholar]
- 6.Han S. Y., Wang L., Wang Y. L., et al. Effects of the glutathione administration via dietary on intestinal microbiota of white shrimp, Penaeus vannamei, under cyclic hypoxia conditions. Invertebrate Survival Journal . 2020:36–50. [Google Scholar]
- 7.Zhou Y., Qiu T. X., Hu Y., Liu L., Chen J. Antiviral effects of natural small molecules on aquatic rhabdovirus by interfering with early viral replication. Zoological Research . 2022;43:966–976. doi: 10.24272/j.issn.2095-8137.2022.234. [DOI] [PMC free article] [PubMed] [Google Scholar]
- 8.Wang H., Qiu T.-X., Lu J.-F., et al. Potential aquatic environmental risks of trifloxystrobin: enhancement of virus susceptibility in zebrafish through initiation of autophagy. Zoological Research . 2021;42(3):339–349. doi: 10.24272/j.issn.2095-8137.2021.056. [DOI] [PMC free article] [PubMed] [Google Scholar]
- 9.Wang P., Chen S., Wei C., et al. Monascus purpureus M-32 improves growth performance, immune response, intestinal morphology, microbiota and disease resistance in Litopenaeus vannamei. Aquaculture . 2021;530735947 [Google Scholar]
- 10.Wang A., Ran C., Wang Y., et al. Use of probiotics in aquaculture of China—a review of the past decade. Fish & Shellfish Immunology . 2019;86:734–755. doi: 10.1016/j.fsi.2018.12.026. [DOI] [PubMed] [Google Scholar]
- 11.Wu X.-Y., Xiong J.-B., Fei C.-J., et al. Prior exposure to ciprofloxacin disrupts intestinal homeostasis and predisposes ayu (Plecoglossus altivelis) to subsequent Pseudomonas plecoglossicida-induced infection. Zoological Research . 2022;43(4):648–665. doi: 10.24272/j.issn.2095-8137.2022.159. [DOI] [PMC free article] [PubMed] [Google Scholar]
- 12.Ghosh C., Sarkar P., Issa R., Haldar J. Alternatives to conventional antibiotics in the era of antimicrobial resistance. Trends in Microbiology . 2019;27(4):323–338. doi: 10.1016/j.tim.2018.12.010. [DOI] [PubMed] [Google Scholar]
- 13.Martín R., Langella P. Emerging health concepts in the probiotics field: streamlining the definitions. Frontiers in microbiology . 2019;10 doi: 10.3389/fmicb.2019.01047.1047 [DOI] [PMC free article] [PubMed] [Google Scholar]
- 14.Zhang Y., Ji T., Jiang Y., Zheng C., Yang H., Liu Q. Long-term effects of three compound probiotics on water quality, growth performances, microbiota distributions and resistance to Aeromonas veronii in crucian carp Carassius auratus gibelio. Fish & Shellfish Immunology . 2022;120:233–241. doi: 10.1016/j.fsi.2021.11.036. [DOI] [PubMed] [Google Scholar]
- 15.Abidin Z., Huang H.-T., Hu Y.-F., et al. Effect of dietary supplementation with Moringa oleifera leaf extract and Lactobacillus acidophilus on growth performance, intestinal microbiota, immune response, and disease resistance in whiteleg shrimp (Penaeus vannamei) Fish & shellfish immunology . 2022;127:876–890. doi: 10.1016/j.fsi.2022.07.007. [DOI] [PubMed] [Google Scholar]
- 16.Hang B. T., Balami S., Phuong N. T. Effect of Lactobacillus plantarum on growth performance, immune responses, and disease resistance of striped catfish (Pangasianodon hypophthalmus) Aquaculture, Aquarium, Conservation & Legislation . 2022;15(1):174–187. [Google Scholar]
- 17.Saboktakin-Rizi M., Behbahani B. A., Hojjati M., Noshad M. Identification of Lactobacillus plantarum TW29-1 isolated from Iranian fermented cereal-dairy product (Yellow Zabol Kashk): probiotic characteristics, antimicrobial activity and safety evaluation. Journal of Food Measurement and Characterization . 2021;15(3):2615–2624. [Google Scholar]
- 18.Falah F., Vasiee A., Behbahani B. A., et al. Evaluation of adherence and anti-infective properties of probiotic Lactobacillus fermentum strain 4-17 against Escherichia coli causing urinary tract infection in humans. Microbial pathogenesis . 2019;131:246–253. doi: 10.1016/j.micpath.2019.04.006. [DOI] [PubMed] [Google Scholar]
- 19.Alishahi M., Dezfuly Z. T., Mesbah M., Mohammadian T. Effects of two probiotics, Lactobacillus plantarum and Lactobacillus bulgaricus on growth performance and intestinal lactic acid bacteria of Cyprinus caprio. Iranian Journal of Veterinary . 2018;12(3):207–218. [Google Scholar]
- 20.Zheng C. N., Wang W. Effects of Lactobacillus pentosus on the growth performance, digestive enzyme and disease resistance of white shrimp Litopenaeus vannamei (Boone, 1931) Aquaculture Research . 2017;48(6):2767–2777. doi: 10.1111/are.13110. [DOI] [Google Scholar]
- 21.Dash G., Raman R. P., Prasad K. P., Makesh M., Pradeep M. A., Sen S. Evaluation of Lactobacillus plantarum as feed supplement on host associated microflora, growth, feed efficiency, carcass biochemical composition and immune response of giant freshwater prawn, Macrobrachium rosenbergii (de Man 1879) Aquaculture . 2014;432:225–236. [Google Scholar]
- 22.Giri S. S., Sukumaran V., Oviya M. Potential probiotic Lactobacillus plantarum VSG3 improves the growth, immunity, and disease resistance of tropical freshwater fish, Labeo rohita. Fish & Shellfish Immunology . 2013;34(2):660–666. doi: 10.1016/j.fsi.2012.12.008. [DOI] [PubMed] [Google Scholar]
- 23.Phiwsaiya K., Charoensapsri W., Taengphu S., et al. A natural Vibrio parahaemolyticus ΔpirAVppirBVp+ mutant kills shrimp but produces neither PirVp toxins nor acute hepatopancreatic necrosis disease lesions. Applied and Environmental Microbiology . 2017;83(16):e680–e697. doi: 10.1128/AEM.00680-17. [DOI] [PMC free article] [PubMed] [Google Scholar]
- 24.Rőszer T. The invertebrate midintestinal gland (“hepatopancreas”) is an evolutionary forerunner in the integration of immunity and metabolism. Cell and Tissue Research . 2014;358:685–695. doi: 10.1007/s00441-014-1985-7. [DOI] [PubMed] [Google Scholar]
- 25.Du Y., Xu W., Wu T., Li H., Hu X., Chen J. Enhancement of growth, survival, immunity and disease resistance in Litopenaeus vannamei, by the probiotic, Lactobacillus plantarum Ep-M17. Fish & Shellfish Immunology . 2022;129:36–51. doi: 10.1016/j.fsi.2022.08.066. [DOI] [PubMed] [Google Scholar]
- 26.Honda M., Kamizono S., Illijas M. I., Nakamura T. Effect of feeding astaxanthin with different E/Z-isomer ratios on astaxanthin accumulation in Pacific white shrimp Litopenaeus vannamei. European Journal of Lipid Science and Technology . 2023;125(12) doi: 10.1002/ejlt.202300173.2300173 [DOI] [Google Scholar]
- 27.Zhao W., Wang L., Liu M., et al. Transcriptome, antioxidant enzyme activity and histopathology analysis of hepatopancreas from the white shrimp Litopenaeus vannamei fed with aflatoxin B1 (AFB1) Developmental & Comparative Immunology . 2017;74:69–81. doi: 10.1016/j.dci.2017.03.031. [DOI] [PubMed] [Google Scholar]
- 28.Deng Y., Wang Y., Zhang X., et al. Effects of T-2 toxin on Pacific white shrimp Litopenaeus vannamei: growth, and antioxidant defenses and capacity and histopathology in the hepatopancreas. Journal of Aquatic Animal Health . 2017;29(1):15–25. doi: 10.1080/08997659.2016.1249577. [DOI] [PubMed] [Google Scholar]
- 29.Yuan Y., Guan H., Huang Y., et al. Involvement of Nrf2 in the immune regulation of Litopenaeus vannamei against Vibrio harveyi infection. Fish & Shellfish Immunology . 2023 doi: 10.1016/j.fsi.2023.108547.108547 [DOI] [PubMed] [Google Scholar]
- 30.Yin X., Zhuang X., Liao M., et al. Transcriptome analysis of Pacific white shrimp (Litopenaeus vannamei) hepatopancreas challenged by Vibrio alginolyticus reveals lipid metabolic disturbance. Fish & Shellfish Immunology . 2022;123:238–247. doi: 10.1016/j.fsi.2022.03.004. [DOI] [PubMed] [Google Scholar]
- 31.Restrepo L., Domínguez-Borbor C., Bajaña L., et al. Microbial community characterization of shrimp survivors to AHPND challenge test treated with an effective shrimp probiotic (Vibrio diabolicus) Microbiome . 2021;9:1–20. doi: 10.1186/s40168-021-01043-8. [DOI] [PMC free article] [PubMed] [Google Scholar]
- 32.Chumpol S., Kantachote D., Nitoda T., Kanzaki H. The roles of probiotic purple nonsulfur bacteria to control water quality and prevent acute hepatopancreatic necrosis disease (AHPND) for enhancement growth with higher survival in white shrimp (Litopenaeus vannamei) during cultivation. Aquaculture . 2017;473:327–336. [Google Scholar]
- 33.Neepa N. N., Mrong C. E., Kole K., et al. Improvement of growth and hematological profile of juvenile silver barb (Barbonymus gonionotus) through dietary probiotic (Bacillus sp.) supplementation. Journal of Survey in Fisheries Sciences . 2023:11–25. [Google Scholar]
- 34.Zhu L., Kong Y., Chang X., et al. Effects of two fish-derived probiotics on growth performance, innate immune response, intestinal health, and disease resistance of Procambarus clarkii. Aquaculture . 2023;562738765 [Google Scholar]
- 35.Li L., Liu H., Li W., et al. Clostridium butyricum improves the digestive enzyme activity, antioxidant and immunity related genes expression and intestinal microbiota of Litopenaeus vannamei fed a replacing fishmeal with cottonseed protein concentrate (CPC) diet. Aquaculture Reports . 2023;29101517 [Google Scholar]
- 36.Yu K., Shi C., Ye Y., et al. The effects of overwintering temperature on the survival of female adult mud crab, Scylla paramamosain, under recirculating aquaculture systems as examined by histological analysis of the hepatopancreas and expression of apoptosis-related genes. Aquaculture . 2023;565739080 [Google Scholar]
- 37.Zhang H., Jiang N., Zhang Y., Zhang Y., Ni Q., Fan Y. Effects of tank diameter and water depth on growth performance, antioxidant capacity and immune response of Chinese sturgeon Acipenser sinensis in recirculating aquaculture system. Journal of Applied Ichthyology . 2022;38(1):84–92. doi: 10.1111/jai.14285. [DOI] [Google Scholar]
- 38.Du Y., Fang H., Shao X., et al. Exploration of the influence of surface proteins on the probiotic activity of Lactobacillus pentosus HC-2 in the Litopenaeus vannamei midgut via label-free quantitative proteomic analysis. Fish & Shellfish Immunology . 2019;95:368–382. doi: 10.1016/j.fsi.2019.10.059. [DOI] [PubMed] [Google Scholar]
- 39.Fajardo C., Martinez-Rodriguez G., Costas B., et al. Shrimp immune response: a transcriptomic perspective. Reviews in Aquaculture . 2022;14(3):1136–1149. [Google Scholar]
- 40.Zininga T., Ramatsui L., Shonhai A. Heat shock proteins as immunomodulants. Molecules . 2018;23(11) doi: 10.3390/molecules23112846.2846 [DOI] [PMC free article] [PubMed] [Google Scholar]
- 41.Pan J., Fei C.-J., Hu Y., Wu X.-Y., Nie L., Chen J. Current understanding of the cGAS-STING signaling pathway: structure, regulatory mechanisms, and related diseases. Zoological Research . 2023;44(1):183–218. doi: 10.24272/j.issn.2095-8137.2022.464. [DOI] [PMC free article] [PubMed] [Google Scholar]
- 42.Mullen L., Mengozzi M., Hanschmann E. M., Alberts B., Ghezzi P. How the redox state regulates immunity. Free Radical Biology and Medicine . 2020;157:3–14. doi: 10.1016/j.freeradbiomed.2019.12.022. [DOI] [PubMed] [Google Scholar]
- 43.Tokuoka S. M., Kita Y., Shindou H., Shimizu T. Alkylglycerol monooxygenase as a potential modulator for PAF synthesis in macrophages. Biochemical and Biophysical Research Communications . 2013;436(2):306–312. doi: 10.1016/j.bbrc.2013.05.099. [DOI] [PubMed] [Google Scholar]
- 44.Pishesha N., Harmand T. J., Ploegh H. L. A guide to antigen processing and presentation. Nature Reviews Immunology . 2022;22(12):751–764. doi: 10.1038/s41577-022-00707-2. [DOI] [PubMed] [Google Scholar]
- 45.Jensen P. E. Recent advances in antigen processing and presentation. Nature Immunology . 2007;8(10):1041–1048. doi: 10.1038/ni1516. [DOI] [PubMed] [Google Scholar]
- 46.Trowitzsch S., Tampé R. Multifunctional chaperone and quality control complexes in adaptive immunity. Annual Review of Biophysics . 2020;49:135–161. doi: 10.1146/annurev-biophys-121219-081643. [DOI] [PubMed] [Google Scholar]
- 47.He Y., Yao W., Liu P., Li J., Wang Q. Expression profiles of the p38 MAPK signaling pathway from Chinese shrimp Fenneropenaeus chinensis in response to viral and bacterial infections. Gene . 2018;642:381–388. doi: 10.1016/j.gene.2017.11.050. [DOI] [PubMed] [Google Scholar]
- 48.Ji G., Liu D., Liu J., Gao H., Yuan X., Shen G. p38 mitogen-activated protein kinase up-regulates NF-κB transcriptional activation through RelA phosphorylation during stretch-induced myogenesis. Biochemical and Biophysical Research . 2010;391(1):547–551. doi: 10.1016/j.bbrc.2009.11.095. [DOI] [PubMed] [Google Scholar]
- 49.Dong C., Davis R. J., Flavell R. A. MAP kinases in the immune response. Annual Review of Immunology . 2002;20(1):55–72. doi: 10.1146/annurev.immunol.20.091301.131133. [DOI] [PubMed] [Google Scholar]
- 50.Yadav S., Jha R. Strategies to modulate the intestinal microbiota and their effects on nutrient utilization, performance, and health of poultry. Journal of Animal Science and Biotechnology . 2019;10(1):1–11. doi: 10.1186/s40104-018-0310-9. [DOI] [PMC free article] [PubMed] [Google Scholar]
- 51.Chen L., Zhong Y., Ouyang X., et al. Effects of β-alanine on intestinal development and immune performance of weaned piglets. Animal Nutrition . 2023;12:398–408. doi: 10.1016/j.aninu.2022.10.008. [DOI] [PMC free article] [PubMed] [Google Scholar]
- 52.Tantawy A. A., Naguib D. M. Arginine, histidine and tryptophan: a new hope for cancer immunotherapy. PharmaNutrition . 2019;8100149 [Google Scholar]
Associated Data
This section collects any data citations, data availability statements, or supplementary materials included in this article.
Data Availability Statement
Data will be made available on request.


