

Abstract
Agents that target PD‐1 and PD‐L1 have been developed in the treatment of bladder cancer (BC). However, the diversity of immune cell infiltration in non‐muscle‐invasive BC (NMIBC) and the dynamics of the microenvironment as it progresses to muscle‐invasive/metastatic disease remains unknown. To assess tumor immune activity, hierarchical clustering was applied to 159 BC samples based on cellular positivity for the defined immune cellular markers (CD3/CD4/CD8/FOXP3/CD20/PD‐1/PD‐L1/LAG3/TIGIT), divided into two clusters. There was a “hot cluster” (25%) consisting of patients with a high expression of these markers and a “cold cluster” (75%) comprising those without. The expression of CD39, CD44, CD68, CD163, IDO1, and Ki67 was significantly higher in tumors in the hot cluster. Immunologically, high‐grade T1 tumors were significantly hotter, whereas tumors that had progressed to muscle invasion turned cold. However, a certain number of high‐grade NMIBC patients were in the cold cluster, and these patients had a significantly higher risk of disease progression. Using an externally available TCGA dataset, RB1 and TP53 alterations were more frequently observed in TCGA hot cluster; rather FGFR3, KDM6A, and KMT2A alterations were common in TCGA cold/intermediate cluster. Analyses of recurrent tumors after BCG therapy revealed that tumor immune activity was widely maintained before and after treatment, and high FGFR3 expression was detected after recurrence in tumors initially classified into the cold cluster. Collectively, we revealed the dynamics of the tumor microenvironment in BC as a whole and identified candidate molecules as therapeutic targets for recurrent NMIBC, e.g., after BCG therapy.
Keywords: bladder cancer, FGFR3, microenvironment, PD‐1, PD‐L1
We identified the dynamics of the tumor microenvironment in bladder cancer as a whole and identified candidate molecules as therapeutic targets for recurrent non‐muscle‐invasive bladder cancer, e.g., after BCG therapy. We further indicated the potential of FGFR inhibitors as a useful modality to improve the immunologically cold environment and prevent stage progression in patients with non‐muscle‐invasive bladder cancer.
1. INTRODUCTION
Non‐muscle‐invasive bladder cancer (NMIBC) is defined as cancer confined to the bladder mucosa and submucosa without invasion of the muscle layer 1 , 2 and accounts for the majority of BC cases. 1 Patients with NMIBC generally undergo transurethral tumor resection of bladder tumor (TURBT) and subsequently receive intravesical therapy. 2 However, the risk of recurrence within the bladder or progression of the disease to muscle layer‐invasive bladder cancer (MIBC) varies depending on the grade and depth of invasion of the tumor; non‐invasive papillary tumors (pathological Ta: pTa), flat tumors referred to as carcinoma in situ (pTis), and tumors invading subepithelial connective tissue (pT1). 2
High‐grade pT1 tumors have a very high risk of recurrence, with more than 20% of patients experiencing stage progression. 3 , 4 These high‐risk cases undergo TURBT followed by BCG therapy, but often become refractory to any conservative treatment. 2 , 3 , 4 , 5 The prognosis of patients with NMIBC once they progress to MIBC is very poor, 6 and early cystectomy is recommended for patients who are BCG refractory, with surgical invasiveness and the reduced quality of life associated with urinary tract changes and sexual dysfunction being inevitable. 2 , 7 , 8
In recent years, the relationship between the immune environment of tumors and the prognosis of patients has become increasingly clear. While several immune cells exhibit anticancer activity in many solid tumors, molecules that suppress their function have been identified, e.g., the immune checkpoint molecules PD‐1 and PD‐L1, and have attracted attention as therapeutic targets. 9 , 10 Notably, agents that target PD‐1 and PD‐L1 have been developed and are used widely in the treatment of BC. 11 , 12 , 13 However, most of these studies and clinical trials have focused on MIBC and metastatic BC. Although relationships between PD‐1 expression and intravesical recurrence 14 and the efficacy of pembrolizumab in high‐risk NMIBC 15 have been suggested, the full extent of the tumor immune environment in NMIBC has yet to be elucidated in detail. Furthermore, NMIBC may be subdivided by tumor grades and stages; however, the diversity of immune cell infiltration in NMIBC and the dynamics of the microenvironment as the disease progresses to MIBC remain unknown.
Therefore, the present study attempted to comprehensively evaluate the tumor immune environment of BC and visualize immune cell infiltrates at each tumor stage in order to clarify the dynamics of the tumor microenvironment in BC as a whole. We also focused on the immune environment of NMIBC, for which medical evidence is limited, particularly the efficacy and prognosis of BCG therapy, and aimed to identify new therapeutic targets for recurrent NMIBC after BCG therapy, which has become an unmet medical need in clinical practice.
2. MATERIALS AND METHODS
2.1. Human tumor samples
After approval by the Institutional Review Board, formalin‐fixed and paraffin‐embedded (FFPE) UC tumor samples were collected randomly at Keio University Hospital (Tokyo, Japan) based on the pathological T stage and treatments. In total, 159 tumor samples were treated surgically. No samples had metastases. Also, no sample had a history of neoadjuvant intravenous or intravesical chemotherapy prior to tissue sampling. 2 Basically, BC tumors were resected along with adequate muscle layers. Patients with high‐grade tumors were treated with BCG therapy postoperatively, except for those who had undergone cystectomy. Furthermore, patients with T1 tumors underwent a second TURBT to achieve complete resection prior to BCG therapy. All recurrent samples in the bladder were subjected to cystoscopy and TURBT. When direct progression to the muscle layer was pathologically confirmed, disease progression was diagnosed. Indeed, among progressed cases, only two were diagnosed without cystoscopy or TURBT because imaging studies showed distant metastases.
Tissue microarrays (TMAs) were created by a well experienced board‐certified pathologist (S.M.) who specialized in genitourinary malignancies and evaluated the suitability of tissue sections for TMA construction. The International Union for Cancer Control tumor–node–metastasis system was used for tumor staging, and nuclear grading was performed according to the World Health Organization/International Society of Urological Pathology grading system. No statistical methods were used to predetermine the sample size. To avoid researcher bias during tissue preparation and data analysis, all samples were numbered for identification. All procedures were performed in accordance with the 1964 Declaration of Helsinki and current ethical standards, and informed consent was obtained from patients for the experimental use of their samples in accordance with hospital ethical guidelines. Additionally, we analyzed RNA‐sequencing, genome, and clinical data from The Cancer Genome Atlas (TCGA) database to validate our results. 16 , 17 Data were downloaded from cBioPortal. 18
2.2. Immunohistochemical staining and automated single‐cell counting
All TMA sections were stained as follows. FFPE samples were cut into 4‐ to 5‐μm‐thick sections and placed onto silane‐coated glass slides. After deparaffinization, sections were processed for antigen retrieval. After blocking, sections were incubated overnight with primary antibodies (Table S1), followed by secondary antibodies conjugated to a peroxidase‐labeled dextran polymer. Immunohistochemical staining was visualized using 3,3′‐diaminobenzidine in 50 mM Tris–HCl (pH 5.5) containing 0.005% hydrogen peroxidase. Sections treated with 3,3′‐diaminobenzidine were then counterstained with hematoxylin. All stained TMA sections were scanned and visualized using a high‐resolution digital slide scanner (NanoZoomer‐XR C12000; Hamamatsu Photonics, Hamamatsu, Shizuoka, Japan). Immunohistochemical signals and nuclei in tumor cores were segmented separately with a computerized image analysis system (StrataQuest software, Tissuegnostics, Vienna, Austria). Cells with overlapping segmented immune signals and nuclei were counted automatically and normalized as positive cell numbers to the total cell number from the same sample region.
2.3. Statistical analysis
Categorical variables between groups were compared using the two‐sided Fisher's test. Contiguous variables between groups were compared using the Student's t‐test, the Mann–Whitney U test, the Kruskal–Wallis test, and the Dunn–Bonferroni test, when appropriate. Spearman's coefficients were used to identify and evaluate the strength of relationships between two sets of data. Hierarchical clustering was performed using Ward's linkage methods. The starting point of the present study was the time of definitive surgical treatment, while the end point was the time of bladder recurrence after TURBT, disease progression, and cancer‐specific mortality. Survival curves were estimated using the Kaplan–Meier method and compared with the Log‐rank test. Significance was indicated when p‐values were < 0.05. All analyses were performed using R statistical language version 3.0.2 (R Foundation for Statistical Computing, Vienna, Austria) and JMP version 17.0 (SAS Institute Inc., Cary, NC, USA).
3. RESULTS
3.1. Automated single‐cell counting and clustering according to immune activity
In Table 1, the median age of patients was 73 years, and the majority of our cohort was male (82%). In total, 21% of patients had MIBC lesions, while 42, 15, and 22% of patients had non‐invasive papillary tumors (pTa), carcinoma in situ (pTis), and stromal invasive tumors (pT1), respectively. In addition, 73% of the cohort had high‐grade tumors. Treatment details were as follows: all patients with MIBC underwent total cystectomy. In contrast, 60% of patients with NMIBC underwent TURBT followed by BCG therapy, and 5% of patients received the intravesical instillation of chemotherapeutic agents. In total, 26% of patients with NMIBC underwent TURBT alone, all of whom had low‐grade pTa tumors. Total cystectomy was performed on 8% of patients with NMIBC because they were considered to have a very high risk of progression to MIBC.
TABLE 1.
Clinicopathological characteristics associated with tumor immune activity.
| Variables | All | Immune activity | p‐value | |
|---|---|---|---|---|
| Cold cluster | Hot cluster | |||
| No. of patients | 159 | 119 | 40 | |
| Sex, n (%) | ||||
| Female | 29 (18%) | 17 (14%) | 12 (30%) | 0.034 |
| Male | 130 (82%) | 102 (86%) | 28 (70%) | |
| Age (years), n (%) | ||||
| <74 | 80 (50%) | 65 (55%) | 15 (38%) | 0.069 |
| ≥74 | 79 (50%) | 54 (45%) | 25 (63%) | |
| Pathologic T stage, n (%) | ||||
| pTa | 67 (42%) | 58 (49%) | 9 (23%) | 0.010 |
| pTis | 24 (15%) | 15 (13%) | 9 (23%) | |
| pT1 | 35 (22%) | 21 (18%) | 14 (35%) | |
| ≥pT2 | 33 (21%) | 25 (21%) | 8 (20%) | |
| Tumor grade, n (%) | ||||
| Low | 43 (27%) | 38 (32%) | 5 (13%) | 0.023 |
| High | 116 (73%) | 81 (68%) | 35 (88%) | |
| Treatment, n (%) | ||||
| TURBT alone | 33 (21%) | 29 (24%) | 4 (10%) | 0.204 |
| TURBT with following intravesical chemotherapy | 6 (4%) | 5 (4%) | 1 (3%) | |
| TURBT with following BCG | 76 (48%) | 53 (45%) | 23 (58%) | |
| Cystectomy | 44 (28%) | 32 (27%) | 12 (30%) | |
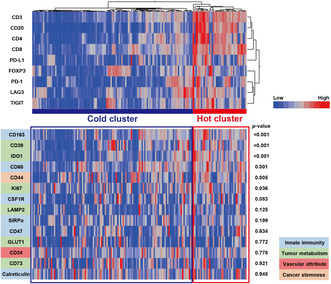
An automated single‐cell count of immunolabeled tumor sections from 159 BC samples was conducted. In this automated analysis, cells positively staining for acquired immune cell markers (CD3, CD4, CD8, CD20, FOXP3, PD‐1, PD‐L1, LAG3, and TIGIT) in samples were counted, as shown in Figure 1. As cell density may vary among individual samples, the number of cells that were positive for each marker was divided by the total cell number, and we obtained marker‐positive cell percentages per sample for use in subsequent analyses. Hierarchical clustering was then applied to 159 tumor samples based on the expression levels of the defined immune cell markers in tumors. There were two clusters, one consisting of patients with a high expression of the defined immune cell markers and the other without. Each cluster was defined as a “hot cluster” and “cold cluster” according to the degree of immune activity (Figure 2).
FIGURE 1.
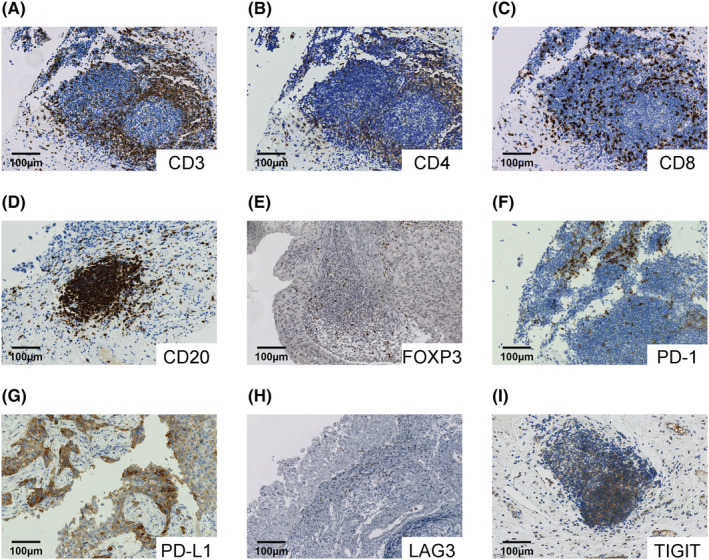
Representative images of components of tumor immune activity. (A–I) Human bladder cancer tumors immunolabeled for CD3 (A), CD4 (B), CD8 (C), CD20 (D), FOXP3 (E), PD‐1 (F), PD‐L1 (G), LAG3 (H), and TIGIT (I).
FIGURE 2.
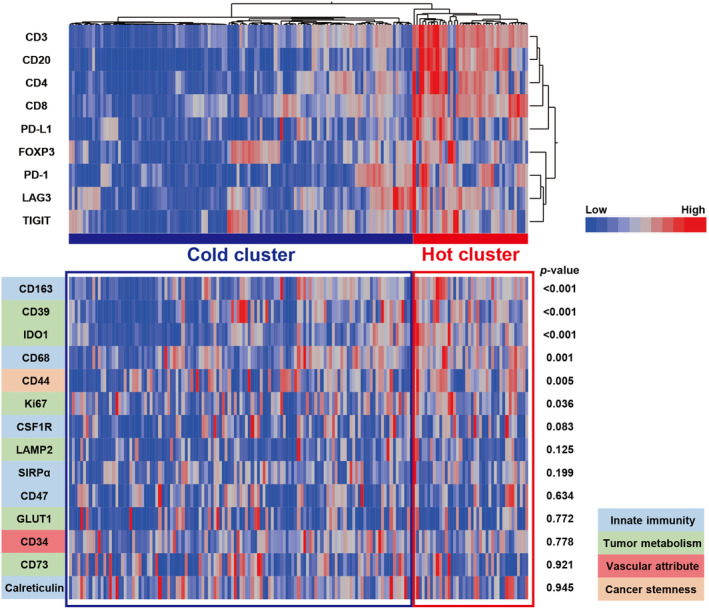
Overall tumor immune activity in bladder cancer. A hierarchical clustering heatmap (low, blue; high, red) based on the expression levels of the indicated immune cell markers in tumors divided into two clusters, a “hot cluster” and “cold cluster.” The lower panel shows comparisons of other immune‐related molecules between the two clusters.
There were 40 patients (25%) in the hot cluster and 119 (75%) in the cold cluster; there were no significant differences in age or subsequent treatments between the two groups. However, there were more females in the hot cluster than in the cold cluster, and pathologically, there were significantly more patients with high‐grade tumors in the hot cluster (Table 1). The expression of CD39, CD44, CD68, CD163, IDO1, and Ki67 was significantly higher in tumors in the hot cluster (Figure 2), revealing that these tumors had a high proliferative capacity and formed an immunosuppressive environment, while the tumors themselves were infiltrated by numerous immune cells. Furthermore, to evaluate the association of the clustering with pro‐inflammatory factors, we analyzed the expression levels of Granzyme B, IFN‐γ, and TNF‐α in the tumors (n = 43) (Figure S1A–C). Granzyme B expression levels were significantly higher in tumors in the hot cluster (p = 0.002) (Figure S1D), while no significant differences were observed in those of IFN‐γ or TNF‐α (Figure S1E,F).
3.2. Survival analysis
Regarding tumors classified into the “hot cluster” or “cold cluster” as depicted by tumor immune activity, the present results showed that high‐grade pT1 tumors were significantly hotter immunologically than low‐grade pTa, high‐grade pTa/pTis, or MIBC diseases (p = 0.035) (Figure 3A). This result suggests that among NMIBC, high‐grade T1 tumors were significantly hotter immunologically, while tumors that had progressed to muscle invasion turned cold.
FIGURE 3.
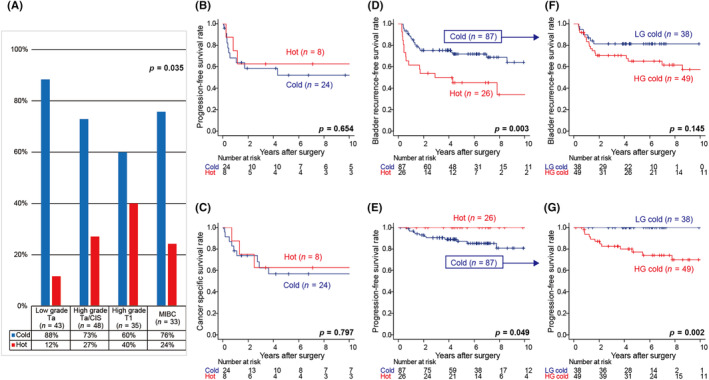
Tumor immune microenvironment dynamics and outcomes in bladder cancer. (A) Percent distribution of the inferred cluster types within each grade and stage of bladder cancer. (B, C) Kaplan–Meier survival curves for progression‐free survival (B) and cancer‐specific survival (C) following total cystectomy in patients with MIBC based on the inferred cluster types. (D–G) Kaplan–Meier survival curves for bladder recurrence‐free survival (D) and progression‐free survival (E) following TURBT in patients with NMIBC. Kaplan–Meier survival curves for bladder recurrence‐free survival (F) and progression‐free survival (G) following TURBT in cold cluster patients with NMIBC divided into two groups; low‐grade tumors in the cold cluster (LG cold) and high‐grade tumors in the cold cluster (HG cold).
We then investigated whether tumor immune activity was associated with patient survival after surgery for BC. A Kaplan–Meier analysis revealed that the tumor immune cluster did not affect progression‐free or cancer‐specific survival in patients with MIBC (p = 0.654 and p = 0.797, respectively) (Figure 3B,C). In contrast, a distinct relationship was observed between immune activity in and the prognosis of patients with NMIBC: the hot cluster had a significantly higher risk of bladder recurrence than the cold cluster (p = 0.003) (Figure 3D). However, patients with NMIBC in the cold cluster had a significantly higher risk of disease progression, such as muscle layer‐invasive disease and distant metastases, compared with those in the hot cluster (p = 0.049) (Figure 3E).
Indeed, the most hot cluster tumors in NMIBC were high‐grade, while the cold cluster consisted of various tumors ranging from low‐grade pTa to high‐grade pT1, as shown in Table 1. To further understand this heterogeneous cold cluster population, we divided the patients into two groups: low‐grade tumors in the cold cluster and high‐grade tumors in the cold cluster. A Kaplan–Meier analysis revealed that there were no significant differences between the two groups in the risk of bladder recurrence (p = 0.145) (Figure 3F). Conversely, the risk of disease progression was significantly higher for high‐grade tumors in the cold cluster (p = 0.002) (Figure 3G). These results suggest that tumor immune activity affected a subset of recurrence types in NMIBC, and among high‐grade tumors, those that acquired a cold immune environment were considered to have a poor prognosis.
3.3. TCGA cohort analysis
Using a publicly available confirmation cohort TCGA dataset, we externally examined the clinical significance of our clusters due to tumor immune activity. We applied hierarchical clustering based on the mRNA expression of the same immune molecules to data from 411 patients. The cohort was divided into three clusters according to the degree of immune activity: the “hot cluster,” “cold cluster,” and “intermediate cluster” (Figure 4A). The mRNA expression of CD39, CD44, CD68, CD163, IDO1, Ki67 (Figure 4A), and Granzyme B (Figure S1G) in tumors was significantly higher in the hot cluster than in the other two clusters, which was consistent with the results shown in Figure 2 and Figure S1D.
FIGURE 4.
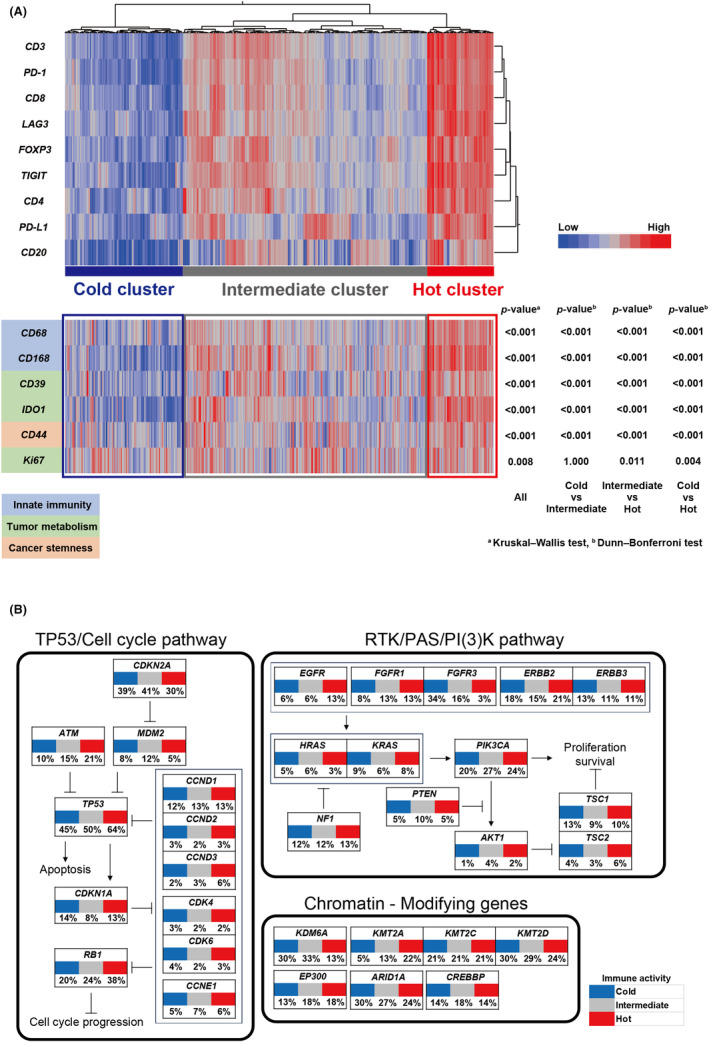
Genetic alterations in TCGA dataset analysis underlying tumor immune activity. (A) A hierarchical clustering heatmap (low, blue; high, red) based on mRNA expression levels of the indicated immune cell markers in TCGA dataset divided into three clusters: (A) “hot cluster,” “cold cluster,” and “intermediate cluster.” The lower panel shows comparisons of the mRNA expression levels of other immune‐related molecules between the three clusters. (B) Percentage of samples with genomic alterations related to the development of bladder cancer in three clusters.
In addition, we used TCGA genomic dataset to identify the genomic alterations responsible for our clusters by tumor immune activity. RB1, TP53, and KMT2A alterations were more frequently observed in TCGA hot cluster (p = 0.023, p = 0.053, and p = 0.004, respectively) (Figure 4B). Conversely, FGFR3 and KDM6A alterations were significantly more common in TCGA cold and intermediate clusters, while only a few were detected in the hot cluster (p < 0.001 and p = 0.006) (Figure 4B). Furthermore, FGFR3 mRNA expression levels were significantly higher in tumors with altered than in tumors without altered FGFR3 (Figure S2A ). Interestingly, FGFR3 mRNA expression levels were negatively correlated with the mRNA levels of CD3 (r = −0.258, p < 0.001) and CD8 (r = −0.349, p < 0.001) (Figure S2B,C ); therefore, tumors with high expression levels of FGFR3 had a cold immune microenvironment. As FGFR3 is a candidate molecule for drug development as a therapeutic target for BC, 19 , 20 we then focused our analysis on FGFR3 expression as a novel target in high‐grade tumors in the cold cluster that has progressed despite BCG therapy.
3.4. Sequential analysis of bladder recurrent tumors before and after BCG therapy
Treatment for recurrent tumors after BCG therapy does not currently exist, particularly in our analysis, where tumors in the cold cluster were less responsive to BCG therapy. Therefore, we herein investigated whether the instinctive immune activity of tumors was similar at recurrence and performed a longitudinal analysis of matched tumor samples before and after BCG therapy. Of 31 patients with high‐grade NMIBC who developed bladder recurrence after BCG therapy, 21 had sufficient TURBT samples of the recurrent tumor. Of these, seven patients were initially classified into the hot cluster and 14 into the cold cluster (Figure 5A). Using immunostaining for CD3, CD8, FOXP3, PD‐L1, CD68, and CD163 we examined the tumor immune microenvironment before and after BCG therapy (Figure 5A).
FIGURE 5.
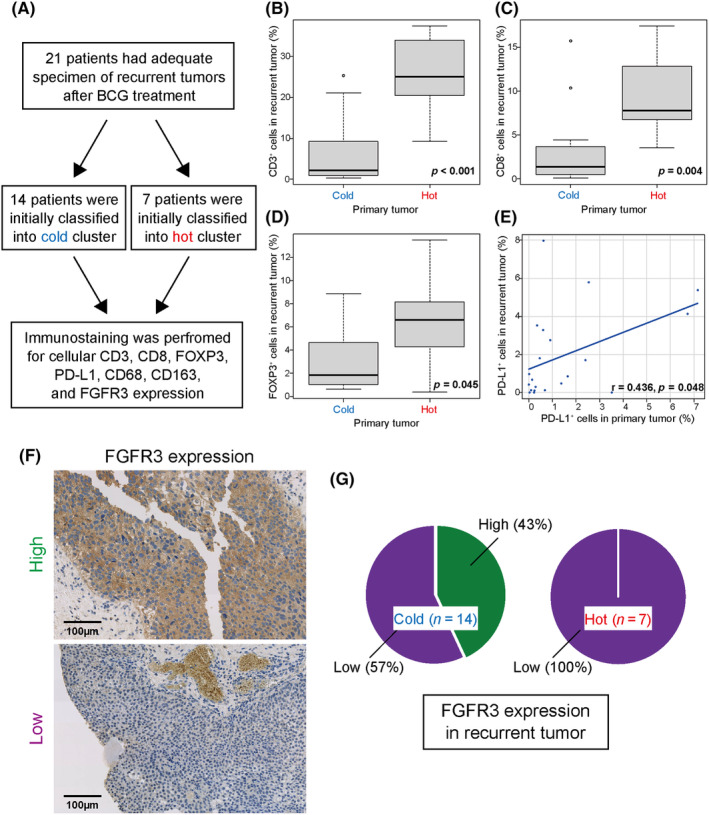
Tumor immune microenvironment in tumors relapsing after BCG therapy. (A) Flow chart of analyses of recurrent tumors after BCG therapy. (B–D) Expression levels for CD3 (B), CD8 (C), and FOXP3 (D) in the two initially classified clusters. (E) Correlation coefficients for PD‐L1 expression levels in samples before and after BCG therapy. (F) Recurrent bladder cancer tumors immunolabeled for FGFR3. (G) Percent distribution of FGFR3 expression (high or low) in recurrent tumors based on initially classified clusters.
An analysis of samples after BCG therapy showed that tumor samples initially classified into the cold cluster showed significantly lower infiltrates of CD3‐, CD8‐, and FOXP3‐positive cells after recurrence compared with tumor samples initially classified into the hot cluster (p < 0.001, p = 0.004, and p = 0.045, respectively) (Figure 5B–D), while no significant differences were observed in those of CD68 or CD163 (Figure S3A,B). Furthermore, a comparison of matched tumor samples before and after BCG therapy showed a correlation with PD‐L1 expression (r = 0.436, p = 0.048) (Figure 5E). Therefore, as tumor immune activity may be widely maintained before and after BCG therapy, repeated BCG may be less effective for tumors recurring after BCG therapy.
We also investigated whether oncogenic FGFR3 represents a novel therapeutic target for recurrent tumors after BCG therapy since they were often observed in the cold cluster of TCGA, as shown in Figure 4B. Immunostaining for FGFR3 (Figure 5F) revealed high FGFR3 expression in more than 40% of cases only in recurrent tumors initially classified into the cold cluster (Figure 5G), although no relationship was observed between the timing of recurrence after BCG and FGFR3 expression levels in the 21 recurrent tumors. Therefore, tumors classified into the cold cluster may be therapeutic targets for FGFR3‐based precision medicine if they recur after BCG therapy.
4. DISCUSSION
In recent years, the tumor immune environment has become a target for treatment in many solid tumors. Immune checkpoint inhibitors, e.g., pembrolizumab and avelumab, have proven to be effective treatment options for advanced urothelial carcinoma treated with platinum‐based chemotherapy. 12 , 13 Postoperative adjuvant therapy with nivolumab was also shown to be effective for MIBC following total cystectomy. 11 The development of these agents has provided insights into the future of MIBC and advanced urothelial carcinoma, which are considered to have a very poor prognosis. 11 , 12 , 21 , 22 However, few studies have focused on immune checkpoint inhibitor molecules in NMIBC, and BCG therapy after TURBT remains the gold standard treatment for NMIBC with a high risk of recurrence. 2 , 3 , 23 , 24 However, in clinical practice, many cases are resistant to BCG therapy and require total cystectomy. 5 , 25 , 26 Therefore, we obtained three main results that were applicable to future research on the treatment of NMIBC, particularly that resistant to BCG therapy.
First, we examined the tumor microenvironment in each stage of BC. The results obtained revealed that, among NMIBC, high‐grade T1 tumors were significantly hot immunologically, while tumors that had progressed to muscle invasion showed a turnaround and the immune environment turned cold. Although the majority of previous studies on immune checkpoint inhibitors had focused on advanced stages, 12 , 13 high‐grade T1 tumors may be the most sensitive subgroup of BC to immunotherapy. Furthermore, the high expression of the novel immune checkpoint molecules, LAG3 and TIGIT, along with that of the immunosuppressive molecules, CD39 and IDO‐1, was observed in immunologically hot tumors. 9 , 27 , 28 , 29 , 30 , 31 , 32 Therefore, the combination of agents that target these molecules and anti‐PD‐1/PD‐L1 inhibitors may be useful for immunologically hot tumors that are resistant to existing therapies.
Second, the results of a survival analysis revealed that immunologically hot NMIBC tumors had a significantly higher risk of bladder recurrence, even when treated with BCG therapy. Furthermore, the immune environment within the tumor, e.g., the immune checkpoint molecule PD‐L1, was maintained if the tumor recurred after BCG therapy. In many solid tumors, including BC, the high expression of acquired immune cells, such as T cells and B cells, is associated with a good prognosis. 10 However, the present study obtained the opposite result on the frequency of bladder recurrence. Therefore, immunologically hot high‐grade NMIBC tumors, which often recur in the bladder after BCG therapy, may benefit from anti‐PD‐L1 inhibitors. The POTMAC and ALBAN trials investigating the combination of BCG therapy with the PD‐L1 inhibitors durvalumab and atezolizumab, respectively, are underway (NCT03528694 and NCT03799835), 33 , 34 and the findings of these trials are expected.
Third, however, certain numbers of high‐grade NMIBC patients were in the cold cluster, and these patients had a significantly higher risk of disease progression. Consistent with the present results, previous studies had reported that high‐grade NMIBCs often have an activated immune response, whereas immunologically inactive tumors in high‐grade bladder cancer cases have a worse prognosis. 35 , 36 Tumors that are high‐grade immunologically cold are expected to be ineffective against BCG therapy and immune checkpoint inhibitors. Therefore, we investigated genetic backgrounds in TCGA cohort to identify the molecular basis underlying immunologically cold tumors and revealed that FGFR3 alterations were often observed in immunologically cold tumors. Previous studies demonstrated that FGFR3 alterations, which often present as the overexpression of FGFR3, may induce an immunologically cold tumor environment 37 , 38 , 39 ; therefore, we indicate the potential of FGFR inhibitors as a useful modality to improve the immunologically cold environment and prevent stage progression in patients with NMIBC.
In conclusion, we identified the tumor immune environment in each stage of BC and candidate molecules that are therapeutic targets for BCG‐resistant NMIBC. However, the present study had several limitations that need to be addressed. Samples were collected retrospectively from a limited number of patients; therefore, a selection bias cannot be eliminated. Furthermore, TMAs were regionally limited, which in some cases may lead to a bias in the over‐representation or under‐representation of markers. Although the present study showed that FGFR inhibitors may be effective for immunologically cold tumors, genomic analysis data were not available for the in‐house BC cohorts. Some subtypes of BC with FGFR3 alterations have recently been found to respond to immune checkpoint inhibitors 40 ; thereby the present results need further validation.
AUTHOR CONTRIBUTIONS
Rei Kamitani: Conceptualization; data curation; formal analysis; investigation; methodology; project administration; writing – original draft. Nobuyuki Tanaka: Conceptualization; funding acquisition; project administration; resources; supervision; validation; writing – original draft. Tadatsugu Anno: Validation. Tetsushi Murakami: Validation. Tsukasa Masuda: Validation. Yota Yasumizu: Validation. Toshikazu Takeda: Validation. Shinya Morita: Validation. Takeo Kosaka: Validation. Shuji Mikami: Methodology; validation. Kazuhiro Matsumoto: Validation. Mototsugu Oya: Supervision.
FUNDING INFORMATION
This study was supported by Grants‐in‐Aid for Scientific Research (21K19414 and 22H03217 to N.T.) and research grants from the SGH Foundation for Cancer Research (to N.T.), the Princess Takamatsu Cancer Research Fund (to N.T.), the Takeda Science Foundation (to N.T.), the Foundation for Promotion of Cancer Research Japan (to N.T.), and the Keio Gijuku Academic Development Fund (to N.T.).
CONFLICT OF INTEREST STATEMENT
Mototsugu Oya is an Editorial Board Member of Cancer Science. The other authors declare no competing interests.
ETHICS STATEMENT
Approval of the research protocol by an institutional review board: The present study was performed in accordance with the guidelines established by the Declaration of Helsinki and was approved by the Ethics Committee of Keio University School of Medicine.
Consent: Participation in the study was optional. Both written informed consent and passive (opt‐out) informed consent procedures have been applied to the experimental use of human samples.
Registry and the Registration No. of the study/trial: N/A.
Animal studies: N/A.
Supporting information
Figure S1. Analyses of pro‐inflammatory factors. (A–C). Human bladder cancer tumors immunolabeled for the pro‐inflammatory factors, Granzyme B (A), IFN‐γ (B), and TNF‐α (C). (D–F). Expression levels for Granzyme B (D), IFN‐γ (E), and TNF‐α (F) in the initially classified two clusters. (G). Z‐scored mRNA expression level of Granzyme B in TCGA dataset analysis.
Figure S2. mRNA expression levels of FGFR3, and the association with the tumor immune activity in TCGA dataset analysis. (A) Z‐scored mRNA expression level of FGFR3 between tumors with or without FGFR3 alterations. (B, C) Correlation coefficient for Z‐scored mRNA expression levels of CD3 (B) and CD8 (C) to FGFR3.
Figure S3. Analyses of tumors relapsing after BCG therapy. Expression levels for CD68 (A) and CD168 (B) in the two initially classified clusters.
Table S1. List of antibodies used for immunochemical studies.
ACKNOWLEDGMENTS
None.
Kamitani R, Tanaka N, Anno T, et al. Tumor immune microenvironment dynamics and outcomes of prognosis in non‐muscle‐invasive bladder cancer. Cancer Sci. 2024;115:3963‐3972. doi: 10.1111/cas.16333
REFERENCES
- 1. Cumberbatch MGK, Jubber I, Black PC, et al. Epidemiology of bladder cancer: a systematic review and contemporary update of risk factors in 2018. Eur Urol. 2018;74(6):784‐795. [DOI] [PubMed] [Google Scholar]
- 2. Babjuk M, Burger M, Capoun O, et al. European Association of Urology guidelines on non‐muscle‐invasive bladder cancer (Ta, T1, and carcinoma in situ). Eur Urol. 2022;81(1):75‐94. [DOI] [PubMed] [Google Scholar]
- 3. Sylvester RJ, van der Meijden AP, Oosterlinck W, et al. Predicting recurrence and progression in individual patients with stage Ta T1 bladder cancer using EORTC risk tables: a combined analysis of 2596 patients from seven EORTC trials. Eur Urol. 2006;49(3):466‐475. [DOI] [PubMed] [Google Scholar]
- 4. van den Bosch S, Alfred WJ. Long‐term cancer‐specific survival in patients with high‐risk, non‐muscle‐invasive bladder cancer and tumour progression: a systematic review. Eur Urol. 2011;60(3):493‐500. [DOI] [PubMed] [Google Scholar]
- 5. Lerner SP, Tangen CM, Sucharew H, Wood D, Crawford ED. Failure to achieve a complete response to induction BCG therapy is associated with increased risk of disease worsening and death in patients with high risk non‐muscle invasive bladder cancer. Urol Oncol. 2009;27(2):155‐159. [DOI] [PMC free article] [PubMed] [Google Scholar]
- 6. Pietzak EJ, Zabor EC, Bagrodia A, et al. Genomic differences between “primary” and “secondary” muscle‐invasive bladder cancer as a basis for disparate outcomes to cisplatin‐based Neoadjuvant chemotherapy. Eur Urol. 2019;75(2):231‐239. [DOI] [PMC free article] [PubMed] [Google Scholar]
- 7. Catto JWF, Downing A, Mason S, et al. Quality of life after bladder cancer: a cross‐sectional survey of patient‐reported outcomes. Eur Urol. 2021;79(5):621‐632. [DOI] [PMC free article] [PubMed] [Google Scholar]
- 8. Catto JWF, Khetrapal P, Ricciardi F, et al. Effect of robot‐assisted radical cystectomy with Intracorporeal urinary diversion vs open radical cystectomy on 90‐day morbidity and mortality among patients with bladder cancer: a randomized clinical trial. JAMA. 2022;327(21):2092‐2103. [DOI] [PMC free article] [PubMed] [Google Scholar]
- 9. Ahmadzadeh M, Johnson LA, Heemskerk B, et al. Tumor antigen‐specific CD8 T cells infiltrating the tumor express high levels of PD‐1 and are functionally impaired. Blood. 2009;114(8):1537‐1544. [DOI] [PMC free article] [PubMed] [Google Scholar]
- 10. Bruni D, Angell HK, Galon J. The immune contexture and Immunoscore in cancer prognosis and therapeutic efficacy. Nat Rev Cancer. 2020;20(11):662‐680. [DOI] [PubMed] [Google Scholar]
- 11. Bajorin DF, Witjes JA, Gschwend JE, et al. Adjuvant Nivolumab versus placebo in muscle‐invasive urothelial carcinoma. N Engl J Med. 2021;384(22):2102‐2114. [DOI] [PMC free article] [PubMed] [Google Scholar]
- 12. Bellmunt J, de Wit R, Vaughn DJ, et al. Pembrolizumab as second‐line therapy for advanced urothelial carcinoma. N Engl J Med. 2017;376(11):1015‐1026. [DOI] [PMC free article] [PubMed] [Google Scholar]
- 13. Powles T, Park SH, Voog E, et al. Avelumab maintenance therapy for advanced or metastatic urothelial carcinoma. N Engl J Med. 2020;383(13):1218‐1230. [DOI] [PubMed] [Google Scholar]
- 14. Fukumoto K, Kikuchi E, Mikami S, et al. Clinical role of programmed cell Death‐1 expression in patients with non‐muscle‐invasive bladder cancer recurring after initial bacillus Calmette‐Guérin therapy. Ann Surg Oncol. 2018;25(8):2484‐2491. [DOI] [PubMed] [Google Scholar]
- 15. Balar AV, Kamat AM, Kulkarni GS, et al. Pembrolizumab monotherapy for the treatment of high‐risk non‐muscle‐invasive bladder cancer unresponsive to BCG (KEYNOTE‐057): an open‐label, single‐arm, multicentre, phase 2 study. Lancet Oncol. 2021;22(7):919‐930. [DOI] [PubMed] [Google Scholar]
- 16. Robertson AG, Kim J, Al‐Ahmadie H, et al. Comprehensive molecular characterization of muscle‐invasive bladder cancer. Cell. 2017;171(3):540‐546. [DOI] [PMC free article] [PubMed] [Google Scholar]
- 17. Hoadley KA, Yau C, Hinoue T, et al. Cell‐of‐origin patterns dominate the molecular classification of 10,000 tumors from 33 types of cancer. Cell. 2018;173(2):291‐304. [DOI] [PMC free article] [PubMed] [Google Scholar]
- 18. Cerami E, Gao J, Dogrusoz U, et al. The cBio cancer genomics portal: an open platform for exploring multidimensional cancer genomics data. Cancer Discov. 2012;2(5):401‐404. [DOI] [PMC free article] [PubMed] [Google Scholar]
- 19. Catto JWF, Tran B, Rouprêt M, et al. Erdafitinib in BCG‐treated high‐risk non‐muscle‐invasive bladder cancer. Ann Oncol. 2024;35(1):98‐106. [DOI] [PubMed] [Google Scholar]
- 20. Loriot Y, Necchi A, Park SH, et al. Erdafitinib in locally advanced or metastatic urothelial carcinoma. N Engl J Med. 2019;381(4):338‐348. [DOI] [PubMed] [Google Scholar]
- 21. Gore JL, Litwin MS, Lai J, et al. Use of radical cystectomy for patients with invasive bladder cancer. J Natl Cancer Inst. 2010;102(11):802‐811. [DOI] [PMC free article] [PubMed] [Google Scholar]
- 22. von der Maase H, Sengelov L, Roberts JT, et al. Long‐term survival results of a randomized trial comparing gemcitabine plus cisplatin, with methotrexate, vinblastine, doxorubicin, plus cisplatin in patients with bladder cancer. J Clin Oncol. 2005;23(21):4602‐4608. [DOI] [PubMed] [Google Scholar]
- 23. Fernandez‐Gomez J, Madero R, Solsona E, et al. Predicting nonmuscle invasive bladder cancer recurrence and progression in patients treated with bacillus Calmette‐Guerin: the CUETO scoring model. J Urol. 2009;182(5):2195‐2203. [DOI] [PubMed] [Google Scholar]
- 24. Sylvester RJ, Brausi MA, Kirkels WJ, et al. Long‐term efficacy results of EORTC genito‐urinary group randomized phase 3 study 30,911 comparing intravesical instillations of epirubicin, bacillus Calmette‐Guérin, and bacillus Calmette‐Guérin plus isoniazid in patients with intermediate‐ and high‐risk stage Ta T1 urothelial carcinoma of the bladder. Eur Urol. 2010;57(5):766‐773. [DOI] [PMC free article] [PubMed] [Google Scholar]
- 25. Di Lorenzo G, Perdonà S, Damiano R, et al. Gemcitabine versus bacille Calmette‐Guérin after initial bacille Calmette‐Guérin failure in non‐muscle‐invasive bladder cancer: a multicenter prospective randomized trial. Cancer. 2010;116(8):1893‐1900. [DOI] [PubMed] [Google Scholar]
- 26. Kamat AM, Sylvester RJ, Böhle A, et al. Definitions, end points, and clinical trial designs for non‐muscle‐invasive bladder cancer: recommendations from the international bladder cancer group. J Clin Oncol. 2016;34(16):1935‐1944. [DOI] [PMC free article] [PubMed] [Google Scholar]
- 27. Grosso JF, Kelleher CC, Harris TJ, et al. LAG‐3 regulates CD8+ T cell accumulation and effector function in murine self‐ and tumor‐tolerance systems. J Clin Invest. 2007;117(11):3383‐3392. [DOI] [PMC free article] [PubMed] [Google Scholar]
- 28. Holmgaard RB, Zamarin D, Munn DH, Wolchok JD, Allison JP. Indoleamine 2,3‐dioxygenase is a critical resistance mechanism in antitumor T cell immunotherapy targeting CTLA‐4. J Exp Med. 2013;210(7):1389‐1402. [DOI] [PMC free article] [PubMed] [Google Scholar]
- 29. Hung AL, Maxwell R, Theodros D, et al. TIGIT and PD‐1 dual checkpoint blockade enhances antitumor immunity and survival in GBM. Onco Targets Ther. 2018;7(8):e1466769. [DOI] [PMC free article] [PubMed] [Google Scholar]
- 30. Lozano E, Dominguez‐Villar M, Kuchroo V, Hafler DA. The TIGIT/CD226 axis regulates human T cell function. J Immunol. 2012;188(8):3869‐3875. [DOI] [PMC free article] [PubMed] [Google Scholar]
- 31. Moesta AK, Li XY, Smyth MJ. Targeting CD39 in cancer. Nat Rev Immunol. 2020;20(12):739‐755. [DOI] [PubMed] [Google Scholar]
- 32. Wainwright DA, Balyasnikova IV, Chang AL, et al. IDO expression in brain tumors increases the recruitment of regulatory T cells and negatively impacts survival. Clin Cancer Res. 2012;18(22):6110‐6121. [DOI] [PMC free article] [PubMed] [Google Scholar]
- 33. Santis MD, Abdrashitov R, Hegele A, et al. A phase III, randomized, open‐label, multicenter, global study of durvalumab and bacillus calmette‐guérin (BCG) versus BCG alone in high‐risk, BCG‐naïve non‐muscle‐invasive bladder cancer (NMIBC) patients (POTOMAC). J Clin Oncol. 2019;37(7_suppl):TPS500. [Google Scholar]
- 34. Roupret M, Neuzillet Y, Bertaut A, et al. ALBAN: an open label, randomized, phase III trial, evaluating efficacy of atezolizumab in addition to one year BCG (bacillus Calmette‐Guerin) bladder instillation in BCG‐naive patients with high‐risk nonmuscle invasive bladder cancer (AFU‐GETUG 37). J Clin Oncol. 2019;37(15_suppl):TPS4589. [Google Scholar]
- 35. Piao XM, Kang HW, Jeong P, et al. A prognostic immune predictor, HLA‐DRA, plays diverse roles in non‐muscle invasive and muscle invasive bladder cancer. Urol Oncol. 2021;39(4):237. [DOI] [PubMed] [Google Scholar]
- 36. Kawashima A, Kanazawa T, Jingushi K, et al. Phenotypic analysis of tumor tissue‐infiltrating lymphocytes in tumor microenvironment of bladder cancer and upper urinary tract carcinoma. Clin Genitourin Cancer. 2019;17(2):114‐124. [DOI] [PubMed] [Google Scholar]
- 37. van Rhijn BWG, Mertens LS, Mayr R, et al. FGFR3 mutation status and FGFR3 expression in a large bladder cancer cohort treated by radical cystectomy: implications for anti‐FGFR3 treatment? Eur Urol. 2020;78(5):682‐687. [DOI] [PubMed] [Google Scholar]
- 38. Okato A, Utsumi T, Ranieri M, et al. FGFR inhibition augments anti‐PD‐1 efficacy in murine FGFR3‐mutant bladder cancer by abrogating immunosuppression. J Clin Invest. 2024;134(2):e169241. [DOI] [PMC free article] [PubMed] [Google Scholar]
- 39. Ouyang Y, Ou Z, Zhong W, et al. FGFR3 alterations in bladder cancer stimulate serine synthesis to induce immune‐inert macrophages that suppress T‐cell recruitment and activation. Cancer Res. 2023;83(24):4030‐4046. [DOI] [PMC free article] [PubMed] [Google Scholar]
- 40. Komura K, Hirosuna K, Tokushige S, et al. The impact of FGFR3 alterations on the tumor microenvironment and the efficacy of immune checkpoint inhibitors in bladder cancer. Mol Cancer. 2023;22(1):185. [DOI] [PMC free article] [PubMed] [Google Scholar]
Associated Data
This section collects any data citations, data availability statements, or supplementary materials included in this article.
Supplementary Materials
Figure S1. Analyses of pro‐inflammatory factors. (A–C). Human bladder cancer tumors immunolabeled for the pro‐inflammatory factors, Granzyme B (A), IFN‐γ (B), and TNF‐α (C). (D–F). Expression levels for Granzyme B (D), IFN‐γ (E), and TNF‐α (F) in the initially classified two clusters. (G). Z‐scored mRNA expression level of Granzyme B in TCGA dataset analysis.
Figure S2. mRNA expression levels of FGFR3, and the association with the tumor immune activity in TCGA dataset analysis. (A) Z‐scored mRNA expression level of FGFR3 between tumors with or without FGFR3 alterations. (B, C) Correlation coefficient for Z‐scored mRNA expression levels of CD3 (B) and CD8 (C) to FGFR3.
Figure S3. Analyses of tumors relapsing after BCG therapy. Expression levels for CD68 (A) and CD168 (B) in the two initially classified clusters.
Table S1. List of antibodies used for immunochemical studies.