Abstract
Laser–Plasma ion acceleration is acquiring importance on a daily basis due to incipient applicability in certain research fields. However, the energy and divergence control of these brilliant sources can be considered a bottleneck in the development of some applications. In this work, we present the commissioning of a compact proton beamline based on a triplet of quadrupoles dedicated to focus and collect short and energetic pulses, open to the user community. The focused proton beam characterization has been carried out by imaging of scintillation detectors with different particle filters. Experimental results have been compared with numerical simulations performed with Monte Carlo code (MCNP6) and TSTEP that have been used to retrieve the deposited energy, the particle tracking, and the particle distribution in different focal configurations, respectively. Charges of nC (
 protons with energies up to 17.25 MeV) have been measured at the focal planes reducing the beam to spot sizes of a few millimetres in RMS (root mean square). The percentage fluctuation of the transported charges values has been studied. Finally, the beam rigidity has been measured by transverse moving of the quadrupoles and subsequent beam centroid shift, allowing to cross correlate the deflected energy with the energy ranges resulting from the filtering process.
Keywords: Laser driven proton beams, TNSA, Proton applications, Laser–plasma interaction, Quadrupole beamline
Subject terms: Plasma-based accelerators, Laser-produced plasmas
Introduction
Over the last few years, ultra- fast proton beams have been generated through the acceleration regime known as TNSA (Target Normal Sheath Acceleration), that takes place in accelerators based on laser–plasma interaction. This acceleration scheme provides high brilliance proton sources with unique properties in terms of low emittance1, short pulse2 (picosecond scale) with an excellent quality of transversal intensity distribution. The proton energy distribution ranges usually from few keV up to the new experimental record of 150 MeV3.
CLPU, as a reference facility in Spain for this type of experiments, has extensive experience in proton acceleration using both the VEGA-2 TW line4,5 and the VEGA-3 PW line6. However, the intrinsic divergence (with an energy dependent half-opening angle up to more than 20 , according to the different laser systems7,8) and huge energy spread of these sources can represent a disadvantage for potential applications9, such as hadrontheraphy10, FLASH therapy11, material science applications as Particle Induced X ray Emission (PIXE)12 and Particle Induced Gamma- Ray Emission (PIGE)13. This has opened new horizons for exploration, where it is possible to manipulate and transport these ultra-fast sources using elements typical of conventional accelerators. Currently, there are numerous strategies available for the transport and spectral selection of these proton sources, such as permanent quadrupole magnets (PQMs)14–16, electromagnet quadrupoles (EMQs)17, solenoids18, laser-driven microlenses19, active plasma lenses20, RF cavities21, and magnetic chicanes22. Combinations of these elements have been used to build beamlines in various facilities (e.g., ELI Beamlines23,24 or Peking University25).
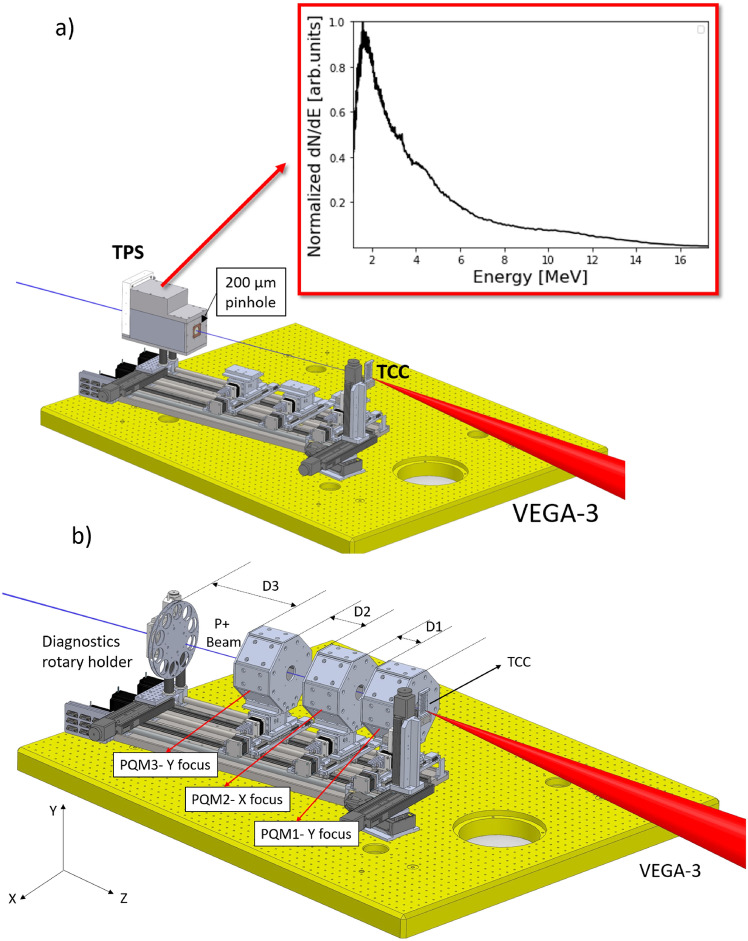
In this manuscript, we present a proton transport workstation (designed, developed and tested at CLPU) based on a triplet of PQMs (see Fig. 1) and dedicated to the focusing of the typical VEGA-3 characteristic proton beam. We optimized proton beam focusing of different energy bands by fine tuning according to the particle tracking simulations (TSTEP) by estimating the positions of the quadrupole set and the detection plane. The spot spatial characterization and beam current estimation has been carried out by imaging several sets of BC-400 scintillators covered with Al filters of different thicknesses. See “Methods” section.
Fig. 1.
Schematics of the setting up of the experiment at CLPU. (a) TPS setting up, the inset is the initial proton energy spectrum measurement at  . (b) Implementation of the quadrupoles inside the experimental chamber. The PQM1, PQM2 and PQM3 are the three quadrupoles and D1, D2 and D3 their relative distances.
Results
Beam stability and charge estimation
The scheme of the experimental setup of the proton beam line is shown in Fig. 1a,b. The Thomson Parabola Spectrometer (TPS) was placed at the end of the beamline before placing the quadrupoles along the beam propagation axis retrieving the spectrum in the inset of Fig. 1a. This spectrum has the classical profile (ref26 and references therein), broad and quasi-Maxwellian shape, with an energy cutoff in 17.25 MeV. The TPS will offer the information about the shape of the spectrum, which is necessary for evaluating the proton transport efficiency through the quadrupoles and performing the MCNP6 simulations.
The nomenclature for each configuration according to the PQM’s relative distances and energies to focus are shown in Table 1. Note that PQM1 and PQM3 focus protons in the Y direction and PQM2 focuses in the X direction.
Table 1.
Experimental energies and relative distances between PQMs (D1 and D2) and the detector (D3).
| Config. | E (MeV) | D1 (mm) | D2 (mm) | D3 (mm) |
|---|---|---|---|---|
| C1 | 8/6 | 65 | 97 | 131 |
| C2 | 10 | 65 | 147 | 133 |
| C3 | 12 | 124 | 97 | 191 |
| C4 | 14 | 154 | 87 | 223 |
The first step of analysis consisted of beam stability evaluation. This includes both shot-to-shot and transport fluctuations that can influence on the charge values and on the spot profiles. The shot-to-shot instability is a common effect within the framework of this particle acceleration strategy. In our case, we included the quadrupole beamline to account for both shot-to-shot instabilities and transport fluctuations. The detection system in this case has been a thick plastic scintillator (polyvinyl toluene, PVT) of 1.5 mm with no filtering. This thick scintillator ensures keeping the Bragg peak inside of it for energies up to 10.5 MeV that constitutes the 94.08 % of the initial number of protons in the TPS spectrum of Fig. 1a. With this configuration we obtain an overall picture of the full spectrum beam profile. The distances between the PQM’s in this case are similar to those of C1 with values D1=65 mm, D2=85 mm and D3=130 mm.
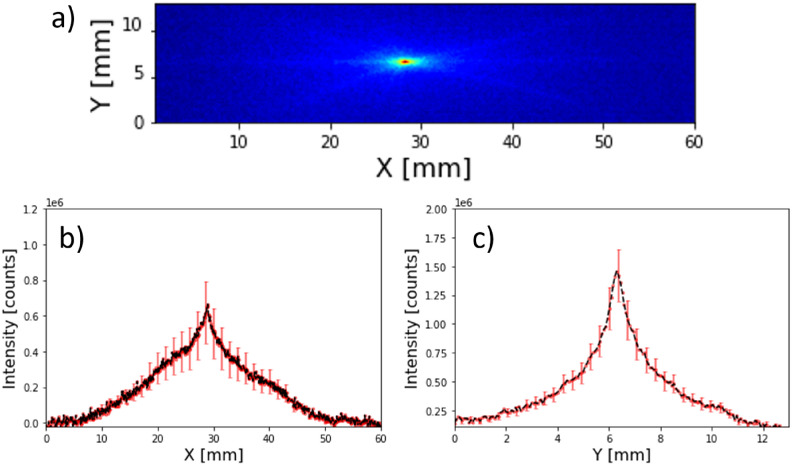
Figure 2 shows the vertical and horizontal averaged profiles of 15 shots, along with their uncertainties. One can observe the fluctuations in intensity reporting a 28% in horizontal (X) and a 16% in vertical (Y). The full width half maximum (FWHM) measured average profile diameters for X and Y were 12.88 ± 2.50 mm (X) and 2.06± 0.25 (Y) mm, respectively. These profiles are also poly-chromatic as there is no energy selection or filtering during these measurements. The standard horizontal and vertical deviations of the centroid were also analyzed reporting variations of about 0.178 mm while the vertical profile varies its maximum position 0.045 mm. In terms of number of counts (over the total image)  a 10% shot-to-shot variation is observed, involving also the transmission fluctuations. Typically, this value is higher in our similar experiments4,27, up to 30–40%, but can vary day-to-day and for different targets.
Fig. 2.
(a) Example of a scintillator image of one the 15 shots. (b) Horizontal and (c) vertical averaged profiles of 15 shots under the same conditions.
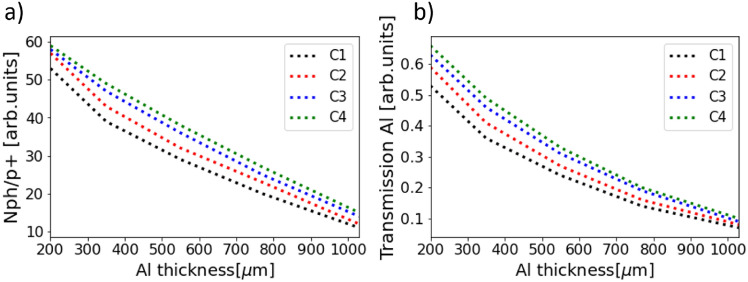
The charge and spot characterization has been carried out imaging the light emission of the scintillator on its rear side with respect to the incidence of the proton beam via direct imaging acquisition by a camera with an objective. For the charge estimation, the parameters of Fig. 11 (number of emitted photons per incident proton), in “Methods” section) have been used as average values in each case. To obtain the charge arriving to the detection system one needs to retrieve the total number of photons emitted by the scintillator. Then, knowing the number of photons per proton from simulations, the amount of charge is derived. The retrieval of the number of photons requires to take into account transmission efficiencies through window and objective, overall efficiency of the CMOS and numerical aperture of the objective. The typical light emission in scintillators is described by a Lambertian profile in which the emitted light has is directional character28 (proportional to the cosine of the emission angle).
Fig. 11.
(a) Estimation of number of photons per proton for all the filters and relative distances combinations. (b) Transmission efficiency after the filters in each configuration.
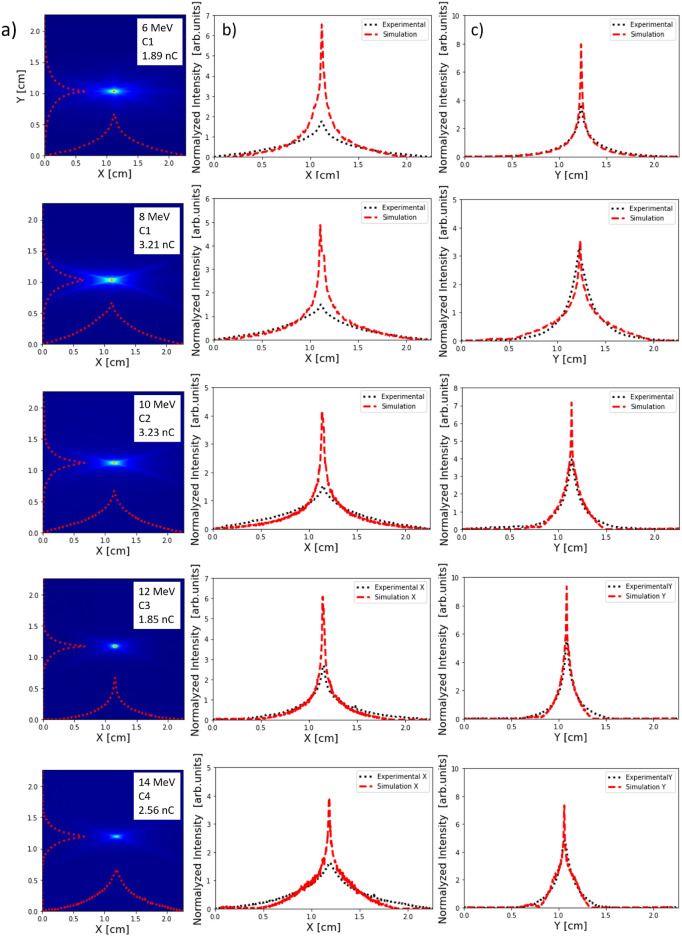
MCNP6 simulations29 allow to calculate the deposited energy of a single proton with a certain energy. Then, knowing the deposited energy, the Birks law30 provides the number of photons emitted per proton (see Fig. 11). If an experimental image of scintillator corresponds to a certain number of photons, the total charge can be derived. These are the protons entering the detection system (arriving to the aluminum filters). Following this method, the results are shown in Fig. 3, which represents the obtained spots and charge estimation for each configuration and with the indicated filters. The values for the charge in the inset of those images indicate the number of protons that arrive to the aluminium in different configurations. The charge entering in the first quadrupole aperture has been estimated by applying the transport efficiency percentages of Table 5 (real spectrum), giving the following values: 8.6 nC (C1 with the 6 MeV filter), 14.70 nC (C1 with the 8 MeV filter), 18.50 nC (C2 with the 10 MeV filter), 13.00 nC (C3 with the 12 MeV filter) and 21.1 nC (C4 with the 14 MeV filter). These results report an initial number of protons of the order of  entering in the first quadrupole aperture. As the distance between the TCC (target chamber center) and PQM1 is 1.5 cm, and the radius of the PQM1 aperture is 2 cm, it can be assumed that all protons leaving the target enter the beamline showing an energy conversion (with respect to the laser energy) of the following percentages: 0.18
 (C1 with the 6 MeV filter), 0.31
 (C1 with the 8 MeV filter), 0.39
 (C2 with the 10 MeV filter), 0.27
 (C3 with the 12 MeV filter) and 0.45
 (C4 with the 14 MeV filter). These numbers are in agreement with respect to the literature that reports similar percentages for our laser conditions with foil targets31,32. The fluctuations of these values, being higher than the calculated percentage of fluctuation in the number of counts (
 10
10 ), are still reasonable, taking into account systematic uncertainties and theoretical approximations.
Fig. 3.
Experimental proton focusing for each Ci with the adequate filters for each energy, charge estimation (a) and spot profiles in X and Y (b) and (c), respectively.
Table 5.
Beamline total distances and transport efficiencies.
| Configuration | Total bline | Transport | Transport |
|---|---|---|---|
| Length (mm) | Efficiency (%) flat spectrum | Efficiency (%) real spectrum | |
| C1 | 338 | 52.09 | 21.6 |
| C2 | 660 | 47.18 | 17.3 |
| C3 | 749 | 42.96 | 14.1 |
| C4 | 779 | 39.78 | 12.1 |
Spot characterization
Figure 3a shows the experimental images of the spots obtained for different configurations and filters. A star-like shape can be observed in cases with thinner filters. This may be due to protons that are defocused because of the chromatic nature of the quadrupoles. Therefore, this shape is more pronounced in Fig. 2a (no filtering) and diminishes in Fig. 3a as the thickness of the filter increases (the threshold energy increases).
The profiles of Fig. 3b,c of the spots in X and Y, respectively, represent the comparison with respect to TSTEP simulations (red) and the results of the measurement (black) in number of protons (both normalized to their integrals). TSTEP results have been filtered according to the threshold values described in Table 4 for each case. Furthermore, a small percentage of the emitted photons are lost inside the scintillator due to optical effects (internal reflections, bulk absorption, boundary absorptions, etc.).
Table 4.
Aluminium thicknesses and calculated thresholds for monoenergetic beams.
| Scintillating | Al thickness | Threshold (MeV) |
|---|---|---|
| Energy (MeV) | (μm) | Energy (MeV) |
| 6 | 200 | 5.2 |
| 8 | 350 | 7.2 |
| 10 | 550 | 9.2 |
| 12 | 770 | 11.1 |
| 14 | 1030 | 13.1 |
Table 2 presents the spot radii (from Fig. 3) calculated by RMS for both the simulations and the experimental results, which are of the same order of magnitude.
Table 2.
Experimental and simulated beam sizes (rms) for each configuration and filter.
| C1-200 | C1-350 | C2-550 | C3-770 | C4-1030 | |
|---|---|---|---|---|---|
 (Sim) [cm] (Sim) [cm] |
0.217 | 0.300 | 0.314 | 0.228 | 0.300 |
 (Exp) [cm] (Exp) [cm] |
0.39±0.08 | 0.39±0.08 | 0.41±0.08 | 0.33±0.07 | 0.38±0.08 |
 (Sim) [cm] (Sim) [cm] |
0.212 | 0.279 | 0.161 | 0.129 | 0.140 |
 (Exp) [cm] (Exp) [cm] |
0.30±0.07 | 0.23±0.08 | 0.26±0.09 | 0.13±0.04 | 0.11±0.04 |
The energy characterization has been performed by a kick scan33 in which, the second quadrupole (X-focusing, see Fig. 1) has been shifted horizontally in 2 mm intervals causing a deflection of the proton beam. Figure 4 shows this scanning process in the x-direction, where these quasi-equidistant deflections can be observed. Note that these results are the real images overlapped to show the relative beam displacements when the quadrupole is shifted.
Fig. 4.
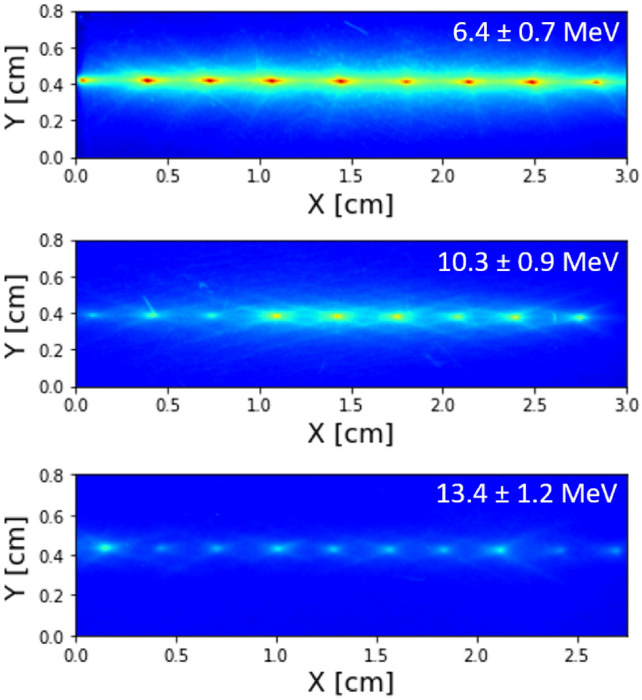
Superimposed images of the relative displacements of the proton beam induced by a 2 mm movement of the second quadrupole. The estimated proton beam energies (from the kick) are indicated in the top right-hand corner of each figure.
Assuming we can neglect non-linear effects (fringe fields or construction errors), the change of direction of the proton beam induced by the horizontal displacement of the second quadrupole is proportional to this displacement of the quadrupole and also proportional to the integrated strength (using the thin lens approach). In turn, this angular change is inducing another displacement (kick) in the third quadrupole. Taking into account these considerations and the corresponding relative distances of the quadrupoles in Table 1 the calculated deflected energies are indicated in each case in Fig. 4. To reach the angular variation the positions of the deflected beam centroids have been averaged taking into account the third quadrupole-detector distance.
These results are totally in agreement with the theoretical MCNP6 simulations for each aluminium filter energy threshold, as shown in Table 4. Also, the demonstrated capability of deflection (scanning) induced by the PQM2 movement can make this system suitable for applications in material science such as imaging, proton beam lithography or writing (p-writing34), proton transfer reaction mass spectrometry35 all of them resolved in space.
Discussion
In this study, a triplet of magnetic lenses has been successfully designed, characterized and experimentally tested with the aim of focusing ultrafast laser driven proton pulses. The achieved spots have dimensions of a few millimeters in the energy range between a few keV and 17.25 MeV. These spots sizes are in range with the requirements of some special radiation therapy treatments setups, in which the required spot size ranges are over 1 cm (eye melanoma36, brain irradiation37, radio-biological research38). The accomplished conditions, together with future improvements, could make the system suitable for certain applications such as PIXE12,39, radio-isotope production40, ultrafast ion implantation41, the study of materials under extreme conditions42 and 3D printing34, to name a few. In addition, future improvements involving a decrease in spot sizes could pave the way for isochoric heating43 applications.
The deflection capability demonstrated by this system can also be applied in scanning processes. In the field of nuclear fusion, such beams can also be used to generate high temperatures and pressures suitable for the activation of a nuclear reaction40,44. Finally, compactness and low cost are other high social impact factors that open up the possibility of implementing and developing these novel sources as devices for routine use.
Methods
Experimental
The first step has been the characterization of the VEGA-3 proton beam before adding the PQM’s system. The energy of the beam has been measured by a Thomson Parabola Spectrometer (TPS), fully developed at CLPU6, with a Micro-Channel Plate (MCP) attached to a phosphor screen to generate an optical signal detectable by a CMOS camera. The TPS electric and magnetic fields deflect the particles from their original trajectories as a function of their charge- mass ratios and energies. The TPS was placed at the end of the beamline before placing the quadrupoles along the beam propagation axis (see Fig. 1). A 200 μm diameter pinhole was coupled to the TPS entrance to select a small beamlet to enter in the TPS. VEGA-3 laser system delivered energetic pulses of 22.8 ± 0.9 J at the target plane, with pulse duration of 230 ± 30 fs (FWHM). The beam was focused onto a 6 μm thick aluminium target by a f/10 off-axis parabolic mirror, achieving a focal spot with a diameter of 14 ± 2 μm FWHM. This focal spot contained 20 of the laser energy, resulting in an averaged intensity of (1.3 ± 0.5)×10
 W/
W/ . The angle of incidence of the laser was chosen to 12° with respect to the target normal plane, and the laser polarization was linear in the plane of incidence. The laser contrast has been measured to be 5×10
 at 0.1 ns.
The experimental procedure has been performed in VEGA-3 Petawatt line inside the interaction chamber, the triplet of PQM’s has been located at a fixed distance of 1.5 cm from TCC to the first PQM element. Fig. 1 represents a simplified diagram of the magnetic elements inside the interaction chamber and the nomenclature for the relative distances. The configuration of the relative distances has been varied as a function of the energy (see Table 1) and the theoretical considerations described in section of this manuscript:
Theoretical considerations for the analysis.
In order to observe the proton spot in the focal plane, a rotary holder of scintillators was placed inside the chamber at the end of the beamline (see Fig. 1). This device holds the scintillators with different aluminium filters allowing remote moving and exchange of different sets. These filter thicknesses have been calculated by MCNP6 software taking into account some considerations described in “Monte Carlo simulations for diagnostics” section.
Some of the holes were filled with Al filters (Table 4) with different thicknesses attached to 100 μm BC-400 scintillator foils. The thicknesses of the Al filters were chosen to enhance luminescence yields of protons of energies: 6, 8, 10, 12 and 14 MeV. In other words, the dimensions of the aluminum foil are those to force the protons of the mentioned energies to deposit their maximum energy (Bragg peak) inside the BC-400. As the scintillators have a fixed thickness of 100 μm, the proton Bragg peak for each energy is located in its center if the proton beam arrives to it (after the Al foils) with integrated energies of 2.5 ± 0.05 MeV (see Fig. 6). In addition one of the holes was filled up by a combination of a layer of 13 μm of Pokalon (polycarbonate) and a 1.5 mm thick scintillator in order to evaluate the shot-to-shot fluctuations of the total transported charge under the same conditions (see “Beam stability and charge estimation” section). Out of the vacuum chamber, a Sigma APO 70–300 mm 1:4–5.6 DG objective coupled to a Mako G234 CMOS sensor were used to image the scintillation. Additionally, these foils act as a high-pass filters with cutoff slightly below the scintillating energy (see Table 4).
Fig. 6.
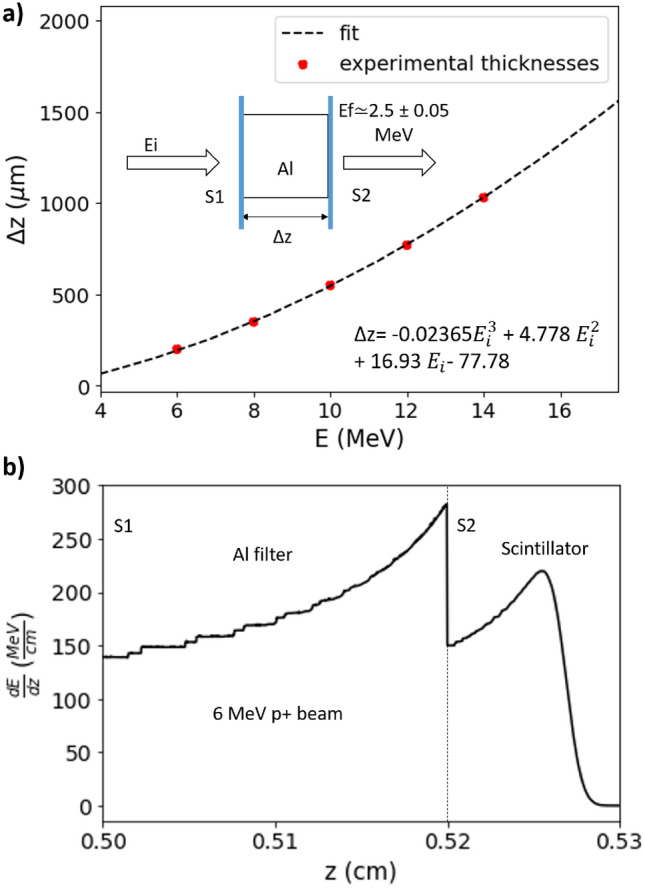
(a) Al filter thicknesses as a function of the incident energy and 3rd order adjustment.  z is the Al thickness (in μm) and Ei represents the incident beam energy (in MeV). (b) Is an example of stopping power MCNP6 simulations in which, a 6 MeV collimated proton beam at 0.5 cm from the Al foil is depositing its full energy in the scintillator after passing through its filter.
Numerical simulations
Theoretical beam dynamics and radiation-transport code simulations have been used in the preparation and analysis phases of the experiment, once the PQM’s were totally assembled (Fig. 1).
The beam dynamics simulations have been performed by particle tracking code named TSTEP (derived from PARMELA45), whereas the energy deposition calculations across depth in filters and scintillators have been simulated with MCNP6 Monte Carlo code during the experimental data analysis.
Magnetic mapping measurements and beam dynamics simulations
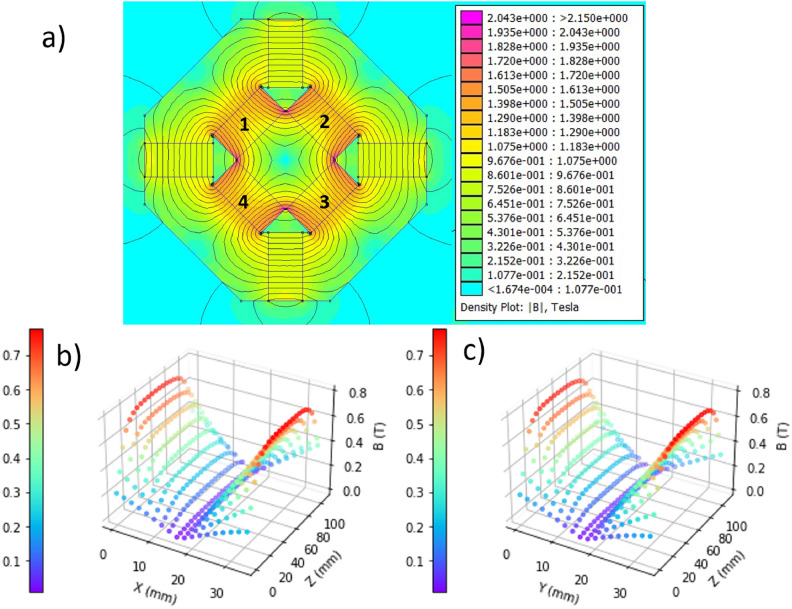
The three quadrupoles have been designed and assembled at CLPU in a home-made system of a single stage. Each quadrupole element is composed by eight N52 neodymium magnets of dimensions 10×4×2 cm glued by an epoxy resin, defining a 4 cm side square aperture covered by a 0.5 cm thick aluminium shielding (see Fig. 1) in order to avoid debris deposition. The shielding has a circular aperture of 4 cm diameter that would act as the first geometrical constraint, joined by the intrinsic beam divergence, in transport efficiency terms. Figure 5a shows the cross section of one of the unshielded quadrupoles, including the field lines simulated by FEMM 4.246. The magnets comprising the quadrupole, labeled 1, 2, 3, and 4, are positioned at 45 to the ground plane to focus in both the X and Y planes (see Fig. 5). A return yoke has been designed and implemented to redirect the field lines. This component is built using four additional magnets and four iron elements.
Fig. 5.
(a) FEMM 4.2 simulation of the Magnetic field density plot of one of the quadrupoles. Measured magnetic field distribution in X (b) and Y (c).
The triplet was attached onto the stage with XYZ independent movement for each quadrupole to simplify the focusing process (see Fig. 1). Once they were built, the magnetic field was measured by a Lakeshore F71 Gaussmeter and probe FP-2X-250-ZS15M (3-axis simultaneous measurement). Fig. 5b,c show the magnetic field profiles in the X and Y directions, respectively, for one of the quadrupoles (PQM3) as an example. Note that for this characterization, the shielding was removed in order to get the maximum number of points including the magnetic field components from the outer parts from the bore of the magnet, or fringe field.
It can be observed A high degree of symmetry. The linearity of the transverse profiles (X and Y), shown in Fig. 5 indicates that the magnetic scalar potential has hyperbolic tendency47. In addition, the symmetric slopes on the projected Z-profiles indicate uniformity in the magnetic field gradient with a maximum value of 45.67 T/m), which is decisive for the focused beam quality47.
The TSTEP particle tracking code is typically used in the conventional accelerator community and allows for calculating particle trajectories through segments and entire transport beamlines. Each PQM element can be implemented in TSTEP either by introducing predefined ideal cases or by directly inputting a 3D spatial mesh of magnetic field values. For this set of simulations, the 3D maps measurements of the “in-house” assembled quadrupole described in this section have been implemented.
Taking into account the physical constraints given by the reciprocal quadrupole magnetic attraction, an initial minimum distance between the quadrupoles of around 4.5–5 cm has been considered.
As a starting point for estimating the distances between the PQMs, we use a uniform proton beam energy distribution with a Gaussian-like spot shape for the x and y coordinates (12 μm FWHM) and divergence of the order of:  ,
,  , and
, and  centered on different energies: 5–7–10 MeV (respectively) have been used. As it is known, many factors such as the intrinsic divergence of the initial proton beam8, as well as the distance between the quadrupoles can influence the final proton transport efficiency48, hence different sets of TSTEP simulations have been performed in order to find optimum conditions in terms of detector positioning and quadrupole relative distances.
The TSTEP calculations allowed to find a good starting point for PQM elements positioning, taking into account our spatial constraints and beam characteristics. Therefore, at the beginning of the experiment, an initial distance of few tens of cm between the exit of the PQM3 and the detector has been considered. These distances were subsequently adjusted to optimize the focusing for different beam energies (see Table 1). The final distances are comparable to those obtained in ref49 where a similar setup was used.
Monte Carlo simulations for diagnostics
In the preparation phase of the diagnostic, a central issue is estimating the energy deposition in the scintillators, calculating the number of photons emitted per proton and characterizing the beam charge before and after transport. The Monte Carlo code MCNP629 has been used to estimate the thicknesses of high-pass Al filters to characterize the beam by energy intervals.
The proton energy deposition has been simulated spatially in both the aluminium and the scintillator, as MCNP6 offers a function for dose reconstructions over the problem geometry (TMESH tally 3). An example of these results is shown in Fig. 6b, which represents the stopping power as a function of the depth.
When a proton beam arrives at a scintillating material, it loses energy leading to electronic excitations of the fluorescent groups of the molecules30. These states relax to the ground level through a radiative de-excitation process (fluorescence), generally in the UV and visible ranges (the scintillator maximum wavelength emission is located at 423 nm, see Table 3 of properties). The BC-400 polymer structure also exhibits similarities to water and human tissues50 and is stable, making it a perfect diagnostic tool for high-repetition-rate HRR. Another advantage is its transparency, which facilitates light to reach the detector.
Table 3.
BC-400 properties.
| Property | Value |
|---|---|
| Base | PVT |
| Density |  |
| Refractive index | n=1.58 |
| Softening point | 70 C C |
| Light Output (% of Anthracene) | 65% |
| Rise time | 0.9 ns |
| Decay time | 2.4 ns |
| Wavelength max emission | 423 nm |
| Bulk light attenuation length | 250 cm |
In terms of luminescence yield, scintillators show linearity with respect to the deposited energy in the case of electrons51. For heavy ions and protons the emission yield is described by Birks Law (equation 1), which relates the luminescence yield  (number of emitted photons per cm), with the proton energy deposition during its path
  . This expression shows how the linearity in the number of emitted photons is no longer conserved at higher deposited energy values (spatially located according to the Bragg Peak Range) due to the saturation of luminescent centers; this phenomenon is referred to as the quenching effect51. The parameter k is the Birks constant (that can be expressed in
  or cm/MeV) which parametrizes quenching effect, and S is the scintillation efficiency (expressed in number of photons per MeV and sr). This scintillator was previously calibrated by the CLPU team at the Centro de Micro-Análisis de Materiales (CMAM) in Madrid in a proton accelerator52, the characterization provided the following values: k =
  cm/MeV and S = 200 Ph/(MeV.sr).
 |
1 |
First, the constant and established parameter for the MCNP6 simulations has been the thickness of the BC-400 foil, which has a mean value of 100 μm. Following the continuous slow down approximation (CSDA) from proton stopping power database p-STAR (NIST)53, the Bragg peak Range (BPR) calculation of protons with 2.5 MeV in plastic scintillators based on vinyltoluene is over 104.46 μm. Therefore, a maximum integrated energy of 2.5 MeV (calculated by means of MCNP6 tally F1) has been established to determine the aluminum thicknesses, ensuring that all protons are completely stopped and release all their energy inside the scintillator, which is broader than the resulting BPR (see example in Fig. 6b). In the initial phase, the MCNP6 set of simulations has been performed with monoenergetic and collimated beams of energies from 4 to 20 MeV, in 1 MeV steps for the Al filters thicknesses configurations. MCNP6 Tally F1 (current or energy integrated over a surface) has been applied to those beams until the Al thicknesses allow an integrated energy of 2.5 ± 0.05 MeV passing through the rear surface of the Al foil, S2 in the inset of Fig. 6a. The values of Al thicknesses for this condition have been adjusted in a third order polynomial (see Fig. 6a).
In addition, MCNP6 gives the particle transmission percentage that ranges from 99.98% (4 MeV protons with a 65 μm filter ) to 94.06% (20 MeV protons with a 1985 μm) due to the BP straggling at high energies54 if the adjustment in Fig. 6a is applied. Nevertheless, thickness values have been adjusted to the available aluminum foils and their possible combinations in a multilayered structure (if needed). Thicknesses final values, energy threshold and scintillating energies are summarized in Table 4.
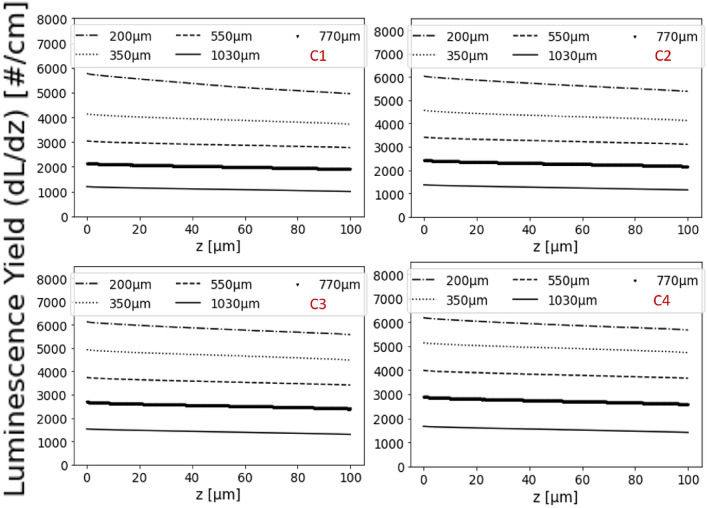
The notable effect occurs when non-monochromatic beams release all their energy in the scintillator. The superposition of the Bragg Peaks results in an almost flat energy deposition (as a function of the penetration in the scintillator) and, as a consequence, almost constant luminescence yield. For this reason, and the small thickness of the scintillator, the light emission can be considered as spatially homogeneous in the scintillator volume (Fig. 10). This will provide the number of emitted photons per proton and thus the application of Birks law and its integration can be considered independent of the emission wavelength.
Fig. 10.
Luminescence yield per incident proton in the 100 μm thick scintillator as a function of the aluminum filter thicknesses for each PQM configuration.
Theoretical considerations for the analysis
The particle tracking simulator TSTEP enables the possibility to include 3D maps of the elements, that compose transport beamlines. A measurement of the proton spectra has also been provided (see Fig. 1a), using TPS. The spectrum has the classical profile (ref26 and references therein), broad and quasi-Maxwellian shape, with an energy cutoff at 17.25 MeV.
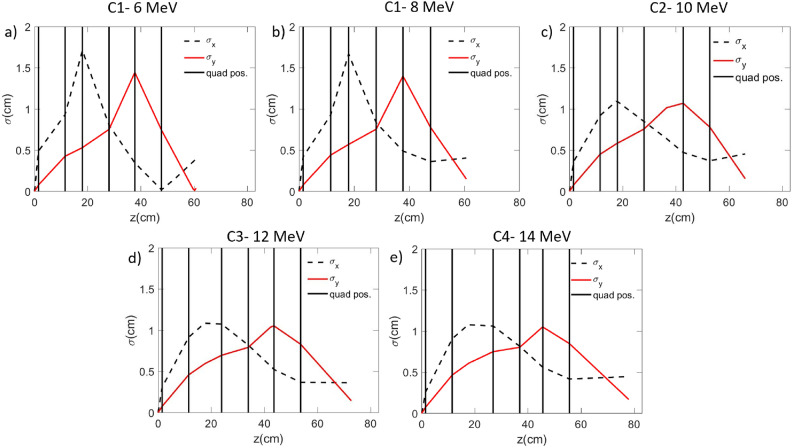
An accurate 3D map of each quadrupole (Fig. 5) has been measured and has been inserted in a new set of TSTEP simulations, in which the different experimental configurations have been reproduced, respecting the distances and the quadrupole orientation indicated in Table 1. The results of these simulations for mono-energetic cases, according to these distances are represented in Fig. 7. The corresponding divergences calculated from equation (2) are: 15.5 , 14
, 14 , 12.5
 , 11
, 11 , 9.5
, 9.5 for energies 6, 8, 10, 12 and 14 MeV, respectively.
Fig. 7.
Beam envelopes representation related to the different quadrupole configurations, using as input mono-energetic beams of 6 MeV (a), 8 MeV (b), 10 MeV (c), 12 MeV (d), 14 MeV (e) with divergences of 15.5 , 14
, 14 , 12.5
  ,11
,11 ,9.5
,9.5 , respectively.
A flat proton uniform distribution with Gaussian shape for x and y coordinates with a size of 12 μm (FWHM) and an energy interval centered on 10 MeV that spans from few keV up to maximum 19.8 MeV has been used as input. As it is known, the typical laser generated proton beams are characterized by an energy dependency as function of the divergence7,8. The opening angle decreases with the proton energy and this dependency can be described by parabolic or linear functions according to the different laser systems55, i.e. laser parameters. These beam properties have been modelled with T-STEP accounting for the characteristics of proton trajectories after the TNSA acceleration stage. No space-charge effects have been considered during the long flight through the line as the beam is neutral in space-charge due to the co-moving electrons56. In a typical TNSA proton spectra, the half opening angle of the proton cone is of the order of 15–20 57 and protons with high energies are emitted with a small angle of 5
 8. Hence, according to these considerations, we used the following linear approximation (expression 2):
 |
2 |
where E is the energy, A=  is the negative linear coefficient, whose value depends on the minimum and maximum half angles, that are respectively
  =5
=5 and
and  = 20
= 20 , whereas
  MeV.
MeV.
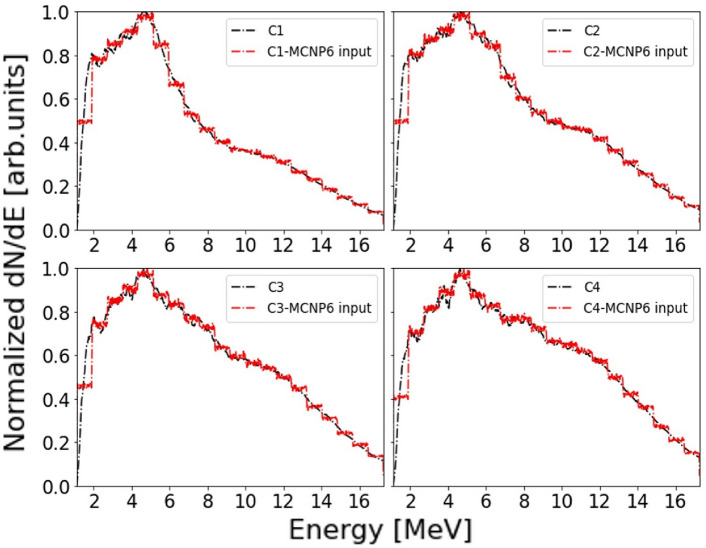
The TSTEP software propagates the proton trajectories along the quadrupoles, allowing to predict the transport efficiency of the line (Table 5). Introducing an uniform distribution, one easily obtain the pure transfer function as the output/input ratio (Fig. 8). This function can be used to calculate the proton spectra exiting the transport line and, consequently, the transport efficiency. Taking all these considerations into account, the value of the normalized emittance is 0.0765 mm-mrad, which is consistent with those reported in the literature for this type of sources56. Figure 9 (black lines) shows the output spectra obtained by applying the transfer function to the TPS spectra (1a). Thus, the transport efficiencies of the actual case have been calculated and shown in Table 5 for the real spectrum. The estimated relative distances between the PQM’s were adjusted during the experiment resulting on the experimental values of Table 1 that will be hereafter the parameters defining the experimental configurations C1, C2, C3 and C4.
Fig. 8.
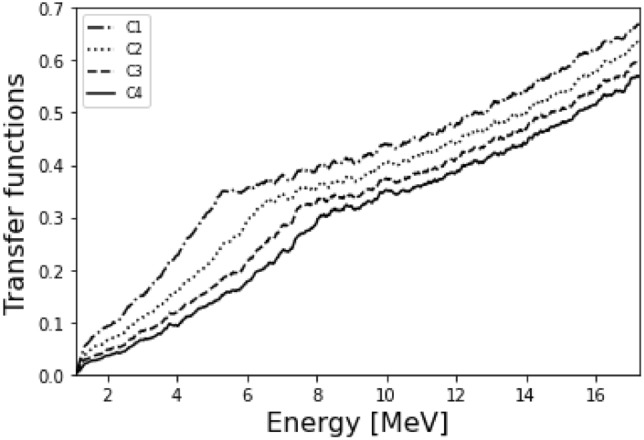
Transfer function of each configuration (summarized in Table 1).
Fig. 9.
Calculated normalized energy spectra of the protons exiting the quadrupole line. These spectra were calculated applying the transfer function to the experimental TPS spectra. Black line represents the exit spectrum and red line represents the corresponding 20-bin histogram introduced in TSTEP.
The values of transport efficiencies, as expected, decrease with the increasing of the total transport beamline length (see Table 5) and the positive slopes of the transfer functions of Fig. 8 depend on the proton divergence. One can observe in Fig. 8 how the transfer function also depends on the PQM’s configuration.
Figure 9 (black lines) shows the predicted spectra exiting the line. They show a two-component structure located at 5 and 11 MeV. Their relative intensities depend on the PQM’s configuration. These distributions have in turn been used as the MCNP6 inputs, as a 20-bin sampled histogram (red line in Fig. 9).
Black lines represents the TSTEP output proton spectrum at the detector position. The sampling error induced by binning process has been calculated as 0.54 in C1, 0.44
 in C2, 0.87
 in C3 and 1.2
 in C4. These variations mainly occur in the low energy range in which, the protons are going to be stopped inside the aluminium without contributing to the luminescence. These distributions will act as the initial spectra for the MCNP6 simulation sets where, the energy deposited in the scintillator after passing through the filters will be estimated.
The MCNP6 input beam is collimated maximizing in our estimation the number of photons per proton as in the reality, the different energy bunches arriving to the detection system have non zero values of angular divergence after the transport so during their paths the energy deliverance in the scintillator decreases as more particles are stopped inside the filters. This would result in a decrement of the dose delivery in the scintillator. The range of uncertainty was evaluated by setting the hypothetical situation of the sources with 20 of half angular dispersion at 1 cm from the filter simulating a defocused scenario. The deviation in the number of photons per proton is about the 0.1
 lower in those cases.
The TSTEP output spectra have been used as input for MCNP6 to calculate the deposited energy on the scintillators. In this way, the number of photons per proton by direct application and integration of Birks law can be predicted. Fig. 10 represents the light yield as a function of the depth in the scintillator for every PQM configuration and Al filter thicknesses. Integrating those curves one obtains the total number of emitted photons per incident proton for all the cases. Total emitted photons are shown in Fig. 11. Once the total number of photons per proton is known, one can use it to obtain the experimental proton density map on the scintillator. Another fact to consider is the self-absorption of light within the material, according to the factory specifications. Our scintillator is four orders of magnitude thinner so that we can suppose a negligible self-absorption fraction.
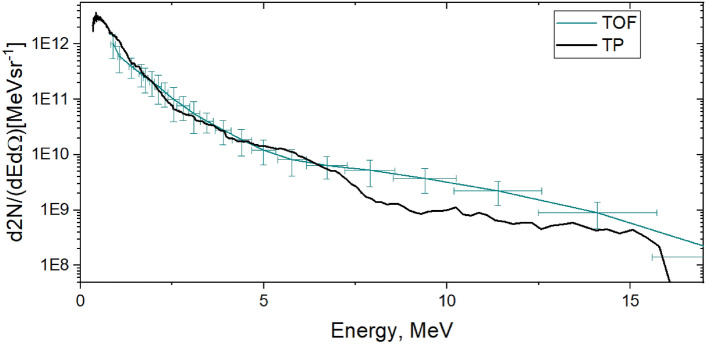
Figure 12 shows a typical TNSA spectra in VEGA-3 with the same conditions27,58. The spectra are obtained in a Time-Of-flight (TOF) and Thomson Parabola (TP) configuration installed at slightly different angles of observation. TOF was equipped with a diamond detector shielded by the 10-μm Al filter to stop carbon ions with energies up to 11.5 MeV. The calibration of the TP used and more details can be found in the satellite paper 27. The total charge resulting from each integration is of 34.2±16.4 nC (TOF) and 33±16.5 nC (TPS). These values are in agreement (within the uncertainty) with the obtained values (reported in “Results” section) in the scintillators of Fig. 3 if the transport efficiencies of Table 5 are applied.
Fig. 12.
TOF and TPS typical spectra of protons generated by VEGA-3 in absolute units. TPS spectrum is averaged by 50 shots in similar experimental conditions 27. The error bars of TPS are not indicated since they are the same level as for the TOF diagnostics.
Acknowledgements
The authors acknowledge the financial support of the Junta de Castilla y León grant no. CLP263P20. The authors also acknowledge the support of the Ministry of Science, Innovation and Universities of the Government of Spain and the University of Salamanca.
Author contributions
T.C.R designed the detection system and analyzed the results with J.A.A and C.S.L, E.F and J.A.A characterized the proton beam, T.C.R and L.V and performed the MCNP6 simulations, D.D.L designed and tested the magnetic components and the quadrupoles with G.G, G.G and A.C conceived the experiment, A.C, J.A and G.G conducted the experiment, G.G and A.M perform the TSTEP simulations. M.D.R.F, L.V, and G.G have been the scientific advisors. All authors reviewed the manuscript.
Data availability
Data is provided within the manuscript and the supplementary information files located in the following link: https://osf.io/w6vrx/.
Declarations
Competing interests
The authors declare no competing interests.
Footnotes
Publisher's note
Springer Nature remains neutral with regard to jurisdictional claims in published maps and institutional affiliations.
References
- 1.Fuchs, J., Audebert, P., Borghesi, M., Pépin, H. & Willi, O. Laser acceleration of low emittance, high energy ions and applications. C. R. Phys.10, 176–187 (2009). [Google Scholar]
- 2.Dromey, B. et al. Picosecond metrology of laser-driven proton bursts. Nat. Commun.7, 10642 (2016). [DOI] [PMC free article] [PubMed] [Google Scholar]
- 3.Ziegler, T. et al. Laser-driven high-energy proton beams from cascaded acceleration regimes. Nat. Phys. 1–6 (2024).
- 4.Volpe, L. et al. Generation of high energy laser-driven electron and proton sources with the 200 tw system vega 2 at the centro de laseres pulsados. High Power Laser Sci Eng7, e25. 10.1017/hpl.2019.10 (2019). [Google Scholar]
- 5.Huault, M. et al. A 2d scintillator-based proton detector for high repetition rate experiments. High Power Laser Sci Eng7, e60. 10.1017/hpl.2019.43 (2019). [Google Scholar]
- 6.Salgado-López, C. et al. Angular-resolved Thomson parabola spectrometer for laser-driven ion accelerators. Sensors22, 3239 (2022). [DOI] [PMC free article] [PubMed] [Google Scholar]
- 7.Macchi, A., Borghesi, M. & Passoni, M. Ion acceleration by superintense laser-plasma interaction. Rev. Mod. Phys.85, 751 (2013). [Google Scholar]
- 8.Daido, H., Nishiuchi, M. & Pirozhkov, A. S. Review of laser-driven ion sources and their applications. Rep. Progress Phys75 (2012). [DOI] [PubMed]
- 9.Milluzzo, G., Petringa, G., Catalano, R. & Cirrone, G. Handling and dosimetry of laser-driven ion beams for applications. Eur. Phys. J. Plus136, 1170 (2021). [Google Scholar]
- 10.Cirrone, G. A. et al. ELIMED: A new hadron therapy concept based on laser driven ion beams. In Laser Acceleration of Electrons, Protons, and Ions II; and Medical Applications of Laser-Generated Beams of Particles II; and Harnessing Relativistic Plasma Waves III, vol. 8779, pp. 216–225 (SPIE, 2013).
- 11.Hughes, J. R. & Parsons, J. L. Flash radiotherapy: Current knowledge and future insights using proton-beam therapy. Int. J. Mol. Sci.21, 6492 (2020). [DOI] [PMC free article] [PubMed] [Google Scholar]
- 12.Puyuelo-Valdes, P. et al. Combined laser-based x-ray fluorescence and particle-induced x-ray emission for versatile multi-element analysis. Sci. Rep.11, 9998 (2021). [DOI] [PMC free article] [PubMed] [Google Scholar]
- 13.Passoni, M., Fedeli, L. & Mirani, F. Superintense laser-driven ion beam analysis. Sci. Rep.9, 9202 (2019). [DOI] [PMC free article] [PubMed] [Google Scholar]
- 14.Ter-Avetisyan, S., Schnürer, M., Polster, R., Nickles, P. & Sandner, W. First demonstration of collimation and monochromatisation of a laser accelerated proton burst. Laser Part. Beams26, 637–642 (2008). [Google Scholar]
- 15.Nishiuchi, M. et al. Focusing and spectral enhancement of a repetition-rated, laser-driven, divergent multi-mev proton beam using permanent quadrupole magnets. Appl. Phys. Lett.94, 061107 (2009). [Google Scholar]
- 16.Brandi, F. et al. A few mev laser-plasma accelerated proton beam in air collimated using compact permanent quadrupole magnets. Appl. Sci.11, 6358 (2021). [Google Scholar]
- 17.Li, D. et al. Introduction of research work on laser proton acceleration and its application carried out on compact laser–plasma accelerator at Peking University. In Photonics, vol. 10, p. 132 (MDPI, 2023).
- 18.Brack, F.-E. et al. Spectral and spatial shaping of laser-driven proton beams using a pulsed high-field magnet beamline. Sci. Rep.10, 9118 (2020). [DOI] [PMC free article] [PubMed] [Google Scholar]
- 19.Toncian, T. et al. Ultrafast laser-driven microlens to focus and energy-select mega-electron volt protons. Science312, 410–413 (2006). [DOI] [PubMed] [Google Scholar]
- 20.Yang, T. et al. Designing of active plasma lens for focusing laser-plasma-accelerated pulsed proton beams. Phys. Rev. Accel. Beams24, 031301 (2021). [Google Scholar]
- 21.Nakamura, S. et al. High-quality laser-produced proton beam realized by the application of a synchronous RF electric field. Jpn. J. Appl. Phys.46, L717 (2007). [Google Scholar]
- 22.Chen, S. N. et al. Monochromatic short pulse laser produced ion beam using a compact passive magnetic device. Rev. Sci. Instrum.85, 043504. 10.1063/1.4870250 (2014). [DOI] [PubMed] [Google Scholar]
- 23.Schillaci, F. et al. The ELIMAIA laser-plasma ion accelerator: Technological commissioning and perspectives. Quantum Beam Sci.6, 30 (2022). [Google Scholar]
- 24.Margarone, D. et al. ELIMAIA: A laser-driven ion accelerator for multidisciplinary applications. Quantum Beam Sci.2, 8 (2018). [Google Scholar]
- 25.Li, D. et al. Applications of compact laser plasma accelerator (CLAPA) beamline in Peking University. In 10th Int. Particle Accelerator Conf. (IPAC’19), Melbourne, Australia, 19–24 May 2019, 3676–3678 (JACOW Publishing, 2019)
- 26.Apiñaniz, J. et al. A quasi-monoenergetic short time duration compact proton source for probing high energy density states of matter. Sci. Rep.11, 6881 (2021). [DOI] [PMC free article] [PubMed] [Google Scholar]
- 27.Pérez-Hernández, J. A. Vega-3 commissioning. submitted soon (2024).
- 28.Yuan, D. et al. Light output enhancement of scintillators by using mixed-scale microstructures. Opt. Express29, 24792–24803. 10.1364/OE.432114 (2021). [DOI] [PubMed] [Google Scholar]
- 29.Werner, C. J. et al. MCNP User’s Manual Code Version 6.2. Tech. Rep. LA-UR-17-29981, Los Alamos National Laboratory, Los Alamos, NM, USA (2017).
- 30.Birks, J. B. Scintillations from organic crystals: Specific fluorescence and relative response to different radiations. In Proceedings of the Physical Society. Section A, vol. 64, p. 874. 10.1088/0370-1298/64/10/303 (1951).
- 31.Fuchs, J. et al. Laser-driven proton scaling laws and new paths towards energy increase. Nat. Phys.[SPACE]10.1038/nphys199 (2006). [Google Scholar]
- 32.Rodrigues, M. R. D. et al. Radioisotope production using lasers: From basic science to applications. Matter Radiat. Extremes9, 037203. 10.1063/5.0196909 (2024). [Google Scholar]
- 33.Schaumann, M. et al. The effect of ground motion on the LHC and HL-LHC beam orbit. Nucl. Instrum. Methods Phys. Res. Sect. A1055, 168495. 10.1016/j.nima.2023.168495 (2023). [Google Scholar]
- 34.Van Kan, J., Bettiol, A. & Watt, F. Three-dimensional nanolithography using proton beam writing. Appl. Phys. Lett.83, 1629–1631 (2003). [Google Scholar]
- 35.Blake, R. S., Monks, P. S. & Ellis, A. M. Proton-transfer reaction mass spectrometry. Chem. Rev.109, 861–896 (2009). [DOI] [PubMed] [Google Scholar]
- 36.Sutherland, K. et al. A parameter study of pencil beam proton dose distributions for the treatment of ocular melanoma utilizing spot scanning. Radiol. Phys. Technol.3, 16–22. 10.1007/s12194-009-0071-4 (2010). [DOI] [PubMed] [Google Scholar]
- 37.Chaudhary, P. et al. Radiobiology experiments with ultra-high dose rate laser-driven protons: Methodology and state-of-the-art. Front. Phys.10.3389/fphy.2021.624963 (2021). [Google Scholar]
- 38.Bin, J. et al. A laser-driven nanosecond proton source for radiobiological studies. Appl. Phys. Lett.101, 243701. 10.1063/1.4769372 (2012). [Google Scholar]
- 39.Barberio, M. et al. Laser-generated proton beams for high-precision ultra-fast crystal synthesis. Sci. Rep.7, 12522 (2017). [DOI] [PMC free article] [PubMed] [Google Scholar]
- 40.Tayyab, M., Bagchi, S., Moorti, A. & Chakera, J. A. Experimental investigation on nuclear reactions using a laser-accelerated proton and deuteron beam. Plasma Phys. Controll. Fusion61, 115007. 10.1088/1361-6587/ab4339 (2019). [Google Scholar]
- 41.Torrisi, L. et al. An unconventional ion implantation method for producing Au and Si nanostructures using intense laser-generated plasmas. Plasma Phys. Controll. Fusion58, 025011 (2016). [Google Scholar]
- 42.Barberio, M. et al. Laser-accelerated particle beams for stress testing of materials. Nat. Commun.9, 372 (2018). [DOI] [PMC free article] [PubMed] [Google Scholar]
- 43.Patel, P. et al. Isochoric heating of solid-density matter with an ultrafast proton beam. Phys. Rev. Lett.91, 125004 (2003). [DOI] [PubMed] [Google Scholar]
- 44.Margarone, D. et al. In-target proton-boron nuclear fusion using a PW-class laser. Appl. Sci.12, 1444 (2022). [Google Scholar]
- 45.Young, L. M. Tstep. LANL Report LA-UR-96-1835 (1996).
- 46.Meeker, D. Femm 4.2 electrostatics tutorial1 (2006).
- 47.Teotia, V., Malhotra, S., Mishra, E. & Kumar, P. Design, development and characterization of tunable permanent magnet quadrupole for drift tube linac. Nucl. Instrum. Methods Phys. Res. Sect. A982, 164528 (2020). [Google Scholar]
- 48.Romano, F. et al. The ELIMED transport and dosimetry beamline for laser-driven ion beams. Nucl. Instrum. Methods Phys. Res. Sect. A829, 153–158 (2016). [Google Scholar]
- 49.Tramontana, A. A. et al. (JACOW 2015) 2515–2518 (2015).
- 50.Torrisi, L. Plastic scintillator investigations for relative dosimetry in proton-therapy. Nucl. Instrum. Methods Phys. Res. Sect. B170, 523–530 (2000). [Google Scholar]
- 51.O’Rielly, G., Kolb, N. & Pywell, R. The response of plastic scintillator to protons and deuterons. Nucl. Instrum. Methods Phys. Res. Sect. A368, 745–749. 10.1016/0168-9002(95)00671-0 (1996). [Google Scholar]
- 52.Redondo-Cubero, A. et al. Current status and future developments of the ion beam facility at the centre of micro-analysis of materials in Madrid. Eur. Phys. J. Plus136, 1–16 (2021). [Google Scholar]
- 53.Berger, M. J. ESTAR, PSTAR, AND ASTAR: Computer programs for calculating stopping-power and range tables for electrons, protons and helium ions (version 1.2. 2). http://physics.nist.gov/Star (1999).
- 54.Hollmark, M., Uhrdin, J., Belkic, D., Gudowska, I. & Brahme, A. Influence of multiple scattering and energy loss straggling on the absorbed dose distributions of therapeutic light ion beams: I. Analytical pencil beam model. Phys. Med. Biol.49, 3247. 10.1088/0031-9155/49/14/016 (2004). [DOI] [PubMed] [Google Scholar]
- 55.Roth, M. & Schollmeier, M. Ion acceleration-target normal sheath acceleration. Tech. Rep., CERN (2017).
- 56.Nürnberg, F. et al. Radiochromic film imaging spectroscopy of laser-accelerated proton beams. Rev. Sci. Instrum.80 (2009). [DOI] [PubMed]
- 57.Ter-Avetisyan, S. et al. Tomography of an ultrafast laser driven proton source. Phys. Plasmas17 (2010).
- 58.Salvadori, M. et al. Time-of-flight methodologies with large-area diamond detectors for the effectively characterization of tens mev protons. J. Instrum.17, C04005 (2022). [Google Scholar]
Associated Data
This section collects any data citations, data availability statements, or supplementary materials included in this article.
Data Availability Statement
Data is provided within the manuscript and the supplementary information files located in the following link: https://osf.io/w6vrx/.


