Abstract
Objective
To assess the diagnostic performance of FFDM-based and DBT-based radiomics models to differentiate breast phyllodes tumors from fibroadenomas.
Methods
192 patients (93 phyllodes tumors and 99 fibroadenomas) who underwent mammography were retrospectively enrolled. Radiomic features were respectively extracted from FFDM and the clearest slice of DBT images. A least absolute shrinkage and selection operator (LASSO) regression was used to select radiomics features. A combined model was constructed by radiomics and radiological signatures. Machine learning classification was done using logistic regression based on radiomics or radiological signatures (clinical model). Four radiologists were tested on phyllodes tumors and fibroadenomas with and without optimal model assistance. The area under the receiver operating characteristic (ROC) curve (AUC) was computed to assess the performance of each model or radiologist. The Delong test and McNemar's test were performed to compare the performance.
Results
The combined model yielded the highest performance with an AUC of 0.948 (95%CI: 0.889-1.000) in the testing set, slightly higher than the FFDM-radiomics model (AUC of 0.937, 95%CI: 0.841-0.984) and the DBT-radiomics model (AUC of 0.860, 95%CI: 0.742-0.936) and significantly superior to the clinical model (AUC of 0.719, 95%CI: 0.585-0.829). With the combined model aid, the AUCs of four radiologists were improved from 0.808 to 0.914 (p=0.079), 0.759 to 0.888 (p=0.015), 0.717 to 0.846 (p=0.004), and 0.629 to 0.803 (p=0.001).
Conclusion
Radiomics analysis based on FFDM and DBT shows promise in differentiating phyllodes tumors from fibroadenomas.
Keywords: phyllodes tumor, fibroadenomas, full-field digital mammography (FFDM), digital tomosynthesis (DBT), radiomics
Introduction
Phyllodes tumor (PT), composed of epithelial and stromal components, is a rare breast tumor accounting for less than 1% of female tumors. Pathologically, PTs can be classified as benign, borderline, or malignant. 1 Fibroadenoma (FA), another type of fibroepithelial tumor, is the most common benign breast tumor in women. Despite both being fibroepithelial tumors, PT and FA require different clinical managements, with PT often necessitating wider local excision.2,3 Although Core Needle Biopsy (CNB) has been used to differentiate PTs from FAs, it occasionally fails to do so.4–6 The precise differentiation between PTs and FAs prior to surgery can assist clinicians in making informed decisions; therefore, imaging examinations are necessary as they provide a comprehensive depiction of the tumors. Mammography and ultrasonography are the most commonly used imaging modalities. Compared with full-field digital mammography (FFDM), digital breast tomosynthesis (DBT) can improve the detection rate of masses and more clearly observe the margin of masses by reducing the overlap of fibroglandular tissue. Previous studies have shown that while traditional imaging techniques such as FFDM, DBT, ultrasonography, and magnetic resonance imaging (MRI) can partially distinguish between PTs and FAs, they sometimes struggle due to overlapping imaging features.2,5,7–11
Radiomics is a relatively new field of research involving extracting and analyzing several metrics from medical images to develop predictive or prognostic models.12,13 Radiomic features involve semi-quantitative and quantitative features, such as shape, size, and gray-scale intensity, which are invisible to radiologists but reflect the microstructures of tissue in vivo. 14 Radiomics analysis has been applied in multiple clinical areas, such as lesion differentiation between benign and malignant tumors of breasts,15,16 treatment response to neoadjuvant chemotherapy,14,17,18 and the prediction of axillary lymph-node metastasis. 19
Recent studies have used radiomics analysis to differentiate FAs from PTs, and some have shown promising results.20–22 Tsuchiya M et al reported that a MRI-radiomics model yielded an area under curve (AUC) of 0.96. 20 Despite the encouraging results, MRI has not been widely used because it is expensive, time-consuming, and has some contraindications (for instance, it should not be used by claustrophobic patients). Instead, mammography has become the first choice for screening breast cancer due to its convenience, quickness, and relative affordability. In a study by Cui et al, texture features were found to improve the diagnostic efficiency of mammograms in differentiating PTs G1/G2/G3. 23 Similarly, the microscopic information present in mammograms has enormous potential to differentiate PTs from FAs. To our knowledge, there are few studies yet using radiomics to distinguish PTs from FAs using FFDM and DBT modalities. Thus, we attempted to compare the performance of FFDM-based and DBT-based radiomics features in distinguishing PTs from FAs, and the optimal model was selected to evaluate its auxiliary diagnostic value.
Materials and Methods
Our study was approved by the Medical Ethics Committee of Nanfang Hospital of Southern Medical University, and the requirement for informed consent was waived because of its retrospective nature (approval number: NFEC-2024-222). The reporting of this study conforms to TRIPOD guidelines. 24
Patient Cohort
Patients with histologically confirmed PTs or FAs were retrospectively enrolled. 93 patients with a diagnosis of PT from January 2014 to June 2022 and 99 patients with a diagnosis of FA from January 2016 to January 2018 were consecutively recruited.
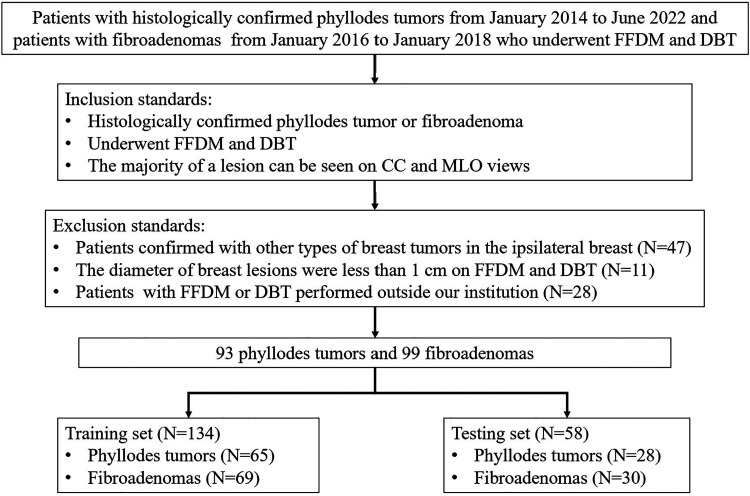
The inclusion standards were as follows: (1) female patients with pathologically confirmed phyllodes tumors or fibroadenomas; (2) patients who had performed FFDM and DBT within 1 month before any surgical operation; (3) the majority of a lesion can be seen on craniocaudal(CC) and mediolateral oblique (MLO) mammographic views. The exclusion standards were (1) patients confirmed with other types of breast tumors in the ipsilateral breast before or simultaneously; (2) the diameter of breast lesions were less than 1 cm on FFDM and DBT; (3) patients with FFDM or DBT performed outside our institution.
Data Acquisition
Breast mammography was performed using a Hologic scanner (Hologic Selenia Dimensions, HOLOGIC, USA). The Hologic system utilized in this study acquires 15 low-dose DBT images over 15 degrees under the same compression as FFDM acquisition. The mammography images were reconstructed with 1mm intersection spacing to generate a three-dimensional view of the breast tissues. The voltage on the X-ray tubes ranges from 20.0 to 49.0 kV, reconstruction time: 2.0–5.0 s, nominal power: 3.0 kW, current time range: 300–400 m As, scanning time<4.0 s. The CC and MLO views were obtained for each patient.
BI-RADS Signatures on Mammography
Based on the Breast Imaging Reporting and Data System (BI-RADS-version 5), two experienced radiologists with over 10 years of breast image interpretation experience independently assessed the radiological features. For the inconsistent results, they would be discussed and reached a consensus. Mammography signatures included maximum diameter, mass shape, mass margins, mass density, and internal calcifications.
Region of Interest (ROI) Segmentation and Feature Extraction
ROI segmentation was performed using open-source software ITK-SNAP (Ver. 3.8.0, https://www.itk-snap.org/) by a radiologist with 5 years of experience in breast imaging. ROIs were manually drawn with lesions on the FFDM and the clearest slice of DBT in two views. The ROIs were then validated by a senior radiologist with eight years of experience in breast imaging. A cohort of 50 lesions of these cases was randomly selected and re-delineated by another radiologist with 10 years of experience. The inter-reader consistency of the two outlined features was calculated. Next, excluding the features with intraclass correlation coefficients (ICC) less than 0.80 can enhance the repeatability of the included features, make the model more stable, and reduce the impact of inconsistent lesion delineation on model performance.
Radiomics features were extracted with a Python-based pyradiomics package (Ver 3.0.1, available at http://www.radiomics.io/pyradiomics.html). 1023 radiomics features were respectively extracted from each view of FFDM and DBT, which included 324 first order features, 432 gray level co-occurrence matrix (GLCM) features, 252 gray level dependence matrix (GLDM) features, 288 gray level run length matrix (GLRLM) features, 288 gray level size zone matrix (GLSZM) features and 90 neighboring gray-tone difference matrix (NGTDM) features.
Feature Selection and Model Construction
Patients were randomly allocated into a training set (n =134) and a testing set (n =58) according to a ratio of 7:3. All the radiomics features based on FFDM and DBT were analyzed, respectively. After excluding the features with ICC less than 0.80 and feature variance lower than 0.10, the feature selection process included variance threshold and the least absolute shrinkage and selection operator (LASSO), followed by a sequential feature selector (SFS). BI-RADS signatures only contain the former two steps. The above feature selection processes were carried out in the training cohort. A 10-fold grid search was used in the training set to gain the optimal parameter. The machine learning model was built on the python-based scikit-learn package (Ver. 0.24.2).
We chose logistic regression (LR) as the only classifier for radiomics models based on FFDM or DBT and clinical models based on BI-RADS signatures. The models were evaluated by the AUC, accuracy, sensitivity, and specificity. The AUC values were used to compare the predictive ability of FFDM-based radiomics model and DBT-based radiomics model. The combined model was constructed with radiomics features based on the optimal radiomics model and BI-RADS signatures in clinical model. Calibration curves were applied to analyze the performance of the best model, and decision curve analysis was used to determine the clinical usefulness. In addition, a local interpretability technique called Shapley Additive Explanation (SHAP) was used to break down predictions and show the impact of each feature.25–27 This assessment was based on SHAP values (Shap 0.39.0), which were equal to the prediction from the original forecasted value minus the deletion of the feature. Positive results signified that the feature supported the prediction, while negative values signified that the prediction was not supported.
Observer Evaluation Test
The observer performance test was designed to compare the classification performance of the best model with that of four radiologists who had 10 years (Radiologist 1), 6 years (Radiologist 2), 3 years (Radiologist 3), and 2 years (Radiologist 4) of mammogram experience, respectively. All the radiologists read 58 test images in each session with and without the assistance of the optimal model. Each observer was blinded to the pathological results. The observers independently reviewed each case to discriminate between PTs and FAs. Simultaneously, the radiologists recorded their confidence ratings for the diagnostic classification of phyllodes tumors with a five-point scale, including: 5, definite PT; 4, probable PT; 3, indeterminate; 2, probable FA; and 1 definite FA. A confidence rating of 4 or higher was equal to a diagnosis of PT. The two reading tests were separated by a minimum 1-month interval, and cases were out of order.
Statistical Analysis
Statistical analysis was performed using SPSS 22.0 (IBM, Armonk, NY, USA) and Medcalc (version 19.4.1). For baseline characteristics and conventional BI-RADS signatures, the continuous variables were analyzed by the Mann-Whitney U test after the normality test, and categorical variables were via the Chi-square test or Fisher's exact test. AUC was compared using the DeLong test. The sensitivity, specificity, and accuracy of each radiologist with and without model assistance were calculated using McNemar's test. A p-value of < 0.05 was considered to indicate a statistically significant difference.
Results
Demographic Characteristics of Patients and BI-RADS Signatures of Mammogram
The details of the patients’ demographic characteristics and visual assessment of mammograms by experienced radiologists are shown in Table 1. PTs and FAs differed significantly in age, maximum diameter, shape, margin, and internal calcifications (all p<0.05). No significant differences were found in lateral and mass density. In terms of the type of internal calcifications, suspicious morphology (all of them were coarse heterogeneous) accounted for 20% in PTs and 8.7% in FAs, and the difference was not statistically significant (p=0.567). In this study, older age, larger maximum diameter (>3.0 cm), irregular shape, or indistinct margin suggest a diagnosis of PT.
Table 1.
Demographic Characteristics of Patients and Visual Assessment of Mammogram.
| Characteristics | Phyllodes tumor (n=93) | Fibroadenoma (n=99) | P |
|---|---|---|---|
| Age, years | 43 (40,49) | 42 (36,47) | 0.034 |
| Maximum diameter(cm) | 3.4 (2.7,5.1) | 2.4 (1.8,2.9) | <0.001 |
| <3 | 31(33.3%) | 76(76.8%) | |
| ≥3 | 62(66.7%) | 23(23.2%) | |
| Lateral | 0.379 | ||
| Left | 42(45.2%) | 51(51.5%) | |
| Right | 51(54.8%) | 48(48.5%) | |
| Shape | 0.003 | ||
| Round/Oval | 42(45.2%) | 66(66.7%) | |
| Irregular | 51(54.8%) | 33(33.3%) | |
| Margin | 0.022 | ||
| Circumscribed/Obscured | 53(57.0%) | 72(72.7%) | |
| Indistinct | 40(43.0%) | 27(27.3%) | |
| Density | 0.091 | ||
| High density | 35(37.6%) | 26(26.3%) | |
| Equal density | 58(62.4%) | 73(73.7%) | |
| Calcification | 0.022 | ||
| Present | 10(10.8%) | 23(23.2%) | |
| Absent | 83(89.2%) | 76(76.8%) |
Radiomics Features Selection
For each case, 2046 features were extracted from FFDM or DBT images. Among the 2046 features, 1701 FFDM and 1621 DBT features with an ICC value of more than 0.80 were included. In the subsequent feature selection process, including variance threshold, LASSO, and SFS, 11 features were selected for FFDM and 10 for DBT (Table 2).
Table 2.
Radiomics Features After Selection.
| Feature name | |
|---|---|
| FFDM | FFDM_CC_gradient_glrlm_RunEntropy |
| FFDM_CC_gradient_glszm_ZoneEntropy | |
| FFDM_CC_lbp-2D_glrlm_GrayLevelNonUniformity | |
| FFDM_CC_logarithm_glrlm_LongRunEmphasis | |
| FFDM_CC_logarithm_glrlm_LongRunHighGrayLevelEmphasis | |
| FFDM_CC_square_glrlm_RunEntropy | |
| FFDM_MLO_exponential_glszm_LargeAreaLowGrayLevelEmphasis | |
| FFDM_MLO_gradient_glrlm_RunEntropy | |
| FFDM_MLO_lbp-2D_glrlm_GrayLevelNonUniformity | |
| FFDM_MLO_wavelet-HL_firstorder_Maximum | |
| FFDM_MLO_wavelet-HH_glszm_ZoneEntropy | |
| DBT | DBT_CC_lbp-2D_firstorder_InterquartileRange |
| DBT_CC_square_ngtdm_Complexity | |
| DBT_CC_squareroot_firstorder_90Percentile | |
| DBT_CC_wavelet-LH_glrlm_LongRunHighGrayLevelEmphasis | |
| DBT_CC_wavelet-HL_glszm_ZoneEntropy | |
| DBT_MLO_original_ngtdm_Busyness | |
| DBT_MLO_lbp-2D_glrlm_GrayLevelNonUniformity | |
| DBT_MLO_logarithm_glrlm_RunVariance | |
| DBT_MLO_squareroot_firstorder_10Percentile | |
| DBT_MLO_wavelet-LH_glrlm_LongRunEmphasis |
FFDM, full-fill digital mammography; DBT, digital breast tomosynthesis.
Performance of the Clinical Model
The clinical model was constructed to evaluate the diagnostic performance of conventional BI-RADS signatures, including maximum diameter, shape, margin, density, and internal calcifications, in distinguishing PTs from FAs. The AUC of the clinical model was 0.785 (95% CI: 0.706-0.851) in the training set, and the sensitivity, specificity, and accuracy were 0.677, 0.696, and 0.687. In the testing set, the AUC was 0.719 (95% CI: 0.585-0.829), with a sensitivity of 0.750, specificity of 0.533, and accuracy of 0.621.
Performance of the FFDM-Radiomics and DBT-Radiomics Model
Radiomics model based on FFDM or DBT was constructed using a logistic regression classifier. In the training set, FFDM-radiomics model reached an AUC of 0.959 (95% CI: 0.910-0.986) with a sensitivity of 0.862, specificity of 0.928, accuracy of 0.896, followed by the DBT-radiomics model with an AUC of 0.881 (95% CI: 0.742-0.936), sensitivity of 0.739, specificity of 0.826 and accuracy of 0.784. In the testing group, FFDM-radiomics model yielded an AUC of 0.937 (95% CI: 0.841-0.984), with a sensitivity of 0.821, specificity of 0.867, and accuracy of 0.845. With respect to the DBT-radiomics model, the AUC was 0.860 (95% CI: 0.742-0.936), with an accuracy of 0.828, specificity of 0.910, and sensitivity of 0.750. Despite the statistically significant difference between the FFDM-radiomics model and the DBT-radiomics model in the training set (p=0.004), no statistically significant differences were seen in the testing set (p = 0.118).
Performance of the Combined Model
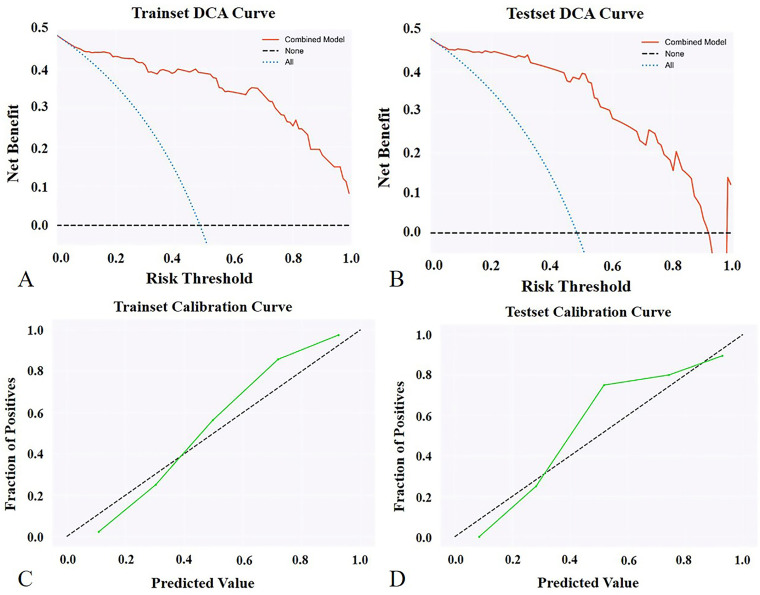
As the FFDM-radiomics model achieved the optimal AUC in distinguishing PTs from FAs, it was selected to be combined with conventional BI-RADS signatures for higher diagnostic ability. The combined model yielded the highest AUC of 0.964 (95% CI: 0.938-0.990) in the training set and 0.948 (95% CI: 0.889-1.000) in the testing set, which was superior to the clinical model (p < 0.0001, p = 0.001) and slightly higher than the FFDM-radiomics model (p = 0.563, 0.278). Figure 2 shows the decision curves and calibration curves for the combined model in the training and testing set. As shown in the figures, the combined model produces high net benefit values across a wide range of threshold levels.
Figure 2.
Decision curve analysis (DCA) for the combined model in training (A) and testing set (B). The vertical axis shows the net benefit, while the horizontal axis shows the threshold level. The combined model produces high net benefit values across a wide range of threshold levels, as shown in the figures. Calibration curve for the combined model in the training (C) and testing set (D). The vertical axis represents the fraction of positives, and the horizontal axis represents predicted values.
Figure 1.
Workflow of the study.
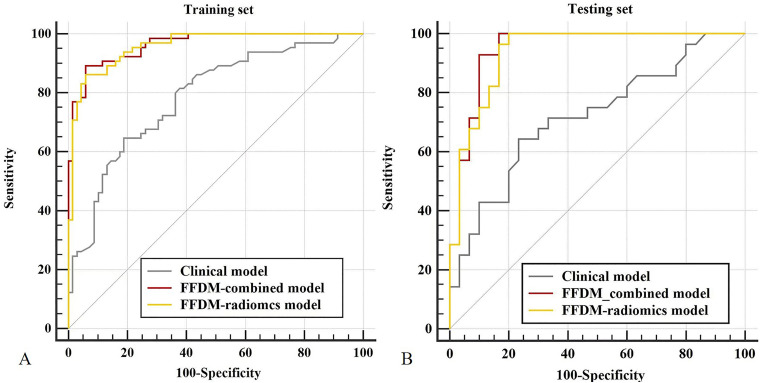
The diagnostic performance of the above models is shown in Table 3, and the ROCs of the clinical model, FFDM-radiomics model, and the combined model are shown in Figure 3.
Table 3.
The Diagnostic Performance of the Clinical Model, FFDM-Radiomics Model, DBT-Radiomics Model, and the Combined Model.
| Data set | AUC | SEN | SPE | ACC | |
|---|---|---|---|---|---|
| Training set (n=134) | Clinical model | 0.785 | 0.677 | 0.696 | 0.687 |
| FFDM- radiomics model | 0.959 | 0.862 | 0.928 | 0.896 | |
| DBT- radiomics model | 0.881 | 0.739 | 0.826 | 0.784 | |
| Combined model | 0.964 | 0.942 | 0.862 | 0.903 | |
| Testing set (n=58) | Clinical model | 0.719 | 0.750 | 0.533 | 0.621 |
| FFDM- radiomics model | 0.937 | 0.821 | 0.867 | 0.845 | |
| DBT- radiomics model | 0.860 | 0.750 | 0.910 | 0.828 | |
| Combined model | 0.948 | 0.900 | 0.929 | 0.914 |
AUC, the area under the receiver operating characteristic (ROC) curve; SEN, sensitivity; SPE, specificity; ACC, accuracy
Figure 3.
Comparison of receiver operating characteristic curves for the clinical model, FFDM-radiomics model, and the combined model in the training set (A) and testing set (B).
The Interpretability Analysis with the SHAP Method
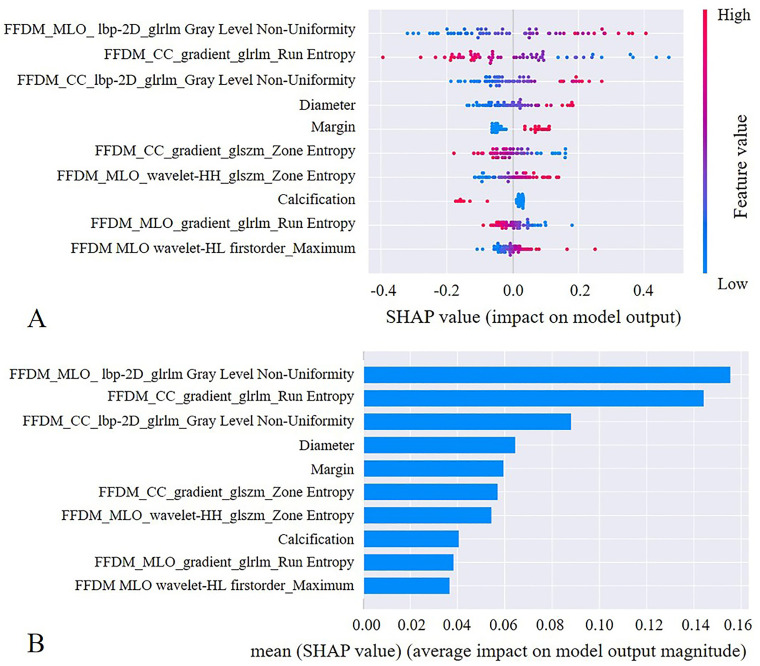
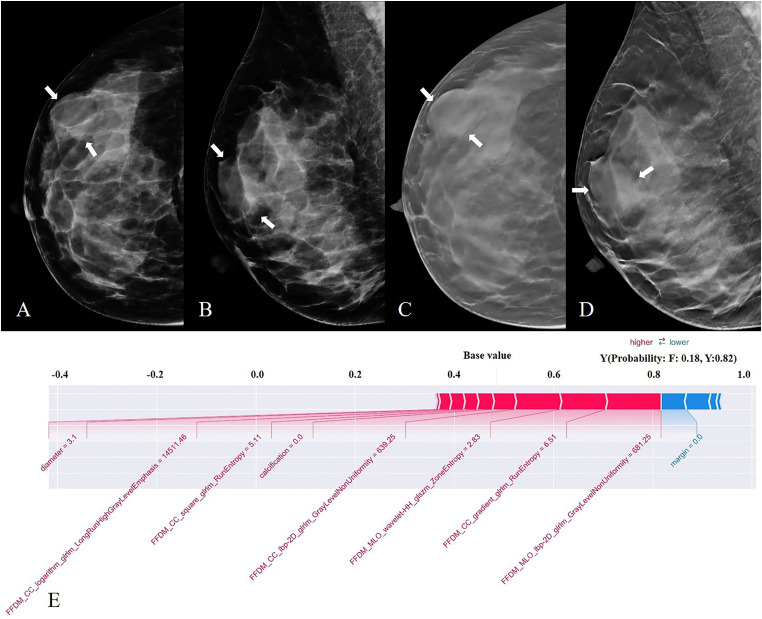
We used the SHAP method further to explain the pre-selected features of the optimal model. The scatter plot of SHAP summary chart reflects the relationship between the SHAP value and the predictive probability through color. The higher the value (red), the greater the probability of a PT (Figure 4A). The bar chart visually reflects the effect of each feature on the combined model (Figure 4B). The top 5 features of the combined model were GrayLevelNonUniformity in CC and MLO view, RunEntropy in the CC view, diameter, and margin of the lesion. The absence of calcification within the mass contributed to the model predictions. As shown in Figure 5, the SHAP method could also provide the decision-making process for each case.
Figure 4.
The selected features of the combined model were evaluated by the SHAP method. The features are listed in descending order according to their contribution to the model. The top three largest contributors to the model were radiomics features, including GrayLevelNonUniformity on MLO view, RunEntropy on CC view, and GrayLevelNonUniformity on CC view, all of which represent intratumor heterogeneity. Mass diameter and margins ranked fourth and fifth, respectively, and also played an important role in the differentiation between PT and FA.
Figure 5.
FFDM (A, B) and DBT (C, D) images from a 42-year-old woman. A mass present in the right breast (white arrow), with a maximum diameter of 3.1cm, equal density, oral in shape, obscured at the margin, without calcification—pathological finding: phyllodes tumor. The pre-selected features of the combined model were further explained by the SHAP technique (E). The output of the model is the probability that the tumor is a fibroadenoma or a phyllodes tumor, where F is defined as a fibroadenoma, and Y is defined as a phyllodes tumor. In this case, BI-RADS signatures are prone to a diagnosis of fibroadenoma, and the combined model predicts a PT with a 0.82 out.
Diagnostic Performance of Radiologists
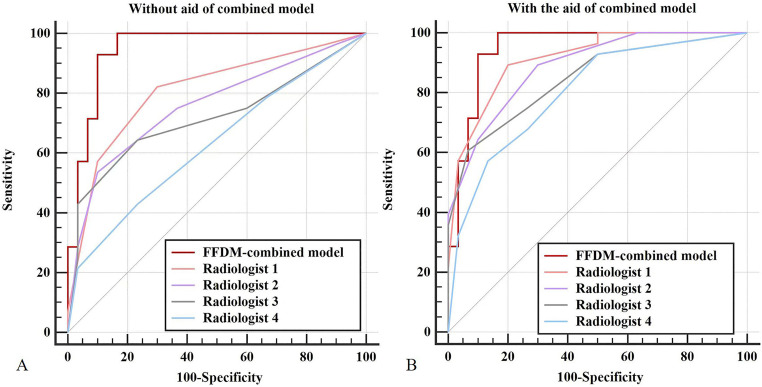
As the combined model yielded the highest AUC in differentiating PTs from FAs, it was used to perform the observer evaluation of four radiologists. The AUC, sensitivity, specificity, and accuracy of all radiologists are shown in Table 4. The independent reading AUCs of all four radiologists were lower than the combined model, and the differences were statistically significant (p= 0.048, 0.005, 0.002, 0.0001 for R1, R2, R3, R4). With the aid of the combined model, a gain in AUC, sensitivity, specificity, and accuracy was observed for almost all radiologists (Figure 6). Statistically significant differences in AUCs were observed for three radiologists (radiologists 2, 3, and 4), except for radiologist 1.
Table 4.
The Diagnostic Performance of Radiologists.
| Diagnostic value | Radiologist 1 | Radiologist 2 | ||||
|---|---|---|---|---|---|---|
| Unaid | Aid | P | Unaid | Aid | P | |
| AUC | 0.808 | 0.914 | 0.079 | 0.759 | 0.888 | 0.015 |
| SEN | 0.571 | 0.571 | 1.000 | 0.536 | 0.643 | 0.508 |
| SPE | 0.900 | 0.967 | 0.625 | 0.900 | 0.900 | 1.000 |
| ACC | 0.741 | 0.776 | 0.791 | 0.724 | 0.776 | 0.581 |
AUC, the area under the receiver operating characteristic (ROC) curve; SEN, sensitivity; SPE, specificity; ACC, accuracy
Figure 6.
Comparison of receiver operating characteristic curves for assessing the diagnostic performance of the four radiologists independently (A) and with the combined model assistance (B).
Discussion
In this study, we demonstrate the ability of mammography combined with radiomics analysis to distinguish PTs from FAs. It was found that the combined model yielded the highest AUC of 0.964 in the training set and 0.948 in the testing set, which was higher than experienced radiologists (p <0.05). With the aid of the combined model, both experienced and less experienced radiologists have an improvement in diagnostic performance, especially for less experienced radiologists in our study. In comparison with the clinical model, the FFDM-radiomics model and DBT-radiomics model can also achieve good discrimination.
To our knowledge, this is the first time DBT has been used in conjunction with radiomics to distinguish fibroepithelial tumors. In a previous study, Cui et al found that mammographic texture analysis-based diagnosis and the combination of the image-based and texture-based approaches yielded an AUC of 0.730 and 0.843 in differentiation between Grade 1 and Grade 2/ Grade 3 PTs of breast. 23 Recently, Deng et al built a mammography-based radiomics model for distinguishing PT from FA, in which the combined model reached the highest AUC of 0.918 in the training group and 0.973 in the validation group. 28 Their findings are consistent with ours, highlighting the potential of combining FFDM and radiomics in differentiating between PT and FA. It's worth noting that our study also incorporates DBT, yielding similarly promising results. Additionally, the researchers attempted to utilize ultrasound images in conjunction with machine learning techniques to discriminate between PT and FA. Sim et al used a radiomics signature-based classifier to predict PTs among FAs, which achieved an AUC of 0.765 in the validation set. Stoffel et al found that a deep learning software was able to differentiate between PT and FA with an AUC of 0.73 in the validation data. 29 Compared to ultrasound-based machine learning models, the radiomics models based on FFDM and DBT in this study demonstrate superior capability in distinguishing fibroepithelial tumors.
As an additional benefit, the SHAP method provided a reliable auxiliary diagnostic tool for clinical decision-making by explaining the prediction results of the model.30–32 After interpretability analysis by the SHAP method, the value of GrayLevelNonUniformity on both CC and MLO view contributed greatly to diagnosing PTs, which represented that the more heterogeneous the gray-scale value of the mass, the more inclined to a diagnosis of a PT. Internal signal heterogeneity within the mass on MRI is also a point of differentiation between PTs and FAs, but it is difficult to identify with the naked eye due to the low density resolution on FFDM and DBT images, which is precisely the advantage of radiomics analysis. Aside from these radiomics features, some conventional BI-RADS features, such as the maximum diameter, margin, and internal calcification, played an important role in the decision-making process of the model. Similarly, our conventional analysis showed that PTs differed from FAs in terms of maximum diameter, mass shape, and margin, as in some previous studies.5,7,33–35 The difference in these imaging features is attributed to the excessive growth rate of PTs and the different growth rates of different parts of the tumors. 10 Degenerative changes may appear in FA while it is in its quiescent phase, resulting in coarse or "popcorn-like" or dystrophic calcifications inside. Consequently, the presence of coarse calcifications inside the mass increases the probability of diagnosing FA. In short, a combination of radiologists’ visual assessment and radiomics models could achieve higher diagnostic accuracy and make correct clinical decisions.
Several limitations are present in the study. First, we only used the clearest slice of the DBT images rather than the whole lesion. This may be the reason for the FFDM-radiomics model shows better discrimination in PTs and FAs than DBT-radiomics. The 3D radiomics features of DBT may contain more information, and in further work, it is necessary to construct a model using the full-layer radiomics features to explore its performance in diagnosing PTs and FAs. Second, we only used one classifier to construct the model. Although the LR model has achieved promising results, the possibility of other types of machine learning classifiers has not been further explored. Third, the four radiologists and the models made decisions solely on the basis of image analysis without considering patients’ medical histories or other examinations, such as ultrasounds. Since clinical data may be pivotal in making decisions, a difference from actual clinical practice may lead to bias. Fourth, the retrospective study was performed in a single hospital, which may have resulted in patient selection bias. Multi-center, prospective studies are required for further model improvement. Fifth, the models in this study lacked external validation. This may not be conducive to assessing the generalizability and clinical applicability of the model. Additionally, due to the low incidence of PTs, the sample size of this study (199 cases) may not be sufficient to develop and validate a very robust diagnostic model. In future studies, we will strengthen cooperation with other medical institutions to expand the sample size and implement external validation to improve the performance of the model.
Conclusion
In conclusion, the study shows that the combined model based on FFDM-radiomics and conventional BI-RADS signatures, together with the SHAP method, has great potential to help distinguish PTs and FAs preoperatively in an understandable manner. Adequate differentiation of fibroepithelial tumors before surgery can help physicians make better surgical management decisions to avoid unnecessary surgery.
Abbreviations
- PT
Phyllodes tumor
- FA
Fibroadenoma
- CNB
Core Needle Biopsy
- DBT
Digital breast tomosynthesis
- FFDM
Full-field digital mammography
- MRI
Magnetic resonance imaging
- AUC
Area under curve
- CC
Craniocaudal
- MLO
Mediolateral oblique
- BI-RADS
Breast Imaging Reporting and Data System
- ROI
Region of interest
- ICC
Intraclass correlation coefficient
- GLCM
Gray level co-occurrence matrix
- GLDM
Gray level dependence matrix
- GLRLM
Gray level run length matrix
- GLSZM
Gray level size zone matrix
- NGTDM
Neighboring gray-tone difference matrix
- LASSO
Least absolute shrinkage and selection operator
- LR
Logistic regression
- SHAP
Shapley Additive Explanation
Footnotes
Conflict of Interest: The authors declare that the research was conducted in the absence of any commercial or financial relationships that could be construed as a potential conflict of interest.
Ethics Statement: The institutional review board of Nanfang Hospital, Southern Medical University approval was obtained (approval number: NFEC-2024-222). The Institutional Review Board waived written informed consent because it was a retrospective study.
Funding: This study was funded by the National Natural Science Foundation of China (82171929), President's Fund of Nanfang Hospital, Southern Medical University (2023B049, 2023B018), the Foundation of President of Nanfang Hospital (2021C007), the Guangzhou Science and Technology Planning Project (202103000037).
ORCID iDs: Genggeng Qin https://orcid.org/0000-0002-7563-3924
Sina Wang https://orcid.org/0000-0002-2159-7921
References
- 1.Tan PH, Ellis I, Allison K, et al. The 2019 World Health Organization classification of tumours of the breast. Histopathology. 2020. Aug;77(2):181-185. doi: 10.1111/his.14091 [DOI] [PubMed] [Google Scholar]
- 2.Chen WH, Cheng SP, Tzen CY, et al. Surgical treatment of phyllodes tumors of the breast: Retrospective review of 172 cases. J Surg Oncol. 2005. Sep 1;91(3):185-194. doi: 10.1002/jso.20334 [DOI] [PubMed] [Google Scholar]
- 3.Choi N, Kim K, Shin KH, et al. The characteristics of local recurrence after breast-conserving surgery alone for malignant and borderline phyllodes tumors of the breast (KROG 16-08). Clin Breast Cancer. 2019. Oct;19(5):345-353. doi: 10.1016/j.clbc.2019.04.003 [DOI] [PubMed] [Google Scholar]
- 4.Van Osdol AD, Landercasper J, Andersen JJ, et al. Determining whether excision of all fibroepithelial lesions of the breast is needed to exclude phyllodes tumor: Upgrade rate of fibroepithelial lesions of the breast to phyllodes tumor. JAMA Surg. 2014. Oct;149(10):1081-1085. doi: 10.1001/jamasurg.2014.73 [DOI] [PubMed] [Google Scholar]
- 5.Wiratkapun C, Piyapan P, Lertsithichai P, Larbcharoensub N. Fibroadenoma versus phyllodes tumor: Distinguishing factors in patients diagnosed with fibroepithelial lesions after a core needle biopsy. Diagn Interv Radiol. 2014. Jan-Feb;20(1):27-33. [DOI] [PMC free article] [PubMed] [Google Scholar]
- 6.Rana C, Kamal N, Mishra P, et al. Cellular fibroadenoma versus phyllodes tumors: A pre-operative diagnostic approach based on radiological and cytological features. Diagn Cytopathol. 2022. Aug;50(8):375-385. doi: 10.1002/dc.24965 [DOI] [PubMed] [Google Scholar]
- 7.Kamitani T, Matsuo Y, Yabuuchi H, et al. Differentiation between benign phyllodes tumors and fibroadenomas of the breast on MR imaging. Eur J Radiol. 2014. Aug;83(8):1344-1349. doi: 10.1016/j.ejrad.2014.04.031 [DOI] [PubMed] [Google Scholar]
- 8.Al-Arnawoot B, Scaranelo A, Fleming R, et al. Cellular fibroepithelial lesions diagnosed on core needle biopsy: Is there any role of clinical-sonography features helping to differentiate fibroadenomas and phyllodes tumor? J Surg Oncol. 2020. Sep;122(3):382-387. doi: 10.1002/jso.25977 [DOI] [PubMed] [Google Scholar]
- 9.Kalambo M, Adrada BE, Adeyefa MM, et al. Phyllodes tumor of the breast: Ultrasound-pathology correlation. AJR Am J Roentgenol. 2018. Apr;210(4):W173-W179. doi: 10.2214/AJR.17.18554 [DOI] [PubMed] [Google Scholar]
- 10.Venter AC, Roşca E, Daina LG, Muţiu G, Pirte AN, Rahotă D. Phyllodes tumor: Diagnostic imaging and histopathology findings. Rom J Morphol Embryol. 2015;56(4):1397-1402. [PubMed] [Google Scholar]
- 11.Mimoun C, Zeller A, Seror J, et al. A pre-operative score to discriminate fibroepithelial lesions of the breast: Phyllode tumor or fibroadenoma? Anticancer Res. 2020. Feb;40(2):1095-1100. doi: 10.21873/anticanres.14048 [DOI] [PubMed] [Google Scholar]
- 12.Yip SS, Aerts HJ. Applications and limitations of radiomics. Phys Med Biol. 2016. Jul 7;61(13):R150-R166. doi: 10.1088/0031-9155/61/13/R150 [DOI] [PMC free article] [PubMed] [Google Scholar]
- 13.Rizzo S, Botta F, Raimondi S, et al. Radiomics: The facts and the challenges of image analysis. Eur Radiol Exp. 2018. Nov 14;2(1):36. doi: 10.1186/s41747-018-0068-z [DOI] [PMC free article] [PubMed] [Google Scholar]
- 14.Chamming's F, Ueno Y, Ferré R, et al. Features from computerized texture analysis of breast cancers at pretreatment MR imaging are associated with response to neoadjuvant chemotherapy. Radiology. 2018. Feb;286(2):412-420. doi: 10.1148/radiol.2017170143 [DOI] [PubMed] [Google Scholar]
- 15.Luo WQ, Huang QX, Huang XW, Hu HT, Zeng FQ, Wang W. Predicting breast cancer in breast imaging reporting and data system (BI-RADS) ultrasound category 4 or 5 lesions: A nomogram combining radiomics and BI-RADS. Sci Rep. 2019. Aug 15;9(1):11921. doi: 10.1038/s41598-019-48488-4 [DOI] [PMC free article] [PubMed] [Google Scholar]
- 16.Hu Q, Whitney HM, Giger ML. Radiomics methodology for breast cancer diagnosis using multiparametric magnetic resonance imaging. J Med Imaging (Bellingham). 2020. Jul;7(4):044502. [DOI] [PMC free article] [PubMed] [Google Scholar]
- 17.Bian T, Wu Z, Lin Q, et al. Radiomic signatures derived from multiparametric MRI for the pretreatment prediction of response to neoadjuvant chemotherapy in breast cancer. Br J Radiol. 2020. Nov 1;93(1115):20200287. doi: 10.1259/bjr.20200287 [DOI] [PMC free article] [PubMed] [Google Scholar]
- 18.Liu Z, Li Z, Qu J, et al. Radiomics of multiparametric MRI for pretreatment prediction of pathologic complete response to neoadjuvant chemotherapy in breast cancer: A multi-center study. Clin Cancer Res. 2019. Jun 15;25(12):3538-3547. doi: 10.1158/1078-0432.CCR-18-3190 [DOI] [PubMed] [Google Scholar]
- 19.Song BI. A machine learning-based radiomics model for the prediction of axillary lymph-node metastasis in breast cancer. Breast Cancer. 2021. May;28(3):664-671. doi: 10.1007/s12282-020-01202-z [DOI] [PubMed] [Google Scholar]
- 20.Tsuchiya M, Masui T, Terauchi K, et al. MRI-based radiomics analysis for differentiating phyllodes tumors of the breast from fibroadenomas. Eur Radiol. 2022. Jun;32(6):4090-4100. doi: 10.1007/s00330-021-08510-8 [DOI] [PubMed] [Google Scholar]
- 21.Mai H, Mao Y, Dong T, et al. The utility of texture analysis based on breast magnetic resonance imaging in differentiating phyllodes tumors from fibroadenomas. Front Oncol. 2019 Oct;15(9):1021. doi: 10.3389/fonc.2019.01021 [DOI] [PMC free article] [PubMed] [Google Scholar]
- 22.Jiang N, Zhong L, Zhang C, Luo X, Zhong P, Li X. Value of conventional MRI texture analysis in the differential diagnosis of phyllodes tumors and fibroadenomas of the breast. Breast Care (Basel). 2021. Jun;16(3):283-290. doi: 10.1159/000508456 [DOI] [PMC free article] [PubMed] [Google Scholar]
- 23.Cui WJ, Wang C, Jia L, et al. Differentiation between G1 and G2/G3 phyllodes tumors of breast using mammography and mammographic texture analysis. Front Oncol. 2019 May;29(9):433. doi: 10.3389/fonc.2019.00433 [DOI] [PMC free article] [PubMed] [Google Scholar]
- 24.Collins GS, Reitsma JB, Altman DG, Moons KG. Transparent reporting of a multivariable prediction model for individual prognosis or diagnosis (TRIPOD): The TRIPOD statement. Br Med J. 2015 Jan;7(350):g7594. doi: 10.1136/bmj.g7594 [DOI] [PubMed] [Google Scholar]
- 25.Zhang G, Shi Y, Yin P, et al. A machine learning model based on ultrasound image features to assess the risk of sentinel lymph node metastasis in breast cancer patients: Applications of scikit-learn and SHAP. Front Oncol. 2022. Jul; 25(12):944569. doi: 10.3389/fonc.2022.944569 [DOI] [PMC free article] [PubMed] [Google Scholar]
- 26.Jacobson D, Cadieux B, Higano CS, et al. Risk factors associated with skeletal-related events following discontinuation of denosumab treatment among patients with bone metastases from solid tumors: A real-world machine learning approach. J Bone Oncol. 2022. Mar;17(34):100423. doi: 10.1016/j.jbo.2022.100423 [DOI] [PMC free article] [PubMed] [Google Scholar]
- 27.Liu J, Xu L, Zhu E, Han C, Ai Z. Prediction of acute kidney injury in patients with femoral neck fracture utilizing machine learning. Front Surg. 2022. Jul;26(9):928750. doi: 10.3389/fsurg.2022.928750 [DOI] [PMC free article] [PubMed] [Google Scholar]
- 28.Deng XY, Cao PW, Nan SM, et al. Differentiation between phyllodes tumors and fibroadenomas of breast using mammography-based machine learning methods: A preliminary study. Clin Breast Cancer. 2023. Oct;23(7):729-736. doi: 10.1016/j.clbc.2023.07.002 [DOI] [PubMed] [Google Scholar]
- 29.Stoffel E, Becker AS, Wurnig MC, et al. Distinction between phyllodes tumor and fibroadenoma in breast ultrasound using deep learning image analysis. Eur J Radiol Open. 2018. Sep;24(5):165-170. doi: 10.1016/j.ejro.2018.09.002 [DOI] [PMC free article] [PubMed] [Google Scholar]
- 30.Ma M, Liu R, Wen C, et al. Predicting the molecular subtype of breast cancer and identifying interpretable imaging features using machine learning algorithms. Eur Radiol. 2022. Mar;32(3):1652-1662. doi: 10.1007/s00330-021-08271-4 [DOI] [PubMed] [Google Scholar]
- 31.Wang Y, Lang J, Zuo JZ, et al. The radiomic-clinical model using the SHAP method for assessing the treatment response of whole-brain radiotherapy: A multicentric study. Eur Radiol. 2022. Dec;32(12):8737-8747. doi: 10.1007/s00330-022-08887-0 [DOI] [PubMed] [Google Scholar]
- 32.Du R, Lee VH, Yuan H, et al. Radiomics model to predict early progression of nonmetastatic nasopharyngeal carcinoma after intensity modulation radiation therapy: A multi-center study. Radiol Artif Intell. 2019. Jul 10;1(4):e180075. doi: 10.1148/ryai.2019180075 [DOI] [PMC free article] [PubMed] [Google Scholar]
- 33.Duman L, Gezer NS, Balcı P, et al. Differentiation between phyllodes tumors and fibroadenomas based on mammographic sonographic and MRI features. Breast Care (Basel. 2016. Apr;11(2):123-127. doi: 10.1159/000444377 [DOI] [PMC free article] [PubMed] [Google Scholar]
- 34.Mberu V, Macaskill EJ, Purdie C, Evans A. Preoperative prediction of margin requirement following a core biopsy result suggestive of a phyllodes tumour. Clin Radiol. 2020. Apr;75(4):319.e21-319.e27. doi: 10.1016/j.crad.2019.11.006 [DOI] [PubMed] [Google Scholar]
- 35.Yalcin A, Goktepeli M, Taydas O, Sayar I. Native T1 mapping of the breast in MRI to differentiate fibroadenomas from benign phyllodes tumors: A preliminary study. MAGMA. 2022. Jun;35(3):441-447. doi: 10.1007/s10334-021-00969-2 [DOI] [PubMed] [Google Scholar]


