Abstract
In this paper, an improved Global Dynamic Evolution Snow Ablation Optimizer (GDSAO) is proposed in order to solve the problem of global optimization and Unmanned Aerial Vehicle (UAV) path planning in 3D space with obstacle threats. Three improvement schemes are proposed in GDSAO: (1) Population initialization is carried out using the theory of the best point set to obtain a more diverse initial population; (2) A dynamic snowmelt ratio using the global evolutionary dispersion is proposed to adapt the exploitation process of the original SAO to the evolutionary process of population fitness; (3) A neighborhood dimensional search scheme is proposed to update the locations of all searched individuals outside the elite pool to obtain better population fitness. The algorithm was tested on 30 10-dimensional problems at CEC 2017 and performed better than a series of joint and leading optimization algorithms. The path planning problem of UAV was solved, and the path satisfying all obstacle avoidance threats and corner constraints was obtained. By comparison, GDSAO is superior to the existing algorithms in terms of reliability and stability of optimization.
Keywords: Unmanned aerial vehicle, Snow ablation optimizer, Path planning, GDSAO, Obstacle threat
Subject terms: Aerospace engineering, Electrical and electronic engineering, Computational science
Introduction
With the development of unmanned navigation technology, the flexibility and mobility of UAVs continue to improve. UAV processors with advanced sensors can help people complete many tasks in complex environments1, such as industrial inspection, disaster relief, environmental survey, and transportation. For these missions, a vital issue is planning safe and efficient flight paths for UAVs. Depending on the specific mission type, the UAV must consider flight time, avoid obstacles, and meet its movement constraints.
The UAV path planning problem can be expressed as an optimization problem. The main idea of the 3D UAV path planning problem is how to plan to get an optimal flight path while ensuring that the UAV does not collide with obstacles during flight. This paper transforms the 3D UAV path planning problem into a multi-constrained optimization problem by formulating the path length cost function, the safety cost function, and the turning-angle cost function. This problem is an entirely NP-hard problem2.
There has been Much research in the field of path planning, which is graph-based, such as aerial Dijkstra algorithm3, grid map-based, such as A* algorithm4 and fast marching method5, sampling-based algorithms, such as RRT6, and other navigation methods that integrate dynamic rules, such as artificial potential field method7. Each of these approaches has worked brilliantly in the problems of their respective fields. However, the compatibility of these methods could be better8, and sometimes, some methods may not be applicable in complex situations or face significant challenges in algorithm migration and expansion.
Meta-heuristic algorithms are very good at solving problems such as path planning, which have large-scale dimensions, nonlinear and non-convex9. The strong adaptability of the meta-heuristic algorithm provides a new solution for UAV path planning.
Therefore, an improved snow ablation optimizer algorithm based on global dynamic evolution is proposed. The global dynamic evolution of the algorithm is reflected in three improvement mechanisms. They are good point set initialization, dynamic snowmelt ratio, and neighborhood dimensional search. The effectiveness and sensitivity of these efforts are verified in the following sections, which can ensure the balance between the exploration and exploitation process of the search agent as a whole and can dynamically adapt to the dynamic process to adjust the degree of exploitation. The main contributions of this paper are as follows:
The UAV motion planning model in a 3D environment is established. Obstacle threat and Angle constraint are applied to the objective function in the form of penalty terms to adapt to the solution of the meta-heuristic optimization algorithm.
An improved idea of the GDSAO algorithm is proposed. It consists of three mechanisms: (1) Using the improvement strategy of the best point set to generate more diverse initial solutions; (2) A dynamic snowmelt rate is proposed, which can dynamically adjust the exploitation degree of the population by using the fitness dispersion degree of the population evolution process; (3) Use neighborhood dimensional search to update agent locations further, except the elite pool, to improve global fitness.
The performance test of GDSAO and the other seven commonly used optimization algorithms and leading algorithms in the project was carried out in the benchmark function of CEC2017, and the performance evaluation was carried out with the overall mean value, standard deviation after repeated calculation and Friedman test ranking.
GDSAO is used to solve the UAV path planning problem, and the path conforming to the constraints is obtained. The solution structure of other algorithms performs better on various branches.
Related works
Meta-heuristic optimizer for path planning
Traditional offline planning methods have limited path accuracy for UAVs. In recent years, many researchers have focused on UAVs’ autonomous path planning, using grid map-based, sample-based, and meta-heuristic algorithms. The meta-heuristic algorithm has outstanding advantages in computational efficiency and accuracy.
Typical meta-heuristic algorithms can be divided into the following categories: The first category is evolution-based algorithms, which typically include Genetic Algorithm (GA)10 and Differential Evolution (DE)11, which make use of the crossing and mutation mechanism of chromosomes to update agent search location. The second category is the algorithms based on physical rules, like Gravity Search Algorithm (GSA)12, Simulated Annealing algorithm (SA)13, Multiverse Optimization (MVO)14, these algorithms make use of the physical laws of nature. The third type of algorithm is based on mathematics, which is derived from mathematical functions, formulas, and theories, such as Sine and Cosine Algorithm (SCA)15, Arithmetic Optimization Algorithm (AOA)16. The fourth type of algorithm is a population-based algorithm, which is derived from the behavior of foraging, breeding and hunting in organisms, such as particle swarm optimization17, Artificial Bee Colony algorithm (ABC)18, Gray Wolf Optimization (GWO)9, Whale Optimization Algorithm (WOA)19, Harris Hawk Optimization (HHO)20. The above classification is not absolute, and the same algorithm may contain multiple mechanisms. They have been used to solve various industrial problems with great success, including in the field of UAV path planning. However, faced with complex environments, the performance of most algorithms can be further improved. In the in-depth development of meta-heuristic algorithms, many researchers focus on introducing more parameters, mechanisms, and multi-level search.
Nadimi et al.21 has proposed an improved Gray Wolf optimizer (I-GWO) to solve global optimization and engineering design problems. A dimension learning-based hunting (DLH) search strategy is proposed to inherit from the individual hunting behavior of wolves in nature. It has achieved excellent results on the CEC 2018 benchmark function. Luo22 proposed a 3D path planning algorithm based on improved holographic particle swarm optimization (IHPSO), which uses the system clustering method and the information entropy grouping strategy instead of random grouping of structure-particle swarm optimization. Fouad23 introduces the PMST-CHIO, a novel variant of the Coronavirus Herd Immunity Optimizer (CHIO) algorithm for individual unmanned aerial vehicle (UAV) path planning in complex 3D environments. It innovatively integrates a parallel multi-swarm treatment mechanism, significantly enhancing the standard CHIO’s exploration and exploitation capabilities. Wang24 proposes an improved tuna swarm optimization algorithm based on a sigmoid nonlinear weighting strategy, multi-subgroup Gaussian mutation operator, and elite individual genetic strategy called SGGTSO. The problem of 3D UAV path planning under nine different terrain scenarios is solved in their work.
Snow ablation optimizer
Snow ablation optimizer (SAO) is a population-based meta-heuristic optimization method, proposed by Deng and Liu25. The melting and sublimation of snow are simulated to find the optimal solution to complex problems. The validity of SAO is tested in their work. Compared with other meta-heuristic algorithms, SAO has a more flexible structure and fewer parameters. However, SAO also has the disadvantages of low convergence accuracy, little population diversity, and premature convergence26.
Many researchers have studied the improvement of SAO. Xiao et al.26 have made a series of improvements to the SAO algorithm, called Multi-strategy boosted Snow Ablation Optimizer (MSAO) algorithm, including initialization of good point set, greedy selection strategy, differential evolution strategy, and reverse lens learning, which shows good optimization ability. However, the search time is long and unsuitable for autonomous path planning and other applications suitable for fast operations. Elaziz et al.27 proposed Comprehensive learning-based Snow Ablation Optimizer with Double attractors (DCSAO), Aims to improve SAO’s ability to explore and exploit in the process of discovering the optimal threshold level for segmentation of aerial photographic images. Pandya et al.28 proposed Multi-objective Snow Ablation Optimization Algorithm (MOSAO), which used crowding distance technique and the elitist non-dominated sorting approach, addressing expansive optimal power flow challenges inherent in intricate power systems. Lu et al.29 propose a fusion algorithm, named Differential Vectors Empower Snow Ablation Optimizer (DESAO), that combines the strengths of SAO and differential evolution, which has the advantages of optimization capability and fast convergence speed. Jia et al.30 has improved SAO in terms of mechanism, and the proposed SAOHTC includes heat transfer strategy and conditioning strategy, which improves the optimization efficiency of the original algorithm, addresses the shortcomings of the original dual population mechanism, and enhances the convergence speed.
In terms of engineering applications, Deng and Liu25, Xiao et al.26 use SAO and its improved versions to solve 22 CEC2020 real-world constrained optimization issues which consist of 7 process synthesis and design issues and 15 mechanical engineering issues, to validate the competitiveness and effectiveness of SAO. Ding et al.31 incorporate the snow ablation optimizer (SAO) to optimize the hyperparameters of the autonomous echo state network, whose study demonstrates that the SAO is an effective fusion strategy for reducing computational resource usage, while enhancing the time evolution performance and robustness of chaotic systems. Ismaeel et al.32 use SAO to solve one of the key problems of power systems, the economic load dispatch problem. In the six scenarios set, SAO performs better than other swarm optimization algorithms.
UAV path planning
UAVs are widely used in engineering inspection, disaster search and rescue, and transportation-related applications. It can help an engineering team assess the field environment as quickly as possible, which requires planning out the drone’s shortest flight path. At the same time, in a complex environment, the collision threat of obstacles must be considered. The problem scenario is shown in Fig. 1. The UAV’s mission is to get from the start point  to the goal point
  as quickly and safely as possible. The fundamental problem of this paper can be expressed as Eq. 1:
Fig. 1.
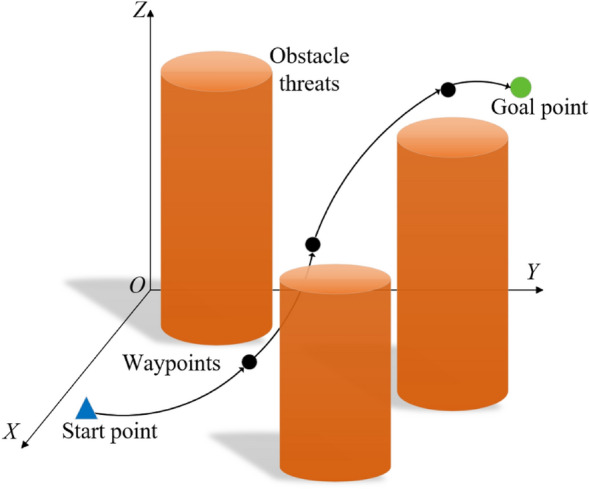
The UAV working environment.
 |
1 |
Path length
J in Eq. 1 is the Path length objective function,  represents the path length of the UAV consisting of waypoints
  , which can be calculated by Euclidean distance between two waypoints as Eq. 2:
 |
2 |
where N is the total number of waypoints, the primary task of UAV path planning is to find a set of path control points  between the start and the goal point to optimize the path length F. The complete waypoints
  are generated from the path control point
  by Piece-wise Cubic Hermite Interpolation (PCHI) to speed up processing and maintain path shape.
The boundary constraint of Eq. 1(a) must be satisfied when the path is generated. Define the upper and lower bounds of the search space as  and
and  , and
, and  should be limited to:
 |
3 |
Obstacle threat constraint
In addition to path length optimization, the UAV path also needs to meet the constraints of Eq. 1(b–d). In the process of meta-heuristic optimization, some constraint formulas need to be transformed into penalty functions of targets to play a role. The navigation area of the UAV may be surrounded by obstacles or no-fly zones, which are called obstacle threats  . Let the center of the obstacle threat be C and the radius of the obstacle threat be
  . To give the UAV enough room to maneuver, set a threat zone outside
  with a radius of r,
  .
.
Equation 1(b) means that the path of the UAV is not affected by the obstacle threat  show as Fig. 2. When the path point
  is inside the obstacle
  , the distance d to the center is less than the radius r, then the point is threatened. If
  , it is not threatened. If
  , the UAV has been collided. The obstacle threat penalty function D has the following form Eq. 4. Where
  is the collision penalty, set to a large value.
 |
4 |
Fig. 2.
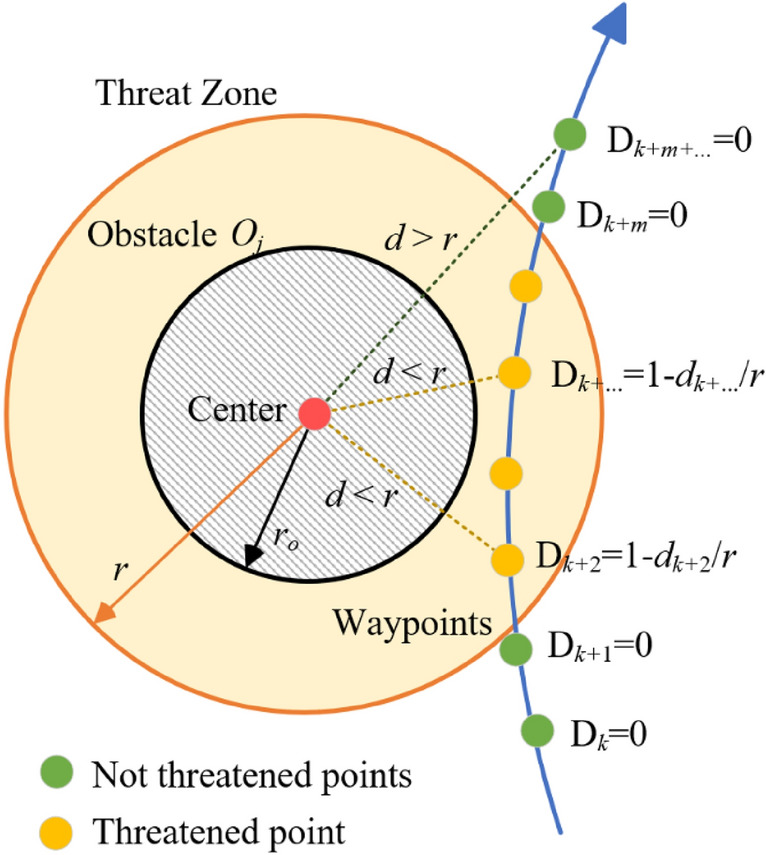
Obstacle threat penalty function.
Height threat constraint
In order to complete tasks, such as photographing the ground environment in the area of interest, also to ensure the safety of navigation, the UAV needs to be a certain height above the ground. Flying too high consumes too much energy on the UAV, and too low there is a risk of collision with the ground, so Eq. 1(c) means that the UAV should be kept within a certain height from the ground. The high threat penalty term is defined as Eq. 5, where  is the altitude of the UAV from the ground,
  is the altitude of the ground, and
  is the altitude of the UAV, shown as Fig. 3.
Fig. 3.
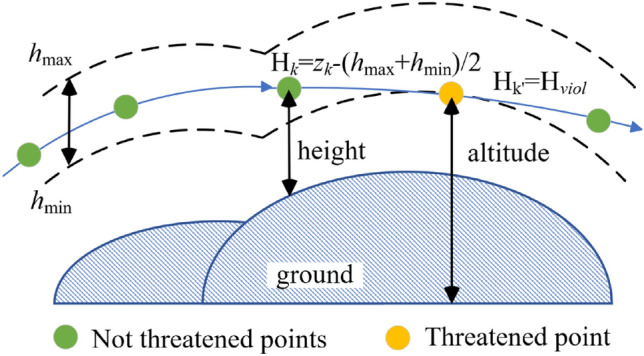
Obstacle threat penalty function.
 |
5 |
Angle constraint
The smoothness of the generated path can be measured by two angles: directional Angle  and pitch Angle
  , shown as Fig. 4. In a segmented path, the two are defined as Eq. 6:
 |
6 |
where  represents the orthographic projection of
  on the reference plane of
  , and
, and  is the orthographic projection of
  on the reference plane
  . The penalty function of the path smoothing cost is Eq. 7:
Fig. 4.
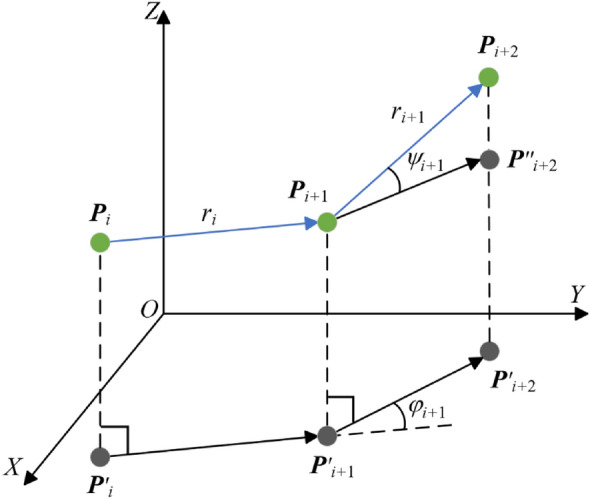
Obstacle threat penalty function.
 |
7 |
where  and
and  are the coefficients that balance the two angular penalty. According to the Eqs. 2–7, the constrained UAV path planning problem can be stated as Eq. 8, where
  are penalty coefficients.
 |
8 |
The proposed GDSAO algorithm
In this section, the primordial SAO algorithm is introduced, and three improvement methods are proposed: initialization of the good point set theory, dynamic snowmelt ratio, and neighborhood dimensional search. The improved GDSAO is tested on essential functions.
The SAO algorithm
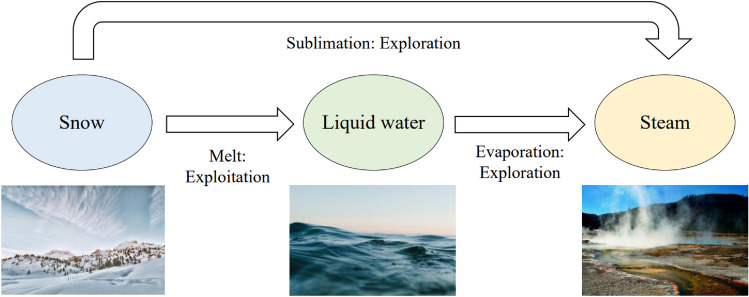
As shown in Fig. 5, SAO was inspired by two processes in which snow turns into liquid water and steam: melting and sublimation, and the evaporation process in which liquid water turns directly into steam, to search for the optimal value. The SAO constructs four parts to search for the optimal solution: the initialization phase, exploration phase, exploitation phase, and two-population mechanism.
Fig. 5.
The inspiration source of SAO.
Initialization
The iterative process of SAO starts with randomly generated populations. Assume that the dimension of the optimization problem is D, the upper and lower boundaries of the search domain are Ub, Lb, the number of search agents is N, and the initial position of the entire population can be represented by the matrix of N row D column:
 |
9 |
where  is the random number of [0, 1]. The
  search agent position vector can be described as
  .
.
Exploration
The exploration phase simulates the transition of snow and liquid water to steam, allowing the search agent to spread randomly into the search space. When snow or liquid water is converted to steam, the search agent exhibits highly dispersed characteristics due to irregular movement. In the exploration phase, the Brownian motion of microscopic particles describes the process of snow and water transforming into steam. Brownian motion is a random process that simulates the unstable motion of microscopic particles. The step size of the Brownian motion in SAO can be obtained from the probability density function of a normal distribution with a mean of 0 and a variance of 1, calculated as Eq. 10:
 |
10 |
Brownian motion has a dynamic and uniform step size, which ensures that the agent can explore as much as possible in the search space and propagate to more feasible areas. Therefore, it can effectively describe the scene of steam diffusion. Each search agent  in an exploration iteration can update its current location using the Eq. 11:
 |
11 |
where  represents the position of the
  agent in the iteration of
  , and
, and  is a set of random numbers with Brownian motion symbols, which is a
  vector.
  .
.  is the inner product operator,
  is the randomly generated value between 0 and 1, and
  is the best solution obtained so far. In addition,
  represents the current average location of the overall population, and
  represents random individuals selected from the elite pool, calculated as Eq. 12:
 |
12 |
where  and
and  represent the second and third best search agents in the current population, respectively.
  represents the centroid position of the individuals who rank in the top 50% of fitness scores, also known as leaders.
  is the total number of leaders. In this study,
  . In two dimensional search space across a
  and
and  intuitively as shown in Fig. 6. The variable r1 controls the movement and leader centroid position of the optimal individual obtained so far. The combination of these two crossing terms mainly captures the interaction between individuals.
Fig. 6.
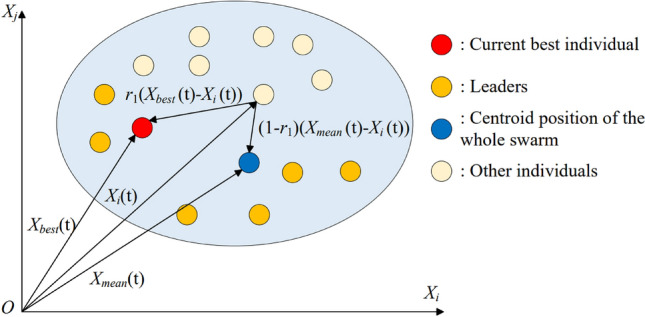
Schematic diagram of the cross term in SAO.
Exploitation
The exploitation phase simulates the transition of snow to liquid water. When snow converts to liquid water through melting behavior, search agents are encouraged to focus on leveraging high-quality solutions around the current optimal solution rather than expanding in search domains with highly dispersed characteristics. In the exploitation stage, the snowmelt process is modeled using the classical degree-day method, and the mathematical expression is Eq. 13:
 |
13 |
where M(t) represents the snowmelt ratio, Temp(t) represents the average daily temperature, t, and  are the current and maximum iterations, respectively, and DDF(t) refers to the degree-day coefficient ranging from 0.35 to 0.6. Fig. 7 illustrates the iterative trends of DDF(t) and snowmelt ratio M(t), which roughly show an exponent-logarithmic trend. Then, the position update equation for this stage is as Eq. 14:
 |
14 |
where  is a random number between 0 and 1. M(t) makes the position update of the agent more inclined to move to the position of the optimal individual as the number of iterations increases.
Fig. 7.
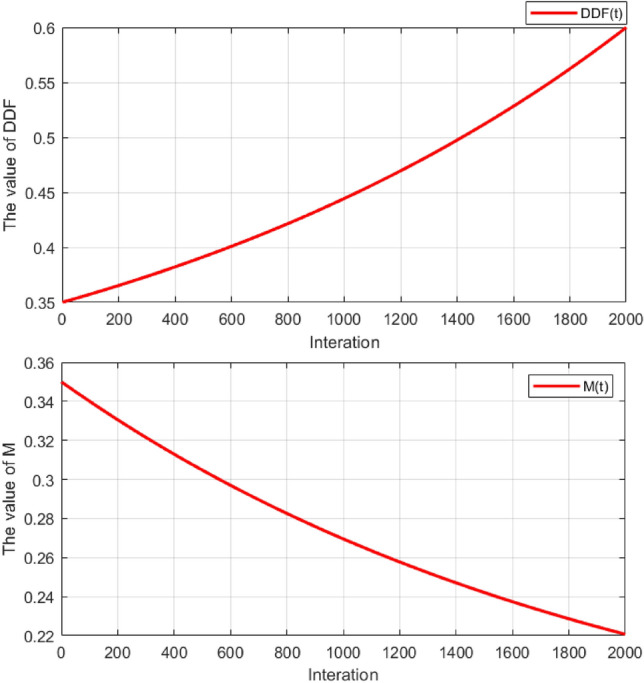
Trend curve of DDF and snowmelt ratio over iterations.
Dual-population mechanism
In order to achieve a trade-off between exploration and exploitation in SAO, a two-population mechanism was introduced. As mentioned earlier, liquid water from snow can also be converted into steam for exploration. As the number of iterations increases, search agents are more inclined to perform irregular motions using highly dispersed features to explore the search space. Thus, in the initial iteration, the entire population Pis incidentally divided into two equally sized subpopulations:  and
and  , where
  is responsible for exploration, and
  is used for exploitation. The sizes of P,
  , and
, and  correspond to N,
  , and
, and  respectively. In a successful iteration, the amount of
  gradually decreases, and the amount of
  increases accordingly. The mathematical representation is as follows:
 |
15 |
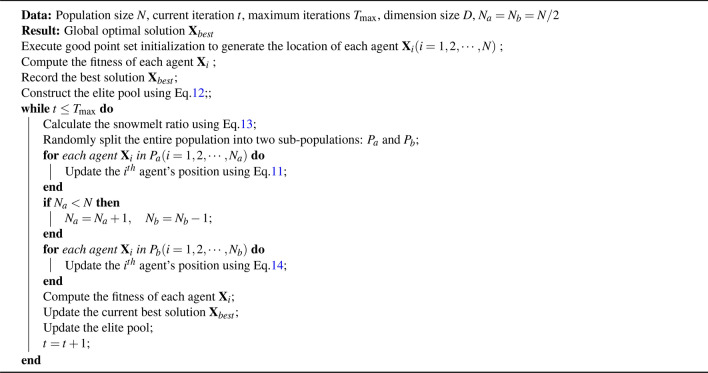
To sum up, the SAO algorithm is shown in pseudo-code Algorithm 1.
Algorithm 1.
Snow ablation optimizer (SAO).
Improving method
Good point set initialization
The method using random numbers cannot guarantee the diversity of the initial population and may limit the improvement of convergence accuracy and search efficiency.26 proposed a method to improve the initial population diversity by using the good point set theory of33 so that agents are more evenly distributed in the search domain than the original method, thus improving the ability to solve high-dimensional optimization problems. The basic principle of the good point set theory is shown as Eqs. 16–17. Let r be the unit cube  point in the D dimensional Euclidean space. The definition of a good point set
  and a good point r are:
 |
16 |
Its deviation satisfies  , where
  represents any positive value, and
  represents the constant associated with
  . The value of
  is
is  , p is to meet the
  the smallest prime Numbers. The method of initializing the population with the good point set is as follows: 1. Calculate the value of r, where
  , where
  is the
  agent; 2. The structure of point set with number N,
  . Then Map
  to the search domain where the population resides:
 |
17 |
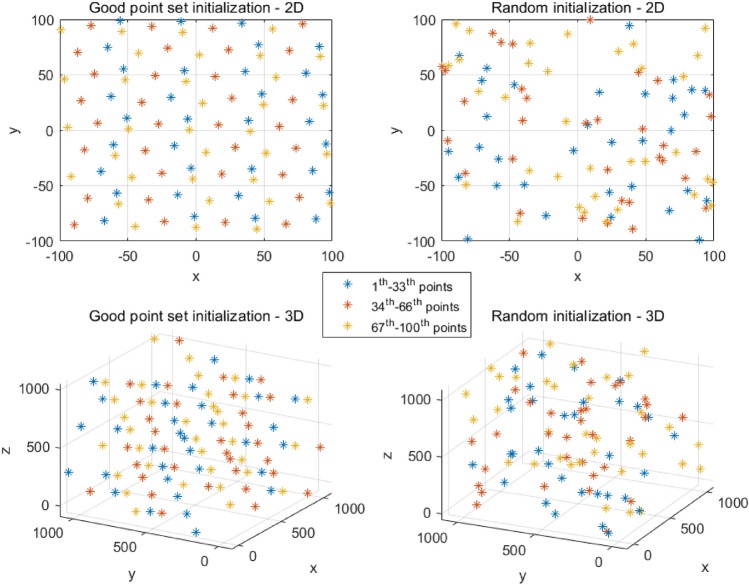
The distribution of agents generated by the good point set method is affected by the number of points N. Figure 8 shows the initial solution set generated by the best-point set method and the uniformly distributed sampling method in a space with a search domain of  . Under the same conditions, the agents generated by the best point set method can be neatly distributed in the search space without overlapping. Therefore, this method can improve the overall diversity of the population to a certain extent and improve global fitness.
Fig. 8.
The distribution between good point set initialization and random initialization.
Dynamic snowmelt ratio
This paper proposes an adaptive dynamic snowmelt ratio method to improve the traditional degree-day process. Based on the standard deviation improvement of agent population fitness under the current iteration, this method proposes an evolutionary dispersion ratio of agent population to express the change of global fitness standard deviation, shown as Eq. 18:
 |
18 |
where k(t) is the global evolution dispersion ratio in iteration t, which is limited by the upper and lower bounds ( ), and
  is the fitness average of the N agents in the population under the
  iteration process.
  reflects the fitness improvement of the two adjacent iterations. When the value of k(t) is greater than 1, the reaction algorithm is in the optimization process, and k(t) approaches 1, reflecting the gradual convergence of optimization.
The Sigmoid function (Eq. 19) is a nonlinear function commonly used to construct the neurons’ activation layer, characterized by continuous smooth and strictly monotonic. S(x) exhibits linearity near  and nonlinearity approximately after
  .
.
 |
19 |
Combining it with k(t) can prevent the search process from falling into premature convergence. It can further activate the local neighborhood search ability when the optimization process enters the convergence stage. The calculation formula of the adaptive dynamic snowmelt ratio is defined as:
 |
20 |
Among them, the  is to set the minimum value and maximum value of DDF. b is the damping factor, whose general value is [0, 1], t is the current iteration, and
  is the maximum iteration.
 |
21 |
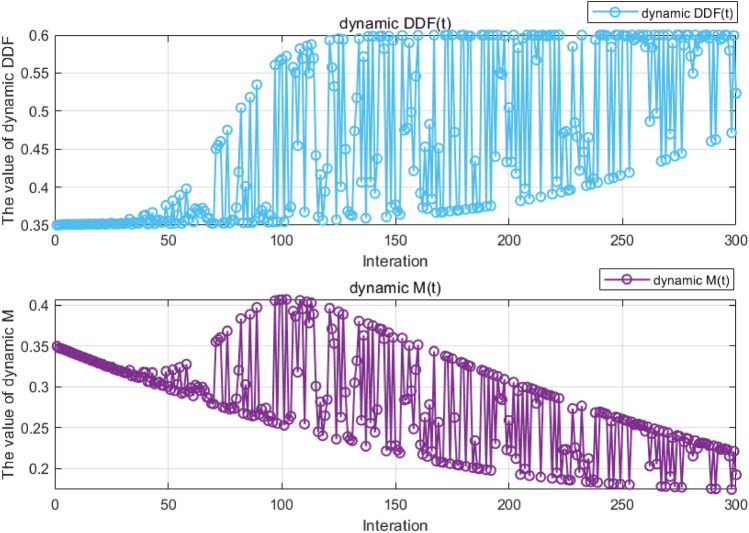
It can be seen from the SAO algorithm process that the evolutionary process is a process of gradual degradation of particle diversity, and particles generally maintain the characteristics of convergent evolution. k(t) well reflects the variation of the dispersion of such particles in the course of evolution. Figure 9 shows the change of  and
and  value when
  ,
,  . In the initial stage, the change of
  is almost the same as that in Fig. 7, which ensures that the agent can fully explore the solution space in this stage. In the middle of the iteration, when the evolutionary dispersion ratio k(t) is close to 1, this method can bring some oscillation to the agent iteration to increase the search activity. In the late iteration period, the M(t) oscillation range is gradually narrowed to ensure that the agent fully exploits the current position.
Fig. 9.
Trend curve of dynamic DDF and dynamic melt ratio over iterations.
Neighborhood dimensional searching
Standard works to improve meta-heuristic algorithms include differential evolution, iterative local search, reverse learning, and local oscillation. In this paper, a neighborhood dimensional search (NDS) method is proposed to improve the exploration position of other individuals except the optimal individual in the elite pool, which is a method using cross-mutation and greedy strategy to explore new possible solutions to ensure the quality of the current optimal agent. The primary process is shown in Fig. 10.
Fig. 10.
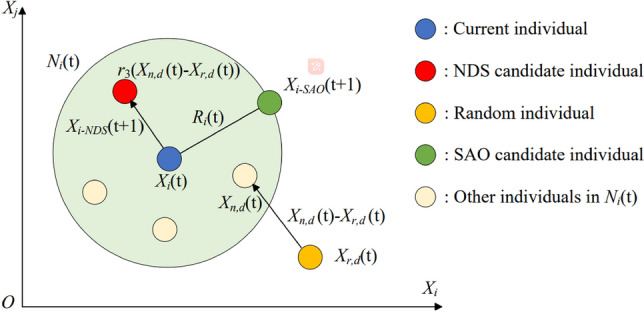
Schematic diagram of the cross term in NDS process.
First, the  agent’s position based on the exploration-exploitation process above named
  , and whose fitness value named
  next. Through the exploration-exploitation process,
  moves to the
  position with distance
  (Eq. 22), which is the radius of the search neighborhood
 |
22 |
The individuals in the neighborhood  form the following set (Eq. 23), Where
  is the Euclidean distance between
  and
and  .
.
 |
23 |
Based on the idea of cross-mutation, conduct the neighborhood dimensional search process on  by Eq. 24, where
  is the
  dimension of the randomly selected neighbor from
  ,
,  is the
  dimension of the random individual outside the
  . The position of
  after NDS process is
  :
:
 |
24 |
where  is a random value from 0 to 1. Finally, compare the fitness values of the two candidates position
  and
and  , a better agent position
  was selected (Eq. 25).
 |
25 |
In this process, the positions of the top three individuals in the elite pool ( ) do not do the NDS process, because the current global optimal value should be guaranteed.
The proposed GDSAO
In this section, three methods are proposed to improve the original SAO. The good point set increases the diversity of the initial solution, and the dynamic snowmelt ratio can prevent the premature convergence of the search agent. However, randomness exists in both methods. The increase in search diversity of agents can further reduce global fitness, but there is also the possibility of migrating to the worse local optimal solution. The NDS process ensures that the population moves towards a better solution, and the lousy solution brought by the first two methods can be effectively improved through this process.
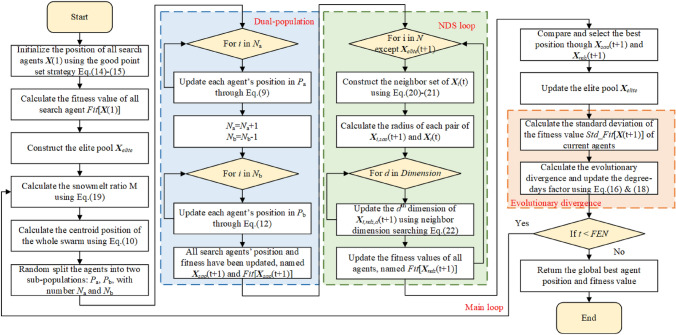
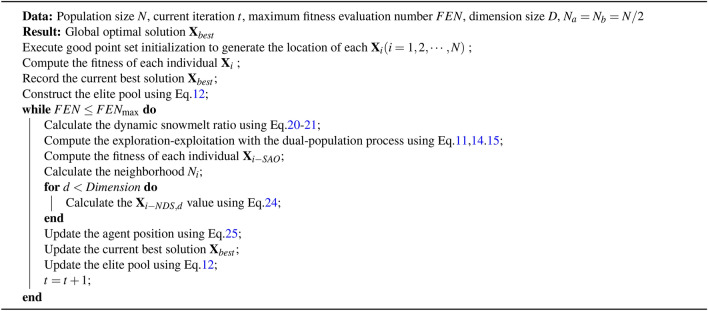
In this study, the maximum Fitness Evaluations Number ( ) is used as the condition to terminate the optimization. Based on the above process, the proposed GDSAO algorithm is shown in the pseudo-code Algorithm 2, and the calculation process is shown in the flow chart Fig. 11.
Fig. 11.
The flowchart of the proposed GDSAO.
Algorithm 2.
Global dynamic evolution snow ablation optimizer (GDSAO).
The time complexity of GDSAO mainly depends on five elements: population initialization, location updating, fitness calculation, and fitness ranking. The computational complexity required by the optimal point set strategy to generate individual positions is  , where N is the number of search agents and D is the solution space dimension. The fitness values of all individuals need to be calculated and sorted in each iteration. The calculation complexity is
  , where
  is the maximum number of iterations. The computational complexity for updating the location of all candidate solutions in the exploration and exploitation phase is
  . The time complexity of this paper’s neighborhood dimensional search strategy is
  . So overall, the time complexity of GDSAO is
  .
.
Testing on benchmark functions
The experiment and simulation studies in this section and the next section use MATLAB. The code runs on a computer equipped with a 12th Gen Intel(R) Core(TM) i7-12700H @ 2.30 GHz CPU, 16.0 GB RAM, and the Windows 11 operating system. The version of MATLAB used is R2024a.
Optimization results and comparison
The proposed GDSAO algorithm is used to optimize CEC 2017. Thirty 10-dimensional benchmark functions were studied experimentally. More details on these typical testing problems can be found in the paper34. These benchmark functions include four types: unimodal problems (F1–F3), simple multimodal problems (F4–F10), hybrid problems (F11–F20), and composition problems (F21–F30). These benchmark problems can reflect the algorithm’s performance in real-world optimization problems. Compare the proposed GDSAO with other improved SAO algorithms and advanced algorithms. There are original SAO, MSAO26, DESAO29, MPA35, EO36, CMA-ES37, jSO38.
The eight algorithms’ main parameters are shown in Table 1. In addition, the fundamental parameters remain consistent, such as the number of search agents  , the maximum fitness evaluation number
  , the search dimension
  , the search upper bound
  , and the search lower bound
  . Each algorithm was independently repeated 30 times, and two evaluation metrics were utilized to compare and analyze the optimization performance of each method intuitively: average value (mean) and standard deviation (std):
Table 1.
The main parameters of algorithms involved.
| Algorithm | Abbr. | Parameters settings | References |
|---|---|---|---|
| Global dynamic evolution snow ablation optimizer | GDSAO |
 , ,  , ,  , , 
|
– |
| Snow ablation optimizer | SAO |  |
25 |
| Multi-strategy boosted snow ablation optimizer | MSAO |
 , , 
|
26 |
| Differential vectors empower snow ablation optimizer | DESAO |  |
29 |
| Marine predators algorithm | MPA |  |
35 |
| Equilibrium optimizer | EO |  |
36 |
| Covariance matrix adaptation evolution strategy | CMA-ES |  |
37 |
| Single objective real-parameter optimization | jSO |  |
38 |
 |
26 |
where mean reflects the convergence accuracy of the algorithm, std quantifies the dispersion degree of the optimization results, i represents the number of repeated runs, n is the total number of runs,  represents the global optimal solution of the
  run, and
  is the theory optimal value of the reference function.
At the same time, the Friedman test39 was used to rank the average fitness of GDSAO and other algorithms. In Eq. 27, k is the sequence number of the algorithm,  is the average ranking of the
  algorithm and n is the number of test cases. The test assumes
  distribution with
  degrees of freedom. It first finds the rank of algorithms individually and then calculates the average rank to get the final rank of each algorithm for the considered problem.
 |
27 |
After calculation, the solution results of GDSAO and the other seven algorithms are shown in Table 2, where the bold terms are the optimal solution results under the reference function referred to in the row. We discuss the experimental results according to the class of the benchmark function. In all of the above problems, GDSAO outperforms the original SAO algorithm and several improved versions of SAO.
Unimodal functions (F1–F3): These three functions have only one global best solution, which is suitable for testing the exploitation ability of the algorithm. The performance of the GDSAO algorithm is better than other algorithms due to its dynamic snowmelt ratio and the improvement of the neighborhood dimensional search process in the exploitation process.
Simple multimodal functions (F4–F10): This kind of function has many locally optimal solutions, which is suitable for testing the exploration ability of the algorithm. GDSAO exhibits the best global exploration capabilities. The main reason is that the two-population mechanism always ensures the exploration ability and the initialization of the good point set improves the diversity of the initial population, which is beneficial in this multi-local optimal solution problem.
Hybrid functions (F11–F20): This kind of function contains many unimodal and multimodal functions, which are more challenging to optimize. On F12, F16, and F20, GDSAO is better than other methods, while on F14, F15, GDSAO optimization results are ranked 5-th and 3-rd, and the best result solved by jSO. In other benchmark functions, such as F11, F13, F17, F18 and F19, GDSAO achieved the second highest performance ranking, closely after jSO. The algorithm proposed in this paper gets relatively good results on such problems.
Composition functions (F21–F30): The composition benchmark function combines all the above function combinations. GDSAO achieves the best results on the ten benchmark functions on F22, F26 and F27. The second results were achieved on F21, F23, F24, F29, F30, and the third on F25 and F28. The results further show that the proposed algorithm has a good effect.
Table 2.
The experimental results from different algorithms.
| Function | Metric | GDSAO | SAO | MSAO | DESAO | MPA | EO | CMA-ES | jSO |
|---|---|---|---|---|---|---|---|---|---|
| F1 | Mean | 2.23E+00 | 3.90E+03 | 2.89E+00 | 6.30E+01 | 5.99E+01 | 4.91E+03 | 2.24E+05 | 0.00E+00 |
| Std | 4.82E+02 | 4.73E+03 | 2.62E+00 | 6.65E+01 | 6.25E+01 | 5.45E+03 | 1.94E+05 | 0.00E+00 | |
| F2 | Mean | 0.00E+00 | 6.44E+00 | 2.46E−12 | 1.05E+09 | 1.05E+09 | 1.40E+08 | 4.58E+31 | 0.00E+00 |
| Std | 3.82E+06 | 1.56E+01 | 7.29E+16 | 3.41E+09 | 3.46E+09 | 2.10E+08 | 7.19E+31 | 0.00E+00 | |
| F3 | Mean | 0.00E+00 | 4.09E+04 | 3.18E+04 | 6.06E+04 | 5.97E+04 | 7.11E+02 | 3.59E+05 | 5.94E−14 |
| Std | 2.66E+03 | 9.51E+03 | 9.89E+03 | 1.01E+04 | 1.07E+04 | 9.53E+02 | 4.73E+04 | 0.00E+00 | |
| F4 | Mean | 2.00E−01 | 8.18E+01 | 6.41E+01 | 8.97E+01 | 8.54E+01 | 8.81E+01 | 2.33E+01 | 6.86E+01 |
| Std | 1.21E+01 | 9.25E+00 | 3.90E+01 | 1.99E+01 | 1.65E+01 | 2.25E+01 | 8.98E−01 | 0.00E+00 | |
| F5 | Mean | 4.90E+00 | 4.75E+01 | 8.22E+01 | 5.35E+01 | 5.17E+01 | 6.52E+01 | 2.49E+02 | 2.44E+01 |
| Std | 2.81E+01 | 1.48E+01 | 6.55E+01 | 1.57E+01 | 1.22E+01 | 1.89E+01 | 1.52E+01 | 0.00E+00 | |
| F6 | Mean | 0.00E+00 | 3.57E−03 | 3.72E−04 | 5.72E−02 | 6.15E−02 | 3.40E−03 | 0.00E+00 | 3.25E−06 |
| Std | 7.39E−08 | 7.75E−03 | 1.56E−03 | 1.14E−01 | 1.50E−01 | 8.40E−03 | 0.00E+00 | 3.82E−06 | |
| F7 | Mean | 5.36E+01 | 7.47E+01 | 1.89E+02 | 6.74E+01 | 7.17E+01 | 9.26E+01 | 2.54E+02 | 4.32E+01 |
| Std | 2.31E+01 | 1.43E+01 | 5.37E+01 | 5.67E+00 | 6.13E+00 | 3.13E+01 | 1.17E+01 | 8.82E−01 | |
| F8 | Mean | 2.62E+01 | 4.98E+01 | 8.01E+01 | 4.81E+01 | 3.84E+01 | 6.31E+01 | 1.56E+02 | 6.45E+00 |
| Std | 7.81E+01 | 1.82E+01 | 5.84E+01 | 1.29E+01 | 1.28E+01 | 1.53E+01 | 4.54E+00 | 7.62E−01 | |
| F9 | Mean | 0.00E+00 | 7.46E+00 | 2.77E+00 | 2.70E+00 | 3.09E+00 | 2.26E+01 | 0.00E+00 | 0.00E+00 |
| Std | 9.03E−01 | 1.25E+01 | 4.60E+00 | 4.39E+00 | 4.55E+00 | 4.60E+01 | 0.00E+00 | 0.00E+00 | |
| F10 | Mean | 2.29E+02 | 3.00E+03 | 7.35E+03 | 2.68E+03 | 2.76E+03 | 3.76E+03 | 7.48E+03 | 2.85E+03 |
| Std | 1.66E+03 | 6.43E+02 | 8.82E+02 | 5.14E+02 | 4.53E+02 | 5.72E+02 | 2.97E+02 | 2.44E+02 | |
| F11 | Mean | 3.88E+01 | 4.68E+01 | 3.44E+01 | 4.48E+01 | 4.21E+01 | 5.69E+01 | 2.51E+03 | 2.04E+01 |
| Std | 4.14E+01 | 3.59E+01 | 4.06E+01 | 3.26E+01 | 3.63E+01 | 3.47E+01 | 9.03E+02 | 7.56E−01 | |
| F12 | Mean | 1.65E+04 | 6.88E+04 | 6.82E+04 | 3.15E+04 | 3.01E+04 | 7.68E+04 | 2.13E+07 | 1.45E+03 |
| Std | 1.86E+04 | 3.64E+04 | 5.97E+04 | 9.04E+03 | 8.57E+03 | 5.54E+04 | 8.01E+06 | 3.93E+02 | |
| F13 | Mean | 3.21E+02 | 9.26E+03 | 1.56E+04 | 2.45E+04 | 2.54E+04 | 2.23E+04 | 4.85E+06 | 3.29E+02 |
| Std | 2.18E+03 | 1.09E+04 | 9.31E+03 | 2.37E+04 | 2.13E+04 | 2.77E+04 | 4.12E+06 | 5.87E+00 | |
| F14 | Mean | 6.27E+02 | 1.87E+04 | 2.57E+02 | 1.21E+02 | 1.97E+02 | 8.90E+03 | 2.12E+05 | 2.55E+01 |
| Std | 5.32E+02 | 1.43E+04 | 6.10E+01 | 2.39E+01 | 3.18E+01 | 6.61E+03 | 2.71E+05 | 1.66E+00 | |
| F15 | Mean | 5.21E+02 | 3.92E+03 | 4.96E+02 | 2.49E+03 | 1.78E+03 | 4.43E+03 | 2.58E+06 | 2.02E+01 |
| Std | 1.49E+03 | 3.29E+03 | 6.09E+02 | 1.92E+03 | 2.13E+03 | 3.75E+03 | 1.98E+06 | 1.72E+01 | |
| F16 | Mean | 5.54E+01 | 7.42E+02 | 5.25E+02 | 8.34E+02 | 8.33E+02 | 7.14E+02 | 1.55E+03 | 3.27E+02 |
| Std | 4.71E+02 | 2.92E+02 | 4.08E+02 | 2.48E+02 | 2.42E+02 | 2.44E+02 | 1.85E+02 | 1.90E+02 | |
| F17 | Mean | 3.19E+01 | 2.65E+02 | 1.91E+02 | 3.18E+02 | 2.44E+02 | 2.73E+02 | 5.93E+02 | 5.54E+01 |
| Std | 2.43E+02 | 1.69E+02 | 7.20E+01 | 2.42E+02 | 2.14E+02 | 2.44E+02 | 2.86E+02 | 4.10E+00 | |
| F18 | Mean | 9.27E+03 | 1.82E+05 | 3.67E+05 | 7.00E+04 | 7.03E+04 | 1.62E+05 | 3.80E+06 | 2.96E+01 |
| Std | 1.45E+04 | 6.04E+04 | 3.79E+05 | 6.96E+04 | 6.85E+04 | 8.45E+04 | 3.53E+06 | 3.14E+00 | |
| F19 | Mean | 9.99E+01 | 3.79E+03 | 2.03E+03 | 2.94E+03 | 2.96E+03 | 4.29E+03 | 2.87E+06 | 2.46E+01 |
| Std | 9.92E+01 | 3.81E+03 | 2.76E+03 | 2.27E+03 | 2.49E+03 | 5.30E+03 | 1.61E+06 | 3.75E+00 | |
| F20 | Mean | 1.90E+01 | 2.54E+02 | 2.28E+02 | 3.17E+02 | 2.89E+02 | 3.66E+02 | 6.32E+02 | 9.39E+01 |
| Std | 2.76E+02 | 2.11E+02 | 1.39E+02 | 1.89E+02 | 2.04E+02 | 2.12E+02 | 1.78E+02 | 7.59E+01 | |
| F21 | Mean | 2.71E+02 | 2.94E+02 | 2.60E+02 | 3.14E+02 | 3.17E+02 | 3.36E+02 | 3.75E+02 | 1.67E+02 |
| Std | 7.71E+01 | 1.73E+01 | 5.55E+01 | 1.41E+01 | 2.00E+01 | 2.49E+01 | 7.46E+00 | 4.81E−01 | |
| F22 | Mean | 1.93E+02 | 1.13E+02 | 1.59E+03 | 1.94E+02 | 1.35E+02 | 6.43E+02 | 8.03E+03 | 1.61E+02 |
| Std | 2.16E+02 | 1.66E+00 | 3.88E+03 | 1.78E−11 | 1.45E−11 | 1.62E+03 | 3.67E+02 | 0.00E+00 | |
| F23 | Mean | 3.98E+02 | 4.48E+02 | 4.13E+02 | 4.51E+02 | 4.04E+02 | 4.30E+02 | 5.54E+02 | 3.64E+02 |
| Std | 2.01E+01 | 2.02E+01 | 4.74E+01 | 7.40E+00 | 7.91E+00 | 2.77E+01 | 1.78E+01 | 4.61E+00 | |
| F24 | Mean | 3.45E+02 | 5.46E+02 | 5.87E+02 | 5.72E+02 | 5.27E+02 | 5.22E+02 | 5.92E+02 | 5.33E+02 |
| Std | 4.76E+01 | 2.77E+01 | 6.72E+01 | 2.27E+01 | 2.61E+01 | 2.57E+01 | 7.15E+01 | 1.89E+01 | |
| F25 | Mean | 4.26E+02 | 4.14E+02 | 4.74E+02 | 4.82E+02 | 4.82E+02 | 4.36E+02 | 3.99E+02 | 4.12E+02 |
| Std | 5.89E−01 | 2.82E+00 | 2.39E+00 | 2.22E+00 | 1.96E+00 | 1.90E+01 | 3.22E−01 | 5.74E−02 | |
| F26 | Mean | 2.16E+02 | 2.53E+03 | 2.05E+03 | 1.62E+03 | 2.04E+03 | 2.56E+03 | 2.78E+03 | 2.03E+03 |
| Std | 1.05E+02 | 2.02E+02 | 8.19E+01 | 6.02E+02 | 6.31E+02 | 2.51E+02 | 1.66E+02 | 3.03E+02 | |
| F27 | Mean | 3.92E+02 | 6.14E+02 | 5.32E+02 | 5.49E+02 | 5.65E+02 | 6.12E+02 | 5.08E+02 | 5.55E+02 |
| Std | 1.77E+01 | 7.37E+00 | 2.46E−05 | 1.73E+01 | 1.72E+01 | 1.90E+01 | 4.31E−05 | 6.33E−01 | |
| F28 | Mean | 4.24E+02 | 4.75E+02 | 5.83E+02 | 4.13E+02 | 4.77E+02 | 4.15E+02 | 5.19E+02 | 3.74E+02 |
| Std | 6.14E+01 | 6.50E+01 | 1.77E−05 | 6.08E+01 | 5.72E+01 | 4.71E+01 | 6.49E−05 | 8.99E+01 | |
| F29 | Mean | 5.13E+02 | 7.21E+02 | 5.94E+02 | 6.82E+02 | 7.22E+02 | 7.01E+02 | 2.40E+03 | 3.04E+02 |
| Std | 2.51E+02 | 2.41E+02 | 8.79E+01 | 1.47E+02 | 1.74E+02 | 1.62E+02 | 2.63E+02 | 5.02E+01 | |
| F30 | Mean | 2.83E+03 | 5.67E+03 | 4.72E+03 | 6.01E+03 | 5.51E+03 | 6.42E+03 | 3.12E+06 | 2.82E+03 |
| Std | 3.51E+02 | 2.62E+03 | 3.35E+03 | 3.68E+03 | 4.33E+03 | 3.05E+03 | 2.01E+06 | 2.71E+02 | |
| Friedman | Ranking | 2.0667 | 5.1333 | 4.4333 | 4.9000 | 4.8000 | 5.8000 | 6.9333 | 1.9333 |
Significant values are in bold.
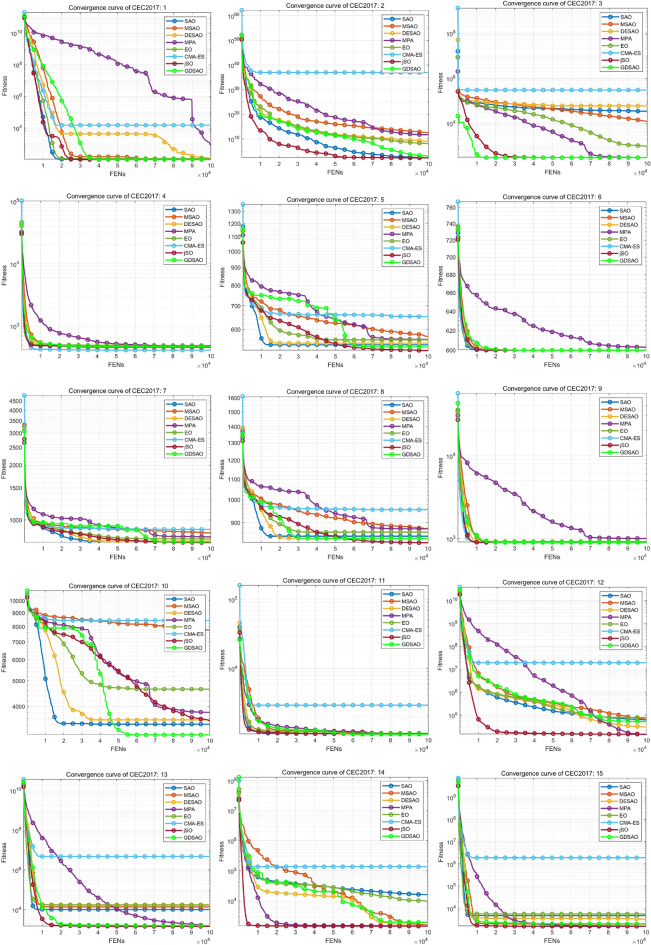
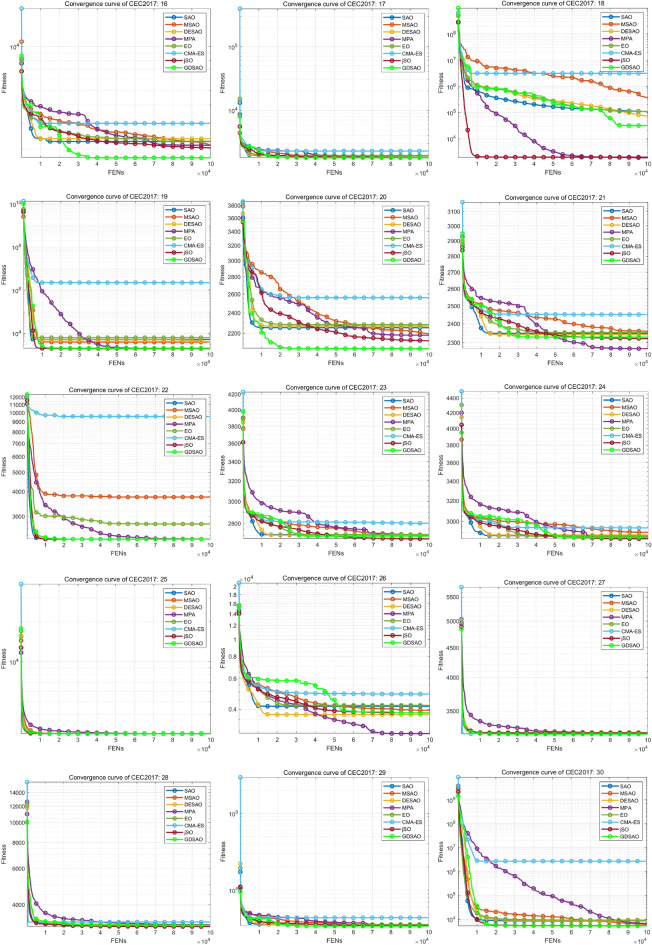
The Friedman test rankings for all the algorithms above are shown in Table 3 and Fig. 12, and the evolution curve of the population’s average fitness is shown in Figs. 13 and 14. The proposed GDSAO algorithm performs very well, with a comprehensive ranking of 2.0667. In particular, compared to the original SAO’s ranking of 5.1333, the performance has improved significantly, also better than MSAO’s 4.4333 ranking and DESAO’s 4.9000 ranking. The ranking is second only to jSO algorithm 1.9333. This shows that the three improvement measures proposed, initialization of the best point set, dynamic snowmelt ratio, and neighborhood dimensional search, effectively complete the improvement in exploration and exploitation and cooperate reasonably with each other.
Table 3.
The Friedman test ranking.
| Algorithm | Ranking |
|---|---|
| GDSAO | 2.0667 |
| SAO | 5.1333 |
| MSAO | 4.4333 |
| DESAO | 4.9000 |
| MPA | 4.8000 |
| EO | 5.8000 |
| CMA-ES | 6.9333 |
| jSO | 1.9333 |
Significant values are in bold.
Fig. 12.
Test ranking of each algorithm on CEC2017.
Fig. 13.
Evolution curve of CGO and other algorithms on CEC2017 10-dimension reference function (F1–F15).
Fig. 14.
Evolution curve of CGO and other algorithms on CEC2017 10-dimension reference function (F16–F30).
In addition, Wilcoxon tests39 are tested on GDSAO and seven other algorithms. Test results such as Table 4, in all cases, obtain a Wilcoxon tests value p less than 5%. In all cases, the optimization performance of GDSAO is significantly better than other algorithms.
Table 4.
The Wilcoxon test result of CGO and other algorithms on CEC2017.
| Comparison | Wilcoxon test |
|---|---|
| GDSAO versus SAO | 9.318e−06 |
| GDSAO versus MSAO | 2.410E−04 |
| GDSAO versus DESAO | 1.056E−04 |
| GDSAO versus MPA | 1.251E−04 |
| GDSAO versus EO | 2.126E−05 |
| GDSAO versus CMA-ES | 4.716E−06 |
| GDSAO versus jSO | 2.104E−03 |
Through the evolution curve, it can be seen that the convergence speed of GDSAO (green line) is much faster than other algorithms, and it can quickly converge to the optimal value. GDSAO showed rapid evolution in the early stage of iteration, showing an excellent ability to search the global space. In contrast, in the middle and late stages of iteration, GDSAO maintained a persistent local exploitation ability on many issues, and its evolution curve consistently declined slowly to avoid premature convergence. This also shows the adaptive ability to improve the dynamic snowmelt ratio to evolutionary dispersion k.
Improvement strategy analysis
GDSAO incorporates three improvement strategies, each of which plays a different role in different stages of evolution:
- Good point set initialization (GPSI): Use the position diversity to evaluate the diversity of population distribution in search space.
where
28  is the coordinates of the i particle in the j dimension, and
  is the average coordinates of all individuals in the j dimension. The GPSI can greatly improve the fitness and diversity of the initial population. When the search space and the number of particles are determined, the result of the GPSI is determined. In the 30 problems of 10-dimensional CEC2017, 30 initial populations are randomly generated and the optimal fitness is calculated, and the optimal fitness of the initial populations is compared with the GPSI. The result is that in 900 sets of random initialization results, the optimal fitness of the GPSI exceeds 792 of them. In addition, When
 ,
,  ,
,  , the initial population diversity generated by GPSI is
  . The average Div from 900 random initializations is 179.5733. The results show that GPSI can ensure better location diversity of the initial population and improve the initial fitness to a large extent.
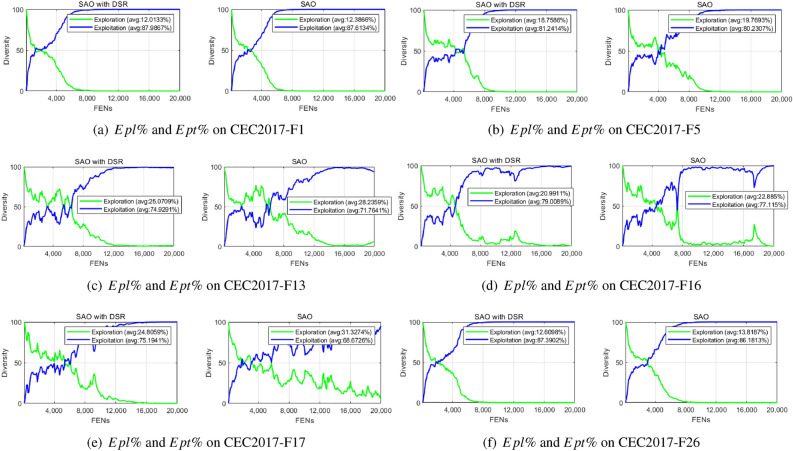
 - Dynamic snowmelt ratio (DSR): The DSR adds dynamic changes to the process of population evolution. Hussain et al.40 put forward an approach to measure and analyze the capability of exploitation and exploration in meta-heuristic algorithms. We used this method to measure the extent of population exploration and exploitation:
where
29  represents the maximum diversity.
  and
and  refer to the exploration percentage and exploitation percentage, respectively. Fig. 15 shows the evolution of
  and
and  on some benchmark functions (F1, F5, F13, F16, F17, F26) with SAO incorporates DSR and original SAO. It can be seen that DSR method can improve the exploitation capability of the original SAO. In some Hybrid functions (such as F13 and F16), the exploitation capability of the original SAO deteriorates at the end of the iteration, and DRS can make up for the deficiency of SAO in the face of Hybrid functions.
 Neighborhood dimensional searching (NDS): NDS uses the idea of cross-mutation and greedy strategies to further enhance the overall fitness of the population through repeated searches. It is also GDSAO’s main strategy for improving fitness. By comparing the original SAO with the GDSAO (The first and second columns of the Table 2), it can be seen that the NDS process can improve the optimization ability of SAO and obtain better population fitness.
Fig. 15.
The optimal navigation path obtained by GDSAO.
Solving UAV path planning based on GDSAO
Problem statement
This section uses the GDSAO algorithm to plan the path of the UAV from the starting point to the target point. We construct a configuration space  with a range of
  , and the topographical elevation data is derived from the digital elevation model (DEM) measured by LiDAR sensors, as cited in Phung and Ha’s work41. The UAV starts with
  and ends with
  . Several obstacles threaten the zones distributed in the space. As shown in Fig. 16. Table 5 lists each obstacle’s spherical center position and radius.
Fig. 16.
Configuration space and obstacle threaten zones for UAV path planning.
Table 5.
The obstacle threaten zones position and radius.
| Center (X, Y) | Obstacle radius | Threaten zone radius |
|---|---|---|
| (300, 500) | 80 | 90 |
| (500, 200) | 70 | 80 |
| (450, 350) | 80 | 90 |
| (250, 200) | 70 | 80 |
| (600, 550) | 70 | 80 |
| (550, 750) | 80 | 90 |
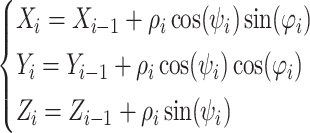
Instead of directly using the Cartesian coordinates  to describe the waypoints, use Spherical coordinates
  to represent the flight action of the UAV better. Where
  represents the Euclidean distance between the front and back path points,
  represents the direction Angle of the front and back paths projected onto the datum plane
  , and
, and  represents the pitch Angle of the front and back paths on the vertical plane. Spherical coordinate system
  transition to the Cartesian coordinate system
  formula is:
 |
30 |
Parameters setup
The number of path control points for path planning is 4 (without starting and goal point), representing five paths, so the dimension of the decision variable D is 15. The maximum fitness evaluation number of the algorithm  , the number of search agents is 100, and running 30 times independently. The parameters are defined as Table 6.
Table 6.
The parameters setup of UAV path planning.
| GDSAO parameters | Value | Problem parameters | Value | Problem parameters | Value |
|---|---|---|---|---|---|
| D | 15 |  |
10,000 |  |
5 |
| N | 100 |  |
10,000 |  |
3 |
 |
100,000 |  |
200 |  |
10 |
| b | 0.5 |  |
100 |  |
1 |
 |
2 |  |
45 | Waypoints | 101 |
 |
0.5 |  |
45 | Segments | 100 |
To make each cost have the same impact on the result, the corresponding weight coefficient of each cost should be adjusted to make the order of magnitude as consistent as possible42:  . Due to the different orders of magnitude of different penalty functions, the weight coefficients are different, where
  to maintain the basic path length constraint,
  and
and  to enhance the obstacle avoidance threat and flight height constraint, to ensure the safety of navigation. The
  value is relatively small to give the optimizer the possibility to explore between obstacles.
  provides basic Angle constraints.
In this experiment, the UAV navigation path was simulated from the control point using the Piece-wise Cubic Hermite Interpolation method in MATLAB. The total path points of the interpolation path, including the starting and goal points, are 101, so the path segments are 100. In calculating the path objective function, Eq. 8 is needed to consider all the path points.
Optimized performance of GDSAO and comparison
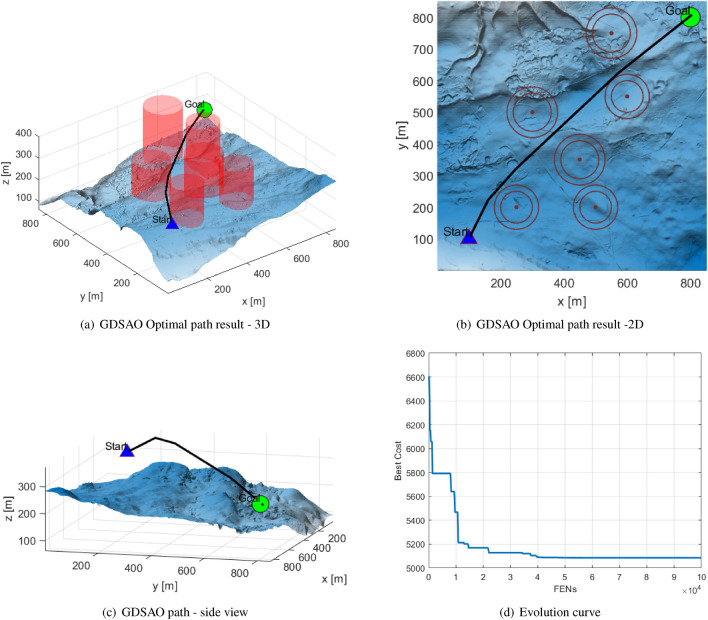
Figure 17 is the optimal navigation path obtained by the GDSAO solution, and the route satisfies the navigation obstacle avoidance threat constraint and Angle constraint. Figure 17a is a 3D image of the path planning result. Figure 17b Path planning results as viewed from above. The inner ring of the red concentric circle is the obstacle area where the UAV is not navigable, and the outer ring is the threat area where the UAV can navigate, but the cost is high. The path does not enter the threat area. Figure 17c Path planning results as viewed from the right. Figure 17d is the evolution curve of the GDSAO solution, which converges to the result state after 40,000 evaluations.
Fig. 17.
The optimal navigation path obtained by GDSAO.
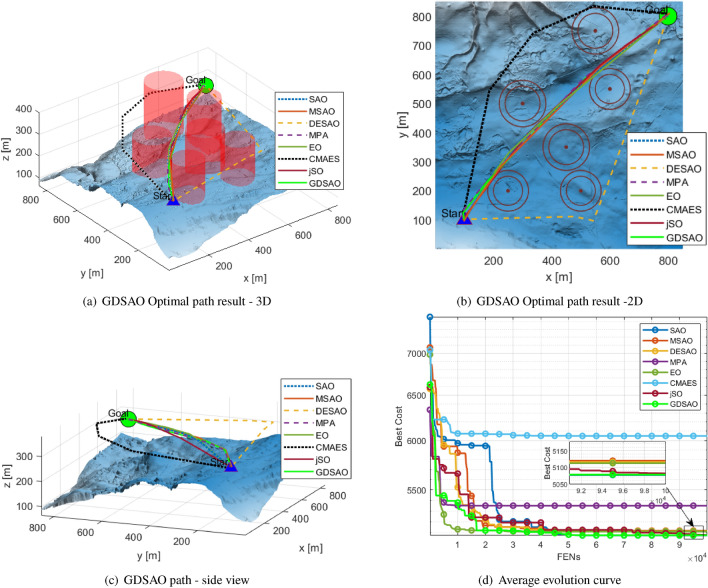
Among those 10 planned paths, the fitness value of the best path is 5073.741, and the fitness value of the longest path is 5887.507. Table 7 shows the optimal fitness, average fitness, worst fitness, and standard deviation of 10 repeated experiments of UAV path solution results of eight optimization algorithms. Figure 18 represents eight optimization algorithms’ best path results and evolution curves. Moreover, we get the following observations:
All the meta-heuristic algorithms can find the solution satisfying the constraint, which shows that it is feasible to solve the spatial path planning with this idea. At the same time, the diversity of solutions also shows the complexity of the problem, and many local optimal values can be used to test the optimization ability of the algorithm.
As can be seen from Fig. 18, most algorithms tend to plan a path through a group of obstacle threatens zones, such as SAO, MSAO, MPA, EO, jSO, and GDSAO. CMA-ES and DESAO fared poorly in this problem, bypassing the obstacle from the outside. It shows that most algorithms have good exploration ability in this problem. Even if the primary trend is consistent with other algorithms, GDSAO can find a better fitness path, indicating that GDSAO has better exploitation ability.
In terms of the best and average results shown in Table 7, the GDSAO algorithm is entirely ahead of other algorithms, which also show different performances. CMA-ES performs the worst.
The GDSAO has a slight standard deviation, which is followed by CMA-ES, DESAO, and jSO. It is further proved that the GDSAO algorithm is effective and ensures the optimality and stability of the generated path.
From the average evolution curve (Fig. 18d), it can be seen that the evolution process of the GDSAO algorithm in the initial evaluations stage (FENs < 20,000) is relatively fast. In the middle and late evaluations (FENs> 20,000), the average fitness of GDSAO populations continued to decline. At the same time, SAO, DESAO, MSAO, EO, jSO, and other algorithms converged during the same period.
Table 7.
The paths’ fitness value from different algorithms.
| Algorithms | Best | Mean | Worst | Std |
|---|---|---|---|---|
| GDSAO | 5073.741 | 5146.414 | 5887.507 | 265.597 |
| SAO | 5078.040 | 5641.256 | 6500.378 | 382.861 |
| MSAO | 5110.285 | 5892.034 | 6580.728 | 303.868 |
| DESAO | 5110.008 | 5345.213 | 5910.998 | 268.650 |
| MPA | 5359.281 | 5509.101 | 6221.366 | 347.806 |
| EO | 5106.335 | 5460.537 | 6164.635 | 322.017 |
| CMA-ES | 6053.564 | 6592.493 | 6905.274 | 263.752 |
| jSO | 5083.865 | 5169.144 | 5897.199 | 188.564 |
Fig. 18.
Configuration space for UAV path planning.
Path planning in different scenarios
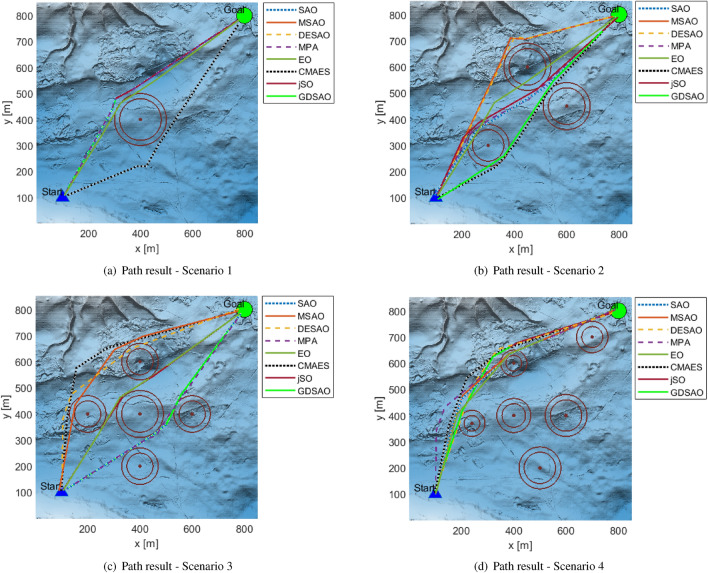
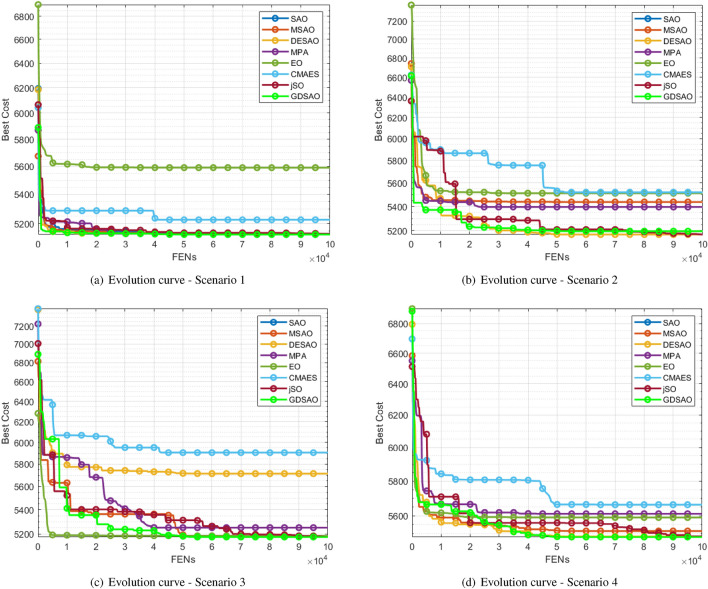
GDSAO’s ability to solve UAV path planning was tested in four scenarios. The four scenarios’ central coordinates, obstacle radius, and threat area radius are shown in Table 8. Scenario 1 is a single obstacle threat scenario to test basic path planning capabilities. Scenario 2 is a multi-obstacle threat scenario, which is symmetrically distributed to the path planner with multiple path choices. The UAV can choose a more conservative external path or an internal path with less overhead. Scenario 3 is a more complex multi-obstacle threat scenario that further validates the optimization capabilities of the path planner. Scenario 4 is the hybrid scenario by randomly generated obstacle threat zones.
Table 8.
The obstacle threaten zones position and radius in four different scenarios.
| Scenario | Center (X, Y) | Obstacle | Threaten zone |
|---|---|---|---|
| 1 | (400, 400) | 100 | 110 |
| (300, 300) | 70 | 80 | |
| 2 | (600, 450) | 80 | 90 |
| (450, 600) | 80 | 90 | |
| (400, 400) | 90 | 100 | |
| (600, 400) | 70 | 80 | |
| 3 | (200, 400) | 70 | 80 |
| (400, 600) | 70 | 80 | |
| (400, 200) | 70 | 80 | |
| (700, 700) | 60 | 70 | |
| (240, 370) | 50 | 60 | |
| 4 | (400, 600) | 50 | 60 |
| (600, 400) | 80 | 90 | |
| (500, 200) | 80 | 90 | |
| (400, 400) | 65 | 75 |
After solving, the optimal fitness of GDSAO and the other seven algorithms is shown in Table 9. In Scenario 1, Scenario 3, and Scenario 4, GDSAO obtained optimal path results of 5114.396, 5164.851, and 5474.661, respectively. In scenario 2, the optimal path is obtained by the DESAO, which is 5166.529, and GDSAO obtains the third result, 5170.354, very close to 5168.134 of the original SAO in the second place. It can be seen that GDSAO’s path planning performance in various scenarios can obtain relatively good results.
Table 9.
The paths’ fitness value from different algorithms in four different scenarios.
| Algorithms | Scenario 1 | Scenario 2 | Scenario 3 | Scenario 4 |
|---|---|---|---|---|
| GDSAO | 5114.396 | 5170.354 | 5164.851 | 5474.661 |
| SAO | 5127.293 | 5168.134 | 5171.069 | 5488.419 |
| MSAO | 5131.991 | 5429.322 | 5168.997 | 5516.781 |
| DESAO | 5127.452 | 5166.529 | 5722.731 | 5589.687 |
| MPA | 5126.176 | 5403.372 | 5253.598 | 5606.115 |
| EO | 5608.788 | 5507.475 | 5177.141 | 5594.212 |
| CMA-ES | 5230.970 | 5519.666 | 5903.849 | 5671.965 |
| jSO | 5139.551 | 5202.336 | 5166.304 | 5482.377 |
Significant values are in bold.
Figures 19 and 20 show the path solution results and evolution curves of various optimization algorithms in four scenarios. In scenario 1, with only a single obstacle, it is not difficult to find a suitable path. However, the smoothness of the generated path can be tested, and the algorithm’s exploitation ability can be seen. The path generated by GDSAO is closer to the edge of the obstacle threat area, and the path corners are smoother than those generated by other algorithms such as CMA-ES, etc. Scenario 2 adds two barrier threats to this distribution on top of Scenario 1. The GDSAO, jSO, MPA, CMA-ES, and SAO obtained the path through the obstacles, which was shorter in terms of distance. EO obtained the more smooth path, but because some of the paths passed through the threat area, the overall fitness was higher than otherwise planned. Scenario 3 consists of five centrally symmetrical obstacle threats. Most of the generated paths are from the outside around the obstacle threat, with the GDSAO, MPA, jSO and EO algorithm going through the middle of the obstacle, which shows that these algorithms show strong exploitation ability in this scenario. Scenario 4 is an unplanned obstacle threat where all paths are routed from the same side. GDSAO also achieves optimal results.
Fig. 19.
Result of UAV path planning in four scenarios.
Fig. 20.
Evolution curve of UAV path planning in four scenarios.
In summary, the GDSAO proposed in this paper performs well in UAV space path planning. It shows that this algorithm has advantages in solving complex real problems and has the possibility of further research and application.
Conclusion and discussion
This paper establishes UAVs’ path obstacle avoidance model in a three-dimensional environment with obstacle threats. In path-planning modeling, the objective function of the UAV path is established in the form of penalty terms by obstacle threat, height threat, and permissible Angle, and a complete UAV path is generated based on several path control points through Spline interpolation.
In the optimization algorithm part, this paper proposes a global dynamic evolution improved snow ablation optimizer algorithm based on SAO. It includes three algorithm improvement measures, all of which can improve the global evolution of the population. The optimal point set initialization makes the initial solution evenly distributed in the search space, improves the diversity of the initial population, and ensures the quality of the initial solution. The dynamic snowmelt ratio method introduces the concept of evolutionary dispersion of the population, which reflects the degree of fitness change of the population under two adjacent iterations and applies it to the algorithm’s exploitation process. This enables the population to dynamically and automatically adapt to the changes in Fitness under different exploitation situations, thus reducing the exploitation speed of agents that develop too fast and increasing incentives for agents that gradually converge. The neighborhood dimensional search increases the local exploitation ability and finds a better solution near the current population location. Meanwhile, the neighborhood dimensional search does not modify the top three optimal agents in the elite pool, which ensures the global optimal value and the overall evolution trend.
To test the proposed algorithm’s performance, we first tested it on thirty 10-dimension functions of CEC 2017. We compared it with seven advanced optimization algorithms: SAO, MSAO, DESAO, MPA, EO, CMA-ES, and jSO. According to the Friedman test, the GDSAO algorithm ranks 2.1667 out of 8 algorithms, the performance is very close to that of jSO. The solution process shows that GDSAO performs well in exploration and exploitation processes.
Solving the UAV path planning problem in a 3D environment, all eight optimization algorithms can obtain the path without violating the obstacle threat and angle constraint. After 30 repeated runs of each algorithm, the results show that the results of the GDSAO algorithm are optimal in terms of optimal path length and average path length. The standard deviation of the path is also smaller than that of other algorithms, which proves the validity and stability of GDSAO in solving the path planning of space UAVs. It further indicates that GDSAO has the competitive power of optimization.
GDSAO is a single-objective optimization algorithm for continuous problems, so in future work, versions of GDSAO can be further developed for more types of problems. At the same time, the ability to solve more complex and cutting-edge large-scale problems can also be further studied.
Acknowledgements
This work was supported by National Key Laboratory of Autonomous Intelligent Unmanned Systems.
Author contributions
C.L. Conceptualization, Methodology, Software, and Writing—Original Draft, D.Z. Investigation, Project administration, Supervision and Writing—Review and Editing, W.L. Software and Validation. All authors reviewed the manuscript.
Data availability
All data generated or analysed during this study are included in this published article. The GDSAO code, CEC2017 parameters and terrain data are included in: https://github.com/RivenSartre/GDSAO_uav_path_planning.
Declarations
Competing interests
The authors declare no competing interests.
Footnotes
Publisher's note
Springer Nature remains neutral with regard to jurisdictional claims in published maps and institutional affiliations.
References
- 1.Pandey, A., Panwar, V. S., Hasan, M. E. & Parhi, D. R. V-rep-based navigation of automated wheeled robot between obstacles using pso-tuned feedforward neural network. J. Comput. Des. Eng.[SPACE]10.1093/jcde/qwaa035 (2020). [Google Scholar]
- 2.Besada-Portas, E., de la Torre, L., de la Cruz, J. M. & de Andrés-Toro, B. Evolutionary trajectory planner for multiple UAVs in realistic scenarios. IEEE Trans. Rob.26(4), 619–634 (2010). [Google Scholar]
- 3.Wang, H., Mao, W. & Eriksson, L. A three-dimensional Dijkstra’s algorithm for multi-objective ship voyage optimization. Ocean Eng.186, 106131 (2019). [Google Scholar]
- 4.Singh, Y., Sharma, S., Sutton, R., Hatton, D. & Khan, A. A constrained A* approach towards optimal path planning for an unmanned surface vehicle in a maritime environment containing dynamic obstacles and ocean currents. Ocean Eng.169, 187–201 (2018). [Google Scholar]
- 5.Liu, Y. & Bucknall, R. The angle guidance path planning algorithms for unmanned surface vehicle formations by using the fast marching method. Appl. Ocean Res.59, 327–344 (2016). [Google Scholar]
- 6.Yuan, L., Zhao, J., Li, W. & Hou, J. Improved Informed-RRT* Based Path Planning and Trajectory Optimization for Mobile Robots. Int. J. Precis. Eng. Manuf.24(3), 435–446 (2023). [Google Scholar]
- 7.Ma, Q., Li, M., Huang, G. H. & Ullah, S. Overtaking path planning for CAV based on improved artificial potential field. IEEE Trans. Veh. Technol.73(2), 1611–1622 (2024). [Google Scholar]
- 8.Tu, Q., Chen, X. & Liu, X. Multi-strategy ensemble grey wolf optimizer and its application to feature selection. Appl. Soft Comput.[SPACE]10.1016/j.asoc.2018.11.047 (2019). [Google Scholar]
- 9.Mirjalili, S., Mirjalili, S. M. & Lewis, A. Grey wolf optimizer. Adv. Eng. Softw.[SPACE]10.1016/j.advengsoft.2013.12.007 (2014). [Google Scholar]
- 10.Holland, J. Genetic algorithms. Adaptation in Natural and Artificial Systems (1975).
- 11.Storn, R. & Price, K. Differential evolution—a simple and efficient heuristic for global optimization over continuous spaces. J. Global Optim.[SPACE]10.1023/a:1008202821328 (1997). [Google Scholar]
- 12.Rashedi, E., Nezamabadi-pour, H. & Saryazdi, S. Gsa: A gravitational search algorithm. Inf. Sci.[SPACE]10.1016/j.ins.2009.03.004 (2009). [Google Scholar]
- 13.Kirkpatrick, S., Gelatt, C. D. & Vecchi, M. P. Optimization by simulated annealing. Science[SPACE]10.1126/science.220.4598.671 (1983). [DOI] [PubMed] [Google Scholar]
- 14.Mirjalili, S., Mirjalili, S. M. & Hatamlou, A. Multi-verse optimizer: a nature-inspired algorithm for global optimization. Neural Comput. Appl.[SPACE]10.1007/s00521-015-1870-7 (2016). [Google Scholar]
- 15.Mirjalili, S. Sca: A sine cosine algorithm for solving optimization problems. Knowl.-Based Syst.[SPACE]10.1016/j.knosys.2015.12.022 (2016). [Google Scholar]
- 16.Abualigah, L., Diabat, A., Mirjalili, S., Abd Elaziz, M. & Gandomi, A. H. The arithmetic optimization algorithm. Comput. Methods Appl. Mech. Eng.[SPACE]10.1016/j.cma.2020.113609 (2021). [Google Scholar]
- 17.Poli, R., Kennedy, J. & Blackwell, T. Particle swarm optimization. Swarm Intell.[SPACE]10.1007/s11721-007-0002-0 (2007). [Google Scholar]
- 18.Karaboga, D. & Basturk, B. A powerful and efficient algorithm for numerical function optimization: artificial bee colony (abc) algorithm. J. Global Optim.[SPACE]10.1007/s10898-007-9149-x (2007). [Google Scholar]
- 19.Mirjalili, S. & Lewis, A. The whale optimization algorithm. Adv. Eng. Softw.[SPACE]10.1016/j.advengsoft.2016.01.008 (2016). [Google Scholar]
- 20.Heidari, A. A. et al. Harris hawks optimization: Algorithm and applications. Futur. Gener. Comput. Syst.[SPACE]10.1016/j.future.2019.02.028 (2019). [Google Scholar]
- 21.Nadimi-Shahraki, M. H., Taghian, S. & Mirjalili, S. An improved grey wolf optimizer for solving engineering problems. Expert Syst. Appl.[SPACE]10.1016/j.eswa.2020.113917 (2021). [Google Scholar]
- 22.Luo, J., Liang, Q. & Li, H. UAV penetration mission path planning based on improved holonic particle swarm optimization. J. Syst. Eng. Electron.34(1), 197–213 (2023). [Google Scholar]
- 23.Fouad, A. et al. Enhancing Individual UAV Path Planning With Parallel Multi-Swarm Treatment Coronavirus Herd Immunity Optimizer (PMST-CHIO) Algorithm. IEEE Access12, 28395–28416 (2024). [Google Scholar]
- 24.Wang, W., Ye, C. & Tian, J. SGGTSO: A spherical vector-based optimization algorithm for 3D UAV path planning. Drones7(7), 452 (2023). [Google Scholar]
- 25.Deng, L. & Liu, S. Snow ablation optimizer: A novel metaheuristic technique for numerical optimization and engineering design. Expert Syst. Appl.[SPACE]10.1016/j.eswa.2023.120069 (2023). [Google Scholar]
- 26.Xiao, Y., Cui, H., Hussien, A. & Hashim, F. Msao: A multi-strategy boosted snow ablation optimizer for global optimization and real-world engineering applications. Adv. Eng. Inform.[SPACE]10.1016/j.aei.2024.102464 (2023). [Google Scholar]
- 27.Abd Elaziz, M., Al-qaness, M. A. A., Ibrahim, R. A., Ewees, A. A. & Shrahili, M. Multilevel thresholding Aerial image segmentation using comprehensive learning-based Snow ablation optimizer with double attractors. Egypt. Inform. J.27, 100500 (2024). [Google Scholar]
- 28.Pandya, S. B. et al. Multi-objective snow ablation optimization algorithm: An elementary vision for security-constrained optimal power flow problem incorporating wind energy source with FACTS devices. Int. J. Comput. Intell. Syst.[SPACE]10.1007/s44196-024-00415-w (2024). [Google Scholar]
- 29.Lu, T. et al. Differential vectors empower snow ablation optimizer. In 2023 IEEE 11th Joint International Information Technology and Artificial Intelligence Conference (ITAIC) (2023).
- 30.Jia, H. et al. Improved snow ablation optimizer with heat transfer and condensation strategy for global optimization problem. J. Comput. Des. Eng.10(6), 2177–2199 (2023).
- 31.Ding, L., Bai, Y.-L., Fan, M.-H. & hu Ren, W. S. . H. Using a snow ablation optimizer in an autonomous echo state network for the model-free prediction of chaotic systems. Nonlinear Dynamics (2024).
- 32.Ismaeel, A. A. K. et al. Performance of snow ablation optimization for solving optimum allocation of generator units. IEEE Access12, 17690–17707 (2024). [Google Scholar]
- 33.L.K., H. & Y., W. Number theory in the application of approximate analysis (Science Press, 1978).
- 34.Wu, G., Mallipeddi, R. & Suganthan, P. Problem definitions and evaluation criteria for the cec 2017 competition and special session on constrained single objective real-parameter optimization. IEEE Congr. Evolut. Comput.2017, 1 (2016). [Google Scholar]
- 35.Faramarzi, A., Heidarinejad, M., Mirjalili, S. & Gandomi, A. H. Marine predators algorithm: A nature-inspired metaheuristic. Expert Syst. Appl.152, 113377. 10.1016/j.eswa.2020.113377 (2020). [Google Scholar]
- 36.Faramarzi, A., Heidarinejad, M., Stephens, B. & Mirjalili, S. Equilibrium optimizer: A novel optimization algorithm. Knowl.-Based Syst.191, 105190. 10.1016/j.knosys.2019.105190 (2020). [Google Scholar]
- 37.Hansen, N. The cma evolution strategy: A tutorial (2016). arXiv:1604.00772.
- 38.Brest, J., Maucec, M. S. & Boškovic, B. Single objective real-parameter optimization: Algorithm jso. In 2017 IEEE Congress on Evolutionary Computation (CEC), 1311–1318, 10.1109/CEC.2017.7969456 (2017).
- 39.Derrac, J., García, S., Molina, D. & Herrera, F. A practical tutorial on the use of nonparametric statistical tests as a methodology for comparing evolutionary and swarm intelligence algorithms. Swarm Evol. Comput.[SPACE]10.1016/j.swevo.2011.02.002 (2011). [Google Scholar]
- 40.Hussain, K., Salleh, M. N. M., Cheng, S. & Shi, Y. On the exploration and exploitation in popular swarm-based metaheuristic algorithms. Neural Comput. Appl.31, 7665–7683. 10.1007/s00521-018-3592-0 (2019). [Google Scholar]
- 41.Phung, M. D. & Ha, Q. P. Safety-enhanced uav path planning with spherical vector-based particle swarm optimization. Appl. Soft Comput.107, 107376. 10.1016/j.asoc.2021.107376 (2021). [Google Scholar]
- 42.Hu, G., Huang, F., Seyyedabbasi, A. & Wei, G. Enhanced multi-strategy bottlenose dolphin optimizer for uavs path planning. Appl. Math. Model.130, 243–271. 10.1016/j.apm.2024.03.001 (2024). [Google Scholar]
Associated Data
This section collects any data citations, data availability statements, or supplementary materials included in this article.
Data Availability Statement
All data generated or analysed during this study are included in this published article. The GDSAO code, CEC2017 parameters and terrain data are included in: https://github.com/RivenSartre/GDSAO_uav_path_planning.


