

Abstract
BACKGROUND:
The Ultimate Fighting Championship (UFC) stands as a prominent global platform for professional mixed martial arts, captivating audiences worldwide. With its continuous growth and globalization efforts, UFC events have garnered significant attention and achieved commendable results. However, as the scale of development expands, the operational demands on UFC events intensify. At its core, UFC thrives on the exceptional performances of its athletes, which serve as the primary allure for audiences.
OBJECTIVE:
This study aims to enhance the allure of UFC matches and cultivate exceptional athletes by predicting athlete performance on the field. To achieve this, a recurrent neural network prediction model based on Bidirectional Long Short-Term Memory (BiLSTM) is proposed. The model seeks to leverage athlete portraits and characteristics for performance prediction.
METHODS:
The proposed methodology involves constructing athlete portraits and analyzing athlete characteristics to develop the prediction model. The BiLSTM-based recurrent neural network is utilized for its ability to capture temporal dependencies in sequential data. The model’s performance is assessed through experimental analysis.
RESULTS:
Experimental results demonstrate that the athlete performance prediction model achieved an overall accuracy of 0.7524. Comparative analysis reveals that the proposed BiLSTM model outperforms traditional methods such as Linear Regression and Multilayer Perceptron (MLP), showcasing superior prediction accuracy.
CONCLUSION:
This study introduces a novel approach to predicting athlete performance in UFC matches using a BiLSTM-based recurrent neural network. By leveraging athlete portraits and characteristics, the proposed model offers improved accuracy compared to classical methods. Enhancing the predictive capabilities in UFC not only enriches the viewing experience but also contributes to the development of exceptional athletes in the sport.
Keywords: Recurrent neural network, UFC, athlete performance, winning percentage forecast, evaluation algorithm, deep learning, BiLSTM, XGBoost
1. Introduction
Since entering the new century, the rapid development of artificial intelligence has changed our lives. It continues to affect the world through massive data analysis technology, which provides scientific and practical data analysis and decision support tools for all walks of life, making artificial intelligence widely used because it can reveal a large number of potential problems and can be analyzed and organized through the data. It can better foresee the future trend. For sports events, the performance and results of athletes are crucial, especially for commercial sports events; it is of great significance to analyze and predict the performance of athletes. Therefore, the establishment of an accurate and reliable athlete performance prediction model, effective prediction of competition results, analysis of athlete data information, and prediction of the winning probability of both athletes can not only ensure the extraordinary degree of the game but also judge the athletic level of athletes and technical defects through scientific means to promote the improvement of athletes’ level.
In this regard, experts use neural network technology to conduct in-depth research on the performance of athletes and the outcome prediction of events. For forecasting and assessing sports athlete performance, neural network-based algorithms such as RNNs and BiLSTMs are essential. They sequentially manage data, identify significant characteristics, and enhance training plans. These tools make real-time decision-making, performance evaluation measures, and monitoring possible. Pai et al. [1] organically combined VSM and decision tree method to generate a composite network to predict NBA game results. Through experimental analysis, the prediction accuracy of the hybrid model for NBA game results was 85.25%. Johannes [2] introduced machine learning to predict and analyze football match results based on athletes’ body data and match data. The sample data used are the match results of five major European football leagues from 2006 to 2018 and the performance data of all athletes on the field. The experimental results show that the prediction model is highly accurate in predicting football matches and has obtained good economic returns. Seniuk et al. [3] applied the generalized matching equation (GME) to mixed martial arts (MMA) by examining punch selection as a function, striking effects are achieved in UFC athletes of different weight classes. The results show that GME is an excellent way to describe strike selection in MMA. Chen et al. [4] thoroughly combined extreme learning machines, multiple adaptive regression curves, and other advanced data mining and analysis technologies to establish a model for predicting NBA game scores. Through experimental verification, this model has excellent performance for predicting basketball game scores. Qiu et al. [5] proposed an IoT-based Hierarchical Health Monitoring Model (IoT-HHMM) to enhance energy efficiency in wearable devices for monitoring athletes’ health. It optimizes resource utilization and complexity through the Optimal Energy-Efficient Resource Assignment Algorithm. By employing cloud computing with a Probabilistic Radial Basis Function Neural Network, the model effectively manages healthcare data for prediction and classification. It outperforms traditional methods in accuracy, sensitivity, and overall performance. Huang et al. [6] developed an Energy-Efficient Behavior Recognition System for accelerometers, with the goal of improving efficiency and health performance. It utilizes an energy utilization model and the Multi-Objective Algorithm of Particle Swarm Optimization (EEBRS-MPSO) to minimize energy consumption during data storage and processing. The system offers customizable feature clusters, allowing for power adjustments to suit specific usage requirements, thereby ensuring both functionality and consumer satisfaction.
By summarizing the literature mentioned above on the prediction of the results of sports events and athletes’ performance, it can be seen that although various machine learning technologies have been used to carry out extensive prediction research on this issue, and specific research results have been achieved, due to the complex characteristics of sports events themselves. The performance of sports players will be affected by many factors. Therefore, the accuracy of the prediction model constructed could be higher. It has little reference value for sports athletes’ competition practice and personal growth [7, 8]. Large datasets, non-standard data formats, transfer learning possibilities, missing data issues, real-time settings, complicated data situations, and task-specific needs are some areas where the suggested approach outperforms existing methods. Therefore, taking the UFC event as an example, this paper makes an in-depth study on predicting athletes’ competition performance using a neural network. The need to optimize event operations is growing for UFC, a mixed martial arts competition held worldwide. Athlete performance prediction is essential to develop great athletes and increase the attraction of the game. An overall accuracy of 0.7524 is demonstrated by a BiLSTM-based prediction model, which outperforms traditional models such as MLP and Linear Regression. The key contributions of this paper are presented as follows:
-
(1)
The personal data of UFC athletes from December 2012 to December 2022 were selected, and Pandas were used to analyze the data. The athletes’ portraits were constructed from height, weight, arm span, and standing posture.
-
(2)
Combined with the data analysis of athletes, the characteristics of athletes were analyzed, the XGBoost model was used to calculate the importance of features, and the top 10 results with the highest importance were screened, and the features were scored.
-
(3)
A UFC athlete, performance prediction model, was constructed based on BiLSTM, and the model’s prediction accuracy was calculated through experimental analysis and then compared with the traditional prediction model.
The rest of the paper is organized as follows: Section 2 describes LSTM; Section 3 illustrates the construct athlete data portrait; Section 4 summarizes the construction of athlete characteristics; Section 5 depicts the UFC athlete performance prediction model based on BiLSTM; Section 6 shows the experimental analysis; and Section 7 concludes the work.
2. LSTM
Recurrent Neural Network (RNN) performs excellently when dealing with this data. The core feature of RNN is its “memory” function [9]. Recurrent neural networks with feature information have better long-term dependency capture, contextual comprehension, prediction accuracy, temporal shift sensitivity, mitigation of the vanishing gradient problem, irregular time gaps, feature learning, and generalization skills. The recurrent unit structure of a recurrent neural network is shown in Fig. 1. In the figure, is the cyclic algorithm, is inputs data to the model and is outputs data to the model.
Figure 1.

Recurrent neural network structure.
Long Short-Term Memory Networks (LSTM) is a variant of recurrent neural networks (RNN) and is widely used to process sequential data, including time series prediction, speech recognition, text generation, and other tasks [10]. The internal structure of LSTM is shown in Fig. 2. Where is the cell state, is the output of the implied state, and Tanh is the activation function.
Figure 2.

LSTM internal structure.
The value field of the input gate is (0, 1); its primary function is to judge the importance of the current input information before the new memory is generated so as to control the size of the newly developed part of the cell state and to achieve this purpose through the following formula.
| (1) |
| (2) |
The forget gate controls what information needs to be omitted from the memory unit, and the output range is [0, 1]. The expression of the forgetting gate is:
| (3) |
The output gate is mainly responsible for getting information from the hidden state, and its expression is:
| (4) |
3. Construct athlete data portrait
The website UFCSTATS records data from every UFC fight since its inception in 1999, along with the personal data of every athlete who has competed in a UFC fight. UFCStats data is cleaned using imputation, data validation, consistency checks, outlier identification, and cross-validation to ensure correctness and integrity. Data alignment with subject-specific needs and analytical goals is also achieved through domain-specific inspections. The big data used in this study was taken from UFCStats, covering the period from December 2012 to December 2022. Since the main content of this study is the performance prediction of athletes, the data object of this study is mainly the data of athletes in each UFC match. After the initial data is obtained, to ensure the integrity and accuracy of the data, it is also necessary to clean up the data to create a unified, standardized dataset for the research based on previous work [11, 12]. After an in-depth analysis of UFC big data, it is found that some outliers and values need to be added. The value-filling method replaces missing values with a constant value to maintain data structure and meaning; it is functional for mathematical operations, categorical variables, and algorithm compatibility, especially for large datasets with minimal impact on analysis. In this paper, the Pandas library processes the missing values of UFC data, and the unique value-filling method is used to fill the missing values to 0. In data preparation, filling in missing values with zeros (0) is standard practice, particularly for numerical data. The kind of data, domain-specific factors, analytical effect, data distribution, type of missing data, and modeling considerations all influence how suitable it is. Pandas library is also used to draw a box plot to process outliers. Considering that the data does not contain useful information in this paper’s athlete performance prediction task, these kinds of outliers are deleted.
On this basis, the described () function in Pandas is used to analyze UFC athletes’ height, weight, and arm span, as shown in Table 1.
Table 1.
Statistical characteristics of height, weight, and arm span of UFC athletes
| Height (cm) | Weight (kg) | Arm span (cm) | |
|---|---|---|---|
| Count | 3050.00 | 3238.00 | 1569.00 |
| Mean | 178.79 | 79.00 | 182.43 |
| std | 8.68 | 18.31 | 10.42 |
| min | 149.86 | 47.63 | 152.40 |
| 25% | 172.72 | 65.77 | 175.26 |
| 50% | 177.80 | 77.11 | 182.88 |
| 75% | 185.42 | 83.91 | 190.50 |
| max | 226.06 | 349.27 | 213.36 |
Calculate the mean and standard deviation using the following formula:
| (5) |
| (6) |
In the formula, is the mean, and std is the standard deviation. The average height of UFC athletes is 178.79 cm, the average weight is 79 kg, and the middle arm span is 182.43 cm. By calculating the standard deviation, the degree of dispersion of a dataset can be measured [13]. The standard deviation of height is the smallest, only 8.68 cm, followed by arm span, while the standard deviation of weight is the largest, reaching 18.31 kg. This is because there are more than ten weight classes in the UFC, and the weight difference is significant. To further study the distribution of height, weight, and arm span of UFC fighters, through data analysis, it is found that the height of UFC athletes is concentrated in the range of 172–187 cm, and the average height is about 178 cm, and the distribution is very average. The weight is concentrated between 70–90 kg, and the average weight is 79 kg; of course, there are up to 349.27 kg of athletes in the data cleaning link; this should be used as an outlier to be deleted [14]. Arm span is a vital body measurement index; the UFC athlete’s arm span and height data analysis show an excellent linear relationship between the two, but the arm span is slightly less than the height. Function-related benefits, heredity, and proportionate growth all impact arm spans that are somewhat longer than height. Evolutionary variables contribute to functional reach and adaptability, whereas this balance enables coordination and movement. There is individual variance, which reflects the overall biomechanical effectiveness. In mixed martial arts, it is essential to use a linear regression model to analyze the relationship between arm span and height in UFC athletes to gain insight into physical characteristics, make predictions, and optimize various aspects of training, strategy, and athlete development.
In addition, this paper also analyzes the standing posture of UFC athletes, as shown in Fig. 3. UFC athletes have a total of five erect postures, and most of them adopt the orthodox upright posture, this is because MMA allows competitors to enter the ground fight at any time, while boxers and Muay Thai fighters are more inclined to keep standing posture, to play their advantages and avoid their shortcomings.
Figure 3.
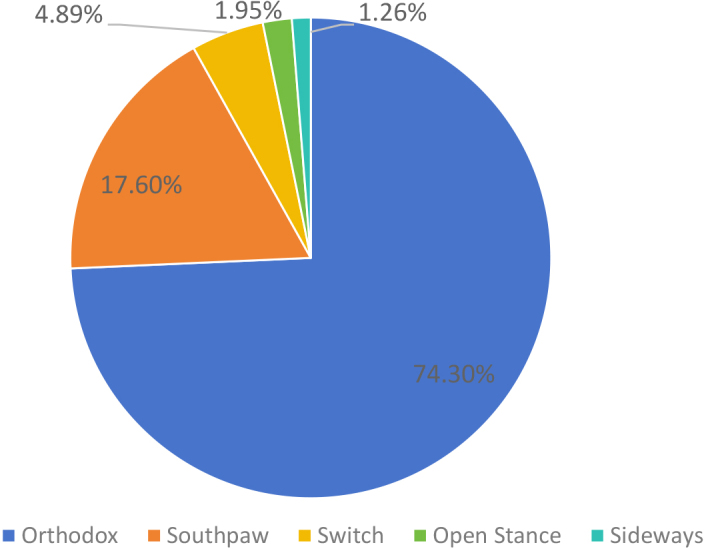
UFC athletes’ standing posture ratio.
The relationship between arm span and height was linearly fitted by linear regression and was set
as the height value of the i th input. Each height input had n data [15]. It was assumed that the height data of the UFC dataset had a total of the m input value, then the complete height input value x is a matrix of n m,
is the weight parameter, and
is the output arm span value. Since there is a linear relationship between the input and output value s, it is the weight coefficient, x is the height, and y is the arm span. Then, the height and arm span function of UFC athletes are fitted. After calculation, it can be concluded that the arm span of UFC athletes is smaller than the height. The null values are printed using the null () method. It is also possible to print the null values in columns. While searching for null values in a Pandas data frame, we utilize the not null () function to produce a data frame of boolean values that are False for NaN values. The possible reason is that the leg length of UFC athletes can affect the match’s outcome more because UFC event clubs may prefer to choose athletes with longer legs to select talents. Athletes with longer legs are given preference in UFC talent scouting because of their reach advantage, potent striking tactics, defensive maneuvers, flexibility, range management, kicking game, adaptability, and ability to match up strategically. Doing well in mixed martial arts requires a comprehensive evaluation of talents, athleticism, and flexibility.
4. Construction of athlete characteristics
The process of constructing features in this paper focuses on the prediction of UFC athletes’ competition results to extract features rather than removing features for the sake of features. Using historical performance indicators, fight context, skill set analysis, temporal factors, and statistical measures, the study attempts to forecast the competition outcomes of UFC fighters while reflecting the dynamic nature of mixed martial arts. To more accurately predict the outcome of the athletes in the game, it is necessary to be familiar with the athletes’ data and the corresponding data of the opponents, such as height, weight, arm span, historical win rate and game experience. At the same time, it is also necessary to understand the relevant rules of the game, as well as the distance between the players during the game, the winning way of the players, the proportion of the success rate of the hit, and other vital data [16]. In this regard, Doc2vec is adopted in this paper model to extract word vector features; this is an efficient Unsupervised algorithm, and its specific framework is shown in Fig. 4. Word2vec is expanded with paragraph vectorization in Doc2vec, also called Paragraph Vector. It comprises two models: the Distributed Bag of Words model (PV-DBOW) and the Distributed Memory model of Paragraph Vectors (PV-DM). To minimize the discrepancies between anticipated and actual words, Doc2vec modifies vectors during training. This produces distributed representations in a continuous vector space. Using PV-DM and PV-DBOW training modes, Doc2Vec is a neural network-based technique that generates vector representations of whole documents. It may infer document vectors for newly created documents, opening up applications in sentiment analysis, document categorization, and information retrieval from natural language processing.
Figure 4.

Word2vec frame diagram.
Figure 4 shows a way to map words into some unique vector. A column represents this vector, and the word’s position in that column determines how it is indexed. Using concatenation or quadrature, it is possible to predict the characteristics of the next word in the sentence [17]. In word vector models, the “maximizing the mean algorithm” uses mean aggregation to improve model performance for natural language processing applications such as sentiment analysis and document categorization. This method works well with different document lengths, standardizes representations, and lowers noise. Limitations can be addressed using hyperparameter adjustment and advanced approaches. Given a set of training words, the goal of a word vector model is to improve the accuracy of the modeling by using the odds of maximizing the mean logarithm, expressed as:
| (7) |
The Softmax function is an integral part of the classifier because text prediction requires a variety of classification methods, and its computational equations are:
| (8) |
In the formula, each can be seen as predicting the probability of each word.
Feature importance score is a method used to measure the importance of input features in predicting target variables. It can be obtained by statistical correlation score, partial coefficients of linear modeling, feature importance of decision tree, and random ranking [18]. The weighted quantile sketch method, regularisation strategies, gradient boosting framework, ensemble of trees, and early stopping features of XGBoost make it an effective tool for assessing feature relevance in big datasets. The XGBoost model calculates feature importance, and the top 10 results with the highest importance are screened, listed in Table 2.
Table 2.
Feature importance scores
| No. | Features | Feature meaning | Score |
|---|---|---|---|
| 1 | R_hst_TD_pct | R_hst_pct success rate of Red Corner players falling against each other | 42.0 |
| 2 | B_hst_TD_attempted | Number of effective hitting attempts by Blue Corner players | 37.0 |
| 3 | age_adv | The average age of players | 36.0 |
| 4 | R_age | Red Corner player’s age | 32.0 |
| 5 | B_hst_DISTANCE_attempted | Number of hits attempted by Blue Corner on the ground | 29.0 |
| 6 | B_hst_SIG_STR_pct | B_HST_SIG_pcT | 29.0 |
| 7 | R_hst_DISTANCE_succeeded | R_hst_distance_number of distance that the red corners have managed | 27.0 |
| to keep from each other | |||
| 8 | R_winning | Red Corner’s winning percentage | 26.0 |
| 9 | R_experience | Red Corner game experience | 23.0 |
| 10 | R_hst_BODY_attempted | Number of body blows attempted by Red corner | 23.0 |
It shows that the importance score of the success rate of the red corner is the highest, which is the most essential feature. Secondly, the importance of the blue corner square trying to fall to the other side is also very high. In addition, the player’s age, the distance attempted, and the number of effective hits from the blue corner are all essential features. These critical features are weighted in this paper before training the neural network. Through data cleaning, feature construction, and feature importance analysis of the original UFC data, a feature cluster of 2514 pieces of data is finally constructed in this paper. When building features for mixed martial arts, it is essential to consider opponent and athlete data. This will help you better understand skill set analysis, performance dynamics, tactical decision-making, prediction accuracy, pattern recognition, and robust statistical models.
5. UFC athlete performance prediction model based on BiLSTM
The BiLSTM-based UFC athlete performance prediction model seeks to enhance the allure of UFC events, develop exceptional athletes, accelerate strategic decision-making, expand events internationally, draw spectators, examine athlete attributes, and evaluate performance compared to traditional models. This paper analyzes the above data characteristics and proposes a UFC athlete performance prediction model based on LSTM. Firstly, in feature fusion, the spatial feature fusion strategy was optimized to learn high-dimensional spatial features in feature sequences. Secondly, a novel grouping strategy is proposed to obtain better the long-distance contextual semantic information of UFC time series data [19]. Finally, this paper gives the outcome prediction of the UFC event Red Corner Square through the whole connection layer. The overall structure of the athlete performance prediction model is shown in Fig. 5.
Figure 5.

Overall framework of athlete performance prediction.
5.1. BiLSTM
BiLSTM (Bidirectional Long Short-Term Memory) is an extended form of traditional LSTM, which combines forward LSTM and reverse LSTM to obtain more complete context information [20]. The neural network approach for sports players’ performance prediction and evaluation, based on BiLSTM, goes through several stages, including data collection, preprocessing, feature engineering, temporal sequencing, model architecture design, hyperparameter tuning, training, validation, and ongoing monitoring. The forward and reverse LSTM models combined into the bidirectional LSTM model enhance their ability to extract context from sequences by considering dependencies from previous and subsequent components. This method improves its performance in sequence-to-sequence tasks, which helps with semantic and syntactic structure comprehension. Each LSTM unit can access prior and following context information at each time step. Therefore, compared with traditional LSTM, BiLSTM can process both forward and reverse sequence information, so it can capture bidirectional semantic dependencies, which helps to improve the semantic understanding ability of the model. In addition, BiLSTM, by stacking LSTM networks, can better context-wise output, which is very helpful for dealing with long-term dependencies in sequence data. Incorporating previous and following words, contextual significance, word representations, and capturing long-range dependencies are all achieved via bidirectional semantic dependencies, which boost natural language processing models. Named entity identification, grammatical structures, and sentiment analysis can all benefit from this method.
BiLSTM is mainly composed of the input layer, forward LSTM layer, and backward LSTM layer, and its main operation flow is as follows [21]:
-
(1)
Input layer, which represents the input sequence as a matrix X, where each row represents the input of a time step. Assuming the length of the input sequence is T and the input dimension of each time step is d, the dimension of X is T d.
-
(2)
In the forward LSTM layer, input the sequence from left to right into the forward LSTM layer. The layer will capture the information from the past in the sequence and output a new sequence.
-
(3)
In the back LSTM layer, input the sequence from right to left into the back LSTM layer. The layer will capture the sequence from back-to-front information and output a new sequence.
5.2. Athlete performance prediction model
BiLSTM is used to construct the grouping model, and the grouping strategy is proposed because one of the advantages of recurrent neural networks is that it can combine the previous feature information for prediction [22]. BiLSTM models are perfect for natural language processing applications because of their improved representation, capacity to capture long-range relationships, and bidirectional context modeling. These features make BiLSTM models useful for classifying models. In some cases, only the most recent information needs to be considered to retain the feature information. If the two sets of features are far apart, the corresponding feature information will also be reduced, which will significantly discount the model’s prediction accuracy. For precise and practical information extraction, the grouping technique must be optimized. It manages noise, simplifies computational complexity, increases generalization, lessens ambiguity, models feature dependencies, adjusts to varied input, and boosts contextual comprehension.
| (9) |
Where, is the sequential sequence of BiLSTM, and is each local sequential sequence. On this basis, the grouping strategy is optimized to obtain information between adjacent features quickly and accurately. Reduced dimensionality, feature interactions, parallelization, prioritizing significant groups, memory optimization, and flexibility in response to data changes are all ways that an optimized grouping method increases information speed and accuracy. The grouping strategy expression is as follows:
| (10) |
Where is the output sequence for a new feature, is the unique feature input sequence, is the serial number, and is a forward and backward feature fusion strategy.
Proposes a spatial fusion strategy based on BiLSTM’s grouping features. The specific grouping strategy structure is shown in Fig. 6.
Figure 6.
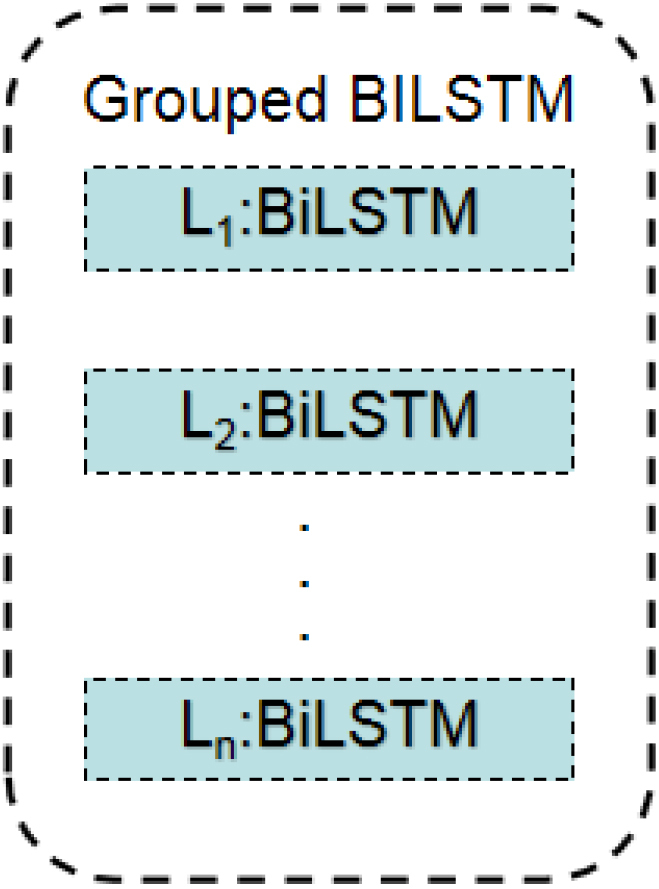
Schematic diagram of grouping strategy structure.
The resulting spatial feature fusion strategy is to fuse each column of features, and the specific expression is as follows:
| (11) |
Where is the output of spatial feature fusion, is the m th feature in the sample, and represents the length of the feature sample.
6. Experimental analysis
Using 2514 historical match data from UFC2012-2022 as samples, the UFC athlete, performance prediction model, constructed in this paper is experimentally analyzed.
6.1. Parameter setting
In the neural network prediction model, Set BiLSTM neurons to 16, Batch_Size to 32, and Epochs to 100; the learning rate is adaptive, the optimizer is RMSprop, and the Loss function is Binary_crossentropy. RMSprop is an optimization approach that modifies the learning rates of neural networks by utilizing squared gradient history data. It handles gradient issues, uneven features, and sparse data to aid in speedier convergence. The BiLSTM group strategy was set to 3 groups. Early Stopping method is used to avoid overfitting problems in neural network training, and the tolerance parameter is set to 10.
6.2. Evaluation index
To verify the feasibility and superiority of the model in this paper, it is necessary to establish the performance evaluation index for the demand forecasting problem. This paper uses OA (overall accuracy) to evaluate the proposed model quantitatively. Since the UFC event win percentage prediction is a binary model, the match’s outcome is either win or lose [23]. Therefore, this article will focus on the binary model. As a test sample, it may have two practical types (Positive and Negative). When these two types are fed into a binary classification model, the model determines whether the output outcome is positive or negative based on the actual type and predicted sample. Mixed martial arts results, intricate selection criteria, and unpredictability provide challenges for binary classification models used in UFC match predictions. Advanced modeling methods, feature engineering, and domain knowledge are required to capture various results.
6.3. Results analysis
To optimize the parameter configuration of the model, the RMSprop algorithm was introduced in the test process, and the change of the training loss of the predicted model was given, as shown in Fig. 7. The curve of the prediction model is very smooth, which indicates that the model training has achieved good results.
Figure 7.

Changes in model training losses.
OA is used to predict the performance of red-corner athletes. Red-corner athletes’ performance is expected using Overall Accuracy (OA), which is selected because of its ease of use, intuitiveness, and capacity to balance tests across various classes. It is less susceptible to skewed datasets and treats every outcome equally. The specific results are shown in Table 3. The overall accuracy of the prediction model proposed in this paper is 0.7524, and the model is small, which proves that the performance of the prediction model presented in this paper is relatively excellent.
Table 3.
Results of using OA to predict the performance of Red corner athletes
| Test time | Total params | OA |
|---|---|---|
| 1.002 s | 4128 | 0.7524 |
Maintaining uniformity in the experimental setup is essential for comparing prediction models. Standardized feature selection, model configuration, cross-validation, evaluation metrics, execution environment, managing class imbalances, validation set utilization, and comprehensive documentation are standard practices. To have a more intuitive understanding of this prediction model, the Linear Regression model, MLP model, SimpleRNN model, and the prediction model constructed in this paper were selected for comparative experimental analysis. To ensure that the experimental data obtained are of reference value, the experiment’s external conditions and processes are the same as the prediction model in Section 4. The specific experimental results are shown in Fig. 8. It can be intuitively seen from the figure that the athlete competition performance prediction model constructed in this paper performs well and has advantages over traditional prediction models.
Figure 8.

Comparison of results of different prediction models.
7. Conclusion
This paper mainly focuses on the prediction of athletes’ performance. Taking UFC boxing as an example, the competition data in recent years are selected, and through data cleaning and mining, the competition characteristics of athletes are first constructed, and then a prediction model of athletes’ performance during the competition is built based on BiLSTM. The accuracy of the model is analyzed experimentally. The analysis results show that the overall accuracy of the athlete performance prediction model constructed in this paper is 0.7524, which has higher prediction accuracy than Linear Regression, MLP, and other classical models.
Funding
The authors did not receive any funding.
Data availability statement
No datasets were generated or analyzed during the current study.
Author contributions
Kai Wan, Dongming Zhu: designing the framework, analyzing the performance, validating the results, and writing the article. Zimin Chang, Zhiyong Wu: collecting the information required for the framework, providing software, critical review, and administering the process.
Conflict of interest
The authors do not have any conflicts of interest to report.
References
- [1]. Pai PF, ChangLiao LH, Lin KP. Analyzing basketball games by a support vector machines with decision tree model. Neural Computing and Applications. 2017. Dec; 28: 4159-67. [Google Scholar]
- [2]. Stübinger J, Mangold B, Knoll J. Machine learning in football betting: Prediction of match results based on player characteristics. Applied Sciences. 2019. Dec 19; 10(1): 46. [Google Scholar]
- [3]. Seniuk HA, Vu JP, Nosik MR. Application of the matching law to mixed martial arts. Journal of Applied Behavior Analysis. 2020. Apr; 53(2): 846-56. [DOI] [PubMed] [Google Scholar]
- [4]. Chen WJ, Jhou MJ, Lee TS, Lu CJ. Hybrid basketball game outcome prediction model by integrating data mining methods for the national basketball association. Entropy. 2021. Apr 17; 23(4): 477. [DOI] [PMC free article] [PubMed] [Google Scholar]
- [5]. Qiu Y, Liu G, Muthu BA, Sivaparthipan CB. Design of an energy-efficient IoT device with optimized data management in sports person health monitoring application. Transactions on Emerging Telecommunications Technologies. 2022. Oct; 33(10): e4258. [Google Scholar]
- [6]. Huang Y, Hu M, Muthu B, Gayathri R. Wearable energy efficient fitness tracker for sports person health monitoring application. Journal of Intelligent & Fuzzy Systems. 2021. (Preprint): 1-0. [Google Scholar]
- [7]. Zhao H, Li W, Gan L, Wang S. Designing a prediction model for athlete’s sports performance using neural network. Soft Computing. 2023. Oct; 27(19): 14379-95. [Google Scholar]
- [8]. Gokulakrishnan S, Jarwar MA, Ali MH, Kamruzzaman MM, Meenakshisundaram I, Jaber MM, Kumar RL. Maliciously roaming person’s detection around hospital surface using intelligent cloud-edge based federated learning. Journal of Combinatorial Optimization. 2023. Jan; 45(1): 13. [Google Scholar]
- [9]. Mohammed AG. An Analytical Method for Evaluating the Performance of the URA MAWASHI GERI Skill Using Time Series and Artificial Intelligence Techniques. American Journal of Artificial Intelligence. 2022; 6(2). [Google Scholar]
- [10]. Kulakou S, Ragab N, Midoglu C, Boeker M, Johansen D, Riegler MA, Halvorsen P. Exploration of different time series models for soccer athlete performance prediction. Engineering Proceedings. 2022. Jun 29; 18(1): 37. [Google Scholar]
- [11]. Gorzi A, Khantan M, Khademnoe O, Eston R. Prediction of elite athletes’ performance by analysis of peak-performance age and age-related performance progression. European Journal of Sport Science. 2022. Feb; 22(2): 146-59. [DOI] [PubMed] [Google Scholar]
- [12]. Den Hartigh RJ, Niessen AS, Frencken WG, Meijer RR. Selection procedures in sports: Improving predictions of athletes’ future performance. European Journal of Sport Science. 2018. Oct 21; 18(9): 1191-8. [DOI] [PubMed] [Google Scholar]
- [13]. Squair JW, Phillips AA, Currie KD, Gee C, Krassioukov AV. Autonomic testing for prediction of competition performance in Paralympic athletes. Scandinavian Journal of Medicine & Science in Sports. 2018. Jan; 28(1): 311-8. [DOI] [PubMed] [Google Scholar]
- [14]. Guan S, Wang X. Optimization analysis of football match prediction model based on neural network. Neural Computing and Applications. 2022. Feb; 34(4): 2525-41. [Google Scholar]
- [15]. Li H. Analysis on the construction of sports match prediction model using neural network. Soft Computing. 2020. Jun; 24(11): 8343-53. [Google Scholar]
- [16]. Strnad D, Nerat A, Kohek Š. Neural network models for group behavior prediction: A case of soccer match attendance. Neural Computing and Applications. 2017. Feb; 28: 287-300. [Google Scholar]
- [17]. Lampis T, Ioannis N, Vasilios V, Stavrianna D. Predictions of european basketball match results with machine learning algorithms. Journal of Sports Analytics. 2023. (Preprint): 1-20. [Google Scholar]
- [18]. Ishi M, Patil J, Patil V. An efficient team prediction for one day international matches using a hybrid approach of CS-PSO and machine learning algorithms. Array. 2022. Jul 1; 14: 100144. [Google Scholar]
- [19]. Li Y, Hong Y. Prediction of football match results based on edge computing and machine learning technology. International Journal of Mobile Computing and Multimedia Communications (IJMCMC). 2022. Apr 1; 13(2): 1-0. [Google Scholar]
- [20]. Cortez A, Trigo A, Loureiro N. Football match line-up prediction based on physiological variables: A machine learning approach. Computers. 2022. Mar 11; 11(3): 40. [Google Scholar]
- [21]. Rodrigues F, Pinto Â. Prediction of football match results with Machine Learning. Procedia Computer Science. 2022. Jan 1; 204: 463-70. [Google Scholar]
- [22]. Wilkens S. Sports prediction and betting models in the machine learning age: The case of tennis. Journal of Sports Analytics. 2021. Jan 1; 7(2): 99-117. [Google Scholar]
- [23]. Dijkhuis TB, Kempe M, Lemmink KA. Early prediction of physical performance in elite soccer matches – a machine learning approach to support substitutions. Entropy. 2021. Jul 25; 23(8): 952. [DOI] [PMC free article] [PubMed] [Google Scholar]
Associated Data
This section collects any data citations, data availability statements, or supplementary materials included in this article.
Data Availability Statement
No datasets were generated or analyzed during the current study.