Abstract
This work provides a procedure and database for obtaining the vibrational frequency scale factors that align quantum chemically computed harmonic frequencies with experimental vibrational spectroscopic data. The database comprises 441 molecules of various sizes, from diatomics to the buckminsterfullerene C60. We provide scale factors for 27 dispersion‐corrected methods, 24 of which are DF‐Dn/B with DF=BLYP, PBE, B3LYP, PBE0, Dn=D3(BJ), D4, and B=6‐31G, def2‐SVP, def2‐TZVP, and three of them are the 3c‐family composite methods (HF‐3c, PBEh‐3c, and r2SCAN‐3c). The two scale factors are derived for each method: the absolute scaling, minimizing the absolute deviation of the scaled harmonic frequency from the experimental value, and the relative scaling, which minimizes an analogous relative deviation. The absolute type of scaling is recommended for frequencies above 2000 cm−1, while the relative scaling is optimal for frequencies below 2000 cm−1.
Keywords: DFT (density functional theory), Scale factors, Infrared spectroscopy, Molecular vibrations, Fitting, Dataset
This study presents two new sets of scaling factors for adjusting theoretical harmonic vibrational spectra computed using dispersion‐corrected density functional theory methods to better match experimental data. The first set (absolute scaling) better aligns with higher frequencies, while the second one (relative scaling) evenly reduces errors across the entire spectral range.
1. Introduction
Infrared (IR) spectroscopy is one of the important physicochemical methods in the chemists’ arsenal. [1] This spectroscopic technique observes intra‐ and intermolecular vibrational motions, as their resonant excitation energies lie in the IR region, i. e., approximately from 100 to 104 cm−1 (wavelengths from 0.1 mm to 780 nm).[ 1 , 2 ] In addition to simple absorption/emission IR spectroscopy, [3] there are other techniques, such as vibrational circular dichroism (VCD), which is sensitive to molecular chirality,[ 4 , 5 ] vibrational Raman spectroscopy, [6] inelastic neutron scattering (INS),[ 6 , 7 , 8 ] infrared/ultraviolet (IR‐UV) ion dip spectroscopy, [9] infrared multiple photon dissociation (IRMPD) spectroscopy,[ 10 , 11 , 12 , 13 , 14 ] various messenger‐tagging methods (such as helium, nitrogen, or hydrogen molecular tag),[ 15 , 16 , 17 , 18 , 19 , 20 ] that allow measuring spectra of ions, and vibrational sum frequency generation (VSFG) spectroscopy, that allows to probe molecular motions at the phase interfaces.[ 21 , 22 ] All these vibrational spectroscopy methods allow us to inspect the properties of molecules, ions, and molecular aggregates in the gas, liquid, and solid phases and at the interfaces between phases. In addition to that, vibrational spectroscopic techniques are widely used in analytical chemistry. [23] Even more, an important usage of IR spectroscopy includes astronomy and astrochemistry, with the existence of IR spectrometers on interplanetary probes and of various IR space telescopes, such as the recently retired Stratospheric Observatory For Infrared Astronomy (SOFIA) [24] and recently launched James Webb Space Telescope (JWST).[ 25 , 26 ]
However, interpreting the IR and other vibrational spectra can be complicated. Despite the existence of various vibrational diagnostic bands for molecular functional groups[ 11 , 12 , 27 ] and databases of the experimental IR spectra, such as the NIST Chemistry WebBook, [28] most experimental studies of novel uncharacterized substances have to rely on quantum‐chemical calculations.[ 5 , 6 , 8 , 9 , 16 , 17 , 18 , 29 , 30 , 31 , 32 , 33 ] To achieve a sufficiently good agreement of quantum‐chemical calculations and experiment requires the application of expensive computational methods and direct inclusion of anharmonic effects.[ 6 , 8 , 34 , 35 ] However, such anharmonic calculations require significant expertise and computational efforts, which make them unfeasible for many practical cases. [35] Therefore, the most widely used computational approach for the interpretation of experimental spectra is the harmonic frequency calculation with subsequent scaling of the resulting frequencies with a pre‐defined global scale factor.[ 36 , 37 , 38 , 39 , 40 , 41 ] The scale factor accounts for two effects: 1) the quality of the quantum‐chemical approximation used and 2) anharmonic effects, which are, by definition, absent in the harmonic calculations.[ 36 , 42 ] Therefore, updating the sets of scale factors, considering the expanding corpus of the experimentally determined vibrational frequencies and the new quantum‐chemical methods, is an interminable task. This effort is further facilitated by dedicated groups of researchers who diligently monitor and periodically incorporate new updates into these databases to ensure that the scale factors remain current and reflect the latest advances in the field. [43]
This work presents a new set of scale factors for 27 quantum‐chemical methods. In addition, these new scale factors have been rigorously tested and compared on several experimental data for structures to ensure their accuracy and reliability. The comprehensive examination of these scale factors across various classes of molecules enhances our understanding of their applicability and underscores their potential to advance computational chemistry methodology.
Methods
Dataset Selection
The information on the fundamental vibrational transitions of the molecules was extracted from the NIST Computational Chemistry Comparison and Benchmark Database (CCCBDB). [44] The species and the gas‐phase fundamental transitions were chosen manually with the following guiding principles:
Only neutral covalently bonded molecules in singlet ground states were selected.
Only the most abundant isotopologues were taken.
Experimental fundamental transitions for all normal modes should be assigned. Each diatomic molecule is characterized by a single vibrational number, while all N‐atomic molecules for (including linear) are characterized with fundamental modes. In the case of degenerate normal modes, every mode was given. The lowest energy vibration was disregarded for linear molecules, as this additional vibration usually corresponds to a doubly degenerate bending mode.
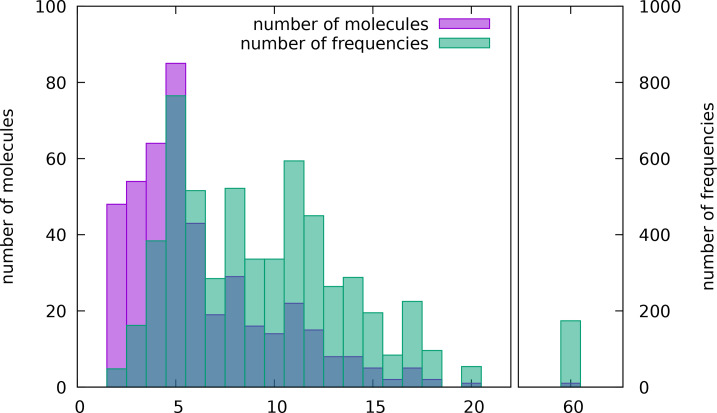
In addition to the molecules from the CCCBDB, nitrobenzene and uracil were added, with the full vibrational assignments given according to Refs. [45–47]. In total, the database contains 441 molecules of various sizes. The distribution of molecular sizes is given in Figure 1. The neutral closed‐shell species were chosen for the training set to unify the input files used to calculate the IR spectra.
Figure 1.
Number of molecules and corresponding number of vibrational frequencies comprised of a given number of atoms in the final dataset of fundamental frequencies. Note, that the two histograms have different y‐axes.
The experimental and theoretical frequencies for each molecule of the dataset were ordered by their values. Naturally, such a crude procedure creates some misassignments, as some of the vibrational modes in calculations can have different energy ordering compared to the experiment. Nevertheless, such an approach is formalizable and scalable, and the effect of such misassignments should be compensated in large datasets.
Quantum‐chemical Calculations
The first set of 24 methods can be written as “DF‐Dn/B”. Here, “DF” denotes a correlation‐exchange density functional, “Dn” is a dispersion correction, and “B” is the basis set used. For DF, we chose two pure generalized gradient approximation (GGA) functionals (BLYP[ 48 , 49 ] and PBE [50] ) and their popular hybrid counterparts (B3LYP, [51] PBE0 [52] ). As dispersion corrections (Dn), we considered D3(BJ) [53] and the newly developed D4 [54] corrections. As the basis sets (B), we used a small 6–31G basis set[ 55 , 56 ] and two Karsruhe‐type basis sets, [57] def2‐SVP and def2‐TZVP. The second set of three methods includes three examples of 3c‐composite methods, namely HF‐3c, [58] PBEh‐3c, [59] and r2SCAN‐3c. [60] The harmonic vibrational frequencies of the most abundant isotopologues after the geometry optimization at the corresponding level of theory were done using the ORCA 5 quantum‐chemical software.[ 61 , 62 ] With elements of the fifth row and beyond, the automatically chosen by ORCA effective core potentials def2‐ECP for these elements were applied.[ 57 , 63 , 64 ] For potentially conformationally flexible molecules, an initial conformational search was performed at the GFN2‐xTB [65] level of theory using the CREST[ 66 , 67 ] software. Further optimization and harmonic frequency calculations were done for the lowest‐energy conformer found.
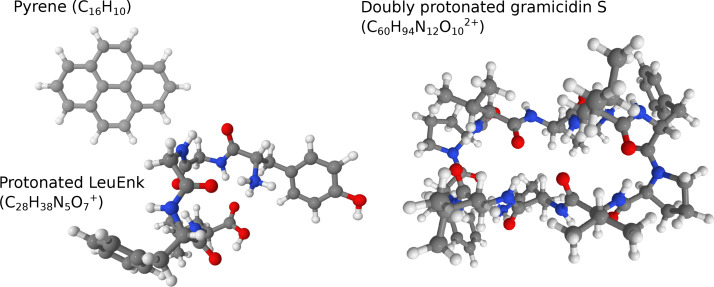
The calculations were performed in the same fashion but with a few minor differences for the illustrative molecular systems (pyrene, protonated LeuEnk, and doubly protonated gramicidin S, see Figure 2). For pyrene, in addition to harmonic spectra at all 27 chosen methods, the intensities of the overtones and combination bands at the r2SCAN‐3c level of theory were computed with the “NearIR” procedure of ORCA. [68] For protonated LeuEnk, only GGA and 3c‐methods were tested. Nine representative conformers, given in Ref. [33], were optimized at the corresponding level of theory, and then their IR harmonic spectra were averaged with the weights provided in Ref. [33]. We did not repeat the extensive work on the conformational search for the LeuEnk, relying on the results from the corresponding work. [33] For the doubly protonated gramicidin S, the given conformer from Ref. [30] was used after re‐optimization at several levels of theory from our list of methods. The IR spectra for these three systems were convoluted with the Gaussian functions with full width at half‐maximum FWHM=30 cm−1 for pyrene, FWHM=110 cm−1 for protonated LeuEnk, and FWHM=10 cm−1 for gramicidin S, to match the widths observed in the experimental spectra.
Figure 2.
Structures and chemical formulas of three molecules that were used to illustrate the performance of the scale factors obtained in this work. The colors of spheres denote the atom type: white denotes hydrogens, gray denotes carbons, blue denotes nitrogens, and red denotes oxygens.
Least‐squares Fitting of the Scale Factors
The goal of the optimization of the scale factors s was to adjust every quantum‐chemically computed harmonic frequency at a given level of theory to the experimental fundamental transition frequency as[ 38 , 41 ]
| (1) |
To find the best scale factors that approximately fulfill the requirement given in Equation 1, two types of least‐squares (LSQ) fitting were applied, which minimized a given root‐mean‐square deviation (RMSD). The first type of scale factor that we obtained is denoted as the absolute scale factor (s abs). The second type of scale factor is called the relative scale factor (s rel).
The scale factor s abs was obtained by minimizing the following absolute RMSD (aRMSD):[ 38 , 41 ]
| (2) |
where m enumerates M molecules in the training set, k enumerates the computed and experimental frequencies for the m‐th molecule, and is the total number of frequencies in the training set. The s rel was obtained by minimizing a relative RMSD (rRMSD):
| (3) |
The optimal values of the s abs and s rel and their fit uncertainties and according to Equations 2 and 3 are given as[ 38 , 41 ]
| (4) |
and
| (5) |
where and denote minimal values of Equations 2 and 3, obtained with optimal s abs and s rel according to Equations 4 and 5, respectively.
2. Results and Discussion
The resulting scaling factors and corresponding aRMSD values obtained by the procedure described in Section 2 are given in Table 1. The aRMSD values can be thought of as the expected accuracy of the given combination of the method and the scale factor, i. e., the deviations of the scaled spectra from the experimental ones are expected to be within the interval. There are a few trends that can be observed. First of all, for each given method. Secondly, the scale factors for the DF−D3(BJ)/B methods are within accuracy compared to DF−D4/B, suggesting that the effects of D3(BJ) and D4 corrections are similar. The last trend observed is a systematic decrease of the aRMSD values upon improving the basis set quality, namely aRMSD(DF‐Dn/def2‐TZVP)≤aRMSD(DF‐Dn/def2‐SVP)≤aRMSD(DF‐Dn/6‐31G).
Table 1.
Optimal absolute (s abs) and relative (s rel) harmonic frequency scaling factors were determined for the listed quantum‐chemical approximations with Equations 4 and 5, respectively. aRMSD denotes the values of the absolute root‐mean‐square deviations (Equation 2) computed for the dataset sets of frequencies with the corresponding scale factors.
|
Method |
Absolute scaling |
Relative scaling |
||||
|---|---|---|---|---|---|---|
|
DF |
Dn |
Basis |
s abs |
aRMSD, cm−1 |
s rel |
aRMSD, cm−1 |
|
6‐31G |
0.9911(6) |
72 |
1.018(2) |
84 |
||
|
D3BJ |
def2‐SVP |
0.9972(3) |
41 |
1.013(1) |
48 |
|
|
BLYP |
def2‐TZVP |
0.9960(3) |
41 |
1.017(1) |
52 |
|
|
6‐31G |
0.9912(6) |
72 |
1.017(2) |
83 |
||
|
D4 |
def2‐SVP |
0.9973(3) |
41 |
1.013(1) |
48 |
|
|
def2‐TZVP |
0.9961(3) |
41 |
1.017(1) |
52 |
||
|
6‐31G |
0.9848(6) |
67 |
1.010(2) |
79 |
||
|
D3BJ |
def2‐SVP |
0.9904(4) |
42 |
1.006(1) |
48 |
|
|
PBE |
def2‐TZVP |
0.9923(3) |
39 |
1.011(1) |
48 |
|
|
6‐31G |
0.9849(6) |
67 |
1.010(2) |
78 |
||
|
D4 |
def2‐SVP |
0.9905(4) |
42 |
1.005(1) |
48 |
|
|
def2‐TZVP |
0.9925(3) |
39 |
1.010(1) |
47 |
||
|
6‐31G |
0.9611(5) |
63 |
0.981(1) |
71 |
||
|
D3BJ |
def2‐SVP |
0.9664(3) |
36 |
0.975(1) |
39 |
|
|
B3LYP |
def2‐TZVP |
0.9671(3) |
32 |
0.979(1) |
37 |
|
|
6‐31G |
0.9613(5) |
63 |
0.981(1) |
72 |
||
|
D4 |
def2‐SVP |
0.9666(3) |
36 |
0.976(1) |
39 |
|
|
def2‐TZVP |
0.9673(3) |
32 |
0.979(1) |
37 |
||
|
6‐31G |
0.9509(5) |
59 |
0.969(1) |
66 |
||
|
D3BJ |
def2‐SVP |
0.9555(3) |
39 |
0.963(1) |
41 |
|
|
PBE0 |
def2‐TZVP |
0.9591(3) |
33 |
0.967(1) |
36 |
|
|
6‐31G |
0.9510(5) |
59 |
0.969(1) |
66 |
||
|
D4 |
def2‐SVP |
0.9556(3) |
39 |
0.963(1) |
41 |
|
|
def2‐TZVP |
0.9591(3) |
33 |
0.967(1) |
36 |
||
|
HF‐3c |
0.8400(6) |
82 |
0.858(1) |
89 |
||
|
PBEh‐3c |
0.9329(3) |
33 |
0.935(1) |
33 |
||
|
r2SCAN‐3c |
0.9688(3) |
35 |
0.982(1) |
41 |
||
In order to illustrate the applicability of the obtained scale factors, we performed calculations for three molecular systems of various sizes and complexity for which experimental vibrational spectra are available from the literature (Figure 2). Here, we will demonstrate only the results at the r2SCAN‐3c level of theory, and all the other comparisons can be found in ESI.
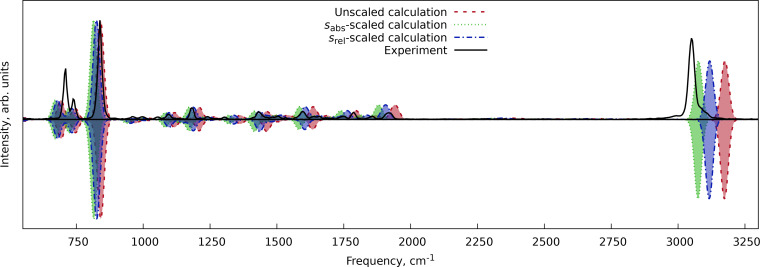
The first system was pyrene (C16H10), a four‐ring polycyclic aromatic hydrocarbon, for which the experimental gas‐phase IR spectra were available on the NIST Chemistry WebBook. [28] The comparison of the harmonic spectra with fundamentals only and with overtones and combination bands is shown in Figure 3. We can see that the same scale factors can be used to adjust the positions of the overtones and combination bands while no anharmonic corrections are applied. The s abs demonstrates the best performance for the C−H stretching vibrations (above 2000 cm−1), while the s rel performs best at the fingerprint region below 2000 cm−1, accounting for a generally better representation of the spectral features.
Figure 3.
Comparison of the scaled and unscaled harmonic IR spectrum of pyrene at the r2SCAN‐3c level of theory with the experimental data from NIST Chemistry WebBook. [28] The top theoretical trace shows a spectrum with the harmonic fundamentals, overtones, and combination bands, while the lower trace shows the harmonic spectrum with fundamental transitions only.
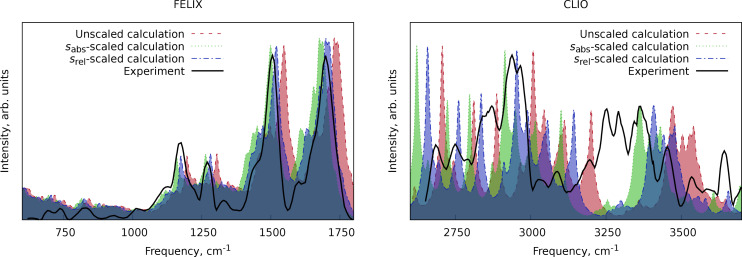
A similar pattern can be observed for the protonated version of the LeuEnk polypeptide (C28H38N5O7 +) in the spectra in the X−H stretching region (X=C, N, O) taken with the CLIO setup [70] and in the spectra in the fingerprint region taken at the FELIX facility [71] (Figure 4). The s rel‐scaled spectrum best fits to the lower energy spectral region compared to the s abs‐scaled one. The X−H stretching region has a lot of bands, probably arising from a complicated conformational composition, resonances, and overtones, which makes this region more difficult to analyze. Nevertheless, for the most visible bands in the harmonic calculations, the s abs‐scaled spectrum better matches in peak positions than the s rel‐scaled one.
Figure 4.
Comparison of the scaled and unscaled harmonic IR spectrum of the closed form of the protonated LeuEnk polypeptide at the r2SCAN‐3c level of theory with the experimental data from Ref. [33]. The numerical experimental data were extracted from the manuscript images using WebPlotDigitizer software. [69]
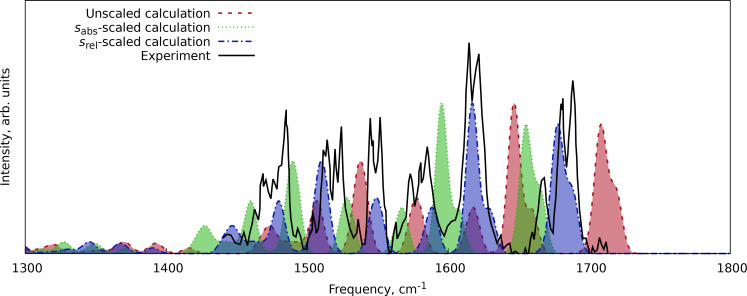
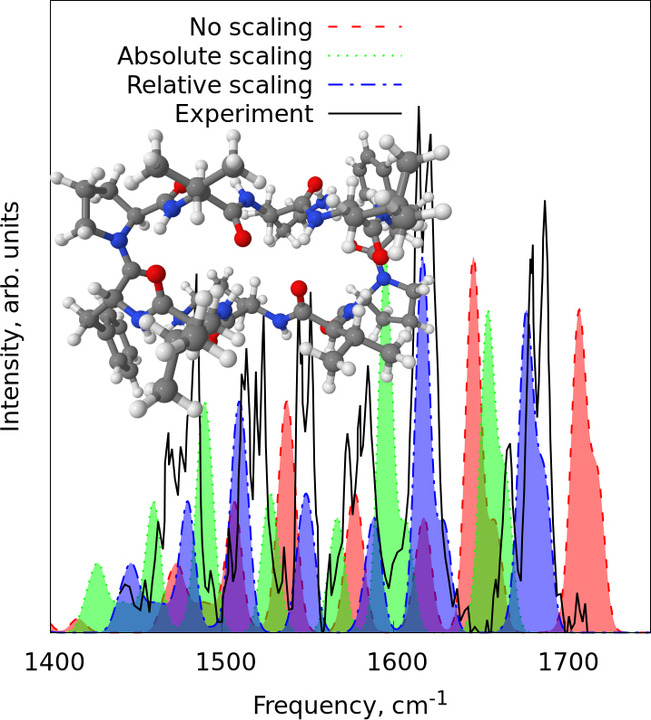
Our last example was the double protonated conformer A of gramicidin S (C60H94N12O10 2+), for which the fingerprint region helium‐tagging action spectrum was available. [30] Here (Figure 5), we observe the same trend as in the previous examples (Figures 3 and 4): the s rel‐scaled spectrum shows a good agreement with peak positions, while the s abs‐scaled spectrum overestimates the red shift of the peak positions.
Figure 5.
Comparison of the scaled and unscaled harmonic IR spectrum of double protonated conformer A of gramicidin S at the r2SCAN‐3c level of theory with the experimental data from Ref. [30]. The numerical experimental data were extracted from the manuscript images using WebPlotDigitizer software. [69]
3. Conclusions
Here, we presented the dataset and the procedure for obtaining scale factors for the IR vibrational spectra. We developed two sets of scale factors, derived from two different principles: absolute scaling (s abs), by taking into account absolute deviations of the theoretical frequency from the experimental ones, and relative scaling (s rel), which minimizes the relative deviation of one frequency from another. The numerical demonstrations with three molecular systems of various sizes (pyrene and two ionic peptides: protonated LeuEnk and doubly protonated gramicidin S) show that the s abs provides better results for the hydrogen‐stretching region (above 2000 cm−1), while the s rel outperforms s abs in the fingerprint region (below 2000 cm−1). Thus, we recommend joint usage of these scale factors to improve the predictions for different spectral regions. The RMSD values accompanying these scale factors can be used to know the appropriate deviation of the observable band positions from the scaled harmonic frequencies at a given level of theory. These considerations should always be taken into account whenever the experimental data is interpreted.
The dataset and scripts we used for quantum‐chemical calculations, data extraction, and scale factor fitting are available on Zenodo (https://doi.org/10.5281/zenodo.11174948). This data can be used to obtain the scale factors for other levels of theory.
Appendix
We perform LSQ fitting of the parameter s by minimizing the following function[ 72 , 73 ]
| (6) |
where N is the total number of theoretical and experimental values, x is the scaled property, y is the reference data point, index enumerates the data points, and σ is the initially unknown uncertainty of all data points. In the case of absolute scale factor fitting, and , while for relative scale factor fitting, and .
The function can be interpreted through the maximal likelihood principle as the negative logarithm of the probability p(s) of the solution s, namely[ 72 , 73 ]
| (7) |
where is the normalization constant.
We can find the minimal value of the function from Equation 6 as , which gives the solution[ 72 , 73 ]
| (8) |
where and . Now, we can estimate the value of uncertainty σ through the minimal value of the RMSD given as
| (9) |
where .
Representing s as , where δs is the deviation from the optimal LSQ solution (Equation 8), we can rewrite the original function (Equation 6) as[ 72 , 73 ]
| (10) |
Substitution of this equation into Equation 7 provides that the probability distribution of the deviation δs is a normal distribution with variance σs given as
| (11) |
Combining Equation 8 and 11 provides us with a final LSQ solution for scale factor s as .
Conflict of Interests
The authors declare no conflict of interest.
4.
Supporting information
As a service to our authors and readers, this journal provides supporting information supplied by the authors. Such materials are peer reviewed and may be re‐organized for online delivery, but are not copy‐edited or typeset. Technical support issues arising from supporting information (other than missing files) should be addressed to the authors.
Supporting Information
Acknowledgments
DST and MS acknowledge DESY (Hamburg, Germany), a member of the Helmholtz Association HGF. In particular, DST's calculations were enabled through the Maxwell computational resources operated at DESY. AG would like to personally thank Roman A. Makarov for providing help with the scripts and Anna Yarullina for grammar review. MAK expresses sincere gratitude to Daniil Konovalenko for the help in writing a script for automizing calculations in different methods. We are also grateful to the National Institute of Standards for its excellent work maintaining and updating important databases, including CCCBDB and Chemistry WebBook. Open Access funding enabled and organized by Projekt DEAL.
Tikhonov D. S., Gordiy I., Iakovlev D. A., Gorislav A. A., Kalinin M. A., Nikolenko S. A., Malaskeevich K. M., Yureva K., Matsokin N. A., Schnell M., ChemPhysChem 2024, 25, e202400547. 10.1002/cphc.202400547
Data Availability Statement
The quantum‐chemical calculations, database, and scripts used for obtaining and analyzing the data are avaiable on Zenodo (https://doi.org/10.5281/zenodo.11174948). Additional data visualization and detailed representation of the results are provided in the ESI.
References
- 1.Barbara H. Stuart, Infrared Spectroscopy: Fundamentals and Applications. Introduction, chapter 1, pages 1–13. John Wiley & Sons, Ltd, 2004. ISBN 9780470011140. URL https://onlinelibrary.wiley.com/doi/abs/10.1002/0470011149.ch1.
- 2.International Union of Pure and Applied Chemistry (IUPAC). 2019. URL 10.1351/goldbook.IT07399. [DOI]
- 3.Barbara H. Stuart, Infrared Spectroscopy: Fundamentals and Applications. Experimental Methods, chapter 2, pages 15–44. John Wiley & Sons, Ltd, 2004. ISBN 9780470011140. URL https://onlinelibrary.wiley.com/doi/abs/10.1002/0470011149.ch2.
- 4. Nafie Laurence A., Freedman Teresa B., Enantiomer 1998, 3(4-5), 283–297, ISSN 1024–2430. URL http://europepmc.org/abstract/MED/9861702. [PubMed] [Google Scholar]
- 5. Jähnigen Sascha, Angew. Chem. Int. Ed. 2023, 62(41), e202303595, URL https://onlinelibrary.wiley.com/doi/abs/10.1002/anie.202303595. [DOI] [PubMed] [Google Scholar]
- 6. Drużbicki Kacper, Mikuli Edward, Pałka Norbert, Zalewski Sławomir, Ossowska-Chruściel Mirosława D., J. Phys. Chem. B 2015, 119(4), 1681–1695, URL 10.1021/jp507241j. PMID: 25564699. [DOI] [PubMed] [Google Scholar]
- 7. Andreani Carla, Krzystyniak Maciej, Romanelli Giovanni, Senesi Roberto, Fernandez-Alonso Felix, Adv. Phys. 2017, 66(1), 1–73, URL 10.1080/00018732.2017.1317963. [DOI] [Google Scholar]
- 8. Drużbicki Kacper, Pinna Roberto Simone, Rudić Svemir, Jura Marek, Gorini Giuseppe, Fernandez-Alonso Felix, J. Phys. Chem. Lett. 2016, 7(22), 4701–4709, URL 10.1021/acs.jpclett.6b01822. [DOI] [PubMed] [Google Scholar]
- 9.E. Cristina Stanca-Kaposta, John P. Simons. High-resolution Infrared−Ultraviolet (IR−UV) Double-resonance Spectroscopy of Biological Molecules. John Wiley & Sons, Ltd, 2011. ISBN 9780470749593. URL https://onlinelibrary.wiley.com/doi/abs/10.1002/9780470749593.hrs096.
- 10. Polfer Nick C., Oomens Jos, Mass Spectrom. Rev. 2009, 28(3), 468–494, URL https://analyticalsciencejournals.onlinelibrary.wiley.com/doi/abs/10.1002/mas.20215. [DOI] [PubMed] [Google Scholar]
- 11. Polfer Nick C., Chem. Soc. Rev. 2011, 40, 2211–2221, URL 10.1039/C0CS00171F. [DOI] [PubMed] [Google Scholar]
- 12. Carlo Matthew J., Patrick Amanda L., J. Mass Spectrom. Adv. Clin. Lab. 2022, 23, 14–25, ISSN 2667-145X. URL https://www.sciencedirect.com/science/article/pii/S2667145X2100033X. [DOI] [PMC free article] [PubMed] [Google Scholar]
- 13. Oomens Jos, van Roij André J. A., Meijer Gerard, von Helden Gert, Astron. J. 2000, 542(1), 404, URL 10.1086/309545. [DOI] [Google Scholar]
- 14.Jongcheol Seo, Waldemar Hoffmann, Stephan Warnke, Xing Huang, Sandy Gewinner, Wieland Schöllkopf, Michael T. Bowers, Gert von Helden, Kevin Pagel, Nature Chemistry 2017, 9(1), 39–44, ISSN 1755–4349. URL 10.1038/nchem.2615. [DOI] [PubMed]
- 15. Wolk Arron B., Leavitt Christopher M., Garand Etienne, Johnson Mark A., Acc. Chem. Res. 2014, 47(1), 202–210, URL 10.1021/ar400125a. PMID: 23972279. [DOI] [PubMed] [Google Scholar]
- 16. Roithová Jana, Gray Andrew, Andris Erik, Jašík Juraj, Gerlich Dieter, Acc. Chem. Res. 2016, 49(2), 223–230, URL 10.1021/acs.accounts.5b00489. PMID: 26821086. [DOI] [PubMed] [Google Scholar]
- 17. Scutelnic Valeriu, Perez Marta A. S., Marianski Mateusz, Warnke Stephan, Gregor Aurelien, Rothlisberger Ursula, Bowers Michael T., Baldauf Carsten, von Helden Gert, Rizzo Thomas R., Seo Jongcheol, J. Am. Chem. Soc. 2018, 140(24), 7554–7560, URL 10.1021/jacs.8b02118. PMID: 29637771. [DOI] [PubMed] [Google Scholar]
- 18. Calvin Aaron, Eierman Scott, Peng Zeyun, Brzeczek Merrell, Satterthwaite Lincoln, Patterson David, Nature 2023, 621(7978), 295–299. ISSN 1476–4687. URL 10.1038/s41586-023-06351-7. [DOI] [PMC free article] [PubMed] [Google Scholar]
- 19. Wolke Conrad T., Fournier Joseph A., Dzugan Laura C., Fagiani Matias R., Odbadrakh Tuguldur T., Knorke Harald, Jordan Kenneth D., McCoy Anne B., Asmis Knut R., Johnson Mark A. Science 2016, 354(6316), 1131–1135, URL https://www.science.org/doi/abs/10.1126/science.aaf8425. [DOI] [PubMed] [Google Scholar]
- 20. Müller Fabian, Stückrath Julius B., Bischoff Florian A., Gagliardi Laura, Sauer Joachim, Debnath Sreekanta, Jorewitz Marcel, Asmis Knut R., J. Am. Chem. Soc. 2020, 142(42), 18050–18059, URL 10.1021/jacs.0c07158. PMID: 33031700. [DOI] [PubMed] [Google Scholar]
- 21. Pickering James D., Bregnhøj Mikkel, Chatterley Adam S., Rasmussen Mette H., Strunge Kris, Weidner Tobias, Biointerphases 2022, 17(1), 011201, 01. ISSN 1934–8630. URL 10.1116/6.0001401. [DOI] [PubMed] [Google Scholar]
- 22. Wang Hong-Fei, Prog. Surf. Sci. 2016, 91(4), 155–182, ISSN 0079–6816. URL https://www.sciencedirect.com/science/article/pii/S0079681616300259. [Google Scholar]
- 23. Stuart Barbara H., Industrial and Environmental Applications, chapter 8, pages 167–186. John Wiley & Sons, Ltd, 2004. ISBN 9780470011140. URL https://onlinelibrary. wiley.com/doi/abs/10.1002/0470011149.ch8. [Google Scholar]
- 24. Gehrz Robert D., Becklin Erick E., de Pater Imke, Lester Dan F., Roellig Thomas L., Woodward Charles E., Adv. Space Res. 2009, 44(4), 413–432, ISSN 0273–1177. doi: 10.1016/j.asr.2009.04.011. URL https://www.sciencedirect.com/science/article/pii/S0273117709002506. [Google Scholar]
- 25. Fauchez Thomas J., Villanueva Geronimo L., Sergeev Denis E., Turbet Martin, Boutle Ian A., Tsigaridis Kostas, Way Michael J., Wolf Eric T., Domagal-Goldman Shawn D., Forget François, Haqq-Misra Jacob, Kopparapu Ravi K., Manners James, Maynem Nathan J., Plant Sci. 2022, 3(9), 213, URL 10.3847/PSJ/ac6cf1. [DOI] [Google Scholar]
- 26.William Pluriel, Jérémy Leconte, Vivien Parmentier, Tiziano Zingales, Aurélien Falco, Franck Selsis, Pascal Bordé, Astron. Astrophys. 2022, 658, 17(A42), URL 10.1051/0004-6361/202141943. [DOI]
- 27. Coates John, Interpretation of Infrared Spectra, A Practical Approach. John Wiley & Sons, Ltd, 2006. ISBN 9780470027318. URL https://onlinelibrary.wiley.com/doi/abs/10.1002/9780470027318.a5606. [Google Scholar]
- 28.Henry M. Rosenstock, Keith Draxl, Bruce W. Steiner, John T. Herron, ”Ion Energetics Data” in NIST Chemistry WebBook, NIST Standard Reference Database Number 69, Eds. P. J. Linstrom and W. G. Mallard, National Institute of Standards and Technology, Gaithersburg MD, 20899, 10.18434/T4D303, (retrieved April 13, 2023). [DOI]
- 29. Nagornova Natalia S., Guglielmi Matteo, Doemer Manuel, Tavernelli Ivano, Rothlisberger Ursula, Rizzo Thomas R., Boyarkin Oleg V., Angew. Chem. Int. Ed. 2011, 50(23), 5383–5386, URL https://onlinelibrary.wiley.com/doi/abs/10.1002/anie.201100702. [DOI] [PubMed] [Google Scholar]
- 30. Nagornova Natalia S., Rizzo Thomas R., Boyarkin Oleg V., J. Am. Chem. Soc. 2010, 132(12), 4040–4041, doi: 10.1021/ja910118j. PMID: 20201525. [DOI] [PubMed] [Google Scholar]
- 31. van Tetering Lara, Spies Sylvia, Wildeman Quirine D. K., Houthuijs Kas J., van Outersterp Rianne E., Martens Jonathan, Wevers Ron A., Wishart David S., Berden Giel, Oomens Jos, Commun. Chem. 2024, 7(1), 30, ISSN 2399–3669. https: //doi.org/10.1038/s42004-024-01112-7. [DOI] [PMC free article] [PubMed] [Google Scholar]
- 32. Jarota Arkadiusz, Drwal Daria, Piketa Jakub, Pastorczak Ewa, Sci. Rep. 2022, 12(1), 16834, ISSN 2045–2322. URL 10.1038/s41598-022-20264-x. [DOI] [PMC free article] [PubMed] [Google Scholar]
- 33. Kotobi Amir, Schwob Lucas, Vonbun-Feldbauer Gregor B., Rossi Mariana, Gasparotto Piero, Feiler Christian, Berden Giel, Oomens Jos, Oostenrijk Bart, Scuderi Debora, Bari Sadia, Meißner Robert H., Commun. Chem. 2023, 6(1), 46, ISSN 2399–3669. URL 10.1038/s42004-023-00835-3. [DOI] [PMC free article] [PubMed] [Google Scholar]
- 34. Drużbicki Kacper, Mielcarek Jadwiga, Kiwilsza Anna, Toupet Loic, Collet Eric, Pajzderska Aleksandra, Wasicki Jan, Cryst. Growth Des. 2015, 15(6), 2817–2830, URL 10.1021/acs.cgd.5b00251. [DOI] [Google Scholar]
- 35. Tikhonov Denis S., Sharapa Dmitry I., Schwabedissen Jan, Rybkin Vladimir V., Phys. Chem. Chem. Phys. 2016, 18, 28325–28338, URL 10.1039/C6CP05849C. [DOI] [PubMed] [Google Scholar]
- 36. Kesharwani Manoj K., Brauer Brina, Martin Jan M. L., J. Phys. Chem. A 2015, 119(9), 1701–1714, URL 10.1021/jp508422u. PMID: 25296165. [DOI] [PubMed] [Google Scholar]
- 37. Alecu Ionut M., Zheng Jingjing, Zhao Yan, Truhlar Donald G., J. Chem. Theory Comput. 2010, 6(9), 2872–2887, https: //doi.org/10.1021/ct100326h. PMID: 26616087. [DOI] [PubMed] [Google Scholar]
- 38. Laury Marie L., Carlson Matthew J., Wilson Angela K., J. Comput. Chem. 2012, 33(30), 2380–2387, URL https://onlinelibrary.wiley.com/doi/abs/10.1002/jcc.23073. [DOI] [PubMed] [Google Scholar]
- 39. Merrick Jeffrey P., Moran Damian, Radom Leo, J. Phys. Chem. A 2007, 111(45), 11683–11700, URL 10.1021/jp073974n. PMID: 17948971. [DOI] [PubMed] [Google Scholar]
- 40. Pople John A., Scott Anthony P., Wong Ming Wah, Radom Leo, Isr. J. Chem. 1993, 33(3), 345–350, URL https://onlinelibrary.wiley.com/doi/abs/10.1002/ijch.199300041. [Google Scholar]
- 41. Irikura Karl K., Johnson Russell D., Kacker Raghu N., J. Phys. Chem. A 2005, 109(37), 8430–8437, URL 10.1021/jp052793n. PMID: 16834237. [DOI] [PubMed] [Google Scholar]
- 42. Pulay Peter, Fogarasi Geza, Pongor Gabor, Boggs James E., Vargha Anna, J. Am. Chem. Soc. 1983, 105(24), 7037–7047, URL 10.1021/ja00362a005. [DOI] [Google Scholar]
- 43.Database of Frequency Scale Factors for Electronic Model Chemistries https://comp.chem.umn.edu/freqscale/.
- 44.NIST Computational Chemistry Comparison, Benchmark Database, NIST Standard Reference Database Number 101 Release 22, May 2022, Editor: Russell D. Johnson III URL http://cccbdb.nist.gov/.
- 45. Khaikin Leonid S., Kochikov Igor V., Grikina Olga E., Tikhonov Denis S., Baskir Esfir G., Struct. Chem. 2015, 26(5), 1651–1687, ISSN 1572–9001. URL 10.1007/s11224-015-0613-9. [DOI] [Google Scholar]
- 46. Khaikin Leonid S., Grikina Olga E., Vogt Natalja, Stepanov Nikolaj F., Russ. J. Phys. Chem. A 2012, 86(12), 1855–1861, ISSN 1531–863X. URL 10.1134/S0036024412120102. [DOI] [Google Scholar]
- 47. Krasnoshchekov Sergey V., Vogt Natalja, Stepanov Nikolay F., J. Phys. Chem. A 2015, 119(25), 6723–6737, URL 10.1021/acs.jpca.5b03241. PMID: 26020099. [DOI] [PubMed] [Google Scholar]
- 48. Becke Axel D., Phys. Rev. A 1988, 38, 3098–3100, URL https://link.aps.org/doi/10.1103/PhysRevA.38.3098. [DOI] [PubMed] [Google Scholar]
- 49. Lee Chengteh, Yang Weitao, Parr Robert G., Phys. Rev. B 1988, 37, 785–789, URL https://link.aps.org/doi/10.1103/PhysRevB.37.785. [DOI] [PubMed] [Google Scholar]
- 50. Perdew John P., Burke Kieron, Ernzerhof Matthias, Phys. Rev. Lett. 1996, 77, 3865–3868, URL https://link.aps.org/doi/10.1103/PhysRevLett.77.3865. [DOI] [PubMed] [Google Scholar]
- 51. Becke Axel D., J. Chem. Phys. 1993, 98(7), 5648–5652, 04, ISSN 0021–9606. URL 10.1063/1.464913. [DOI] [Google Scholar]
- 52. Adamo Carlo, Barone Vincenzo, J. Chem. Phys. 1999, 110(13), 6158–6170, 04 ISSN 0021–9606. URL 10.1063/1.478522. [DOI] [Google Scholar]
- 53. Grimme Stefan, Ehrlich Stephan, Goerigk Lars, J. Comput. Chem. 2011, 32(7), 1456–1465, URL https://onlinelibrary.wiley.com/doi/abs/10.1002/jcc.21759. [DOI] [PubMed] [Google Scholar]
- 54. Caldeweyher Eike, Ehlert Sebastian, Hansen Andreas, Neugebauer Hagen, Spicher Sebastian, Bannwarth Christoph, Grimme Stefan, J. Chem. Phys. 2019, 150(15), 154122, 04 ISSN 0021–9606. URL 10.1063/1.5090222. [DOI] [PubMed] [Google Scholar]
- 55. Ditchfield Robert, Hehre Warren J., Pople John A., J. Chem. Phys. 2003, 54(2), 724–728, 09 ISSN 0021–9606. URL 10.1063/1.1674902. [DOI] [Google Scholar]
- 56. Hehre Warren J., Ditchfield Robert, Pople John A., J. Chem. Phys. 1972, 56(5), 2257–2261, 03. ISSN 0021–9606. URL 10.1063/1.1677527. [DOI] [Google Scholar]
- 57. Weigend Florian, Ahlrichs Reinhart, Phys. Chem. Chem. Phys. 2005, 7, 3297–3305, URL 10.1039/B508541A. [DOI] [PubMed] [Google Scholar]
- 58. Sure Rebecca, Grimme Stefan, J. Comput. Chem. 2013, 34(19), 1672–1685, URL https://onlinelibrary.wiley.com/doi/abs/10.1002/jcc.23317. [DOI] [PubMed] [Google Scholar]
- 59. Grimme Stefan, Brandenburg Jan Gerit, Bannwarth Christoph, Hansen Andreas, J. Chem. Phys. 2015, 143(5), 054107, 08 ISSN 0021–9606. URL 10.1063/1.4927476. [DOI] [PubMed] [Google Scholar]
- 60. Grimme Stefan, Hansen Andreas, Ehlert Sebastian, Mewes Jan-Michael, J. Chem. Phys. 2021, 154(6), 064103, 02 ISSN 0021-9606. URL 10.1063/5.0040021. [DOI] [PubMed] [Google Scholar]
- 61. Neese Frank, Wennmohs Frank, Becker Ute, Riplinger Christoph, J. Chem. Phys. 2020, 152(22), 224108, URL 10.1063/5.0004608. [DOI] [PubMed] [Google Scholar]
- 62. Neese Frank, WIREs Comput. Mol. Sci. 2022, 12(5), e1606, URL https://wires.onlinelibrary.wiley.com/doi/abs/10.1002/wcms.1606. [Google Scholar]
- 63. Metz Bernhard, Stoll Hermann, Dolg Michael, J. Chem. Phys. 2000, 113(7), 2563–2569, 08. ISSN 0021-9606. URL 10.1063/1.1305880. [DOI] [Google Scholar]
- 64. Peterson Kirk A., Figgen Detlev, Goll Erich, Stoll Hermann, Dolg Michael, J. Chem. Phys. 2003, 119(21), 11113–11123, 12. ISSN 0021-9606. URL 10.1063/1.1622924. [DOI] [Google Scholar]
- 65. Bannwarth Christoph, Ehlert Sebastian, Grimme Stefan, J. Chem. Theory Comput. 2019, 15(3), 1652–1671, URL 10.1021/acs.jctc.8b01176. PMID: 30741547. [DOI] [PubMed] [Google Scholar]
- 66. Pracht Philipp, Bohle Fabian, Grimme Stefan Phys. Chem. Chem. Phys. 2020, 22, 7169–7192, URL 10.1039/C9CP06869D. [DOI] [PubMed] [Google Scholar]
- 67. Grimme Stefan, J. Chem. Theory Comput. 2019, 15(5), 2847–2862, URL 10.1021/acs.jctc.9b00143. PMID: 30943025. [DOI] [PubMed] [Google Scholar]
- 68. Beć Krzysztof B., Huck Christian W., Front. Chem. 2019, 7, ISSN 2296-2646. URL https://www.frontiersin.org/articles/10.3389/fchem.2019.00048. [DOI] [PMC free article] [PubMed] [Google Scholar]
- 69.Ankit Rohatgi. Webplotdigitizer (4.5). Computer software. Retrieved from https://automeris.io/WebPlotDigitizer , 2021.
- 70. Prazeres R., Berset J. M., Chaput R., Glotin F., Jaroszynski D. A., Ortega J. M., Nucl. Instrum. Methods Phys. Res. Sect. B 1994, 89(1), 54–59, ISSN 0168-583X. URL https://www.sciencedirect.com/science/article/pii/0168583X94951454. [Google Scholar]
- 71. Oepts D., van der Meer A. F. G., van Amersfoort P. W., Infrared Phys. Technol. 1995, 36(1), 297–308, ISSN 1350–4495. URL https://www.sciencedirect.com/science/article/pii/135044959400074U. Proceedings of the Sixth International Conference on Infrared Physics. [Google Scholar]
- 72.William H. Press, Saul A. Teukolsky, William T. Vetterling, Brian P. Flannery. Numerical Recipes 3rd Edition: The Art of Scientific Computing. Cambridge University Press, USA, 3 edition, 2007. ISBN 0521880688.
- 73. Tikhonov Denis S., Garg Diksha, Schnell Melanie, Photochem 2024, 4(1), 57–110, ISSN 2673–7256. doi: 10.3390/photochem4010005. URL https://www.mdpi.com/2673-7256/4/1/5. [Google Scholar]
Associated Data
This section collects any data citations, data availability statements, or supplementary materials included in this article.
Supplementary Materials
As a service to our authors and readers, this journal provides supporting information supplied by the authors. Such materials are peer reviewed and may be re‐organized for online delivery, but are not copy‐edited or typeset. Technical support issues arising from supporting information (other than missing files) should be addressed to the authors.
Supporting Information
Data Availability Statement
The quantum‐chemical calculations, database, and scripts used for obtaining and analyzing the data are avaiable on Zenodo (https://doi.org/10.5281/zenodo.11174948). Additional data visualization and detailed representation of the results are provided in the ESI.


