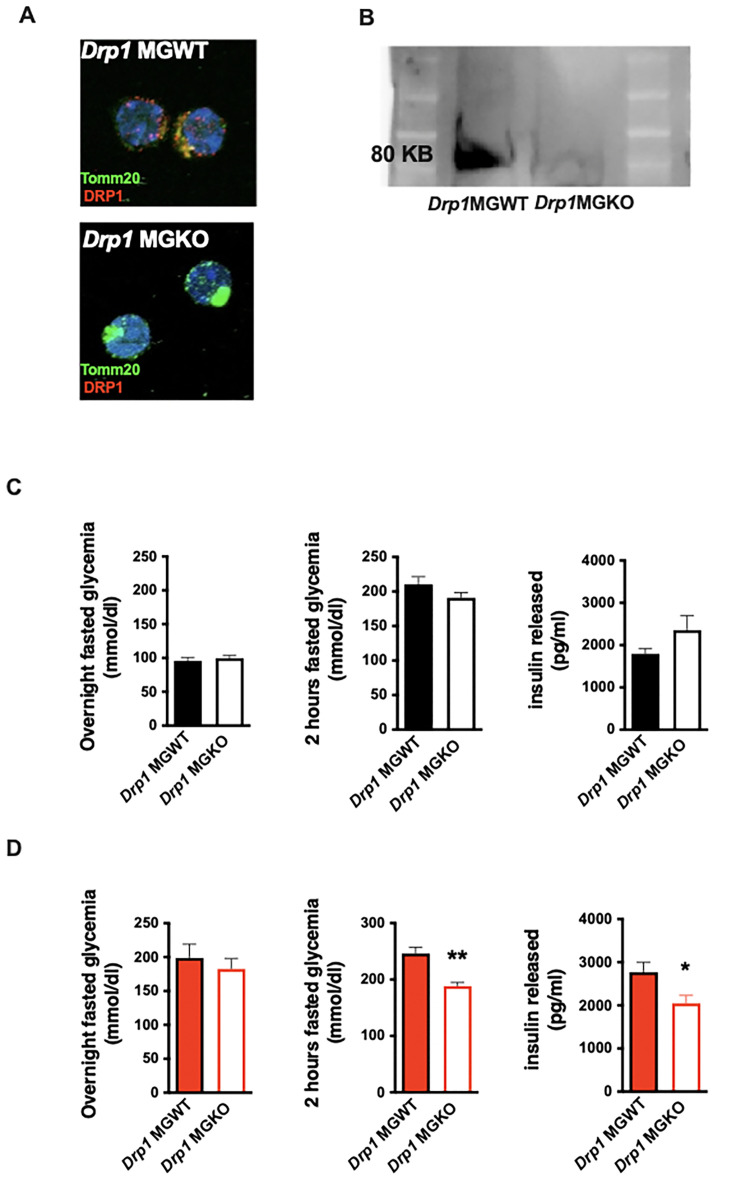
Figure 3. Acute microglial metabolic response (aMMR) is required for diet-induced homeostatic rewiring in vivo.
(A) Immunostaining of TOMM20 and DRP1 on sorted microglia from mice Drp1MGWT or Drp1MGKO. (B) Western blot against DRP1 on sorted microglia from mice Drp1MGWT or Drp1MGKO. (C) Graphs showing the overnight fasted glycemia, the 2 hr fasted glycemia, and the insulin released from Drp1MGWT or Drp1MGKO fed with control diet (n=5–11). (D) Graphs showing the overnight fasted glycemia, the 2 hr fasted glycemia, and the insulin released from Drp1MGWT or Drp1MGKO fed with 3-day high-fat diet (n=5–11). Data are presented as mean ± SEM. *p<0.05, **p<0.01, ***p<0.001 as determined by two-tailed Student’s t-test and two-way ANOVA followed by Bonferroni post hoc test.


