

Summary
Li-Fraumeni syndrome (LFS) is a heterogeneous predisposition to an individually variable spectrum of cancers caused by pathogenic TP53 germline variants. We used a clustering method to assign TP53 missense variants to classes based on their functional activities in experimental assays assessing biological p53 functions. Correlations with LFS phenotypes were analyzed using the public germline TP53 mutation database and validated in three LFS clinical cohorts. Class A carriers recapitulated all phenotypic traits of fully penetrant LFS, whereas class B carriers showed a slightly less penetrant form dominated by specific cancers, consistent with the notion that these classes identify variants with distinct functional properties. Class C displayed a lower lifetime cancer risk associated with attenuated LFS features, consistent with the notion that these variants have hypomorphic features. Class D carriers showed low lifetime cancer risks inconsistent with LFS definitions. This classification of TP53 variants provides insights into structural/functional features causing pathogenicity.
Subject areas: Genomics, Phenotyping
Graphical abstract
Highlights
-
•
We sorted TP53 variants into 4 classes based on functional assays
-
•
We analyzed their correlations with cancer phenotypes in Li-Fraumeni syndrome
-
•
Each class is associated with distinct cancer risks and phenotypes
-
•
The classes underscore structural/functional features causing pathogenicity
Genomics; Phenotyping
Introduction
Li-Fraumeni syndrome (LFS; Mendelian Inheritance in Man #151623) is an autosomal dominant cancer predisposition syndrome associated with a high lifetime risk of a broad spectrum of cancers caused by pathogenic or likely pathogenic (P/LP) TP53 germline (or mosaic) variants, 80% of which are missense.1 Typically, LFS occurs in three phases, (1) a childhood phase (0–17 years), characterized by a quartet of early life cancers (adrenocortical carcinoma [ACC], choroid plexus tumor [CPT], medulloblastoma [MB], and rhabdomyosarcoma [RMS], all of which occur almost exclusively before the age of ten years), and a high risk of soft tissue sarcoma (STS), osteosarcoma (OS), and central nervous system tumors (CNS) in adolescence; (2) an early adult phase (18–45 years), characterized by premenopausal breast cancer, multiple STS, and CNS; and (3) a late adult phase (over 45 years), characterized by lung adenocarcinoma, STS, colorectal cancer, and prostate cancer.2 Clinical definitions are traditionally based on so-called “classic” LFS criteria,3 whereas revised Chompret criteria4 capture the broad spectrum of LFS-related cancers and are aimed at identifying patients for TP53 mutation testing. Based on clinical phenotypes, two forms of LFS have been identified, with (1) LFS, defined by the presence of a P/LP TP53 variant in persons/families meeting LFS testing criteria or with cancer <18 years; and (2) attenuated LFS (aLFS), defined by the presence of a P/LP TP53 variant in a person/family who does not meet LFS testing criteria.5 This phenotypic distinction provides a framework for further investigating subtle differences in genotype-phenotype correlations by classifying TP53 variants according to their pathogenicity.
The p53 protein is a multi-functional transcription factor regulating a complex network of cellular and systemic anti-proliferative responses.6,7,8 Loss of these functions, often caused by inactivating missense mutations in the TP53 gene, impairs several coordinated mechanisms of growth suppression that normally operate to counteract carcinogenesis.9 The main functional feature of tumor-associated somatic mutations is the loss of DNA binding and transactivation capacity of the p53 tumor suppressor protein (loss of function [LOF]), either by altering the structure of the DNA-binding domain (DBD) or by destabilizing p53 oligomerization, which is required for high-affinity DNA binding. Many missense variants cause stable protein expression, which, in addition to LOF, may exert dominant-negative effects (DNEs) over wild-type allele products and have also been proposed to exert a number of pro-oncogenic gain-of-function (GOF) effects documented in experimental cell and animal models,10 the phenotypic consequences of which remain unclear in the context of LFS.
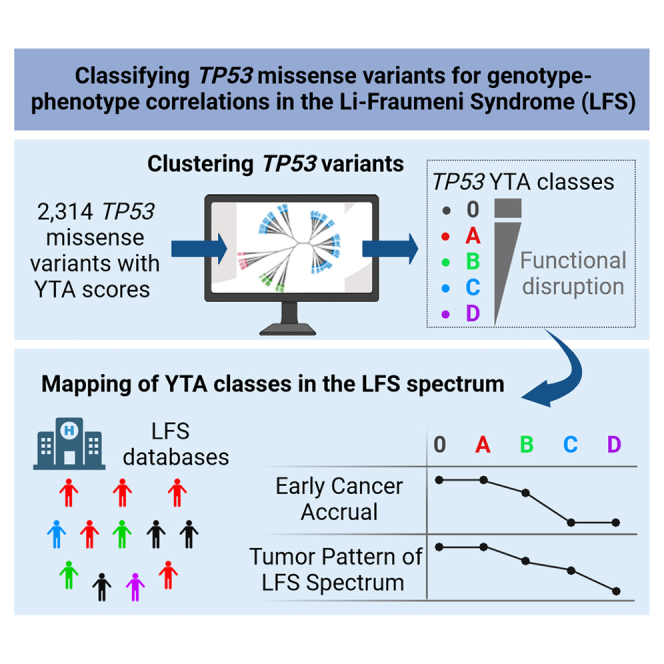
Large-scale systematic studies have assessed the impact of thousands of missense variants on biochemical and biological p53 protein functions in yeast or cell-based experimental assays.11,12,13 This wealth of information, together with carriers’ phenotypic traits, is used by the ClinGen TP53 expert panel to inform variant interpretation for clinical purposes (https://clinicalgenome.org/affiliation/50013/).14 However, the precise correlations between the functional features of TP53 variants and clinical LFS phenotypes have not been systematically addressed. In the present study, we develop a classification of TP53 missense variants into 4 functional classes that correspond to distinct cancer phenotypes, using as primary criteria the high-resolution clustering of the functional dataset developed by C. Ishioka and collaborators in a yeast-based transactivation assay (YTA).12 This dataset has systematically measured the transactivation capacity of a total of 2,314 missense variants toward synthetic reporters controlled by eight different p53 DNA response elements, thus providing eight different “mugshots” for each variant that score quantitative differences in their transactivation capacity but also highlight qualitative features in their capacity to distinguish among promoters that have not been systematically exploited for variant classification so far. Next, we have challenged the robustness of the classes based on YTA clusters in predicting LFS phenotypes by interpolating them with clusters based on saturation mutagenesis screens (SMSs) of p53 suppressor activity in an isogenic pair of TP53 wild-type and null cell lines11 (Figure 1). Overall, this two-step approach supports the definition of four functional classes of missense TP53 variants (A, B, C, and D). To precisely assess their associations with LFS phenotypes, we have compared these classes with nonsense/frameshift variants (class 0) predicted as completely inactivating the p53 protein. Mapping these classes on phenotypic LFS data from the public repository of germline TP53 variants curated at NCI (https://tp53.cancer.gov/) revealed that each class is associated with specific phenotypic traits within the LFS spectrum. Our results provide a refined resolution of genotype-phenotype correlations in LFS as well as insights on structural/functional features that specify variant pathogenicity.
Figure 1.

Strategy for classifying TP53 variants into functional classes and evaluating their correlations with cancer phenotypes in TP53 mutation carriers
First, we used hierarchical Ward’s clustering to interrogate the yeast-based transcriptional activity dataset (2,314 variants, YTA dataset).12 This approach identified four YTA classes (A to D) consistent with predictors of deleteriousness and reflecting a gradient of transcriptional activity from A (lowest activity) to D (quasi-identical to wild-type). We also created class 0, including nonsense and frameshift variants (p53 null genotype). Next, we analyzed lifetime cancer accrual and tumor patterns associated with each class using familial and individual data from the NCI germline TP53 mutation database (https://tp53.cancer.gov/).15 Third, we interpolated each class with clusters of functional scores from the human cell suppression saturation mutagenesis screens dataset (8,252 variants, SMS dataset) developed by Hahn and collaborators.11 Fourth, we assessed the significance and limitations of YTA classes by examining their concordance with ClinVar expert panel annotations (https://clinicalgenome.org/affiliation/50013/). Finally, we validated the proposed variant classification in three cohorts of carriers recruited in high-risk cancer predisposition clinics in Germany, France, and Canada (n = 821). See also Figures S1 and S2, and Table S1.
Results
YTA TP53 variant classes
Figure 1 outlines the strategy for classifying TP53 variants into functional classes and evaluating their correlations with cancer phenotypes in TP53 mutation carriers. The list of TP53 missense variants and corresponding classes and clusters is presented in Table S1. Iterative clustering of the YTA dataset identified a total of 16 clusters of various sizes based on variant similarities in their capacity to bind and activate each of the eight promoters containing different versions of p53 DNA consensus elements (from 613 variants in cluster 2_2_1 to 5 variants in cluster 3) (Figures S1 and S2A). The first layer of clustering broadly separated variants with significant loss of activity (cluster 1) from “supertrans” variants (cluster 3) and variants retaining levels of activities similar to those of wild-type p53 (cluster 2). Further layers of clustering separated, distinct variant subgroups among clusters 1 and 2. Specifically, cluster 1 was resolved into 6 clusters, including variants ranging from quasi-complete loss of transcriptional activity toward all promoters (cluster 1_1_1, “triple_1”) to variable levels or activity toward some, but not all, promoter sequences (among which the largest clusters were 1_1_3 and 1_3_1 and 1_3_2). Thus this clustering approach could resolve variants into a diversity of structure-function-mutation subgroups based on their qualitative and quantitative transcriptional similarities.
To map these clusters onto the distribution of germline TP53 mutations, we grouped them into four classes (A to D), broadly reflecting a gradient of activity with A having the lowest overall transcriptional activity and D the highest, and B and C displaying intermediate and heterogeneous activities toward different reporters (Figure S2). These four YTA classes differed in variant distribution within the p53 protein structure (Figures 2A and S3) and in their predicted structural/functional effects (Figure S4). When compared with biophysical prediction scores (Sorting Intolerant From Tolerant, Align Grantham Variation and Grantham Deviation)16,17 and integrative structural and functional scores,18 classes highlighted a gradient from A to D, with A and B being enriched in deleterious and non-functional features while C and D were enriched in non-deleterious and functional features. Class A included all common TP53 cancer mutation hotspots and was enriched in variants at residues located within the surface of the p53 protein in direct contact with DNA, in structural elements supporting the DNA-binding surface, or in structural motifs required for the cohesion of the p53 tetramerization domain. Class B included variants mapping to the DBD of p53, albeit at different residues than class A, mostly located within defined sections of the beta-sheets that constitute the scaffold of the DBD as well as in loops exposed at the surface of the protein but not within its DNA-binding surface. Class C and D were enriched in variants that mapped to the N terminus or to the extreme C terminus of p53. These sites were poorly represented in other classes.
Figure 2.

Distribution of TP53 variants from YTA classes across TP53 structure and datasets
(A) Localization of TP53 missense variants along the TP53 sequence (left). Heatmap showing the number of variants found at each amino acid position, for each YTA classes. The TP53 domains are indicated below the heatmap to visualize the localization of TP53 variants within TP53 secondary structure. Proportion of residues within each TP53 domain for the four YTA classes (right).
(B) Distribution of the variants from the YTA classes within different databases: transactivation yeast assay, gnomAD database, COSMIC database, and IARC/NCI LFS dataset. Pie charts represent the number of samples with TP53 missense variants belonging to the four YTA classes. See also Figures S3 and S4.
Figure 2B shows the distribution of classes A–D in three TP53 variant datasets: cancer-related germline variants (NCI; https://tp53.cancer.gov/), cancer-related somatic variants (COSMIC; https://cancer.sanger.ac.uk/cosmic), and non-cancer-related germline variants (gnomAD; https://gnomad.broadinstitute.org/). Class A variants were enriched by factors of 4.5- and 3.3-fold in the COSMIC and NCI datasets, respectively, but were counter-selected (0.2-fold) in the gnomAD dataset. Likewise, albeit to a lesser extent, class B variants showed positive selection in COSMIC (1.1) and NCI (1.3) datasets, but not in gnomAD (0.2). In contrast, class D variants were enriched in gnomAD (1.8) and counter-selected in COSMIC (0.1) and NCI (0.2), whereas class C was not enriched in any of the datasets. These results are compatible with the notion that classes A to D correspond to a gradient of cancer-related p53 dysfunction.
YTA classes are associated with distinct phenotypic patterns within the LF spectrum
To explore the correlations between YTA classes and tumor phenotypes within the broad Li-Fraumeni (LF) spectrum, we analyzed lifetime cancer accrual and tumor patterns using data compiled in the NCI germline TP53 mutation database (https://tp53.cancer.gov/),15 a repository of germline variants detected in subjects (n = 3,446) from 1,522 families. For comparing the missense variants with strict LOF variants, we constructed a class “zero” (0) that included variants considered as “null” for p53, i.e., nonsense and frameshift variants that preclude the synthesis of a functional p53 protein (Figure S5). Class 0 includes variants considered to have exclusively LOF effects and thus provides a reference to evaluate possible DNEs and GOF effects carried by missense variants in classes A to D. Figure 3A shows that class A variants were found in 1,426 (53%) patients, followed by class 0 (552, 21%), B (290, 11%), C (242, 9%), and D (171, 6%). Gender distribution differed among classes, with a lower proportion of males in classes B, C, and D (31.4%, 26.7%, and 32%, respectively) than in classes 0 and A (40.9% and 40.6%, respectively) (Figure 3B). With respect to lifetime cancer accrual, classes 0 and A were associated with the most severe profiles (median age at first diagnosis = 28 years) (Figures 3C–3E). Classes C and D were associated with attenuated accrual profiles (median age = 41 years), whereas class B showed an intermediate and distinct profile (median age = 33 years), characterized by rapid accrual during childhood (similar to classes A and 0) and slower accrual during adolescence and adulthood. This gradient of pathogenicity was reflected in the proportion of carriers with multiple cancers as well as cancer free (Figures 3F and 3G) and was consistent with current definitions of clinical phenotypes (Figures 3I and 3J). Of note, variants in established cancer predisposition genes other than TP53 were more frequently found in carriers of class D variants than in carriers of any other variant class (Figure 3H).
Figure 3.

Relationship between YTA classes and clinical phenotype in Li-Fraumeni syndrome
(A) Distribution of TP53 germline carriers in the IARC/NCI database into classes. Class 0 includes non-missense variants (stop and frameshift).
(B) Sex distribution of individuals (F, females; M, males) for each class.
(C) Cancer accrual of individuals according to classes. The inverted Kaplan-Meier presentation corresponds to the age of onset of the first cancer in each individual. The confidence intervals at 95% are displayed on the curves, and the p value of the log rank test is indicated.
(D) Pairwise comparison of cancer accrual for each class. A multiple pairwise comparison (with Bonferroni correction) shows the significance of differences in cancer accrual between the classes (adjusted p value).
(E) Median age of cancer accrual according to the classes. The median age is indicated as a dot, and the confidence intervals at 95% are indicated by bars aside the dot.
(F) Proportion of individuals developing more than one cancer during lifetime. For each class, the barplot displays the percentage of individuals with more than one cancer.
(G) Proportion of cancer-free individuals. For each class, the barplot shows the percentage of individuals who did not develop any cancer.
(H) Proportion of individuals with a germline variant in an established cancer predisposing gene (CPG). For each class, the barplot shows the percentage of individuals who carry a variant for a CPG other than TP53.
(I) Distribution of clinical classes within TP53 classes. The proportion of individuals belonging to the following categories are displayed: Li-Fraumeni syndrome (LFS), Li-Fraumeni-like syndrome (LFL), Chompret criteria (TP53_Chompret), familial history of cancer (FH), no familial history of cancer (noFH), other, and not applicable (NA).
(J) Distribution of clinical phenotypes of the LFS spectrum definition within TP53 classes. The proportion of individuals belonging to the categories LFS, attenuated LFS, and incidental LFS are displayed. All TP53 variants are included, regardeless of their ClinVar annotations. See also Figure S5.
Comparison across classes revealed statistically significant differences in tumor patterns (Figures 4, S6, and S7; Table S2). Classes 0 and A shared topological and morphological tumor patterns that recapitulated the broad phenotype of the LF spectrum. This included LFS signature cancers such as childhood ACC, CPT, RMS, and MB, teenage OS, and early breast phyllodes cancers. There were, however, small but statistically significant differences between 0 and A, the latter presenting with a higher proportion of brain cancers (risk ratio [RR] = 1.53, 95% confidence interval [CI] [1.16–2.05]), including in particular CPT (Figures 4B, 4C, and S6; Table S2) compared to class 0. Compared to 0 and A, class B showed a slightly delayed median age of tumor onset as compared to classes 0 and A as well as a smaller proportion of most cancers that define the LF spectrum (Figures 4B, 4C, and S6), except ACC (RR B vs. A = 2.74 (95% CI [1.78; 4.14]); RR B vs. 0 = 3.12 (95% CI [1.84–5.34]) (Table S2). Indeed, in class B, ACC was the most common cancer form before the age of 10 and was responsible for the rapid cancer accrual in early life (Figure 3C) despite the rarity of other childhood signature cancers (i.e., RMS and MB) (Figure S6). Compared to A, class B also showed a higher proportion of cancer-free carriers (Figure 3G) and differences in the predominant forms of CNS cancers (mostly glioblastomas) (Figures 4B and S6). Compared to 0, A, and B, class C presented with an attenuated risk of all cancers of the LF spectrum, except ACC (RR C vs. A = 2.05 (95% CI [1.20–3.34]) and breast cancers (BCs) (RR C vs. A = 1.75 (95% CI [1.32–2.31]) (Figures 4B, 4C, and S6, Table S2). In contrast, class C carriers rarely presented with OS, CPT, RMS, or MB compared to class 0 and A (Figure S6). Class C also presented with a higher proportion of cancer-free carriers than any other class (Figure 3G). Finally, class D included low penetrance variants, with signature LF cancers such as early ACC, CPT, MB, OS, and phyllodes tumors of the breast being, if not absent, significantly less represented than in A, B, or C (Figures 4B, 4C, and S6). The most frequent early cancers in D were hematopoietic malignancies, which are common sporadic neoplasia in children, independently of germline TP53 status. Class D variants retained quasi-wild-type p53 transcriptional properties for at least half of the YTA promoters tested, consistent with enrichment in variants annotated as benign or likely benign (B/LB) by ClinVar. Overall, classes 0 and A were associated with the most severe forms of LFS, class B showed a slightly less penetrant form with ACC as the most frequent early life cancer, class C corresponded to an attenuated form predisposing to at least some cancers of the LF spectrum (ACC and BC), whereas class D did not appear to carry a significant risk for typical LF cancers (Figure 4C).
Figure 4.

Association of YTA classes with tumor spectrum in LFS
(A) Age-specific distribution of cancers (all topologies combined) for TP53 classes. The rain-cloud plots display (1) a density plot showing distribution of age of onset for cancers, (2) a box plot showing median age of onset as well as quartile and outlier values, and (3) a dot plot showing every cancer analyzed.
(B) Distribution of cancers by topology. The most frequent LFS topologies are displayed (adrenal gland, brain, bones, soft tissues, hematopoietic system, and breast); all other topologies are referred as “other.” Multiple pairwise comparisons of proportion of topologies within classes are performed using logistic model based on Khi2 statistic to extract risk ratio, confidence intervals at 95%, and an adjusted p value (correction for multiple comparisons using Benjamini-Hochberg method). Statistical comparisons are found in Table S2.
(C) Variation of cancer topology within classes. Heatmap synthetizes cancer topology distribution from Figure 4B (normalized in row by cancer topologies), and color scale represents enrichement scores. See also Figures S6 and S7.
Dissecting YTA variant classes with functional scores from human cell-based assays
Despite their sensitivity for capturing subtle structural differences in DNA interactions caused by mutations, YTA screens may lack the physiological relevance of human cell-based assays aimed at directly evaluating the capacity of p53 variants to suppress cell growth. To challenge the robustness of YTA classes in the light of human cell-based functional data, we have interpolated them with a functional score developed in Giacomelli et al11 (phenotypic selection model; SMS dataset). Figure 5A shows that this score was broadly consistent with YTA classes, with A having the highest and D the lowest median score. However, individual variant scores were widely distributed within each class. To further assess this heterogeneity, we applied Ward clustering using the three phenotypic enrichment scores in the SMS dataset. These scores evaluate the capacity of TP53 variants to either suppress cell growth or maintain cell viability either in the presence or absence of wild-type TP53, thus providing metrics to assess LOF and DNE. This analysis identified 3 clusters (G1 to G3), with G1 containing variants with both LOF and DNE, G2 consisting of variants that had exclusively LOF effects, and G3 including variants with enrichment scores similar to wild-type TP53 (neither LOF nor DNE) (Figures 5B and 5D). Interpolating G clusters with YTA classes showed that both class A and B included predominantly G1 and G2 variants, albeit in different proportions, whereas class C and D contained predominantly of G2 and G3 variants (Figure 5C). When applied to lifetime cancer accrual in germline TP53 carriers, the 3 G clusters enable separating two phenotypic groups, corresponding to more (G1) or less severe (G2 and G3) cancer predisposition traits, however without clearly separating distinct LF phenotypes (Figure 5E). We next evaluated the phenotypic heterogeneity of each YTA class (A–D) by separating them according to SMS clusters (G1–G3) (Figure 5E). This analysis revealed that YTA classes were remarkably robust, showing quasi-identical cancer accrual either for G1 and G2 variants in the A class or G2 and G3 variants in the D class. The only exception was a G3 variant in the A class, p.K305M, identified so far in only 1 family (3 adult patients) that did not match any LFS clinical criteria. Within class B and C, separation according to G clusters revealed significant heterogeneity (p = 0.0076 for B and 0.00034 for C). Within each of these classes, variants of the G1 cluster tended to show a more severe phenotype than those of G2 and G3 clusters. This observation, in addition to the differences in accrual profiles in A and B classes irrespective of G clusters, supports that the YTA classes captured a degree of phenotypic severity, which is not represented in the G clustering (SMS scores in human cells). As supplementary data, we present additional analyses using another systematic human cell-based functional score developed by Kotler et al.13 (relative fitness score; Figure S8) as well as a comparison between YTA classes and TP53_PROF, a machine learning model that integrates yeast, cell-based, and computational metrics developed by Ben-Cohen et al18 (Figure S9). Overall, these analyses further underlined the remarkable consistency between YTA classes and other metrics aimed at predicting the impact of missense mutations in p53.
Figure 5.

Dissecting YTA variant classes with scores derived from human cells
(A) Distribution of functional scorings from human cell-based assays (phenotypic selection model11) for the 2,314 TP53 missense variants, subdivided by YTA classes. Violin plots with dot plots display the distribution of scores, and the median scores are indicated as white triangles.
(B) Clustering of TP53 missense variants based on scores derived from human cell dataset.11 The three Z scores were used to separate the TP53 variants into 3 clusters named G1, G2, and G3.
(C) Distribution of TP53 variants according to clusters G1, G2, and G3 within the YTA classes A, B, C, and D. The histogram represents the proportion of G1, G2, and G3 variants within each YTA class.
(D) Distribution of the three Z scores in the clusters G1, G2, and G3. This clustering results in a gradient of functionality with G1 containing the most disrupted variants and G3 the most functional ones.
(E) Cancer accrual of the G1, G2, and G3 clusters interpolated with the classes A, B, C, and D. Age of first cancer is reported for each individual. Top left: all TP53 variants mixed. Other panels represent variants separated into classes A, B, C, and D. p value of the log rank test is indicated to assess the significance of differences between groups. See also Figures S8 and S9.
Clinical significance of YTA classes
ClinVar expert panel annotations (https://clinicalgenome.org/affiliation/50013/) are based on expert consensus review of genotype/phenotype correlations and are the current standard for interpreting TP53 germline variants for clinical purposes.14 However, these annotations cover only a proportion of all missense variants in the NCI germline dataset. We thus assessed the concordance between YTA classes and ClinVar expert panel as a first step to determine whether YTA classes could assist in the clinical evaluation of variants that have not yet been annotated to date. Figure 6A shows that YTA classes were concordant with expert panel annotations, with A and B classes mostly represented among P/PL variants and C and D classes mostly represented among B/LB variants. The only exception was D49H, a YTA class A – SMS G2 (LOF) variant annotated as LB by ClinVar. This variant is documented in only one family (2 patients) that matched the LFS Chompret’s criteria (embryonal RMS of the cervix at 2 years and Hodgkin’s lymphoma at 15 years).19 Variants annotated as “Uncertain Significance” were predominant in class C variants, followed by class B and D variants, suggesting that YTA classes may help in resolving ambiguities in variant annotations. Overall, YTA classes were remarkably consistent with expert panel annotations (p < 0.0001) (Figures 6B and 3C). Moreover, within classes A, B, and C, cancer accrual in carriers of non-expert panel variants was almost perfectly aligned with that of expert panel-curated variants (Figure 6C). Thus, YTA classes could adequately predict cancer accrual and phenotypes in subjects carrying variants not annotated by the expert panel.
Figure 6.

Concordance between YTA classes and ClinVar annotations
(A) Distribution of expert panel-reviewed and non-expert-panel reviewed TP53 variants in the ClinVar classification. Variants from the IARC/NCI TP53 germline database are indicated in the pie chart. The second row of pie charts represents the breakdown of expert panel-reviewed variants in ClinVar categories (pathogenic, likely pathogenic, uncertain significance, likely benign, and benign). Mapping of the YTA classes within each ClinVar category is displayed. The number of variants for each ClinVar category is indicated within each pie chart.
(B) Cancer accrual of each YTA class for the subcategory of expert panel-reviewed TP53 variants (top). The first cancer of the NCI/IARC TP53 germline database is used to monitor cancer accrual. Confidence intervals at 95% and log rank test p value are indicated. Median age of cancer accrual according to the classes (bottom). The median age is indicated as a dot, and the confidence intervals at 95% are indicated by bars aside the dot.
(C) Comparison of cancer accrual for variants annotated by expert panel versus variants not annotated by expert panel (No). Left: cancer accrual within each YTA class. Right: the median and confidence intervals.
To further assess the robustness of YTA classes in a clinical context, we examined cancer accrual and tumor patterns in three independent cohorts of carriers recruited in different high-risk cancer predisposition clinics in Germany (n = 146, LFS Registry in Hannover), France (n = 578, French LFS cohort), and Canada (n = 97, Toronto LFS cohort). These cohorts are maintained and annotated mainly independently of the NCI germline dataset. Figure 7 shows that, in each cohort, YTA classes correctly predicted cancer accrual and distinguished among carriers with quantitative and qualitative differences in the LF spectrum. In all cohorts, class A carriers presented the most severe phenotype (similar to class 0 in the German and Canadian cohort). Compared to A, class B carriers had a distinct and less penetrant phenotype, characterized by high risk of early-life ACC and slightly delayed overall cancer accrual. Class C carriers often had attenuated phenotypes, nevertheless including cancers typical of the LF spectrum (i.e., ACC and BC) but excluding most other signature LF childhood cancers, whereas in class D, tumor patterns tended to be more heterogeneous, with most of carriers not matching LF spectrum definitions (Figure S10). Overall, these observations support that YTA classes can help to predict specific patterns of risk in germline carriers and could be particularly helpful for assessing the risk of novel variants as well as variants not yet annotated by expert panels or ClinVar.
Figure 7.

Matching YTA classes to Li-Fraumeni clinical validation cohorts
For each cohort, the patients’ distribution into TP53 classes are shown in the pie charts (left), as well as the cancer accrual using the age of onset for the first cancer, confidence intervals at 95% and l rank p values (right).
(A) Cohort 1 (France) analysis.
(B) Cohort 2 (Germany) analysis.
(C) Cohort 3 (Canada) analysis. See also Figure S10.
Discussion
This classification of TP53 missense variants into 4 functional classes (A–D) supports a robust interpolation between genotypes (variant characteristics) and phenotypes (cancer risk and spectrum). The classification correctly separated severe from mild or benign variants in all structural domains of the p53 protein, including transactivation domain, DBD, and tetramerization domain. The classification is based on quantitative and qualitative similarities between variants in YTA and is remarkably consistent with human cell-based functional metrics from SMSs of TP53 variants. However, interpolating YTA classes with clustered SMS scores showed that YTA classes afforded superior precision in distinguishing variant carriers with distinct phenotypic features of LFS.
Class A identified a group of severe variants that mostly fell within major structural motifs of the DBD of the p53 protein. Carriers of these variants recapitulated all phenotypic traits of severe LFS. Interestingly, tumor phenotypes in class A carriers were only marginally distinct from those or carriers of null/frameshift TP53 variants (class 0), the only difference being a higher proportion of CNS cancers in class A than in class 0 (RR = 1.53, 95% CI [1.16–2.05]). Likewise, separating class A variants into variants with DNEs (SMS cluster G1) or simply LOF (SMS cluster G2) did not reveal significant differences in cancer accrual or phenotypic spectrum. These observations suggest that, in the context of LFS, LOF is the main, if not the only functional property of TP53 variants that causes disease severity and that mutant-specific effects such as DNEs or GOF effects play only minor, tissue-specific roles.
Most class B variants were distributed within structural motifs of the DBD that are not in direct contact with DNA. These variants showed less severe structural and functional features than class A as well as a greater heterogeneity in their transcriptional activities, suggesting that they may partially retain wild-type activity toward a subset of promoters. Phenotypes in B carriers were slightly and selectively attenuated as compared to A carriers, in particular during childhood and adolescence. Whereas early signature cancers such as RMS, CPT, MB, or OS were infrequent in class B carriers, the proportion of ACC was higher than in classes 0 and A. As a result, class B carriers show a distinct profile of cancer accrual in early life, with high risk caused by ACC until age 9, followed by a period of relatively low risk between ages 10 and 20. The selectivity of class B variants for ACC suggests that perinatal adrenal cortical cells are exquisitely sensitive to wild-type p53 dosage and that variants mediating partial loss of wild-type p53 activity may suffice to enhance the risk of early ACC.
Class C included lower penetrance variants that nevertheless predisposed to cancers typical of the LF spectrum. This class was the most heterogeneous when interpolated with SMS clusters. Interestingly, this class included two founder variants described as “hypomorphs,” R337H (Brazilian-centric),20 Y107H (African-centric),21 as well as R181 C/H, which retain partial wild-type p53 activities when tested in standard conditions in vitro but cause a significant risk for diverse cancers of the LF spectrum in both children and adults. It has been suggested that these variants may require synergistic alterations in other pathways to express their full pathogenic potential. This hypothesis is supported by the discovery that, in R337H carriers, an inactivating variant of the putative tumor suppressor XAF1 (E134∗/Glu134Ter/rs146752602) enhances the risk of developing sarcomas.22 Thus, class C may be enriched in incompletely inactivating variants that require other genetic, epigenetic, or metabolic/biochemical complementation to express their full pathogenic potential. This hypothesis may account for the disparities of SMS scores associated with these variants: their functional impact in any particular cell-based assay may depend upon the presence in these cells of factors required for complementing the TP53 variant.
Class D represented a homogenous class of less severe variants that were associated with strongly attenuated LFS features. These observations suggest carriage of a class D variant does not in itself predispose to LFS. This hypothesis is supported by the fact that pathogenic variants in other cancer predisposition genes were more frequently detected in carriers of D variants than in any other class. This suggests that, in carriers of D variants, cancer predisposition may be at least partially caused by other pathogenic variants. However, further analysis is needed since this information is not available for the majority of the carriers documented in the dataset. Therefore, it cannot be excluded that in specific contexts (e.g., genetic modifiers), at least some class D variants may contribute to enhance the risk of cancers of the LF spectrum. Thus, great care should be exercised when considering such variants in genetic counseling.
This classification provides insights into the concept of attenuation within the LF spectrum.5 The term aLFS has been coined to identify an LF phenotype defined by the presence of a germline P/LP TP53 variant in a person with any cancer who does not meet LFS genetic testing criteria and has no cancer diagnosed before age 18 years. The YTA classification did not identify a unique YTA class matching this phenotypic definition. However, there was a gradient in the proportion of individuals with aLFS phenotype from class 0 or A (<17%–21%) to class C or D (>50%–61%) (Figure 4J). Remarkably, even among carriers who met LFS genetic testing criteria, YTA classes underscored a gradient of phenotypic attenuation, with carriers of B or C variants presenting, on average, with a less severe phenotype than carriers of A or 0 variants. Another key message is that risk attenuation in relation to YTA classes does not obey to a unique, linear rule for all cancers that characterize the LF spectrum. In particular, carriers of B or C variants retain a risk for early ACC at least equal to classes 0 and A, supporting that predisposition to this cancer can be high even with relatively mild TP53 variants. In contrast, other signature LF cancers, such as OS, CPT, MB, or RMS, were remarkably more prevalent in carriers of 0 or A than in carriers of B, C, or D variant classes.
Overall, our integrative genotypic/phenotypic analysis provides an approach that complement, but does not supersedes, expert curation efforts aimed at predicting individual and familial risk in germline variant carriers, as well as a basis to identify hypomorphic variants that require genetic or epigenetic modification to express their full pathogenic potential.
Limitations of the study
This study has several limitations. First, it does not take into account the fact that at least some mutations causing missense variants may also cause aberrant mRNA splicing patterns, resulting in loss of p53 protein expression. Such effects may confer greater severity to variants currently solely interpreted as missense. So far, these effects on splicing have not been evaluated in systematic functional assays. Second, it remains to be determined whether the different classes A–D coincide with distinct patterns of expression of p53 target genes, in particular in normal cells and tissues of carriers of TP53 germline variants.
Resource availability
Lead contact
Further information and requests for resources should be directed to and will be fulfilled by the lead contact, Pierre Hainaut (pierre.hainaut@univ-grenoble-alpes.fr).
Materials availability
This study did not generate new unique materials.
Data and code availability
-
•
This paper analyzes existing, publicly available data. The references for the datasets are listed in the key resources table of the STAR Methods. Newly generated data consisting of TP53 variants classification into classes based on clustering approach are publicly available as a table in supplementary information (Table S1).
-
•
The code used for performing iterative clustering of TP53 variants based on YTA, in order to generate the YTA clusters, is available in supplemental data (Data S1 file).
-
•
Any additional information required to reanalyze the data reported in this paper is available from the lead contact upon request.
Acknowledgments
E.M. was a recipient of a European MSCA individual fellowship (846806) and a Fondation ARC postdoctoral fellowship. P.H.’s laboratory was supported by the IDEX of Université Grenoble Alpes (LIFE project) and Fondation MSDAvenir (ERICAN project). C.F.’s research was funded by Fondation ARC and Cancéropôle Lyon Auvergne Rhône-Alpes. C.P.K. is supported by the BMBF ADDRess (01GM2205A) and the Deutsche Kinderkrebsstiftung (DKS2024.03). D.M. is supported by a Program Project grant from the Terry Fox Research Institute (1081) and holds the CIBC Children’s Foundation Chair in Child Health Research.
Author contributions
E.M., N.L., and P.H. conceived and designed the study. P.H. supervised research. N.L. performed hierarchical clustering. E.M. performed bioinformatic analysis and graphical representations with the help of S.B. E.M. analyzed genotype-phenotype correlations with the help of C.F. J.P., C.P.K., G.B., N.W.F., and D.M. provided clinical data. A.A. and F.C. assisted E.M. with statistical analyses. J.P., C.P.K., G.B., N.W.F., D.M., M.-I.A., A.J.L., and C.G. contributed to the discussion and interpretation of variant classes. E.M. and P.H. wrote the manuscript. All authors critically revised the manuscript for important intellectual content and approved the version for publication.
Declaration of interests
The authors declare no competing interests.
STAR★Methods
Key resources table
| REAGENT or RESOURCE | SOURCE | IDENTIFIER |
|---|---|---|
| Deposited data | ||
| TP53 germline database | de Andrade et al.15 | https://tp53.cancer.gov/ |
| TP53 validation cohorts | Subasri et al.23 Penkert et al.24 Bougeard et al.1 |
https://doi.org/10.1158/2767-9764.CRC-22-0402 https://doi.org/10.1186/s13045-022-01332-1 https://doi.org/10.1200/JCO.2014.59.5728 |
| TP53 yeast transactivation assay (YTA) dataset | Kato et al.12 | https://doi.org/10.1073/pnas.1431692100 |
| TP53 human cell assays A549 saturation mutagenesis screens (SMS) dataset | Giacomelli et al.11 | https://doi.org/10.1038/s41588-018-0204-y |
| TP53 human cell assays H1299 relative fitness score dataset | Kotler et al.13 | https://doi.org/10.1016/j.molcel.2018.06.012 |
| TP53 prediction of functionality TP53_PROF | Ben Cohen et al.18 | https://doi.org/10.1093/bib/bbab524 |
| Sorting Intolerant from Tolerant (SIFT) database | Ng et al.17 | https://sift.bii.a-star.edu.sg |
| Align Grantham Variation Grantham Deviation (AGVGD) database | Mathe et al.16 | http://agvgd.hci.utah.edu |
| ClinVar database | Landrum et al.25 | https://www.ncbi.nlm.nih.gov/clinvar |
| Cosmic database v97 | Tate et al.26 | https://cancer.sanger.ac.uk/cosmic |
| GnomAD database v3.1.2 | Gudmundsson et al.27 | https://gnomad.broadinstitute.org |
| Software | ||
| R | NA | https://www.r-project.org/ |
| ChimeraX | Pettersen et al.28 | https://www.cgl.ucsf.edu/chimerax |
Experimental model and study participant Details
TP53 germline variant dataset
We analyzed the YTA classes on clinical data from the LF spectrum database R20 (germline TP53 variants), released in July 2019 and hosted at the NCI (https://tp53.cancer.gov/).15 This database recapitulates clinical data of patients carrying TP53 germline variants. The database contains data from 3,446 individuals (from 1,522 families) reported in the scientific literature since 1990. Individuals carrying several TP53 variants were excluded from our analysis because of complexity to determine the contribution of individual variants in these patients. Also, individuals carrying the TP53 p.R337H Brazilian variant who were not recruited through familial history of cancer were removed, because of bias of analysis (in column “Ref_ID”: 138, 196, 259, 323 and 400 were selected in the LF spectrum database). Individuals carrying TP53 missense variants were dispatched in groups corresponding to the YTA classes (A, B, C, D). The remaining individuals, carrying non-missense variants were selected based on the type of effect of the variant in order to build a class of reference containing non-functional (LOF) variants. We only kept nonsense and frameshift (ft) variants (from column “Effect”) to consolidate a null class (named class 0) corresponding to disruption of the full-length protein.
TP53 germline variant validation datasets
Three validation cohorts originating from three different clinics were used to verify the consistency of our observations for the YTA classes.
-
(1)
The “LFS Registry in Hannover”, Germany, recruits patients with a previously established diagnosis of LFS.24 Only patients carrying pathogenic or likely pathogenic variants (according to Fortuno criteria) are included. N = 146 individuals.
-
(2)
The “French LFS Cohort” has included germline missense TP53 variants from the French registry (Rouen, France) identified in cancer patients who benefited from TP53 analysis.1 N = 578 individuals.
-
(3)
The “Toronto LFS Cohort”, Canada, is a multi-institutional collection of data from patients and families carrying germline pathogenic variants that were referred to The Hospital for Sick Children.23 N = 97 individuals.
Ethics committee of Hannover Medical School, French National Ethics Committee, and Ethics committee of the Hospital for Sick Children gave approval for this work.
Method Details
Iterative clustering on YTA dataset
We retrieved transactivation scores from 2,314 TP53 variants12 on eight TP53 promoters (WAF1nWT, MDM2nWT, BAXnWT, h1433snWT, AIP1nWT, GADD45nWT, NOXAnWT, P53R2nWT). We performed hierarchical Ward clustering in R v3.6.1 with Euclidean distance, and chose three clusters. We performed a second iteration of clustering in the sub-clusters including more than 50 mutations. Up to three layers of clustering iterations were processed. A total of 16 distinct clusters were thus defined. Dendrograms were retrieved with dendextend package, and heatmaps were built using pheatmap package. Final groups of clusters (YTA classes) were defined via the following approach: the most disrupted variants (cluster 1_1_1) were assigned to class A; variants of the upper layer (layer 1_1 except cluster 1_1_1) were defined as class B; variants of the next upper layer (layer 1 except the layer 1_1) were defined as class C; finally, the less disrupted variants (all variants except layer 1) were defined as class D.
Clustering on human cells assays
Data from cell-based saturation mutation screens of TP53 variants in A549 cells were used.11 We extracted three metrics for each the 2,314 TP53 variants of the YTA dataset: A549 p53WT Nutlin.3 Z.score, A549 p53NULL Nutlin.3 Z.score and A549 p53NULL Etoposide Z.score. We performed Ward clustering in R v4.2.2 with Euclidean distance (k = 3; clusters G1, G2 and G3). Dendrogram was retrieved with ape package.
Correlations between YTA classes and predictors of variant deleteriousness
We confronted our classes to various scores attributed to TP53: the transactivation classes as previously defined by the analysis of transactivation in yeast assays,12 the Sorting Intolerant from Tolerant (SIFT) database (https://sift.bii.a-star.edu.sg),17 the Align Grantham Variation Grantham Deviation (AGVGD) database (http://agvgd.hci.utah.edu),16 the TP53 prediction of functionality (TP53_PROF),18 the TP53 functionality scores obtained in human cell lines11,13 and the ClinVar database which aggregates information about genomic variation and its relationship to human health (https://www.ncbi.nlm.nih.gov/clinvar).25 The confrontation of the classes with the various TP53 scores was performed using Pareto Plot or Pie Chart representations for categorical values and Scattered Plots and Violin Plots for numerical values (R, ggplot2 package). Cancer accrual of the subgroups of each YTA class was analyzed and the median age and statistical differences were extracted similar to YTA class comparison.
Mapping of YTA classes to p53 protein structure
The distribution of TP53 mutated residues along the TP53 sequence and domains was analyzed for each YTA class. Heatmaps were used to highlight the pattern of distribution of variants along TP53 sequence in the different YTA classes (R, package pheatmap). The proportion of variants within each TP53 domain is depicted using cumulative histograms (R, package ggplot2). The localization of mutations in the p53 protein structure was assessed using the software ChimeraX28 (https://www.cgl.ucsf.edu/chimerax) together with PDB files of the TP53 binding domain 3KMD29 and the TP53 tetramerization domain 1C26,30 as well as the alpha-fold modelized structure.31
Distribution of YTA classes in germline and somatic TP53 variant datasets
The occurrence of TP53 variants assigned to YTA classes was assessed in different databases: tumor-based variants in the Cosmic database v97 (https://cancer.sanger.ac.uk/cosmic),26 normal sample-based variants in the gnomAD database v3.1.2 (https://gnomad.broadinstitute.org),27 and TP53 germline variants database R20 released in July 2019 and hosted at the NCI (https://tp53.cancer.gov/).15 We used the protein mutation information in the databases to analyze the distribution of variants into YTA classes. Pie charts are used to show distribution of variant classes in the different databases, and numerical counts are indicated (R, ggplot2 package).
Genotype-phenotype correlations
Lifetime cancer accrual for the YTA classes was assessed using the age of first cancer onset or the cancer-free age of an individual. Patients without age indication were not considered for this analysis. The age of median cancer accrual (and confidence intervals at 95%) was extracted and a Log Rank Mantel-Cox test was run to assess the significance of differences between groups. For multiple pairwise comparisons, a correction was applied to extract an adjusted p-value (Bonferroni method). These analyses were performed using R and the survival and survminer packages. Information about individuals’ sex was retrieved in the corresponding column “Sex”. The proportion of individuals with multiple cancers versus individuals with one cancer was assessed for each YTA class. The proportion of cancer-free individuals compared to individuals with cancer was assessed for each class. Tumor distribution was determined in the YTA classes by analyzing all tumors described in the dataset (primary and secondary malignancies). We used information about cancer organs and subtypes available in the LF spectrum database (columns “Topography” and “Morphology”), and we consolidated groups based on organs of interest for the study of LFS (adrenal gland, brain, bone, soft tissue, breast, hematopoietic system, and the mix of all other organs) as well as specific cancer types (ACC, OS, CPT, MB, glioblastoma, phyllodes tumors, and RMS). Graphical representation of proportions of tumor types was performed using R (package ggplot2). The distribution of tumor topologies was compared between YTA classes by using logistic model based on Khi2 statistic (multiple pairwise comparison) to calculate a risk ratio (RR), confidence intervals at 95% (CI 95% low and CI 95% high) and adjusted p-value (correction for multiple comparisons by Benjamini-Hochberg method at 5% FDR level) using R software. Mapping of age-specific tumor distribution within YTA classes was assessed by generating rain-cloud plots (R, package ggplot2). Finally, the relationship between YTA classes and the clinical definitions of LFS was evaluated using the LFS spectrum classification5 and the column “Class” from the IARC/NCI database, to build bar-plots of proportions of individuals within each clinical class.
Quantification and statistical analysis
Statistical analyses were performed with the software R. Details on statistical tests, adjustments and specific packages used for data presentation are given in each Methods section and in Figure legends.
Published: November 1, 2024
Footnotes
Supplemental information can be found online at https://doi.org/10.1016/j.isci.2024.111296.
Supplemental information
Excel file containing additional data too large to fit in a PDF. Variants are listed together with their YTA classes (classes A, B, C, D), SMS clusters (G1, G2, G3), and relevant computational and functional annotations. The key for each column of the table is given in the second tab of the Excel table
Excel file containing additional data too large to fit in a PDF. The table shows pairwise comparisons between each YTA class across common cancers of the LF spectrum in the form of risk ratio (RR) with 95% confidence intervals (CI 95% low and CI 95% high) based on a Khi-2 model with adjusted p value (correction for multiple comparisons by Benjamini-Hochberg method at 5% FDR level). Shaded highlights correspond to pairwise comparisons that reached adjusted p value <0.05
References
- 1.Bougeard G., Renaux-Petel M., Flaman J.-M., Charbonnier C., Fermey P., Belotti M., Gauthier-Villars M., Stoppa-Lyonnet D., Consolino E., Brugières L., et al. Revisiting Li-Fraumeni Syndrome From TP53 Mutation Carriers. J. Clin. Oncol. 2015;33:2345–2352. doi: 10.1200/JCO.2014.59.5728. [DOI] [PubMed] [Google Scholar]
- 2.Amadou A., Achatz M.I.W., Hainaut P. Revisiting tumor patterns and penetrance in germline TP53 mutation carriers: temporal phases of Li-Fraumeni syndrome. Curr. Opin. Oncol. 2018;30:23–29. doi: 10.1097/CCO.0000000000000423. [DOI] [PubMed] [Google Scholar]
- 3.Li F.P., Fraumeni J.F., Mulvihill J.J., Blattner W.A., Dreyfus M.G., Tucker M.A., Miller R.W. A cancer family syndrome in twenty-four kindreds. Cancer Res. 1988;48:5358–5362. [PubMed] [Google Scholar]
- 4.Frebourg T., Bajalica Lagercrantz S., Oliveira C., Magenheim R., Evans D.G., European Reference Network GENTURIS Guidelines for the Li-Fraumeni and heritable TP53-related cancer syndromes. Eur. J. Hum. Genet. 2020;28:1379–1386. doi: 10.1038/s41431-020-0638-4. [DOI] [PMC free article] [PubMed] [Google Scholar]
- 5.Kratz C.P., Freycon C., Maxwell K.N., Nichols K.E., Schiffman J.D., Evans D.G., Achatz M.I., Savage S.A., Weitzel J.N., Garber J.E., et al. Analysis of the Li-Fraumeni Spectrum Based on an International Germline TP53 Variant Data Set: An International Agency for Research on Cancer TP53 Database Analysis. JAMA Oncol. 2021;7:1800–1805. doi: 10.1001/jamaoncol.2021.4398. [DOI] [PMC free article] [PubMed] [Google Scholar]
- 6.Kastenhuber E.R., Lowe S.W. Putting p53 in Context. Cell. 2017;170:1062–1078. doi: 10.1016/j.cell.2017.08.028. [DOI] [PMC free article] [PubMed] [Google Scholar]
- 7.Kruiswijk F., Labuschagne C.F., Vousden K.H. p53 in survival, death and metabolic health: a lifeguard with a licence to kill. Nat. Rev. Mol. Cell Biol. 2015;16:393–405. doi: 10.1038/nrm4007. [DOI] [PubMed] [Google Scholar]
- 8.Levine A.J. p53: 800 million years of evolution and 40 years of discovery. Nat. Rev. Cancer. 2020;20:471–480. doi: 10.1038/s41568-020-0262-1. [DOI] [PubMed] [Google Scholar]
- 9.Hainaut P., Pfeifer G.P. Somatic TP53 Mutations in the Era of Genome Sequencing. Cold Spring Harb. Perspect. Med. 2016;6 doi: 10.1101/cshperspect.a026179. [DOI] [PMC free article] [PubMed] [Google Scholar]
- 10.Stein Y., Aloni-Grinstein R., Rotter V. Mutant p53 oncogenicity: dominant-negative or gain-of-function? Carcinogenesis. 2020;41:1635–1647. doi: 10.1093/carcin/bgaa117. [DOI] [PubMed] [Google Scholar]
- 11.Giacomelli A.O., Yang X., Lintner R.E., McFarland J.M., Duby M., Kim J., Howard T.P., Takeda D.Y., Ly S.H., Kim E., et al. Mutational processes shape the landscape of TP53 mutations in human cancer. Nat. Genet. 2018;50:1381–1387. doi: 10.1038/s41588-018-0204-y. [DOI] [PMC free article] [PubMed] [Google Scholar]
- 12.Kato S., Han S.-Y., Liu W., Otsuka K., Shibata H., Kanamaru R., Ishioka C. Understanding the function-structure and function-mutation relationships of p53 tumor suppressor protein by high-resolution missense mutation analysis. Proc. Natl. Acad. Sci. USA. 2003;100:8424–8429. doi: 10.1073/pnas.1431692100. [DOI] [PMC free article] [PubMed] [Google Scholar]
- 13.Kotler E., Shani O., Goldfeld G., Lotan-Pompan M., Tarcic O., Gershoni A., Hopf T.A., Marks D.S., Oren M., Segal E. A Systematic p53 Mutation Library Links Differential Functional Impact to Cancer Mutation Pattern and Evolutionary Conservation. Mol. Cell. 2018;71:178–190.e8. doi: 10.1016/j.molcel.2018.06.012. [DOI] [PubMed] [Google Scholar]
- 14.Fortuno C., Lee K., Olivier M., Pesaran T., Mai P.L., de Andrade K.C., Attardi L.D., Crowley S., Evans D.G., Feng B.-J., et al. Specifications of the ACMG/AMP variant interpretation guidelines for germline TP53 variants. Hum. Mutat. 2021;42:223–236. doi: 10.1002/humu.24152. [DOI] [PMC free article] [PubMed] [Google Scholar]
- 15.de Andrade K.C., Lee E.E., Tookmanian E.M., Kesserwan C.A., Manfredi J.J., Hatton J.N., Loukissas J.K., Zavadil J., Zhou L., Olivier M., et al. The TP53 Database: transition from the International Agency for Research on Cancer to the US National Cancer Institute. Cell Death Differ. 2022;29:1071–1073. doi: 10.1038/s41418-022-00976-3. [DOI] [PMC free article] [PubMed] [Google Scholar]
- 16.Mathe E., Olivier M., Kato S., Ishioka C., Hainaut P., Tavtigian S.V. Computational approaches for predicting the biological effect of p53 missense mutations: a comparison of three sequence analysis based methods. Nucleic Acids Res. 2006;34:1317–1325. doi: 10.1093/nar/gkj518. [DOI] [PMC free article] [PubMed] [Google Scholar]
- 17.Ng P.C., Henikoff S. Predicting deleterious amino acid substitutions. Genome Res. 2001;11:863–874. doi: 10.1101/gr.176601. [DOI] [PMC free article] [PubMed] [Google Scholar]
- 18.Ben-Cohen G., Doffe F., Devir M., Leroy B., Soussi T., Rosenberg S. TP53_PROF: a machine learning model to predict impact of missense mutations in TP53. Brief. Bioinform. 2022;23 doi: 10.1093/bib/bbab524. [DOI] [PMC free article] [PubMed] [Google Scholar]
- 19.Yamazaki F., Shima H., Osumi T., Narumi S., Kuroda T., Shimada H. Nodular Lymphocyte-predominant Hodgkin Lymphoma in a 15-Year-Old Boy With Li-Fraumeni Syndrome Having a Germline TP53 D49H Mutation. J. Pediatr. Hematol. Oncol. 2018;40:e195–e197. doi: 10.1097/MPH.0000000000000948. [DOI] [PubMed] [Google Scholar]
- 20.Achatz M.I.W., Olivier M., Le Calvez F., Martel-Planche G., Lopes A., Rossi B.M., Ashton-Prolla P., Giugliani R., Palmero E.I., Vargas F.R., et al. The TP53 mutation, R337H, is associated with Li-Fraumeni and Li-Fraumeni-like syndromes in Brazilian families. Cancer Lett. 2007;245:96–102. doi: 10.1016/j.canlet.2005.12.039. [DOI] [PubMed] [Google Scholar]
- 21.Indeglia A., Leung J.C., Miller S.A., Leu J.I.-J., Dougherty J.F., Clarke N.L., Kirven N.A., Shao C., Ke L., Lovell S., et al. An African-Specific Variant of TP53 Reveals PADI4 as a Regulator of p53-Mediated Tumor Suppression. Cancer Discov. 2023;13:1696–1719. doi: 10.1158/2159-8290.CD-22-1315. [DOI] [PMC free article] [PubMed] [Google Scholar]
- 22.Pinto E.M., Figueiredo B.C., Chen W., Galvao H.C.R., Formiga M.N., Fragoso M.C.B.V., Ashton-Prolla P., Ribeiro E.M.S.F., Felix G., Costa T.E.B., et al. XAF1 as a modifier of p53 function and cancer susceptibility. Sci. Adv. 2020;6 doi: 10.1126/sciadv.aba3231. [DOI] [PMC free article] [PubMed] [Google Scholar]
- 23.Subasri V., Light N., Kanwar N., Brzezinski J., Luo P., Hansford J.R., Cairney E., Portwine C., Elser C., Finlay J.L., et al. Multiple Germline Events Contribute to Cancer Development in Patients with Li-Fraumeni Syndrome. Cancer Res. Commun. 2023;3:738–754. doi: 10.1158/2767-9764.CRC-22-0402. [DOI] [PMC free article] [PubMed] [Google Scholar]
- 24.Penkert J., Strüwe F.J., Dutzmann C.M., Doergeloh B.B., Montellier E., Freycon C., Keymling M., Schlemmer H.-P., Sänger B., Hoffmann B., et al. Genotype-phenotype associations within the Li-Fraumeni spectrum: a report from the German Registry. J. Hematol. Oncol. 2022;15:107. doi: 10.1186/s13045-022-01332-1. [DOI] [PMC free article] [PubMed] [Google Scholar]
- 25.Landrum M.J., Lee J.M., Benson M., Brown G., Chao C., Chitipiralla S., Gu B., Hart J., Hoffman D., Hoover J., et al. ClinVar: public archive of interpretations of clinically relevant variants. Nucleic Acids Res. 2016;44:D862–D868. doi: 10.1093/nar/gkv1222. [DOI] [PMC free article] [PubMed] [Google Scholar]
- 26.Tate J.G., Bamford S., Jubb H.C., Sondka Z., Beare D.M., Bindal N., Boutselakis H., Cole C.G., Creatore C., Dawson E., et al. COSMIC: the Catalogue Of Somatic Mutations In Cancer. Nucleic Acids Res. 2019;47:D941–D947. doi: 10.1093/nar/gky1015. [DOI] [PMC free article] [PubMed] [Google Scholar]
- 27.Gudmundsson S., Singer-Berk M., Watts N.A., Phu W., Goodrich J.K., Solomonson M., Rehm H.L., MacArthur D.G., O’Donnell-Luria A., Genome Aggregation Database Consortium Variant interpretation using population databases: Lessons from gnomAD. Hum. Mutat. 2022;43:1012–1030. doi: 10.1002/humu.24309. [DOI] [PMC free article] [PubMed] [Google Scholar]
- 28.Pettersen E.F., Goddard T.D., Huang C.C., Meng E.C., Couch G.S., Croll T.I., Morris J.H., Ferrin T.E. UCSF ChimeraX: Structure visualization for researchers, educators, and developers. Protein Sci. 2021;30:70–82. doi: 10.1002/pro.3943. [DOI] [PMC free article] [PubMed] [Google Scholar]
- 29.Chen Y., Dey R., Chen L. Crystal Structure of the p53 Core Domain Bound to a Full Consensus Site as a Self-Assembled Tetramer. Structure. 2010;18:246–256. doi: 10.1016/j.str.2009.11.011. [DOI] [PMC free article] [PubMed] [Google Scholar]
- 30.Jeffrey P.D., Gorina S., Pavletich N.P. Crystal structure of the tetramerization domain of the p53 tumor suppressor at 1.7 angstroms. Science. 1995;267:1498–1502. doi: 10.1126/science.7878469. [DOI] [PubMed] [Google Scholar]
- 31.Jumper J., Evans R., Pritzel A., Green T., Figurnov M., Ronneberger O., Tunyasuvunakool K., Bates R., Žídek A., Potapenko A., et al. Highly accurate protein structure prediction with AlphaFold. Nature. 2021;596:583–589. doi: 10.1038/s41586-021-03819-2. [DOI] [PMC free article] [PubMed] [Google Scholar]
Associated Data
This section collects any data citations, data availability statements, or supplementary materials included in this article.
Supplementary Materials
Excel file containing additional data too large to fit in a PDF. Variants are listed together with their YTA classes (classes A, B, C, D), SMS clusters (G1, G2, G3), and relevant computational and functional annotations. The key for each column of the table is given in the second tab of the Excel table
Excel file containing additional data too large to fit in a PDF. The table shows pairwise comparisons between each YTA class across common cancers of the LF spectrum in the form of risk ratio (RR) with 95% confidence intervals (CI 95% low and CI 95% high) based on a Khi-2 model with adjusted p value (correction for multiple comparisons by Benjamini-Hochberg method at 5% FDR level). Shaded highlights correspond to pairwise comparisons that reached adjusted p value <0.05
Data Availability Statement
-
•
This paper analyzes existing, publicly available data. The references for the datasets are listed in the key resources table of the STAR Methods. Newly generated data consisting of TP53 variants classification into classes based on clustering approach are publicly available as a table in supplementary information (Table S1).
-
•
The code used for performing iterative clustering of TP53 variants based on YTA, in order to generate the YTA clusters, is available in supplemental data (Data S1 file).
-
•
Any additional information required to reanalyze the data reported in this paper is available from the lead contact upon request.