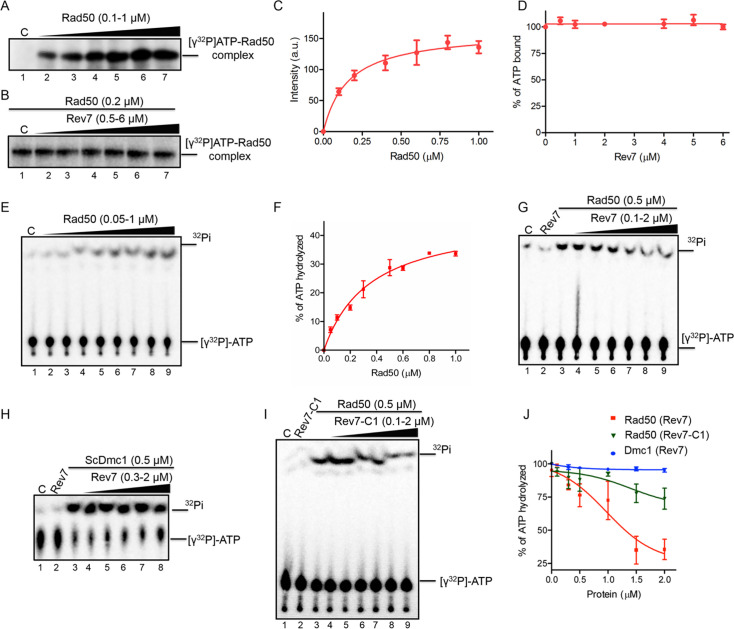
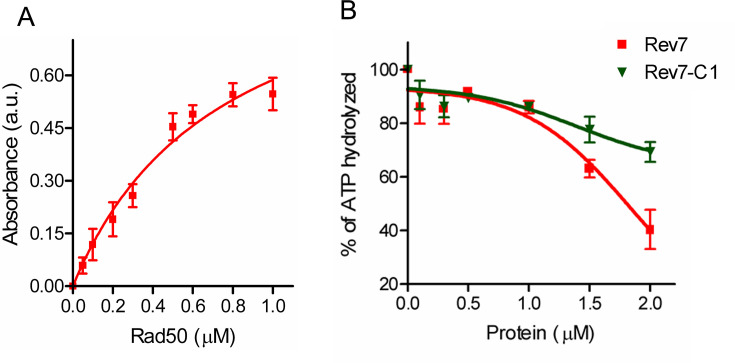
Figure 6. Rev7 inhibits the ATPase activity of Rad50 without impacting its ability to bind ATP.
(A) Rad50 binds [γ-32P]ATP in a dose-dependent manner. Lane 1, no protein. Lanes 2–7, reactions were performed with 0.1, 0.2, 0.4, 0.6, 0.8, and 1 µM of Rad50 and 400 pmol[γ-32P]ATP. (B) ScRev7 does not affect the ability of Rad50 to bind ATP. Lane 1, Rad50 and 400 pmol[γ-32P]ATP. Lanes 2–7, same as in lane 1, but with 0.5, 1, 2, 4, 5, and 6 µM of ScRev7, respectively. (C) Quantification of ATP binding by Rad50 as a function of its concentration. (D) Quantification of the effect of ScRev7 on ATP binding by Rad50. (E) ATPase activity of Rad50 as a function of its concentration. Reactions were performed in the absence (lane 1) or presence (lanes 2–9) of 0.05, 0.1, 0.2, 0.3, 0.5, 0.6, 0.8, and 1 µM of Rad50, respectively. (F) Quantification of Rad50 ATPase activity as a function of its concentration. (G) ScRev7 abrogates ATP hydrolysis catalyzed by Rad50. (H) ScRev7 does not impact the ability of ScDmc1 to hydrolyze ATP. Lane 1 contained 400 pmol [γ-32P]ATP; lane 2, same as in lane 1, but with 2 µM of ScRev7; lane 3, as in lane 1, but with 0.5 µM of ScDmc1; lanes 4–8, as in lane 3, but with 0.3, 0.5, 1, 1.5, and 2 µM ScRev7, respectively. (I) ScRev7-C1 variant impedes ATP hydrolysis catalyzed by Rad50. In panels (G) and (I), lane 1 contained 400 pmol [γ-32P]ATP; lane 2, same as in lane 1, but 2 µM ScRev7/ScRev7-C1 variant; lane 3, as in lane 1, but with 0.5 µM Rad50; lanes 4–9, as in lane 3, but with 0.1, 0.3, 0.5, 1, 1.5, and 2 µM ScRev7/ScRev7-C1 variant, respectively. (J) Quantification of the inhibitory effect of ScRev7/ScRev7-C1 on ATP hydrolysis catalyzed by Rad50 or ScDmc1. The closed triangles on the top of gel images in panels (A), (B), (E), (G), (H), and (I) represent increasing concentrations of Rad50, ScRev7, or ScRev7-C1. Error bars indicate SEM, and data are representative of three independent experiments.


