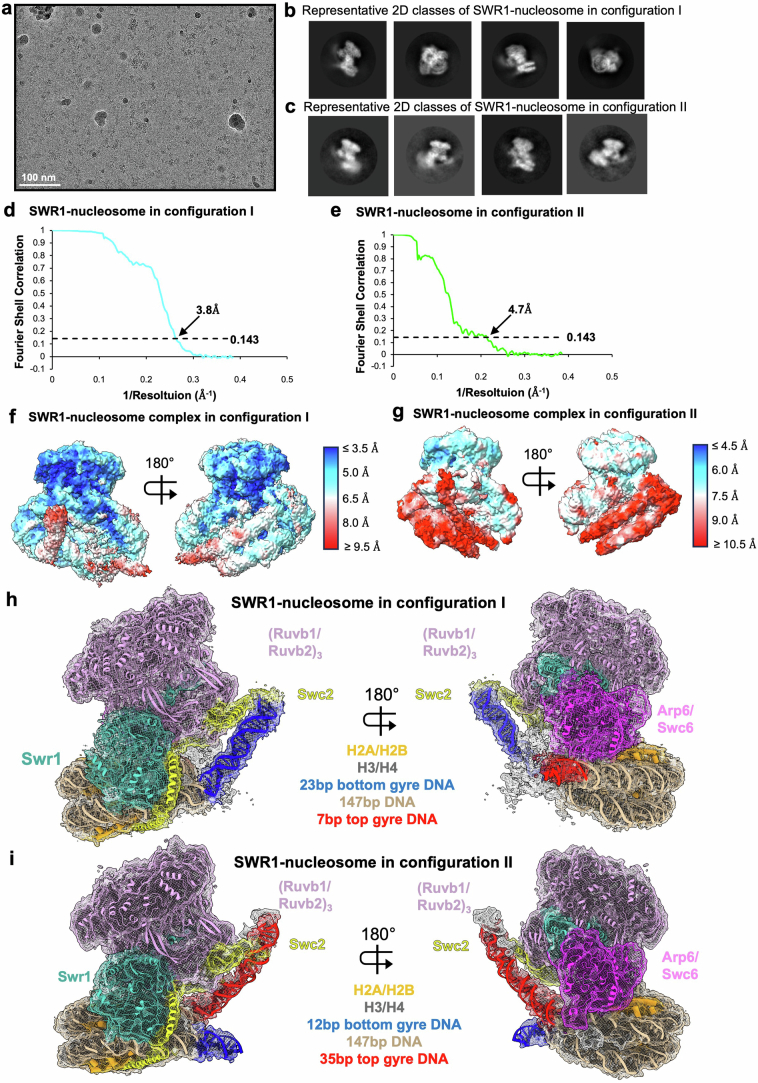
Extended Data Fig. 7. Cryo-EM analysis of the SWR1–nucleosome in configuration I (3.8 Å) and SWR1–nucleosome in configuration II (4.7 Å) volumes.
a, Representative micrograph out of 35,076 micrographs from the SWR1–nucleosome dataset. A scale bar is shown at the bottom left. b, Four representative 2D classes of SWR1–nucleosome complex in configuration I. c, Four representative 2D classes of SWR1–nucleosome complex in configuration II. d, gFSC curve of the SWR1–nucleosome in configuration I volume. e, gFSC curve of the SWR1–nucleosome configuration II volume. f, Local resolution of the SWR1–nucleosome complex in configuration I. g, Local resolution of SWR1–nucleosome in configuration II. h, Overview of the SWR1–nucleosome complex in configuration I at 3.8 Å. i, Overview of the SWR1–nucleosome complex in configuration II at 4.7 Å.

