Abstract
Cancer driver mutations often show distinct temporal acquisition patterns, but the biological basis for this, if any, remains unknown. RAS mutations occur invariably late in the course of acute myeloid leukaemia, upon progression or relapsed/refractory disease1–6. Here, by using human leukaemogenesis models, we first show that RAS mutations are obligatory late events that need to succeed earlier cooperating mutations. We provide the mechanistic explanation for this in a requirement for mutant RAS to specifically transform committed progenitors of the myelomonocytic lineage (granulocyte–monocyte progenitors) harbouring previously acquired driver mutations, showing that advanced leukaemic clones can originate from a different cell type in the haematopoietic hierarchy than ancestral clones. Furthermore, we demonstrate that RAS-mutant leukaemia stem cells (LSCs) give rise to monocytic disease, as observed frequently in patients with poor responses to treatment with the BCL2 inhibitor venetoclax. We show that this is because RAS-mutant LSCs, in contrast to RAS-wild-type LSCs, have altered BCL2 family gene expression and are resistant to venetoclax, driving clinical resistance and relapse with monocytic features. Our findings demonstrate that a specific genetic driver shapes the non-genetic cellular hierarchy of acute myeloid leukaemia by imposing a specific LSC target cell restriction and critically affects therapeutic outcomes in patients.
Subject terms: Cancer, Stem cells
We find that RAS-mutant leukaemia stem cells are resistant to venetoclax, driving clinical resistance and relapse with monocytic features.
Main
The co-occurrence and relative timing of acquisition of driver mutations in cancers follow non-random patterns, but the biological basis for this and its effect on clinical outcomes remain unexplained7,8. RAS is among the most frequently mutated oncogenes across all cancers9. In contrast to their occurrence as truncal initiating mutations during epithelial carcinogenesis, RAS mutations (RASmut, most frequently in the NRAS or KRAS genes) are always acquired late in the course of acute myeloid leukaemia (AML), presenting as subclonal mutations upon refractory or relapsed disease or upon progression of an antecedent myelodysplastic syndrome1–6.
AML is an aggressive blood malignancy that can be driven by a variety of genetic lesions and originates from haematopoietic stem and progenitor cells (HSPCs). Although leukaemic cells are unable to differentiate normally, leukaemias retain some semblance of normal hematopoietic development, forming cellular hierarchies with leukaemia stem cells (LSCs) residing on the apex10,11. Different hierarchies result in leukaemias with a predominant immature stem cell phenotype or more mature myeloid features12–14. Associations between specific hierarchical organizations and AML genetics, as well as drug responses and disease relapse, have been described14 and stem cell signatures have been associated with poor outcomes after therapy15. However, how these hierarchies are determined and the mechanisms by which they affect clinical outcomes remain obscure.
The BH3-mimetic drug venetoclax (VEN) is a recently US Food and Drug Administration (FDA)-approved therapeutic agent for the treatment of AML. VEN is a selective inhibitor of BCL2 and has now become the standard of care, in combination therapies, for patients with AML who are older or unfit to receive intensive chemotherapy16–18. Nevertheless, 20–30% of patients are refractory to VEN-based combination regimens, and more than 40% of those responding ultimately relapse17,19–21. An association between poor outcomes to VEN and AML with mature myelomonocytic immunophenotypic features was reported and attributed to an intrinsic resistance to VEN conferred by the monocytic maturation state22–24. However, this association was not found consistently in other studies25,26. Associations between VEN resistance and RAS pathway mutations have also been reported24,25.
Here, through synthetic leukaemogenesis studies using CRISPR–Cas9-mediated gene editing in human induced pluripotent stem (iPS) cells and primary HSPCs, we show that N/KRAS mutations occur late in AML pathogenesis because mutant RAS transforms granulocyte–monocyte progenitor cells (GMPs) with pre-existing oncogenic mutations. Through single-cell transcriptomics and multi-omics in iPS-cell-derived xenografts and primary AML cells, we show that RAS-mutant (MT) GMP-type LSCs preferentially generate monocytic leukaemic cells and are resistant to VEN, and that it is this resistance of the RAS-MT LSCs, rather than the differentiation state of the LSCs or that of their progeny, that drives clinical relapse and resistance to VEN-containing therapies. This is a new paradigm whereby a specific oncogenic driver targets a specific cell type for transformation into an LSC with altered sensitivity to targeted therapies, with profound effect on therapeutic outcomes.
RASmut is insufficient for leukaemogenesis
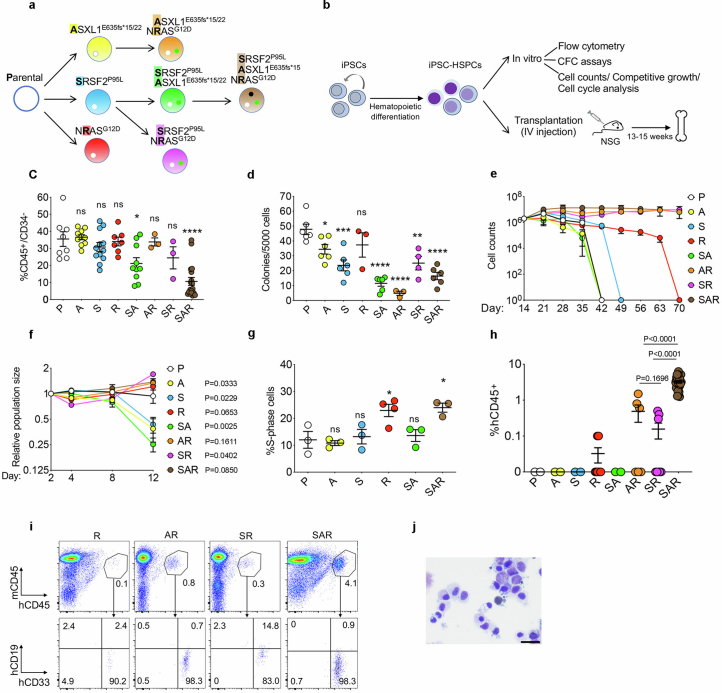
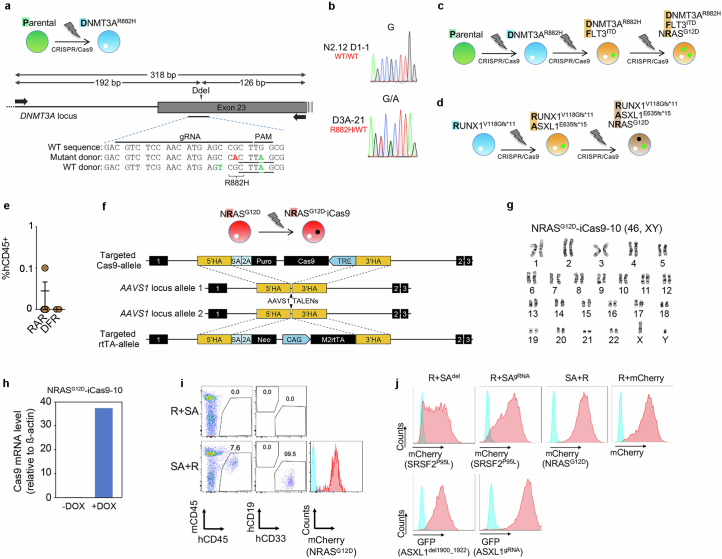
To interrogate the contribution of the prototypical AML RAS pathway mutation, NRASG12D, to leukaemogenesis, we generated a set of isogenic iPS cell lines with single, double and triple mutations through CRISPR–Cas9-mediated gene editing (Extended Data Fig. 1a). The NRAS mutation (R) increased cell proliferation and cycling of iPS-cell-derived HSPCs (iPS-HSPCs) in vitro (Extended Data Fig. 1b–g). Conversely, ASXL1 (A) and SRSF2P95L (S) mutations impaired differentiation without affecting proliferation. The triple-mutant SRSF2P95L/ASXL1/NRASG12D (SAR) iPS-HSPCs were consistently engraftable in transplantation assays at levels greater than 1%, generating immature blast-like myeloid cells, consistent with an AML, as previously shown27 (Extended Data Fig. 1h–j and Supplementary Table 1). By contrast, single NRASG12D iPS-HSPCs showed non-detectable or infrequent minimal (0.1%) engraftment and double mutant iPS-HSPCs had engraftment levels of generally less than 1% (Extended Data Fig. 1h–j). Other engineered iPS cell lines with NRASG12D mutation and other co-mutations also showed absent or occasional minimal (0.1%) engraftment (Extended Data Fig. 2a–e). As haematopoietic cells derived from normal iPS cells are non-transplantable, this lack of engraftment is reflective of a non-transformed state and absence of leukaemia-initiating potential28.
Extended Data Fig. 1. Characterization of in vitro and in vivo leukemic properties of edited iPS-HSPCs with single, double and triple mutations.
a, Isogenic single, double and triple-mutant iPS cell lines generated through sequential CRISPRCas9-mediated gene editing of a normal iPS cell line (Parental). b, Overview of in vitro and in vivo phenotypic assessment of iPS-HSPCs. c, Fraction of CD34−/CD45+ cells, i.e. hematopoietic cells that have lost CD34 expression upon maturation, on day 14 of hematopoietic differentiation. Mean and SEM from n = 8(P), 10(A, SA), 12(S), 7(R), 3(AR, SR), and 19(SAR) independent differentiation experiments with 2 (A, S, SA, AR, SR, SAR) or 3(R) iPS cell lines per genotype are shown. *P < 0.05, ****P < 0.001, ns: not significant (two-tailed unpaired t test). d, Number of methylcellulose colonies obtained from iPS-HSPCs on day 14 of hematopoietic differentiation. Mean and SEM from n = 6(P, A, S, SA, SAR), 3 (R, AR) and 4(SR) independent differentiation experiments with 2 iPS cell lines per genotype are shown. *P < 0.05, **P < 0.01, ***P < 0.001, ****P < 0.0001, ns: not significant (two-tailed unpaired t test). e, Cell counts of iPS-HSPCs in liquid hematopoietic differentiation culture. Mean and SEM of n = 2(P, R, AR, SR), 4(A, SAR), 6(S) and 11(SA) independent differentiation experiments with 1 (P, R, SAR) or 2 (A, S, AR, SR, SA) iPS cell lines per genotype are shown. f, Competitive growth assay. The cells were mixed 1:1 at the onset of hematopoietic differentiation with an isogenic normal iPS cell line stably expressing GFP. The relative population size was estimated as the percentage of GFP- cells (calculated by flow cytometry) at each time point relative to the population size on day 2. Mean and SEM from n = 3(P), 4(A), 6(S, R), 5(SA), 2(AR,SR) and 8(SAR) independent differentiation experiments with 2 (P, A, R, SA, AR, SR, SAR) or 3 (S) iPS cell lines per genotype are shown. P values were calculated with a two-tailed unpaired t test. g, Cell cycle analyses of iPS-HSPCs. Mean and SEM from 3 (P, A, S, SA, SAR) and 4 (R) independent differentiation experiments with one line per genotype are shown. *P < 0.05 (R vs P: P = 0.0336; SAR vs P: P = 0.0279), ns: not significant (two-tailed unpaired t test). h, Human engraftment in the BM of NSG mice 13-15 weeks after transplantation with HSPCs derived from the indicated gene-edited mutant iPS cell lines (1 or 2 lines per genotype). Error bars show mean and SEM of values from individual mice. n = 2 (P); 2(A); 2(S); 8(R); 2(SA); 6(AR); 8(SR); 27(SAR). P values were calculated with a two-tailed unpaired t test. i, Representative flow cytometry for evaluation of human engraftment in mouse BM. j, Wright-Giemsa-stained BM cells retrieved from a mouse transplanted with SAR iPS-HSPCs. Scale bar, 25 μm. P: Parental; A: ASXL1-mutant; S: SRSF2-mutant; R: NRAS-mutant; SA: SRSF2-ASXL1 double mutant; AR: ASXL1-NRAS- double mutant; SR: SRSF2-NRAS double mutant; SAR: SRSF2-ASXL1-NRAS triple mutant.
Extended Data Fig. 2. Generation and characterization of additional edited iPS cell lines.
a, Gene editing strategy to generate a heterozygous DNMT3AR882H mutation in the same normal parental iPS cell line used to generate the lines shown in Extended Data Fig. 1, through homology-directed repair with simultaneous delivery of one mutant and one WT donor templates. Schematic representation of the DNMT3A locus with the position of the gRNA target sequence and the PCR primers used for RFLP analysis shown. Silent mutations introduced in the donor to create the DdeI restriction site (underlined) and inactivate the PAM motif are indicated in green font. The G→A mutation giving rise to the R882H amino acid substitution is shown in red font. b, Sanger sequencing confirming the G→A heterozygous point mutation giving rise to the R882H amino acid substitution in one edited DNMT3AR882H iPS cell line selected after screening. c,d, Schematic of gene editing steps to generate the iPS cell lines with single, double and triple driver mutations starting from the parental WT (c) or an iPS cell line derived from a RUNX1- familial platelet disorder (FPD) patient harboring a germline RUNX1V118Gfs*11 mutation (d). e, Human engraftment in the BM of NSG mice 13-15 weeks after transplantation with gene-edited iPS-HSPCs. Mean and SEM is shown. RAR: RUNX1-ASXL1-NRAS triple mutant (n = 5 mice); DFR: DNMT3A-FLT3-NRAS triple mutant (n = 2 mice). f, Gene targeting strategy used to introduce a tetracycline response element (TRE)-driven Cas9 and the reverse tetracycline transactivator (rtTA), respectively, into the two alleles of the AAVS1 locus using TALEN-mediating targeting. g, Karyotype of iPS cell line NRASG12D-iCas9-10 confirming a normal diploid karyotype. h, Confirmation of induction of iCas9 expression by DOX in the NRASG12D-iCas9-10 iPS cells by qRT-PCR. i, Representative flow cytometric evaluation of engraftment in mice transplanted with the iPS-HSPCs shown in Fig. 1a,b. j, Representative flow cytometric evaluation of transduction efficiency of iPS-HSPCs with the lentiviral constructs shown in Fig. 1a, co-expressing the indicated fluorescent protein genes.
Collectively, these results indicate that the NRASG12D mutation alone cannot induce leukaemic features, and that it can only do so in cooperation with certain, but not other, co-mutations.
RASmut are obligatory late events in AML
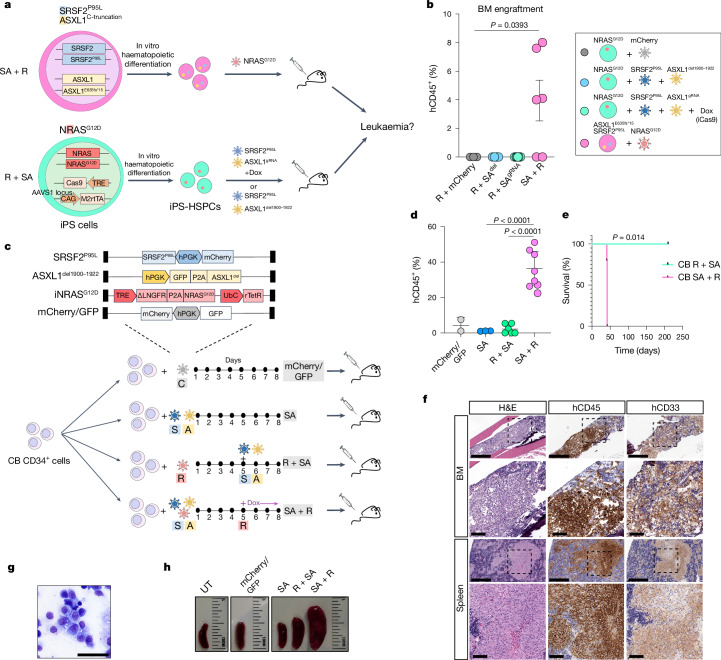
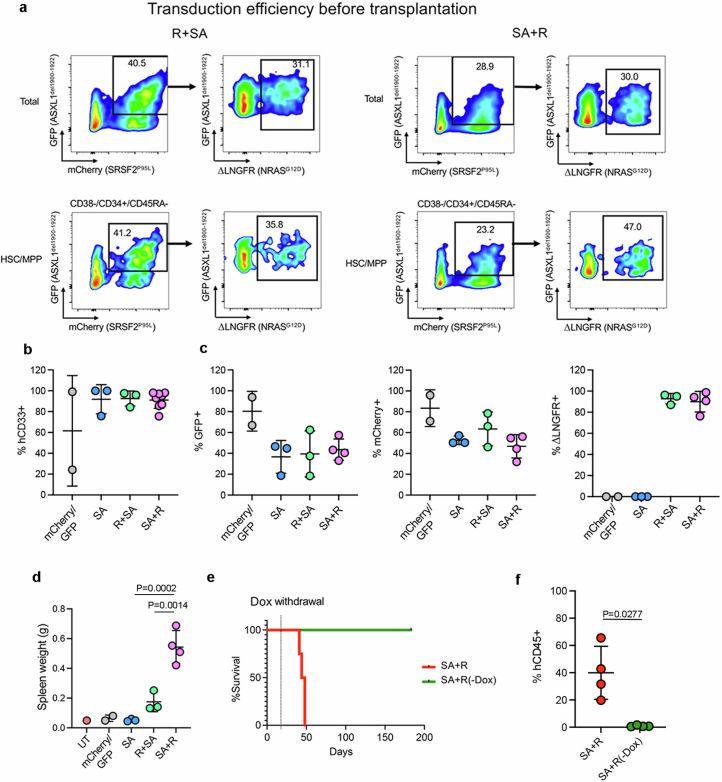
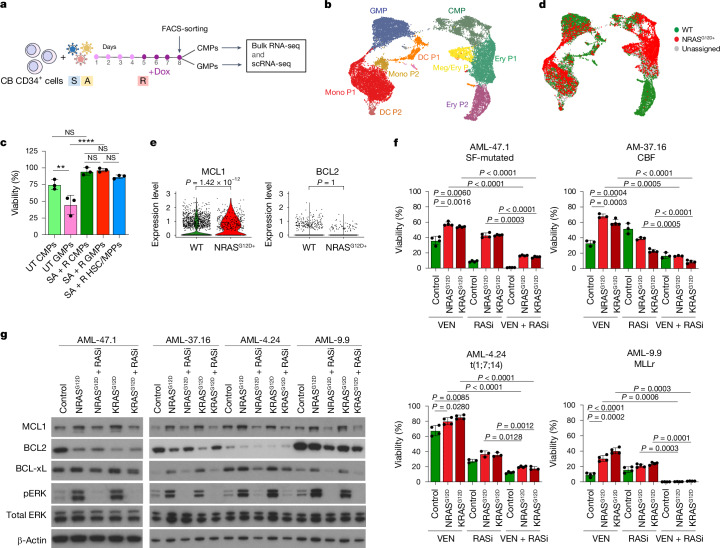
To next test the effects of mutational order in the triple-mutant SAR model, we developed models to temporally control the acquisition of the NRASG12D mutation, before or after the SRSF2 and ASXL1 mutations in iPS-HSPCs (R + SA or SA + R, respectively; Fig. 1a and Extended Data Fig. 2f–h). In all cases, NRASG12D did not generate engraftable cells as the initiating mutation, but only when acquired in iPS-HSPCs with SRSF2 and ASXL1 mutations (Fig. 1b and Extended Data Fig. 2i,j). We corroborated these findings in primary human HSPCs, using a lentiviral strategy to induce NRASG12D with doxycycline (Dox) either before or after transduction with mutant SRSF2P95L and ASXL1del1900–1922 in cord blood (CB) CD34+ cells, followed by transplantation (R + SA or SA + R cohorts, respectively; Fig. 1c and Extended Data Fig. 3a). The R + SA group, as well as control groups SA (without NRASG12D) and mCherry/GFP, showed limited or absent engraftment, as expected after prolonged in vitro culture (Fig. 1d). By contrast, all mice transplanted with SA + R CB cells had robust human engraftment and succumbed to a lethal myeloid leukaemia (Fig. 1d–h, Extended Data Fig. 3b–d and Supplementary Table 1). This leukaemia was dependent on the RASmut, as SA + R transplanted mice in which NRASG12D expression was silenced by means of Dox withdrawal remained healthy and without leukaemic human cells in their bone marrow (Extended Data Fig. 3e,f).
Fig. 1. RASmut are obligatory late events in AML and need to be acquired after specific cooperating mutations.
a, iPS cells with heterozygous SRSF2 and ASXL1 (top) or NRAS (bottom) mutations were differentiated into HSPCs and transduced with lentiviral vectors encoding NRASG12D (top) or SRSF2P95L and either a truncated dominant-negative ASXL1 transgene (ASXL1del1900–1922) or a gRNA targeting exon 12 of ASXL1 (bottom) and transplanted intravenously into NSGS mice. b, Human engraftment in the bone marrow of mice 13–15 weeks post-transplantation. Each data point represents one mouse: n = 3 (R + mCherry), 4 (R + SAdel), 8 (R + SAgRNA) and 6 (SA + R) from two experiments. Mean and s.e.m. are shown. P values were calculated with a two-tailed unpaired t-test. c, CB CD34+ cells were transduced with the lentiviral vectors shown at the indicated time intervals of in vitro culture, with Dox added to the culture at the indicated time point to induce NRASG12D expression. The cells were prestimulated for 4 days before and were injected into NSGS mice 7 days after the first transduction. d, Human engraftment in the bone marrow of NSGS mice transplanted with CB CD34+ cells shown in c. P values were calculated with one-way ANOVA; n = 2 (mCherry/GFP), 3 (SA), 6 (R + SA) and 8 (SA + R) mice. Mean and s.d. are shown. e, Survival of mice from c; n = 5 (SA + R) and 3 (R + SA) mice. f, Bone marrow and spleen images from a mouse transplanted with CB SA + R cells representative of at least three experiments. Left, haematoxylin and eosin (H&E) staining. Middle and right, immunohistochemistry for hCD45 (pan-haematopoietic) and hCD33 (myeloid) markers. g, Wright–Giemsa-stained human cells retrieved from the bone marrow of a mouse transplanted with SA + R CB cells. Image representative of at least three independent experiments. h, Representative images of spleens from mice transplanted as shown in c. BM, bone marrow; UT, untransplanted. Scale bars, 500 μm (f, lower magnification panels), 100 μm (f, higher magnification panels), 50 μm (g).
Extended Data Fig. 3. Leukemogenesis in CB CD34+ cells.
a, Transduction efficiency of CB CD34 + R + SA and SA + R cells prior to transplantation (day 8 depicted in Fig. 1c). b, Percentage of CD33+ myeloid cells (of hCD45+ cells) in the BM of mice transplanted with CB CD34+ cells shown in Fig. 1c. Mean and SD of values from individual mice is shown. n = 2 (mCherry/GFP), 3 (SA), 3 (R + SA) and 8 (SA + R) mice. c, Percentage of hCD45+ cells from transplanted mice expressing each lentiviral transgene (based on expression of the linked fluorescent protein). Mean and SD of values from individual mice is shown. n = 2 (mCherry/GFP), 3 (SA), 3 (R + SA) and 4 (SA + R) mice. d, Spleen weight of transplanted mice. n = 2 (mCherry/GFP), 3 (SA), 3 (R + SA) and 4 (SA + R) mice. UT: untransplanted. Mean and SD are shown. P values were calculated with one way ANOVA. e,f, Survival (e) and BM engraftment (f) of mice injected with SA + R CB CD34+ cells under continuous Dox administration or following Dox withdrawal 14 days after transplantation. Mean and SD of values from 4 individual mice per group are shown. P value was calculated with a two-tailed unpaired t test.
These experiments establish that RASmut can promote leukaemogenesis only as a late event following previously acquired cooperating mutations.
RAS-MT AML LSCs originate from GMPs
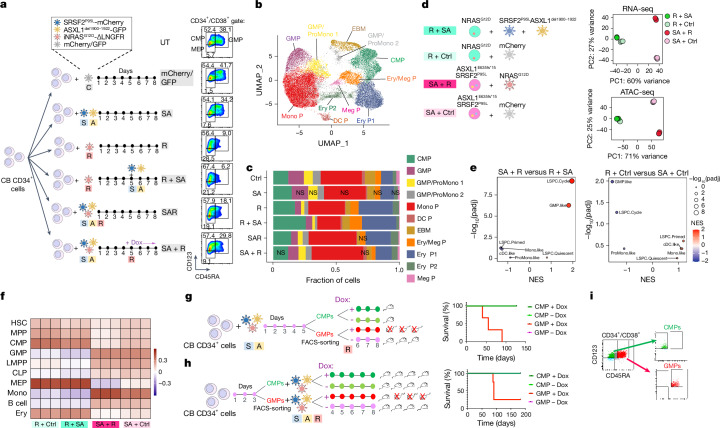
To understand the requirement for NRASG12D to be acquired after the other mutations, we examined the immunophenotypic HSPC populations present in CB HSPCs transduced with R + SA, SA + R, all three mutant genes simultaneously (SAR), SA alone, R alone or with a control empty (mCherry/GFP) vector (Fig. 2a). R, R + SA and SAR cells (that is, all groups transduced with R early, hereafter referred to as ‘R-early’) showed marked reduction of the progenitors committed to the myelomonocytic lineage (GMPs) with concomitant increase of the more immature common myeloid progenitor (CMP) population and megakaryocyte-erythrocyte progenitor (MEP) population (Fig. 2a). By contrast, SA + R cells (R-late) retained the GMP population (Fig. 2a). Single-cell RNA sequencing (scRNA-seq) analyses confirmed decrease of GMPs, with concomitant increase in CMPs and erythroid and megakaryocytic progenitors in all R-early groups (Fig. 2b,c and Supplementary Fig. 1). By contrast, the GMP population was preserved in the SA and SA + R groups (Fig. 2c). These results, which corroborate the immunophenotypic analyses, indicate that acquisition of NRASG12D mutation before, or at the same time as, the other two mutations causes arrest at the CMP stage with loss of the GMP population and failure to induce leukaemia.
Fig. 2. RAS-MT AML LSCs originate from GMPs harbouring pre-existing mutations.
a, Experimental scheme. CB CD34+ cells were transduced with lentiviral vectors as indicated and analysed by flow cytometry (right panels) on the day of transplantation, that is, 7 days after the first transduction (day 8). b, Uniform manifold approximation and projection (UMAP) representation of integrated single-cell transcriptome data from the six groups of cells shown in a, on day 8. c, Stacked barplots showing fraction of cells in each cluster. With the exception of clusters marked as not significant (NS), all other cluster sizes were significantly different from the respective cluster size in the Ctrl (mCherry/GFP) group (logistic regression). d, iPS-HSPCs with NRAS (R) or SRSF2 and ASXL1 mutations (SA) were transduced with lentiviral vectors as indicated. Right panels, principal component analysis of RNA-seq and ATAC-seq data from sorted CD34+CD45+ cells; n = 3 independent experiments for all groups. e, Normalized enrichment scores (NES) and adjusted P values derived from gene set enrichment analysis (GSEA) for gene sets corresponding to the human AML developmental hierarchy from ref. 14 using gene lists ranked by the −log10(Padjusted (padj)) × log2FC from the indicated differential expression comparisons. f, Heatmap showing Pearson correlation values for the ATAC-seq peak normalized read counts in the iPS-HSPC dataset from d and overlapping peaks in primary normal haematopoietic cell subpopulations from ref. 29. g, Experimental scheme (left) and survival (right) of animals transplanted with CMPs and GMPs transduced with SA and sorted prior to induction of R with Dox. n = 1 for each CMP group (±Dox); n = 3 for each GMP group (±Dox). h, Experimental scheme (left) and survival (right) of mice transplanted with CMPs and GMPs sorted prior to SAR transduction. n = 4 for all groups. i, FACS-sorted CMPs and GMPs from g. CLP, common lymphoid progenitor; DC P, dendritic cell progenitor; EBM, eosinophil/basophil/mast cell; Ery/Meg P, erythrocyte/megakaryocyte progenitor; Ery P, erythrocyte progenitor; LMPP, lymphoid-primed MPP; Meg P, megakaryocyte progenitor; Mono, monocyte; Mono P, monocyte progenitor; ProMono, promonocyte.
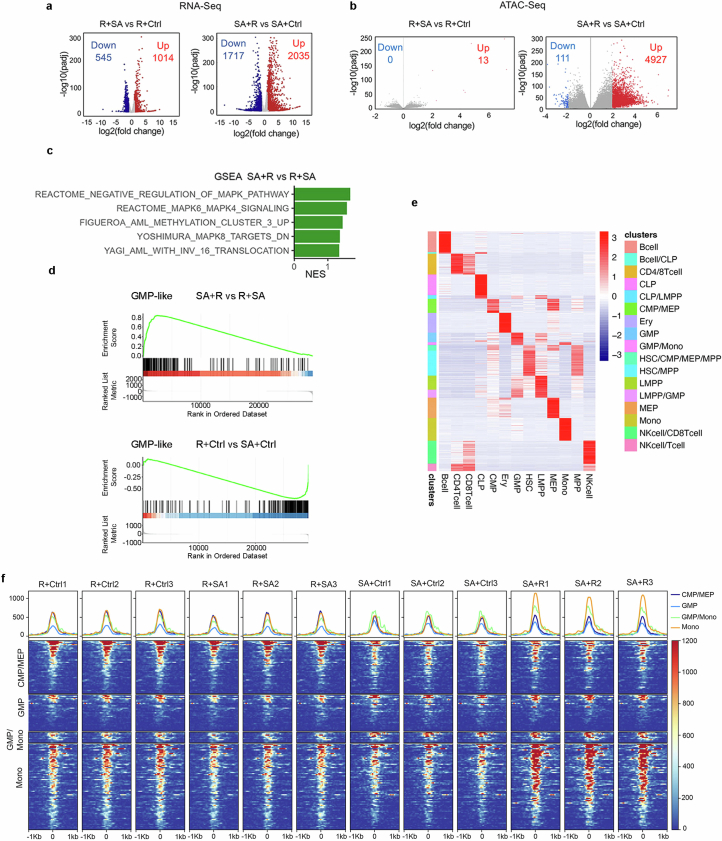
To further compare cellular states between HSPCs acquiring NRASG12D as an early versus late mutation, we performed bulk RNA-seq and assay for transposase-accessible chromatin using sequencing (ATAC-seq) analyses in SA + R versus R + SA iPS-HSPCs (Figs. 1a and 2d). R-early cells (R + SA and R + control (Ctrl); Fig. 2d) were very distinct from those with initial SA mutations in both their transcriptome and chromatin landscape, regardless of subsequent mutational acquisition (Fig. 2d). Acquisition of SA mutations following R resulted in only modest change of cell state, consistent with a maturation arrest by early R in our functional experiments (Fig. 2d and Extended Data Fig. 4a,b; left panels). By contrast, acquisition of R after SA resulted in profound changes (Fig. 2d and Extended Data Fig. 4a,b; right panels). SA + R cells showed enrichment for gene expression signatures of primary human AML (Extended Data Fig. 4c), as well as for GMP-like and leukaemia stem and progenitor cells (LSPC)-cycle signatures derived from primary human AML, which were, conversely, depleted in R-early cells14 (Fig. 2e and Extended Data Fig. 4d). SA + R cells were also more similar to GMPs and monocytes in their accessible chromatin landscape and distal cis-regulatory elements, whereas R-early cells showed higher similarity to primitive cells—haematopoietic stem cell (HSC) or multipotent progenitor (MPP) (HSC/MPP) and CMP—as well as progenitors of the megakaryocytic and erythroid lineage29 (Fig. 2f and Extended Data Fig. 4e,f).
Extended Data Fig. 4. Genomic analyses of iPS-HSPCs.
a,b, Differentially expressed genes (a) and differentially accessible peaks (b) between the indicated iPS-HSPC groups. c, Significantly enriched (GSEA) AML gene sets. NES: Normalized enrichment score. d, Cumulative enrichment scores for a GMP-like signature derived from human primary AML14. e, Cell-type-specific regulatory elements from Corces et al. HSC: hematopoietic stem cell; MPP: multi-potent progenitor; CMP: common myeloid progenitor; GMP: granulocyte-monocyte progenitor; LMPP: lymphoid-primed multipotent progenitor; CLP: common lymphoid progenitor; MEP: megakaryocyte-erythrocyte progenitor; Mono: monocyte; Ery: erythroid cell; NK: natural killer. f, Accessibility (Reads Per Kilobase per Million mapped ATAC reads) of the regulatory elements specific to the indicated cell types (CMP/MEP, GMP, GMP/Mono and Mono) from e. The X axis shows distance from the transcriptional start site.
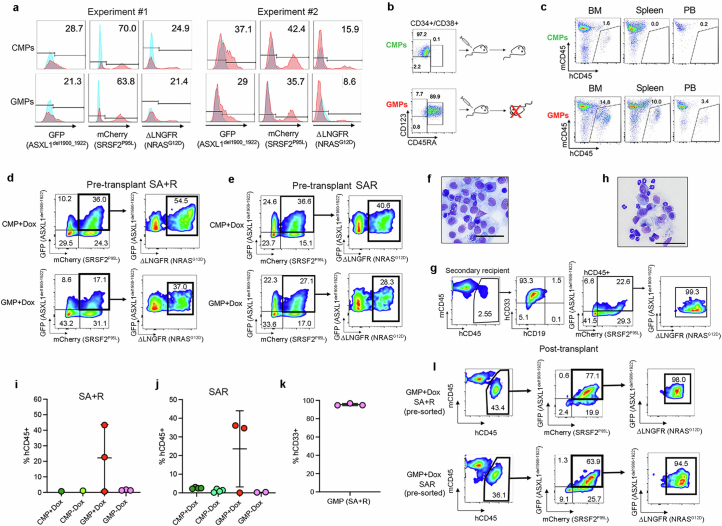
As R + SA cells are immunophenotypically and transcriptionally depleted of GMPs and do not cause leukaemia in vivo, whereas SA + R HSPCs preserve the GMP population and cause leukaemia, we next tested whether the SA + R GMPs are the leukaemia-initiating cells. Indeed, fluorescence-activated cell sorting (FACS) of SA + R HSPCs showed that only GMPs, and not CMPs, had leukaemia-initiating activity despite expressing comparable levels of all three transgenes (Extended Data Fig. 5a–c). We then reasoned that the typical acquisition pattern of RASmut late in the course of human AML may be accounted for by their acquisition by a GMP, produced by HSC/MPPs harbouring ancestral mutations. Indeed, GMPs, but not CMPs, in which R was induced after sorting, with SA transduction either before (SA + R) or at the same time as R (SAR), could initiate a lethal myeloid leukaemia (Fig. 2g–i, Extended Data Fig. 5d–l and Supplementary Table 1). This leukaemia was serially transplantable, indicating that SA + R endows GMPs with self-renewal potential (Extended Data Fig. 5g,h). CMPs and GMPs without R (−Dox) exhibited minimal or no engraftment, as expected from non-transformed committed progenitors (Extended Data Fig. 5i,j). These results indicate that, not only are RAS-MT GMPs able to initiate and maintain leukaemia in vivo, but also that GMPs derived from ancestral AML clones with previously acquired cooperating driver mutations can be the target cell of transformation by RASmut.
Extended Data Fig. 5. Leukemogenesis from CB GMPs.
a, Transduction efficiency of SA + R CB CMPs and GMPs from two independent experiments. b, Sorted SA + R CB CMPs and GMPs were injected into NSGS mice. A mouse that received SA + R GMPs succumbed to a lethal disease 11 weeks after transplantation, while a mouse transplanted with SA + R CMPs showed no signs of illness. c, Engraftment in mice transplanted with SA + R CMPs or GMPs 11 weeks after transplantation. d,e, Sorted CMPs (upper panels) and GMPs (lower panels) from the experiments depicted in Fig. 2g (d) and Fig. 2h (e), cultured with Dox and assayed on the day of transplantation (day 8). f, Wright-Giemsa-stained human cells with blast morphology retrieved from the BM of a mouse transplanted with SA + R GMPs. Image representative of 3 independent experiments. Scale bar, 50 μm. g, BM engraftment in a secondary recipient mouse upon serial transplantation of SA + R GMPs from the experiment shown in Fig. 2g. h, Wright-Giemsa-stained cells from the BM of a secondary recipient mouse transplanted with SA + R GMPs. The larger cells are human blasts. The smaller cells with segmented nuclei correspond to murine neutrophils. Scale bar, 50 μm. i,j, Engraftment in the BM of mice transplanted with SA + R from Fig. 2g (i) or SAR from Fig. 2h (j) CMPs or GMPs at the endpoint of the experiment. n = 1 mouse for each SA + R CMP group; 3 mice for each SA + R GMP group; 4 mice for each SAR CMP group; 3 for GMP+Dox and 2 for GMP-Dox. Mean and SD are shown. k, Percentage of CD33+ myeloid cells (of hCD45+ cells) in the BM of mice (n = 3) transplanted with SA + R GMPs from Fig. 2g. Mean and SD are shown. l, Flow cytometry analysis of a representative mouse transplanted with sorted SA + R or SAR GMPs from the experiments schematically depicted in Fig. 2g,h, respectively, showing that the leukemic cells co-express all 3 mutant transgenes.
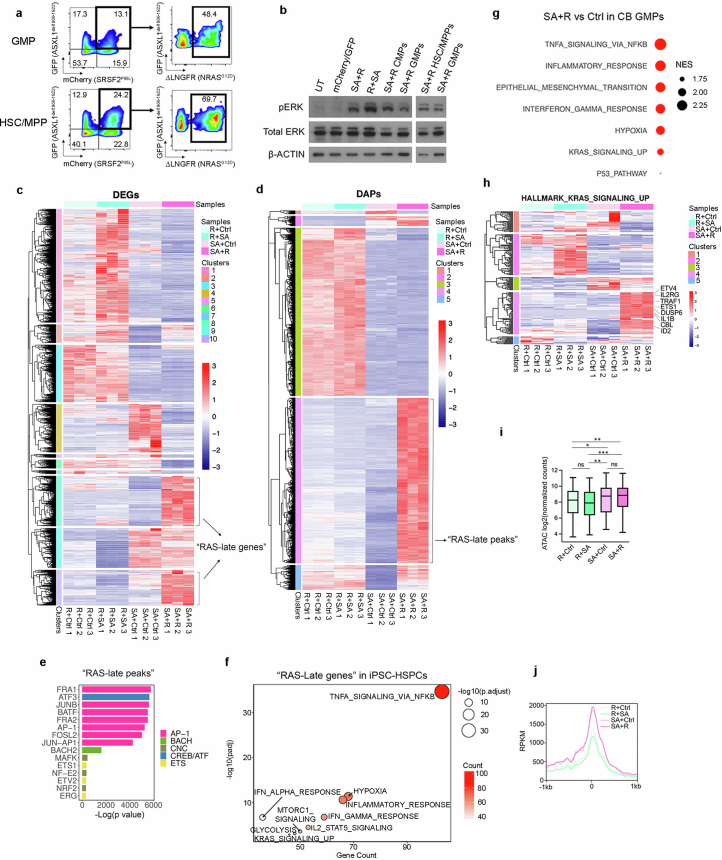
We next sought to understand the signalling and genomic underpinnings of the selective transformation of GMPs by RASmut. Mutant RAS activated ERK at comparable or lower levels in sorted GMPs than in CMPs or HSC/MPPs transduced with SA + R and expressing similar levels of all transgenes (Extended Data Fig. 6a,b). We next defined ‘RAS-late genes’ as the genes upregulated in iPS-HSPCs selectively in SA + R (Extended Data Fig. 6c and Supplementary Table 2) and ‘RAS-late peaks’ as the peaks gaining accessibility selectively in SA + R cells (Extended Data Fig. 6d and Supplementary Table 3). The latter were enriched for motifs of transcription factors classically associated with MAPK signalling, such as AP1, CREB and ETS family (Extended Data Fig. 6e). ‘RAS-late genes’ were enriched for pathways related primarily to inflammatory responses (Extended Data Fig. 6f). These were also enriched in genes differentially expressed between SA + R and Ctrl CB cells in the GMP cluster in the scRNA-seq analyses (Extended Data Fig. 6g).
Extended Data Fig. 6. Genomics analyses of genetically engineered iPS- and CB- HSPCs.
a, Transgene expression in sorted GMPs and HSC/MPPs transduced with SA + R. b, Assessment of ERK activation (phospho-ERK, pERK) by Western blotting in total CB CD34+ cells or FACS-sorted CMPs, GMPs and HSC/MPPs transduced with the indicated lentiviral vectors or untransduced (UT). Shown is one representative experiment out of 2. Samples were derived from the same experiment and processed in parallel. β-actin controls were run on different gels as sample processing controls. For source data, see Supplementary Fig. 4. c, Hierarchical clustering of expression values of differentially expressed genes (DEGs) from the SA + R vs SA+Ctrl and SA + R vs R + SA comparisons. Genes belonging to clusters 8 and 10 were designated as “RAS-late genes”. d, Hierarchical clustering of accessibility scores of differentially accessible peaks (DAPs) from the SA + R vs SA+Ctrl and SA + R vs R + SA comparisons. The peaks of cluster 4 were designated as “RAS-late peaks”. e, Top statistically significant transcription factor (TF) motifs (identified using the Homer motif discovery package) enriched in the “RAS-late” peaks from d, grouped by TF families. f, Selected top enriched (over-representation analysis) HALLMARK pathways in the “RAS-late genes” from c. Count: number of “RAS-late genes” in the gene set. Adjusted p values were derived from GSEA. g, Selected enriched (FDR < 0.1) HALLMARK pathways in SA + R vs Ctrl cells of the GMP cluster from Fig. 2b. NES: normalized enrichment score. h, Expression of the genes belonging to the “KRAS signaling up” HALLMARK gene set. Cluster 4 contains 65 genes that are upregulated specifically in the SA + R group. i, Aggregate accessibility of the 65 genes related to RAS signaling that are specifically upregulated in SA + R iPS-HSPCs (cluster 4 genes from h). *P < 0.05, **P < 0.01, ***P < 0.001, ns: not significant (two-tailed unpaired t-test). The top and bottom lines of the whiskers denote the highest and lowest values, respectively. The box spans the interquartile range (25th-75th percentile) and the line represents the median. j, Accessibility (Reads Per Kilobase per Million mapped ATAC reads, RPKM) within 1 kb on either side of the transcription start site (TTS) of the 65 genes related to RAS signaling that are specifically upregulated in SA + R iPS-HSPCs (cluster 4 genes from h), showing higher accessibility in SA + R and SA+Ctrl cells, compared to the R + SA and R+Ctrl groups. The X axis shows distance from the TTS. One representative replicate per condition is shown.
Notably, of the genes classically associated with RAS signalling activation (‘HALLMARK KRAS signalling’), those upregulated by RAS as late mutation were distinct, with almost no overlap with the genes upregulated by RAS as an early mutation (Extended Data Fig. 6h and Supplementary Table 4). The 65 genes selectively activated by late but not by early RAS were more accessible in the SA + Ctrl and SA + R groups—as shown earlier, these represent GMPs (Fig. 2f and Extended Data Fig. 4f)—and less accessible in the R + Ctrl and R + SA groups that resemble CMPs (Extended Data Fig. 6i,j).
These results support a scenario whereby mutant RAS leads to comparable ERK signalling activation in GMPs as in more primitive HSPCs, but with different transcriptional output, upregulating a distinct set of genes that are primed at the chromatin level in the GMP state.
RAS-MT LSCs generate monocytic leukaemia
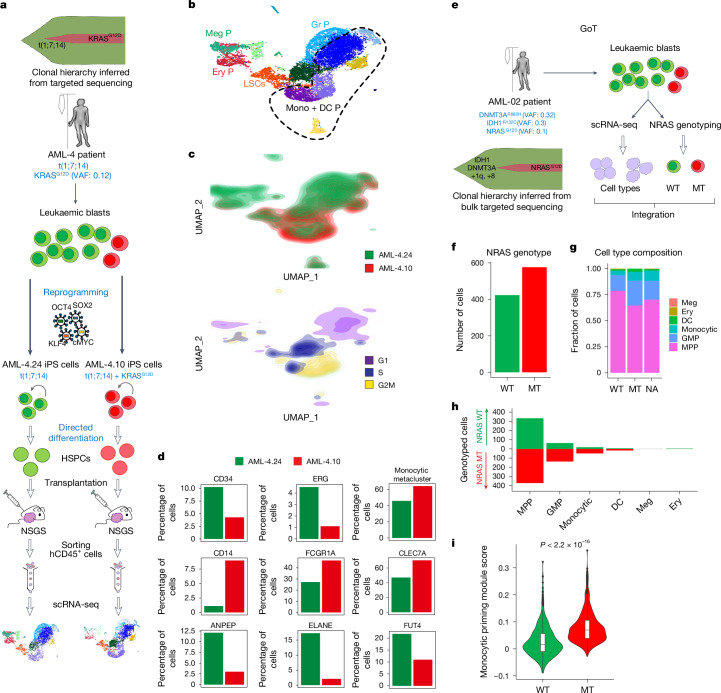
Recent studies have hinted at an association between RASmut and a mature phenotype of cells of a patient with AML3,14. We thus hypothesized that RAS-MT GMP-like LSCs produce leukaemic blasts with mature phenotype. To test this, we interrogated the leukaemic cell output of RAS-MT LSCs, compared with that of RAS-WT LSCs in the same patient. First, we generated xenografts from a pair of AML-iPS cell lines—AML-4.10 and AML-4.24, with or without a KRASG12D mutation, respectively—derived from the same patient with AML28,30 (Fig. 3a). RAS-MT cells contained a higher fraction of proliferating cells, a smaller proportion of immature CD34+ cells and a larger proportion of cells with monocytic markers, such as CD14, CD64 (FCGR1A) and CLEC7A, than the RAS-WT clone (Fig. 3b–d and Extended Data Fig. 7a). Conversely, a smaller fraction of RAS-MT cells expressed neutrophil markers, such as CD13 (ANPEP), CD15 (FUT4) and ELANE (Fig. 3d).
Fig. 3. RAS-MT AML LSCs produce leukaemic cells with monocytic features.
a, Two iPS cell lines derived from a patient with AML with a clonal t(1;7;14) translocation and a subclonal KRASG12D mutation, one capturing the RASWT major clone (AML-4.24) and one the KRASG12D subclone (AML-4.10) of the patient AML were differentiated to HSPCs, transplanted into NSGS mice, allowed to generate lethal leukaemias, collected, sorted and subjected to scRNA-seq analysis. b, UMAP representation of single-cell transcriptome data. The dashed line delineates the monocytic metacluster. c, Cell density across the UMAP coordinates from b. Cells coloured by sample (top panel) or phase of the cell cycle (bottom panel). d, Percentage of cells expressing the indicated genes (normalized counts > 0.5) or contained in the monocytic metacluster (shown in b). e, Schematic of the GoT experiment. f, Number of cells that could be genotyped as NRAS-WT (423 cells) or MT (576 cells) by GoT. g,h, Fraction (g) and absolute number (h) of cells belonging to each cell type assigned from transcriptome data in the NRAS-WT and NRAS-MT cells (NA, not assigned to a NRAS genotype). Cells belonging to the NRAS-MT clone contain a higher fraction of monocytic cells (Fisher’s exact test P value = 0.00028, odds ratio = 3.255) and lower fraction of immature HSC/MPP-like cells (Fisher’s exact test P value = 3.044 × 10⁻¹¹, odds ratio = 0.3345) than NRAS-WT cells. i, Expression of a monocytic priming gene module (IRF7/IRF8) from ref. 32 in NRAS-WT and MT cells. The whiskers denote the 1.5× interquartile range (IQR). The lower and upper hinges of the boxes represent the first and third quartiles, respectively. The middle line represents the median. Points represent values outside the 1.5× IQR. The P value was calculated with a two-sided Wilcoxon test.
Extended Data Fig. 7. RAS mutations drive monocytic differentiation.
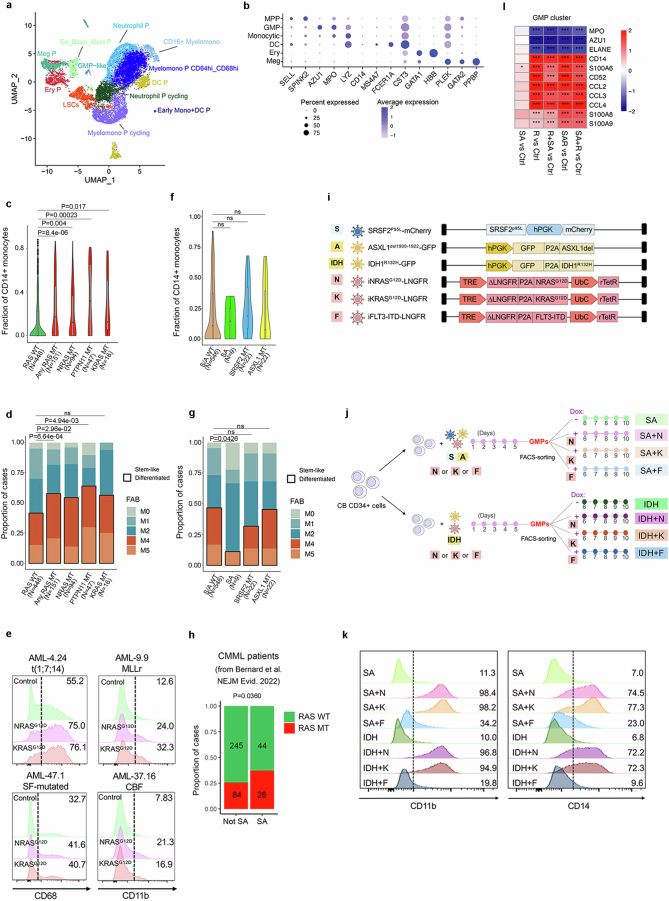
a, UMAP of integrated single-cell transcriptome data from Fig. 3a,b, at resolution 0.4. b, Expression of selected marker genes in each annotated cluster from the GoT data. c, Fraction of CD14+ monocytic blasts in AML patients with mutations in RAS pathway genes (NRAS, KRAS or PTPN11) or without any RAS pathway mutation (RAS WT). “Any RAS MT” denotes cases with mutations in either of the 3 genes NRAS, KRAS or PTPN11. The whiskers denote the 1.5* IQR (interquartile range). The lower and upper hinges of the boxes represent the first and third quartiles, respectively. The middle line represents the median. Points represent values outside of the 1.5* IQR. The P value was calculated with a two-sided Wilcoxon test. d, FAB subtype of AML patients with mutations (MT) in RAS pathway genes (NRAS, KRAS or PTPN11) or without any RAS pathway mutation (RAS WT). “Any RAS MT” denotes cases with mutations in either of the 3 genes NRAS, KRAS or PTPN11. Two-tailed Fisher test, ns: not significant. e, Flow cytometry for myelomonocytic markers CD68 and CD11b in CD34+ cells from 4 patient-derived AML-iPS cell lines with or without (Control) lentiviral expression of NRASG12D or KRASG12D. MLLr: MLL-rearranged; SF: splicing factor; CBF: core binding factor. f, Fraction of CD14+ monocytic blasts in AML patients with or without mutations (MT) in SRSF2 and ASXL1 genes. SA denotes cases with double SRSF2 and ASXL1 mutations; S/A WT denotes cases without SRSF2 or ASXL1 mutations. The whiskers denote the 1.5* IQR (interquartile range). The lower and upper hinges of the boxes represent the first and third quartiles, respectively. The middle line represents the median. Points represent values outside of the 1.5* IQR. ns: not significant (two-sided Wilcoxon test). g, FAB subtype of AML patients with or without mutations (MT) in SRSF2 and ASXL1 genes. SA denotes cases with double SRSF2 and ASXL1 mutations; S/A WT denotes cases without SRSF2 or ASXL1 mutations. Two-tailed Fisher test, ns: not significant. h, Proportion of cases with or without NRAS or KRAS mutations (RASMT and RAS–WT, respectively) with or without combined SRSF2 and ASXL1 mutations (SA and not SA, respectively) among 399 CMML patients from the MDS International Working Group cohort (Bernard et al. 2022). (P value: one tail Fisher test). i,j, Experimental scheme. Schematic of lentiviral vectors used (i). Vectors N, K and F are DOX-inducible. k, Myelomonocytic markers CD11b and CD14 in GMPs with various transgene combinations, shown in i,j, cultured for 5 days after sorting. N: NRASG12D, K: KRASG12D, F: FLT3-ITD, IDH: IDH1R132H, S: SRSF2P95L; A: ASXL1Del. l, Heatmap showing differential expression of the indicated granulocytic (MPO, AZU1, ELANE) and monocytic (CD14, CD52, S100A6, S100A8, S100A9, CCL2, CCL3, CCL4) lineage genes in the GMP cluster, in the indicated comparisons, from the single-cell transcriptome data from Fig. 2a,b. *P < 0.05, ***P < 0.001 (two-sided Wilcoxon test).
We next examined data obtained from a patient with AML with a subclonal NRASG12D mutation with the Genotyping of Transcriptomes (GoT) method31 (Fig. 3e–g and Extended Data Fig. 7b). Cells belonging to the NRAS-MT clone contained a higher fraction of monocytic cells and lower fraction of immature HSC/MPP-like cells and had significantly higher expression of a monocytic priming gene module32 than NRAS-WT cells (Fig. 3g–i).
These results establish that RAS-MT AML subclones generate more mature monocytic cells than more ancestral AML clones in the same patient.
In addition, in a cohort of 599 patients with AML33, patients with RASmut had a significantly higher fraction of CD14+ monocytic blasts and higher frequency of AML with myelomonocytic (FAB M4) or monoblastic/monocytic (FAB M5) morphology, compared with those without RASmut (Extended Data Fig. 7c,d). Furthermore, lentiviral expression of either NRASG12D or KRASG12D in CD34+CD45+ cells from four patient-derived AML-iPS cell lines of different genetic groups30 induced myeloid maturation in vitro (Extended Data Fig. 7e). These results corroborate the association between RASmut and monocytic differentiation in diverse AML genotypes at the population level.
In contrast to RASmut, SRSF2 and ASXL1 mutations or their co-mutation (SA) showed no association with monocytic disease in patients with AML (Extended Data Fig. 7f,g). SRSF2 and ASXL1 co-mutation is a characteristic feature of chronic myelomonocytic leukaemia (CMML)—a myeloproliferative neoplasm characterized by monocytosis. In an international cohort of 399 patients with CMML34, we found N/KRAS mutations to frequently co-occur with SA mutations (Extended Data Fig. 7h). To test a potential contribution of the SRSF2 and ASXL1 mutations to the N/KRAS mutation-driven monocytic phenotype, sorted CB GMPs with SRSF2 and ASXL1 (SA) or an IDH1R132H transgene were transduced with lentiviral vectors expressing NRASG12D, KRASG12D or FLT3-ITD (Extended Data Fig. 7i,j). Both RASmut, but not the FLT3-ITD mutation, potently drove monocytic differentiation of GMPs regardless of the initiating mutations (SRSF2 + ASLX1 or IDH1) (Extended Data Fig. 7k). SA or IDH1 mutations alone did not cause monocytic differentiation (Extended Data Fig. 7k). Finally, examination of our CB scRNA-seq data (Fig. 2b) showed increase in expression of several monocytic lineage genes and concomitant decrease in expression of granulocytic genes in the GMP cluster in all groups transduced with R, but not in the SA alone group (Extended Data Fig. 7l).
These results collectively show that RAS pathway mutations and not the SRSF2 or ASXL1 mutations drive monocytic differentiation of RAS-MT GMPs.
RAS-MT AML LSCs are resistant to VEN
In view of our findings so far, establishing that RASmut cause monocytic AML, we sought to re-evaluate previously reported associations between poor responses to VEN-containing regimens and monocytic disease and, independently, RAS pathway mutations22–25.
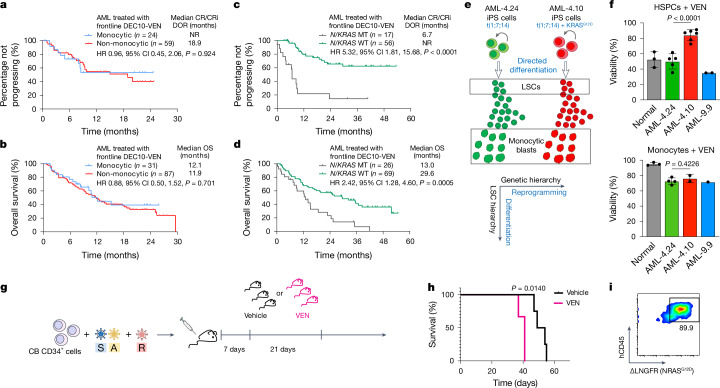
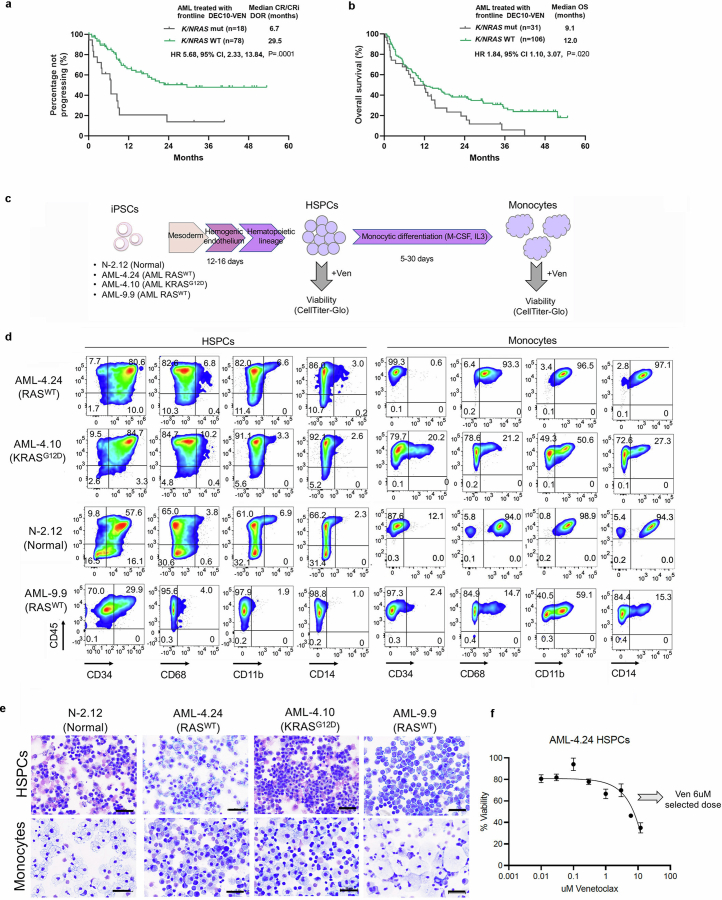
To this end, we reanalysed data from a cohort of older or unfit patients with newly diagnosed AML treated on a prospective clinical trial with VEN and decitabine (DEC)19. A total of 118 patients were included, of whom 31 could be classified as having monocytic AML, determined by flow cytometric assessment, esterase positivity or FAB M4 or M5 morphology35 (Supplementary Table 5). Overall survival (OS) and all other outcomes were comparable between the monocytic and non-monocytic groups (Fig. 4a,b and Supplementary Table 6). By contrast, comparing outcomes in patients with or without N/KRAS mutations, including or excluding TP53-mutated cases, known to be associated with poor prognosis, showed that patients with TP53-WT AML harbouring mutations in N/KRAS treated with VEN and DEC had significantly increased risk of relapse, shorter duration of response (DOR) and reduced OS, compared with those without N/KRAS mutations (Fig. 4c,d, Extended Data Fig. 8a,b and Supplementary Tables 5 and 6). These analyses do not support the monocytic stage as a determinant or predictor of clinical response to VEN + hypomethylating agent regimens, but establish the presence of N/KRAS mutations as a predictor of inferior responses.
Fig. 4. RASMT LSCs drive clinical resistance to VEN.
a–d, Outcome data from 118 older or unfit patients with newly diagnosed AML treated in a prospective trial with 10-day DEC and VEN (DEC10-VEN). DOR (a) and OS (b) in patients with monocytic versus non-monocytic AML. DOR (c) and OS (d) in patients with AML with TP53-WT with versus without N/KRAS mutations. log-rank test, two-tailed unadjusted P values. e, Two iPS cell lines derived from a patient with AML, one capturing the RAS-WT major clone (AML-4.24) and one the KRASG12D subclone (AML-4.10), were differentiated in vitro to LSCs and to monocytic blasts. f, HSPCs and monocytes derived from normal iPS cells and from the indicated AML-iPS cell lines were treated with VEN and viability was measured by CellTiter-Glo. Viability compared with dimethylsulfoxide (DMSO)-treated is shown. HSPCs, n = 3 normal, 5 AML-4.24, 7 AML-4.10 and 2 AML-9.9; monocytes, n = 3 normal, 4 AML-4.24, 2 AML-4.10 and 1 AML-9.9 independent experiments; mean and s.d. are shown. P values were calculated with a two-tailed unpaired t-test. g, CB CD34+ cells transduced with SA + R, as shown in Fig. 2a were transplanted into NSGS mice. The mice were treated with VEN (100 mg kg−1 day−1 by oral gavage) or vehicle, starting 1 week post-transplant, daily, for 3 weeks. h, Survival of mice from the experiment shown in g; n = 3 (VEN) and 4 (Vehicle). P value was calculated with a log-rank (Mantel–Cox) test. i, NRASG12D expression in hCD45+ cells from the bone marrow of a moribund mouse treated with VEN. CI, confidence interval; CR, complete remission; CRi, CR with incomplete haematologic recovery; HR, hazard ratio; NR, not reached.
Extended Data Fig. 8. Differentiation of normal and AML- iPS cells into HSPCs and monocytes.
a,b, Duration of response (DOR) (a) and overall survival (OS) (b) in AML patients with N/KRAS mutations vs without N/KRAS mutations. Log-rank test, two-tailed unadjusted P values. CR: complete remission; CRi: CR with incomplete hematologic recovery; HR: hazard ratio; CI: confidence interval. c, Schematic of protocol for in vitro directed differentiation of human iPS cells into HSPCs and monocytes. d, Representative flow cytometry assessment of HSPC (CD34) and monocytic (CD68, CD11b, CD14) markers in normal iPS cell and AML iPS cell-derived HSPCs and monocytes. e, Representative Wright-Giemsa-stained cytospin preparations of HSPCs and monocytic cells derived from normal iPS cell and AML iPS cell lines, showing immature morphology (upper panels) and typical monocytic morphology (lower panels). Images are from one experiment out of at least 3 repeats. Scale bars, 50 μm. f, Dose-response curve of AML-4.24 HSPCs treated with VEN at the indicated doses. Cells were treated for 48 h and viability was assessed using the CellTiter-Glo assay. Mean and SD from n = 2 independent experiments is shown. 6 μM was selected as the dose for subsequent assays.
To test the effects of RAS mutational status, independently from the effects of monocytic differentiation state, to VEN responses in a tightly controlled experimental setting, we used directed in vitro differentiation of the two patient-derived iPS cell lines AML-4.24 and AML-4.10 into immature CD34+ LSCs and monocytes (Fig. 4e and Extended Data Fig. 8c–f). A normal iPS cell line (N-2.12)36 and an independent RAS-WT AML-iPS cell line derived from a different patient (AML-9.9)30 were also used as further controls. Monocytes derived from all AML and normal iPS cells were resistant to VEN (Fig. 4f, bottom panel). By contrast, CD34+ LSCs and HSPCs from all RAS-WT lines—AML and normal—were sensitive to VEN (Fig. 4f, top panel). However, notably, LSCs from the AML-4.10 KRAS-MT line were consistently VEN-resistant (Fig. 4f, top panel).
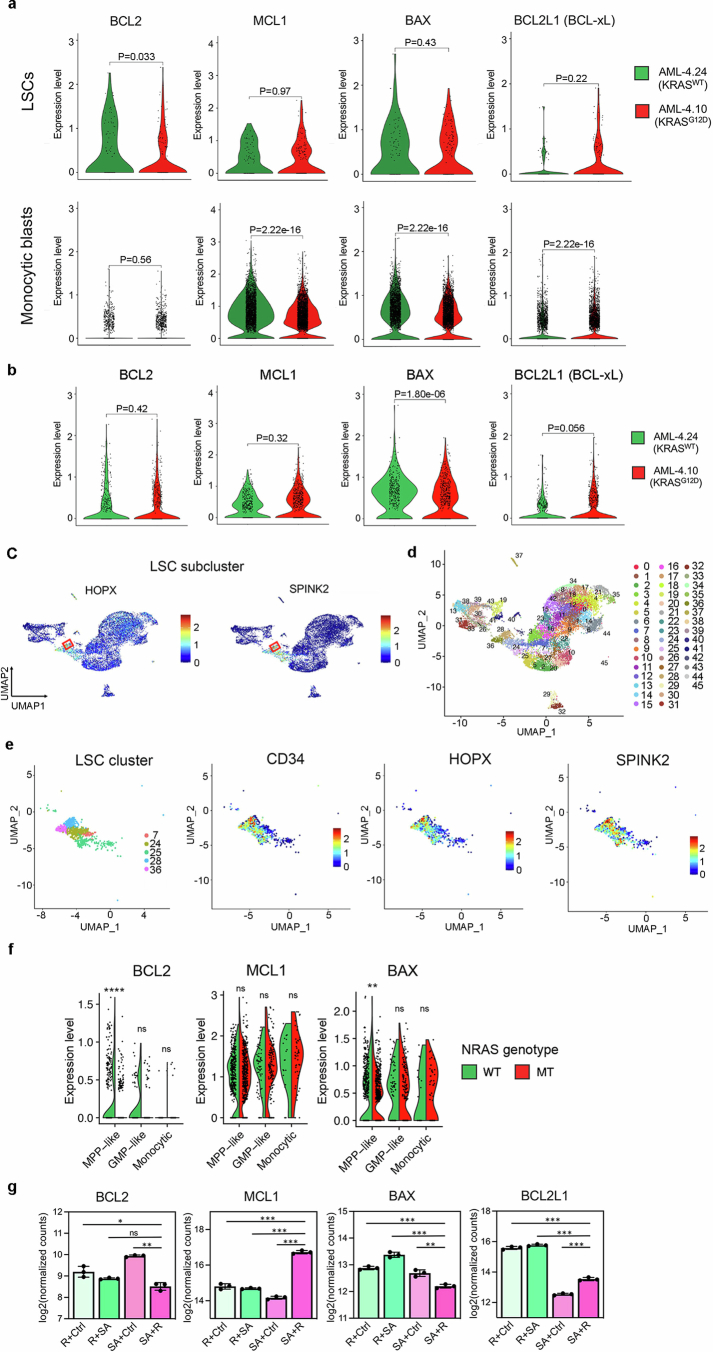
Resistance to BCL2 inhibition at the cellular level can be mediated by downregulation of BCL2 with concomitant upregulation of other anti-apoptotic BCL2 family proteins (such as MCL1, BCL2L1/BCL-xL and BCL2A1) and/or downregulation of pro-apoptotic members (such as BAX)16,24,26,37–39. Monocytic blasts of the iPS-cell-derived xenografts expressed very low amounts of BCL2, while they highly expressed MCL1, regardless of genotype (Extended Data Fig. 9a, bottom panels). By contrast, LSCs expressed high amounts of BCL2 and much lower amounts of MCL1 than monocytic cells (Extended Data Fig. 9a–e). Notably, the RAS-MT LSCs had reduced BCL2 expression compared with the LSCs of the RAS-WT clone, and a trend towards higher MCL1 and BCL2L1 and lower BAX expression (Extended Data Fig. 9a, top panels).
Extended Data Fig. 9. Single-cell transcriptomic analyses of AML-iPS cell-LSCs.
a, Violin plots showing expression of anti- and pro-apoptotic genes of the BCL2 family in monocytic blasts (monocytic metacluster generated by merging all monocytic and dendritic cell clusters shown in Fig. 3b and Extended Data Fig. 7a) or LSCs (cluster 28 shown in b-d) within the AML-4.10 and AML-4.24 leukemia cells from xenografts. P values were calculated with a two-sided Wilcoxon test. b, Expression of anti- and pro-apoptotic genes in the LSC cluster shown in Fig. 3b without subclustering in the iPS cell-derived leukemia cells from xenografts. P values were calculated with a two-sided Wilcoxon test. c, Expression of HSC markers SPINK2 and HOPX projected onto the integrated UMAP. The red squares indicate the LSC subcluster (cluster 28 shown in c,d). d, UMAP representation of single-cell transcriptome data in resolution 3.2, yielding 46 clusters. e, Left panel: UMAP representation of the LSC cluster (from resolution 0.4 clustering shown in Fig. 3b) subdivided into 5 clusters (from resolution 3.2 clustering shown in c). Middle and right panels: Expression of HSC markers CD34, HOPX and SPINK2 projected onto the LSC cluster UMAP. f, Split-violin plots showing expression of anti- and pro-apoptotic genes in monocytic blasts or immature MPP-like and GMP-like cells of the NRASMT and NRASWT genetic clones from GoT data. **P < 0.01, ****P < 0.0001, ns: not significant (two-tailed Wilcoxon test). g, Normalized expression of the indicated pro- and anti- apoptotic genes in the genetically engineered iPS-HSPCs shown in Fig. 2d (n = 3 independent experiments for all groups). *P < 0.05, **P < 0.01, ***P < 0.001, ns: not significant (two-tailed unpaired t-test).
In the GoT data, monocytic cells also expressed negligible BCL2 and high MCL1 amounts, regardless of NRAS genotype, mirroring our findings in the iPS-cell-derived xenografts (Extended Data Fig. 9f). Immature cells—MPP-like and GMP-like—expressed higher BCL2 (average log2 fold change (FC) 0.075) and lower MCL1 (average log2 FC −0.54) than monocytic leukaemia cells (Extended Data Fig. 9f), again corroborating our data in the iPS cell model. Again, NRAS-MT immature MPP-like cells had markedly lower expression of BCL2 than their NRAS-WT counterparts (average log2 FC −0.27) (Extended Data Fig. 9f). As in the iPS-cell-derived cells, BAX expression was also lower in the NRAS-MT, as opposed to the NRAS-WT, MPPs (average log2 FC −0.14). Finally, expression of BCL2 was decreased in SA + R iPS-HSPCs, which also showed concomitant increase in MCL1 and BCL2L1 and decrease in BAX expression (Extended Data Fig. 9g).
These data collectively demonstrate that RAS-MT LSCs are resistant to VEN. This VEN resistance of RAS-MT LSCs could be accounted for by altered BCL2 family expression, and drive the clinical resistance to VEN in patients with AML with RASmut (Fig. 4c,d). To further test whether RAS-MT LSCs are VEN-resistant in vivo, we treated mice transplanted with CB SA + R cells with VEN for 3 weeks (Fig. 4g). All mice succumbed to lethal leukaemia, which was accelerated in VEN-treated, compared with control vehicle-treated, animals (Fig. 4h). Almost all leukaemic cells retrieved from these mice expressed the NRASG12D transgene (Fig. 4i).
GMP state does not drive VEN resistance
As RAS-MT LSCs originate from GMPs and retain genomic features (transcriptome and chromatin accessibility) of GMPs, we next asked whether their resistance to VEN can be attributed to the RASmut and its signalling and transcriptional consequences or to the gene regulatory and metabolic wiring of the GMP cell state.
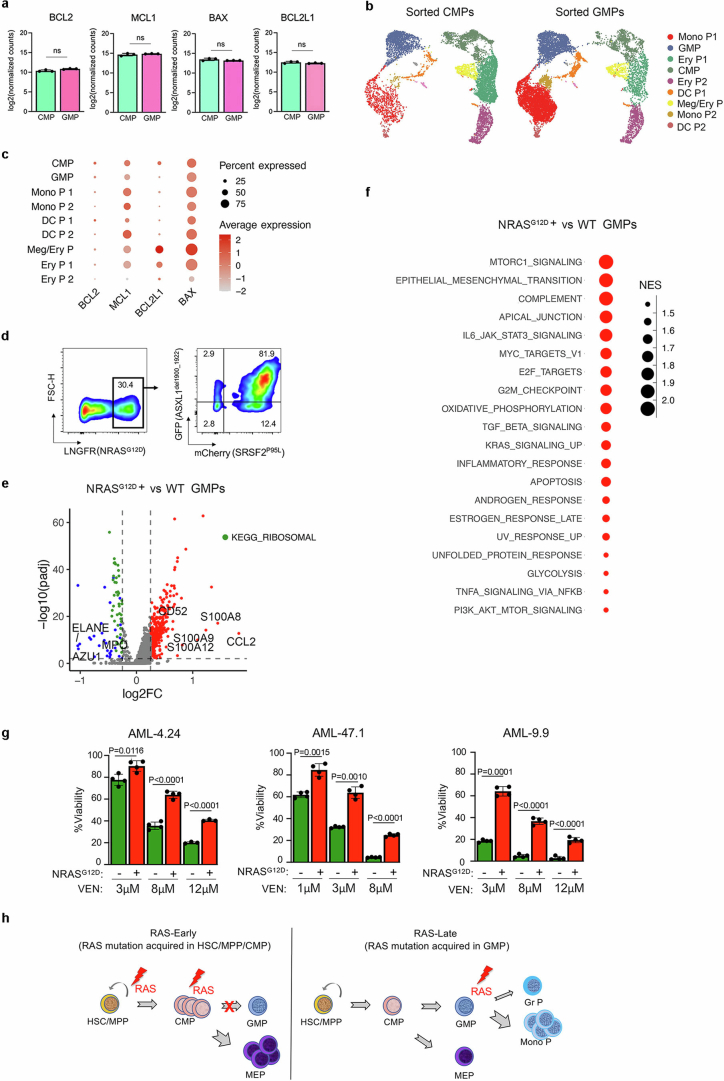
To test this, we performed bulk and scRNA-seq analyses in sorted CB SA + R CMPs and GMPs expressing equivalent amounts of the transgenes (Fig. 5a and Extended Data Fig. 5a, left panels). Expression of BCL2, MCL1, BCL2L1 and BAX was comparable between CMPs and GMPs (Fig. 5b and Extended Data Fig. 10a–c). Consistent with this, sorted SA + R CMPs and GMPs had comparable sensitivity to VEN (Fig. 5c). To then ask whether expression of pro- and anti-apoptotic genes is modulated by the RASmut in GMPs, we identified NRASG12D positive cells, by means of ΔLNGFR expression (most of which also expressed SA) and WT cells not expressing any of the transgene-linked reporters (Fig. 5d and Extended Data Fig. 10d). MCL1 was increased in NRASG12D versus WT GMPs (Fig. 5e).
Fig. 5. Resistance of RAS-MT GMP-like LSCs to VEN is due to the RASmut and not to the GMP state.
a, Experimental design. b, UMAP representation of integrated single-cell transcriptome data from FACS-sorted SA + R CMPs and GMPs. c, Viability of FACS-sorted CMPs, GMPs and HSC/MPPs, untransduced (UT) or transduced with SA + R, treated with VEN. **P < 0.01, ****P < 0.0001, NS (one-way ANOVA). Mean and s.d. from n = 3 independent experiments are shown. d, Cells expressing ΔLNGFR-NRASG12D (NRASG12D+, red) or none of the transgenes (WT, green) projected in the UMAP from b. e, Expression of MCL1 and BCL2 in NRASG12D+ versus WT cells belonging to the GMP cluster. P values were calculated with a two-sided Wilcoxon test. f, Viability of CD34+ LSCs from the indicated patient-derived AML-iPS cell lines with or without (Control) ectopic lentiviral expression of NRASG12D or KRASG12D, as indicated, treated with VEN and/or RASi. Viability compared with DMSO-treated group is shown. Mean and s.d. from n = 3 or 4 independent experiments is shown. P values were calculated with a two-tailed unpaired t-test. g, Detection of the indicated proteins by western blotting in CD34+ LSCs from the indicated patient-derived AML-iPS cell lines with or without (Control) ectopic lentiviral expression of NRASG12D or KRASG12D, with or without treatment with RASi. Samples were derived from the same experiment and processed in parallel. β-Actin controls were run on different gels as sample processing controls. For source data, see Supplementary Fig. 4. CBF, core binding factor; SF-mutated, splicing factor-mutated; MLLr, MLL-rearranged.
Extended Data Fig. 10. Genomics analyses of genetically engineered sorted CMPs and GMPs.
a, Expression of the indicated pro- and anti- apoptotic genes in FACS-sorted SA + R CMPs and GMPs measured by bulk RNA-Seq. Mean and SD from n = 3 independent experiments are shown. ns: not significant (two-tailed unpaired t-test). b, UMAP representation of integrated single-cell transcriptome data from FACS-sorted SA + R CMPs (left) and GMPs (right) from Fig. 5a,b. c, Expression of the indicated pro- and anti- apoptotic genes in the different clusters. d, Flow cytometry analysis of SA + R CB cells from the experiment shown in Fig. 5a on day 6, showing that the vast majority of ΔLNGFR-NRASG12D+ cells also express the other two transgenes (GFP-ASXL1del1900-1922 and mCherry-SRSF2P95L). e, Volcano plot showing differentially expressed genes between NRASG12D+ and WT cells of the GMP cluster from Fig. 5b,d. Significantly upregulated and downregulated genes (Wilcoxon test) are shown in red and blue, respectively. Granulocytic (MPO, AZU1, ELANE) and monocytic (S100A8, S100A9, S100A12, CD52, CCL2) lineage genes, downregulated and upregulated, respectively, are highlighted. Downregulated genes encoding ribosomal proteins are shown in green. f, Top 20 most enriched HALLMARK pathways in NRASG12D+ vs WT cells belonging to the GMP cluster from Fig. 5b,d. NES: normalized enrichment score. g, Viability of CD34+ LSCs from the indicated patient-derived AML-iPS cell lines with or without ectopic lentiviral expression of NRASG12D, treated with VEN at the indicated concentrations. %Viability compared to DMSO-treated group is shown. n = 3 for AML-4.24 treated with 12 μM VEN and n = 4 for all other groups. Mean and SD are shown. P values were calculated with a two-tailed unpaired t test. h, Summary schematic of the effects of RAS mutation acquisition in different HSPC types. RAS mutations acquired by more primitive HSPCs (HSC/MPPs or CMPs) result in reduction of GMP formation and reciprocal increase in megakaryocyte and erythroid progenitors (MEP) (left panel). Acquisition of RAS mutations in GMPs drives their differentiation towards the monocytic and away from the granulocytic lineage (right panel).
These results collectively indicate that it is the RASmut, rather than the GMP state, that confers VEN resistance to the RAS-MT LSCs. Furthermore, this VEN resistance endowed by RASmut does not seem to be restricted to GMPs, but occurs across HSPC types (Fig. 5c).
Consistent with our previous results (Extended Data Fig. 7l), monocytic lineage genes were upregulated and granulocytic lineage genes downregulated in NRASG12D+, compared with WT, GMPs (Extended Data Fig. 10e). Many genes encoding ribosomal proteins were also downregulated in NRASG12D+ GMPs (Extended Data Fig. 10e). Pathway analysis was suggestive of altered protein synthesis and metabolic processes consistent with metabolic re-wiring of GMPs by RASmut (Extended Data Fig. 10f).
Finally, to further confirm that N/KRAS mutations confer VEN resistance and to test whether the latter is effected by both NRAS and KRAS mutations and generalizable across diverse AML genetic types, we ectopically expressed NRASG12D or KRASG12D in CD34+CD45+ LSCs from patient-derived AML-iPS cell lines of different genetic groups30. Mutant NRAS and KRAS significantly decreased VEN sensitivity of all LSCs (Fig. 5f and Extended Data Fig. 10g). This was reversed by treatment with an active state-selective RAS multi inhibitor (RASi)40,41 (Fig. 5f). Furthermore, and consistent with this, expression of both NRASG12D and KRASG12D led to increase in MCL1 and BCL-xL and decrease in BCL2 in all groups (Fig. 5g). The RASi reversed the increase of MCL1 and BCL-xL in all cases, with more variable effects on BCL2 amounts (Fig. 5g).
Discussion
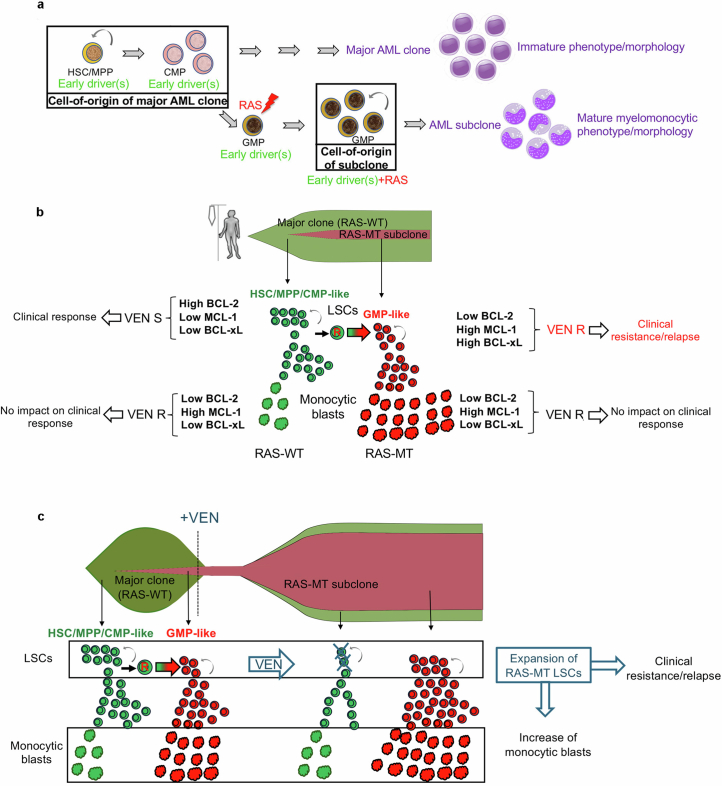
Here we provide evidence that the LSCs sustaining RAS-MT subclones in AML originate from GMPs. We thus demonstrate that the subclonal RAS-mutated AML LSC can emerge from a different and more mature cell type than the cell-of-origin of the major AML clone, which, in most cases, is a primitive HSC/MPP (Extended Data Figs. 10h and 11a).
Extended Data Fig. 11. Summary models for the role of RAS mutations in leukemic transformation.
a, Model of emergence of RAS-MT LSCs based on the findings of this study. RASmut acquired by a GMP harboring previously acquired driver mutations can give rise to an LSC. The latter generates leukemic cells with mature monocytic immunophenotype, whereas the major AML clone without RASmut gives rise to leukemic cells with more immature features. Thus, the LSC of the RAS-MT subclone originates from a different and more mature type of cell in the hematopoietic hierarchy (a GMP) than the LSC of the major ancestral RAS-WT clone, which originates from an HSC/MPP/CMP. b, Mechanism of VEN resistance in AML with subclonal N/KRAS mutations. RAS-WT LSCs express high levels of BCL-2 and are the targets of VEN therapy, whose elimination translates into a clinical response. In contrast, monocytic blasts, regardless of genotype, are uniformly VEN-resistant, as they lack expression of BCL-2 and instead rely on MCL-1 expression for survival. However, resistance of the monocytes has no impact on the clinical response, which is instead dependent on the elimination of LSCs – the cells with self-renewal potential that can maintain and regenerate the leukemia. Critically, RAS-MT LSCs downregulate BCL-2 and upregulate MCL-1 and BCL-xL and are thus resistant to VEN. It is the VEN resistance of these RAS-MT LSCs, rather than the resistance of the monocytic blasts, that is the determinant of clinical relapse and resistance. VEN S: VEN-sensitive; VEN R: VEN-resistant. c, Impact of VEN treatment on the size of immature and monocytic AML populations within RAS-WT and RAS-MT clones. Treatment with VEN imposes selection pressure at the level of the LSCs. RAS-MT LSCs are resistant to VEN – in contrast to RAS-WT LSCs, which are VEN sensitive – and are thus selected for and expand upon VEN treatment. Because RAS-MT LSCs produce more monocytic blasts than RAS-WT LSCs, expansion of the RAS-MT LSC compartment is also accompanied by an increase in the fraction of monocytic blasts. However, it is the LSCs and not the monocytic cells that mediate clinical resistance and relapse, with the increase in monocytic cells being a byproduct of RAS-MT LSC expansion without relevance to the clinical outcome.
Our data strongly point to monocytic differentiation and VEN resistance in AML being two independent effects with a common cause, RASmut. In addition, we show here that leukaemic transformation by RASmut is dependent on the GMP cellular milieu and chromatin landscape, whereas VEN resistance is conferred more broadly in all HSPC types by RASmut, pointing to different mechanistic underpinnings of these processes.
Our data shed new light on recent observations related to clinical responses to VEN in AML. Although we confirm that mature monocytes are resistant to VEN, in agreement with previous findings22, we show that this resistance at the cellular level has no effect on the clinical outcome, which is instead determined by the response of LSCs (Extended Data Fig. 11a,b). This is in line with evidence showing that the targeting of LSCs is essential to achieving lasting therapeutic responses in AML15,42,43. In addition, in view of our data, the monocytic subclones that have been observed to outgrow and be selected upon VEN treatment in patients are likely to, at least in many cases, correspond to RAS-MT subclones22,24,44. As RAS-MT AML subclones contain a higher fraction of monocytic cells than antecedent RAS-WT clones, selection of the RAS-MT subclone at the LSC level can give the appearance of an expansion of cells with monocytic features upon relapse or resistance, with the latter being an epiphenomenon and not causative to relapse or resistance (Extended Data Fig. 11c).
Recently identified ‘monocytic LSCs’ shown to generate monocytic AML, to have a distinct transcriptome and to downregulate BCL2 may also conceivably correspond, at least in a fraction of the cases, to RAS-MT LSCs22,44. The association of monocytic features with poor outcomes after VEN therapy in some cohorts22,24 versus lack of association in others25,26, including the one we present here, may be explained by variable degrees of enrichment of the respective monocytic cohorts in AML cases with RASmut. Thus, our findings can synthesize and reconcile previous seemingly contradictory observations into a coherent model.
Our findings have important implications for clinical practice. The resistance of N/KRAS-MT LSCs to VEN implies that combination therapy with VEN may have limited benefit for patients with pre-existing N/KRAS mutations, and may even accelerate disease progression by promoting the growth of the N/KRAS-MT subclone (Fig. 4g–i and Extended Data Fig. 11c). Consistent with this, we recently reported rapid selection of RAS-MT subclones in patients with AML treated with VEN45. Our findings also provide strong rationale for combining VEN with MCL1 inhibitors and potentially BCL-xL inhibitors, as well as RASi, as frontline therapy in patients with detectable RASmut or all eligible patients46,47.
The malignant cells in AML are the product of two orthogonal processes: one that stems from the clonal evolution of genetic clones and subclones through the sequential acquisition of driver genetic lesions; and one that arises from a differentiation hierarchy in each genetic clone and subclone wherein AML LSCs give rise to more differentiated progeny48. Our study shows how these intersect and affect each other, specifically how a specific cell differentiation state along the myeloid lineage is selected by mutant RAS as the target cell of transformation and how this, in turn, changes the hierarchical structure of the resulting leukaemia to one more biased towards mature monocytic output. It has long been debated whether the phenotype of leukaemic blasts is determined by the degree of differentiation of the LSC cell-of-origin or, alternatively, by the transforming event and its effects on the developmental program of the LSCs49. Our results propose a new paradigm, whereby the oncogenic event (RASmut) selects for a specific differentiation state of a progenitor cell (a GMP) that is the target cell of transformation, with the resulting blast phenotype (monocytic differentiation) being the result of the interaction between both the target cell type and the mutational event. Furthermore, we show that this interaction between the genetic and developmental AML hierarchy determines not only the phenotype, but also critical properties of the disease, with far-reaching implications for its treatment. In view of our findings, more such dependencies between genetic and non-genetic determinants of AML pathogenesis are likely to exist that await discovery and can potentially inform clinical practice.
Methods
Gene editing of human iPS cells
We used the previously described normal iPS cell line N-2.12-D-1-1 as the parental line to generate all CRISPR–Cas9-edited lines described in this study, unless otherwise specified36. For the edited lines described in Extended Data Fig. 2d, we used a patient-derived RUNX1-FPD line harbouring a heterozygous RUNX1 mutation (NM_00100189: c.533-1G>T) as parental line50,51. The gene editing strategies used to generate ASXL1C terminus truncation, SRSF2P95L mutation, NRASG12D mutation and FLT3-ITD were described previously27,28,52. Several independent clones with each mutation were isolated after each gene editing step and, following genetic and preliminary phenotypic characterization to exclude potential outliers, one clone was selected for each subsequent editing step.
We used CRISPR–Cas9-mediated homology-directed repair (HDR) to introduce the DNMT3AR882H mutation using co-delivery of a mutant and a WT donor template (Extended Data Fig. 2a) as previously described27. Nucleofection of a plasmid expressing the gRNA and Cas9 with mCitrine and clone selection by restriction fragment length polymorphism analysis were performed as previously described27. In brief, the N-2.12-D-1-1 iPS cell line was cultured in hESC medium containing 10 mM Y-27632 for at least 1 h before nucleofection. The cells were dissociated into single cells with accutase and 1 million cells were used for nucleofection with 5 µg of gRNA/Cas9 plasmid and 5 µg of each donor plasmid (WT and G12D) using Nucleofector II (Lonza). mCitrine+ cells were FACS-sorted 48 h after transfection and plated at clonal density. Single colonies were screened by PCR and restriction fragment length polymorphism analysis with DdeI restriction enzyme.
An NRASG12D iPS cell line (NRAS-66) was engineered to introduce a TRE-driven Cas9 and the M2rtTA in the two alleles of the AAVS1 locus (Extended Data Fig. 2f) by TALEN-mediated gene targeting, as described53.
Human iPS cell culture and haematopoietic differentiation
Derivation of the AML-9.9, AML-4.10, AML-4.24, N-2.12, AML-37.16 and AML-47.1 iPS cell lines has been described previously28,30,36. Human iPS cells were cultured on mitotically inactivated mouse embryonic fibroblasts as described previously52. Haematopoietic differentiation used a spin-EB protocol as described previously52. For monocytic differentiation, day 11–16 HSPCs were transferred to StemPro-34 SFM medium with 1% non-essential amino acids, 1 mM l-glutamine and 0.1 mM β-mercaptoethanol, supplemented with 100 ng ml−1 macrophage colony-stimulating factor and 25 ng ml−1 interleukin-3 for 3–30 days with medium changes every 2 days. In the end of the differentiation culture, the cells were collected and dissociated with accutase into single cells and used for flow cytometry, cytological analyses, VEN treatment or transplantation into immunodeficient mice.
Cytological analyses
Approximately 200,000 cells from liquid haematopoietic differentiation cultures were washed twice with PBS containing 2% FBS and resuspended in PBS. Cytospins were prepared on slides using a Shandon CytoSpin III cytocentrifuge (Thermo Electron). Slides were then air-dried for 30 mins and stained with the Hema 3 staining kit (Fisher Scientific). The slides were read on a Nikon Eclipse Ci microscope and digital images were taken with a Nikon DS-Ri2 camera and NIS-Elements D4.40.00 software.
Flow cytometry and FACS-sorting
The following antibodies were used: CD34-PE (clone 563, catalogue no. 550761, BD Pharmingen, 1:100 dilution), CD34-BV711 (clone 563, catalogue no. 740803, BD Biosciences, 1:100 dilution), CD45-APC (clone HI30; catalogue no. 555485, BD Pharmingen, 1:100 dilution), mCD45-PE-Cy7 (clone 30-F11, catalogue no. 552848, BD Pharmingen, 1:100 dilution), CD33-BV421 (clone WM53, catalogue no. 562854, BD Biosciences, 1:100 dilution), CD19-PE (clone HIB19, catalogue no. 561741, BD Biosciences, 1:100 dilution), CD19-BV650 (clone HIB19, catalogue no. 740568, BD Biosciences, 1:100 dilution), CD38-PE-Cy7 (clone HIT2, catalogue no. 980312, Biolegend, 1:100 dilution), CD123-BV421 (clone 7G3, catalogue no. 563362, BD Biosciences, 1:20 dilution), CD45RA-APC (clone MEM-56, catalogue no. MHCD45RA05, ThermoFisher Scientific, 1:100 dilution), CD68-PE-Cy7 (clone Y1/82 A, catalogue no. 565595, BD Pharmingen, 1:100 dilution), CD11b-BB515 (clone ICRF44, catalogue no. 564517, BD Biosciences, 1:100 dilution), CD11b-BV650 (clone ICRF44, catalogue no. 301336, Biolegend, 1:100 dilution), CD14-APC (clone M5E2, catalogue no. 555399, BD Biosciences, 1:100 dilution), CD14-BV421 (clone M5E2, catalogue no. 565283, BD Biosciences, 1:100 dilution) and CD271 (LNGFR)- APC-Cy7 (clone ME20.4; catalogue no. 345125, Biolegend, 1:2,000 dilution). Cell viability was assessed with 4,6-diamidino-2-phenylindole (DAPI; Life Technologies). Cells were assayed on a BD Fortessa or BD Symphony A5 SE and data were analysed with FlowJo software (Tree Star). Cells were sorted on a BD FACS Aria II.
iPS- and CB-derived HSPC culture and lentiviral transduction
CB CD34+ cells were purchased from AllCells and cultured in X-VIVO 15 medium with 1% non-essential amino acids, 1 mM l-glutamine, 0.1 mM β-mercaptoethanol and 20% BIT 9500 serum substitute (Stem Cell Technologies) and supplemented with 100 ng ml−1 stem cell factor, 100 ng ml−1 Flt3 ligand, 100 ng ml−1 thrombopoietin and 20 ng ml−1 interleukin-3 for 1–4 days. Lentiviral vector packaging and cell transduction with viral supernatants in the presence of 4 µg ml−1 polybrene were performed as described previously36.
Transplantation into NSG and NSGS mice
All mouse studies were performed in compliance with Icahn School of Medicine at Mount Sinai laboratory animal care regulations and approved by an Institutional Animal Care and Use Committee. NSG (NOD.Cg-PrkdcscidIl2rgtm1Wjl/SzJ) and NSGS (NOD.Cg-PrkdcscidIl2rgtm1WjlTg(CMV IL3,CSF2,KITLG)1Eav/MloySzJ) mice were purchased from Jackson Laboratories and housed at the Center for Comparative Medicine and Surgery at Icahn School of Medicine at Mount Sinai. Female mice at 6–8 weeks of age were used and were assigned randomly to treatment and control groups. Numbers of mice per group were determined on the basis of historical observations. The smallest sample size estimated to provide more than 80% power to detect differences in leukaemic potential was used. Investigators were not blinded. At 1 day before transplantation, the mice were injected intraperitoneally with 30 mg kg−1 busulfan solution. Gene-edited iPS-cell-derived HSPCs from days 12–14 of haematopoietic differentiation, AML-iPS-cell-derived LSCs from days 14–16 of haematopoietic differentiation or cultured CB HSPCs were resuspended in StemPro-34 and injected through the tail vein using a 25G needle at 1 × 10⁶ (for iPS-cell-derived cells) or 2–3 × 10⁵ (for CB cells) per mouse in 100 µl. For Dox administration, mice were fed with Dox chow. For VEN administration, VEN was formulated for oral dosing in 60% phosal 50 propylene glycol, 30% polyethylene glycol 400 and 10% ethanol; 100 mg kg−1 was administered daily for 3 weeks. All mice were euthanized promptly once they showed signs of illness, according to Institutional Animal Care and Use Committee guidelines. Bone marrow was collected from the femurs and tibia. Bone marrow and spleen cells were haemolysed with ACK lysis buffer. Human engraftment was assessed by flow cytometric evaluation using hCD45-APC (clone HI30, BD PharMingen) and mCD45-PE-Cy7 (clone 30-F11, BD Biosciences) antibodies. Human cells were isolated using magnetic activated cell sorting (MACS), using CD45 microBeads (catalogue no. 130-045-801, Miltenyi Biotec) or mouse cell depletion kit (catalogue no. 130-104-694, Miltenyi Biotec), and cryopreserved for subsequent scRNA-seq analyses. For secondary transplantation, cells were obtained from the bone marrow of a primary NSGS recipient on week 6 post-transplantation (endpoint due to lethal disease). Following mouse cell depletion by means of MACS, 2 × 10⁵ cells were injected intravenously in a secondary NSGS mouse, which was euthanized 7 weeks later.
Bulk RNA-seq
Three independent transductions of iPS-HSPCs for each of the four groups (R + SA, R + Ctrl, SA + R, SA + Ctrl; Fig. 2d) were performed. CD34+CD45+ HSPCs were obtained after MACS-sorting of CD45+ cells on a day of differentiation when all cells are CD34+ to obtain double positive CD34+CD45+ HSPCs using the MACS cell separation microbeads and reagents (Miltenyi Biotec). A total of 200,000 sorted cells were used for RNA extraction with the RNeasy mini kit (Qiagen) and 50,000 cells were used for ATAC-seq. PolyA-tailed mRNA was selected with beads from 1 μg total RNA using the NEBNext Poly(A) mRNA Magnetic Isolation Module (New England Biolabs). cDNAs were generated using random hexamers and ligated to barcoded Illumina adaptors with the NEXTflex Rapid Directional RNA-seq Library Prep Kit (Bioo Scientific); 75-nucleotide-long single-end reads were sequenced in a NextSeq-500 (Illumina).
ATAC-seq
A total of 50,000 MACS-sorted CD34+CD45+ cells from the same iPS-HSPC samples used for RNA-seq were processed as follows: nuclei were isolated by lysing with 50 µl of ATAC lysis buffer (10 mM Tris pH 7.4, 10 mM NaCl, 3 mM MgCl2, 0.1% NP40, 0.1% Tween-20 and 0.01% Digitonin) and washing with 1 ml of ATAC wash buffer (10 mM Tris pH 7.4, 10 mM NaCl, 3 mM MgCl2, 0.1% Tween-20). Cell lysates were spun to obtain nuclear pellets, which were subjected to transposase reaction using the Illumina Nextera DNA Sample Preparation Kit according to the manufacturer’s instructions. The final libraries were quantified using the Agilent BioAnalyzer; 75-nucleotide-long paired-end reads were sequenced in a NextSeq-500 (Illumina).
Bulk RNA-seq data processing and analysis
FastQC (v.0.11.8, RRID:SCR_014583) was used for quality control. Trim Galore! (v.0.6.6, RRID:SCR_011847) was used to trim the adapter sequences with a quality threshold of 20. The human reference genome GRCh38 and GENCODE release 36 was used as the transcriptome reference (RRID:SCR_014966). Alignment used STAR aligner (v.2.7.5b, RRID:SCR_004463). Gene-level read counts were obtained using Salmon (v.1.2.1, RRID:SCR_017036) for all libraries. Sample normalization was carried out using the median-ratios normalization method from DESeq2 R package (v.1.30.1, RRID:SCR_015687), and differential expression analysis used DESeq2. Genes with fewer than five reads in total across all samples were filtered out. A gene was considered differentially expressed if the Benjamini–Hochberg adjusted P value was less than 0.05 and the absolute log2FC was greater than 1. Heatmaps were prepared using pheatmap (v.1.0.12) with hierarchical clustering. Barplots were prepared with ggplot2 (v.3.4.3). Over-representation for ‘RAS-late genes’ was analysed using the clusterProfiler R package (v.3.16.0).
Bulk ATAC-seq data processing and analysis
FastQC (v.0.11.8, RRID:SCR_014583) was used for quality control. Trim Galore! (v.0.6.6, RRID:SCR_011847) was used to trim the adapter sequences with default parameters. For each individual sample, paired-end 75-base-pair reads were aligned to the human reference genome (GRCh38/GENCODE release 36, RRID:SCR_014966) using Bowtie2 (v.2.1.0, RRID:SCR_016368) with default parameters and –X 2000. Reads were sorted using SAMtools (v1.11, RRID:SCR_002105), and mitochondrial and pseudo-chromosomal alignments were removed. Picard (v2.2.4, RRID:SCR_006525) was used to remove duplicates (Picard Toolkit 2019). To generate a universe of regions, all samples were merged using SAMtools merge function, followed by peaks calling using MACS (v.2.1.0, RRID:SCR_013291) with parameters –nomodel –nolambda –slocal 10000. Reads for each sample at the universe of regions were quantified using BedTools multicov with the corresponding filtered bam files (v.2.29.2, RRID:SCR_006646). Sample normalization was carried out using the median-ratios normalization method from DESeq2 R package (v.1.30.1, RRID:SCR_015687). Regions with fewer than 750 normalized reads in total across all samples were filtered out and differential peak analysis was carried out using DESeq2 (adjusted P value < 0.05 and absolute log2FC ≥ 2. Coverage tracks (Bigwig files) were generated from filtered BAM files for individual replicates using deepTools (v.3.2.1, RRID:SCR_016366) bamCoverage with parameters –normalizeUsing RPKM –binsize 1.
Cell-type-specific regulatory elements were obtained from ref. 29 The liftOver function from rtracklayer package (v.1.60.1) was used to convert hg19 coordinates to hg38. Distal elements specific to cell types of interest were plotted in heatmap format using deepTools (v.3.2.1) computeMatrix and plotHeatmap functions. Transcription factor motifs were analysed with the Homer (v.4.10) findMotifsGenome function. Data were visualized with ggplot2 (v.3.4.3) and dcCompareCurves function from deepStats (v.0.4). The CI threshold for bootstraps was set to 0.95.
Gene set enrichment analysis
GSEA was carried out on all 6,495 C2 curated gene sets from the Molecular Signatures Database (MSigDB, http://www.broadinstitute.org/msigdb) using the ‘fgsea’ R package (v.1.22 RRID:SCR_020938). Genes were ranked on the basis of log2FC multiplied by −log10FDR (false discovery rate). GSEA P values were adjusted to control for FDR using the Benjamini–Hochberg method. Gene sets with FDR < 0.05 were considered to show significant enrichment.
GSEA was also applied to gene sets derived from ref. 14, corresponding to the populations LSPC-Quiescent, LSPC-Primed, LSPC-Cycle, GMP-like, ProMono-like, Mono-like and cDC-like.
scRNA-seq
Chromium 10x Genomics 3′ protocol (v.3.0) was used for scRNA-seq in cells from MACS-sorted iPS-cell-derived xenografts and on FACS-sorted CB HSPCs.
scRNA-seq data quality control and preprocessing
The FASTQ files were aligned, filtered, barcoded and unique molecular identifier (UMI) counted using CellRanger Chromium Single Cell RNA-seq by 10x Genomics (v.7.1.0 or v.5.0.1), with GRCh38 database (v.2020-A) as the human genome reference. Each dataset was filtered to retain cells with at least 1,000 UMIs, at least 1,000 genes expressed and less than 15% of the reads mapping to the mitochondrial genome. UMI counts were then normalized so that each cell had a total of 10,000 UMIs across all genes, and these normalized counts were log-transformed with a pseudocount of 1 using the ‘LogNormalize’ function in the Seurat package. The top 2,000 most highly variable genes were identified using the ‘vst’ selection method of ‘FindVariableFeatures’ function and counts were scaled using the ‘ScaleData’ function. Datasets were processed using the Seurat package (v.4.0.3)54.
scRNA-seq data dimensionality reduction and integration
Principal component analysis was carried out using the top 2,000 highly variable features (‘RunPCA’ function) and the top 30 principal components were used in the downstream analysis. Diffusion maps were generated as implemented in the destiny (v.3.4.0) R package55 with default parameters and using 10,000 subsampled cells from each integrated dataset. Datasets for each patient were integrated separately by using the ‘RunHarmony’ function in the harmony package (v.0.1.0). K-nearest neighbour graphs were obtained by using the ‘FindNeighbors’ function, whereas the UMAPs were obtained by the ‘RunUMAP’ function56. The Louvain algorithm was used to cluster cells on the basis of expression similarity. Cell density estimations were performed using the stat_density_2d function of the ggplot2 (v.3.3.5) package.
scRNA-seq data cell type annotation
Differential markers for each cluster were identified using the Wilcox test (‘FindAllMarkers’ function) with adjusted P value < 0.01, absolute log2FC > 0.25 and greater than 10% of cells expressing the gene in both comparison groups using 1,000 random cells to represent each cluster. The top upregulated genes and curated genes from the literature were used to assign cell types to the clusters. Metaclusters were obtained by merging the manually annotated cell types into groups. Cell type frequencies between samples were compared using logistic regression (GLM R function, stats package v.4.3.1).
Genotyping of transcriptomes
A bone marrow mononuclear cell sample was obtained from a patient with AML with written informed consent under a protocol approved by a local Institutional Review Board at Memorial Sloan-Kettering Cancer Center. The sample was FACS-sorted to deplete lymphoid cells and enrich blast populations (DAPI−CD45+CD3−CD20−CD19−CD34+CD117+) and processed using the 10x Genomics 5′ V1 Gene Expression protocol. The FASTQ files were aligned and the cell-by-gene count matrix was generated with CellRanger v.5.0.1 with GRCh38 as the human genome reference using default parameters. The data were filtered to retain cells with less than 20% of reads mapping to the mitochondrial genome, at least 200 genes detected, and at least 4,000 UMIs. Downstream analyses were performed using Seurat v.4 in R 4.0.
Full length cDNA from the 10x library preparation was set aside for GoT. Amplicon libraries for NRAS G12D were generated and sequenced on an Illumina MiniSeq 300 cycle mid-output kit in 147:8:16:147 configuration. Resulting FASTQ files were processed as described above for the gene expression library. Mutation status of single cells was determined by performing a pileup of both gene expression and GoT data at the NRASG12 genomic location. Cells were assigned as NRAS MT if one or more mutant UMIs was detected, and as WT if two or more UMIs with only WT alleles were detected. This increased stringency for WT cells was used to account for allelic dropout. The genotyping efficiency was 8.3%, with 576 cells genotyped as NRAS-MT and 423 as NRAS-WT.
Association of SAR mutations with phenotypic AML features in a patient cohort
Bulk RNA-seq data from 599 adult patients with AML from the Alliance Cohort33, for whom FAB subtype clinical annotations and bulk targeted DNA sequencing data were also available, were used to analyse cell type composition. Cell type fractions were determined using cell-type-specific gene expression profiles derived from a scRNA-seq AML dataset (GSE230559) using dampened weighted least squares57.
Clinical trial
The analysis presented in this manuscript included patients with AML who received frontline therapy with DEC and VEN on a prospective clinical trial at the University of Texas MD Anderson Cancer Center, Houston, TX (NCT03404193). Patients were included if they were 60 years old or older, or unfit to receive intensive chemotherapy. Patients with European LeukaemiaNet (ELN) favorable risk cytogenetics and previous BCL2 inhibitor exposure were excluded. DEC was dosed at 20 mg m−2 for 10 days for induction, followed by 5 days after achievement of a response. VEN was dosed at 400 mg daily or equivalent in conjunction with azole antifungals. Endpoints and outcomes were assessed per the ELN 2017 or ELN 2022 (extended cohort) guidelines58. The full protocol has been described previously19. Monocytic differentiation was determined by flow cytometric assessment, esterase positivity, myelomonocytic (FAB M4) or monoblastic/monocytic (FAB M5) morphology35. Measurable residual disease was assessed using multiparametric flow cytometry with sensitivity of 0.1% (ref. 59). All studies were conducted with informed consent in accordance with Declaration of Helsinki ethical guidelines.
VEN treatment and viability assay
iPS-cell-derived HSPCs, iPS-cell-derived monocytes and CB-derived HSPCs were plated on 96-well tissue culture-treated clear flat-bottom plates (Corning, catalogue nos. 3903 or 3603, respectively) at a density of 20,000 per well. VEN was purchased from Selleckchem and dissolved in DMSO for stock solutions at a concentration of 10 mM and subsequently diluted in StemPro medium and added to a total volume of 100 μl of medium per well at a final concentration of 6 μM in triplicate wells. RASi was obtained from Chemed (catalogue no. C-1418) and was added to the cultures at a final concentration of 100 nM in triplicate wells. After 3 days, cell viability was measured using the CellTiter-Glo Luminescent Cell Viability Assay (Promega, catalogue no. G7570) per the manufacturer’s suggested conditions. Per cent viability at each compound concentration was calculated as: (Signal)/(DMSO control) × 100. Half-maximal inhibitory concentration value calculations and generation of half-maximal inhibitory concentration curves were performed using the Prism v.8 software (Graphpad, RRID:SCR_002798).
Western blotting
A total of 1–2 × 10⁵ iPS-cell- or CB-derived HSPCs were lysed with SDS sample buffer (ThermoFisher Scientific) supplemented with protease inhibitor and phosphatase inhibitor. Protein concentration was determined by bicinchoninic acid assay (Pierce Biotechnology Inc.) and 1–2 μg of protein from each extract was diluted in Laemmli SDS sample buffer, resolved by electrophoresis on Bolt 10% Bis-Tris precast gels (Invitrogen) and blotted on nitrocellulose membranes. The membranes were blocked with PVDF blocking reagent (TOYOBO) and incubated with primary antibodies: P-p44/42 MAPK (ERK1/2, clone D13.14.4E, catalogue no. 4370S, Cell Signaling Technologies, 1:5,000 dilution), p44/42 MAPK (ERK1/2, clone L34F12, catalogue no. 4696S, Cell Signaling Technologies, 1:5,000 dilution,), BCL2 (clone 124, catalogue no. M0887, DAKO, 1:5,000 dilution), MCL1 (clone D35A5, catalogue no. 5453S, Cell Signaling Technologies, 1:1,000 dilution), BCL-xL (clone 54H6, catalogue no. 2764S, Cell Signaling Technologies,1:5,000 dilution), β-actin (clone 13E5, catalogue no. 5125S, Cell Signaling Technologies, 1:10,000 dilution). After washing, blots were incubated with horseradish peroxidase-conjugated secondary antibody and developed using Western Blotting Detection Reagent (Western HRP Substrate, Millipore). For each antibody, independent blots were used from the same cell lysate with identical loading conditions.
Statistical analysis
Statistical analysis used GraphPad Prism software. Pairwise comparisons between different groups were performed using a two-sided unpaired unequal variance t-test (Stats R package v.4.3.1), unless stated otherwise. For all analyses, P < 0.05 was considered statistically significant. Investigators were not blinded to the different groups.
Reporting summary
Further information on research design is available in the Nature Portfolio Reporting Summary linked to this article.
Online content
Any methods, additional references, Nature Portfolio reporting summaries, source data, extended data, supplementary information, acknowledgements, peer review information; details of author contributions and competing interests; and statements of data and code availability are available at 10.1038/s41586-024-08137-x.
Supplementary information
Supplementary Discussion, Figs. 1–4, Tables 1, 5, 6 and References.
List of RAS-late genes.
List of RAS-late peaks.
List of 65 genes related to RAS signalling found selectively upregulated by late RAS (Extended Data Fig. 6h, cluster 4).
Source data
Acknowledgements
This work was supported by US National Institutes of Health (NIH) grants R01CA271418, R01CA260711 and R01CA271331, by a Leukemia and Lymphoma Society (LLS) Blood Cancer Discoveries Grant, by an Edward P. Evans Foundation Discovery Research Grant, by a RUNX1 Research Program grant and by a 2021 AACR-MPM Oncology Charitable Foundation Transformative Cancer Research Grant (grant number 21-20-45-PAPA) to E.P.P. This work was also supported by US NIH grants R01CA235622 to M.K. and R01HL157387 and R33CA267219 to D.A.L. M.S. was supported by US NIH grant F31CA254130. S.S.C. was supported by NIH grant R37CA273232, Department of Defense Grant W81XWH-22-1-0857 and Cancer Prevention Institute of Texas grant RR180046. P.L. was supported in part by NIH grants R01CA23074501, R01CA23026701, R01CA279264 and P01CA129243. A.M. was supported by a grant from the Gateway for Cancer Research. C.D.D. was supported by a LLS Scholar in Clinical Research Award. This study was supported in part by the MD Anderson Cancer Center Support Grant CA016672 from the US NIH National Cancer Institute. This work was supported in part by the Bioinformatics for Next Generation Sequencing (BiNGS) shared resource facility of the Tisch Cancer Institute at the Icahn School of Medicine at Mount Sinai, which is partially supported by US NIH Cancer Center Support grant P30CA196521. This work was also supported in part by the computational resources and staff expertise provided by Scientific Computing at the Icahn School of Medicine at Mount Sinai, supported by the Clinical and Translational Science Awards (CTSA) grant UL1TR004419 from the National Center for Advancing Translational Sciences. Research reported in this paper was also supported by the NIH Office of Research Infrastructure award S10OD026880.
Extended data figures and tables
Author contributions
J.S. performed most of the experiments, analysed data and prepared the figures. H.M., N.C.-R., T.W., M.O., E.O., M.J., B.K., F.H., S.S.C. and E.W. performed experiments and analysed data. S.C., G.U., L.E.T., B.N., D.D. and D.H. performed bioinformatics analyses and prepared figures. M.S., R.C., D.A.L. and E.P. performed the GoT experiments and analysed data. A.M., C.D.D. and M.K. analysed clinical trial data. L.S. and A.-K.E. provided materials and patient datasets. P.L. provided the RASi. M.K. and E.P.P. designed the study and interpreted data. E.P.P. wrote the manuscript and supervised the study. J.S., S.C., M.S. and A.M. contributed equally as first authors; H.M., G.U., L.E.T., N.C.-R. & T.W. contributed equally as second authors.
Peer review
Peer review information
Nature thanks Peter van Galen, Dominique Bonnet and the other, anonymous, reviewer(s) for their contribution to the peer review of this work. Peer reviewer reports are available.
Data availability
RNA-seq, ATAC-seq and scRNA-seq data have been deposited in the NCBI Gene Expression Omnibus under the accession number GSE253715. Alignment was performed using the GRCh38 reference genome (v.36; https://www.gencodegenes.org/human/release_36.html). Source data are provided with this paper.
Competing interests
M.K. receives research support from Klondike, AbbVie and Janssen, and consulting fees from AbbVie, Syndax, Novartis, Servier, AbbVie, Menarini-Stemline Therapeutics, Adaptive, Dark Blue Therapeutics, MEI Pharma, Legend Biotech, Sanofi Aventis, Auxenion GmbH, Vincerx, Curis, Intellisphere and Janssen. D.A.L. is an advisory board member of Mission Bio, Veracyte, Pangea and Alethiomics and has received research support from Ultima Genomics unrelated to this work. A.M. receives research support from Chimeric Therapeutics, Lin Biosciences, Hibercell Inc., Qurient and Molecular Templates, Inc. C.D.D. has received consulting fees from Abbvie, AstraZeneca, Astellas, GenMab, Notable Labs, Rigel and Servier. E.P. is cofounder of, and holds a fiduciary role in Isabl Inc. P.L. has received grants to his Institution from Amgen, Mirati, Revolution Medicines, Boehringer Ingelheim and Virtec Pharmaceuticals. P.L. is an advisory board member of Frontier Medicines, Ikena, Biotheryx and PAQ-Tx (consulting fees and equity in each) and has received consulting fees or honoraria from Black Diamond Therapeutics, AmMax, OrbiMed, PAQ-Tx, Repare Therapeutics, Boehringer Ingelheim and Revolution Medicines. EPP has received consulting fees or honoraria from Janssen, Daiichi Sankyo and Cellarity, unrelated to the current study. The other authors declare no competing interests.
Footnotes
Publisher’s note Springer Nature remains neutral with regard to jurisdictional claims in published maps and institutional affiliations.
These authors contributed equally: Junya Sango, Saul Carcamo, Maria Sirenko, Abhishek Maiti
Extended data
is available for this paper at 10.1038/s41586-024-08137-x.
Supplementary information
The online version contains supplementary material available at 10.1038/s41586-024-08137-x.
References
- 1.Papaemmanuil, E. et al. Genomic classification and prognosis in acute myeloid leukemia. N. Engl. J. Med.374, 2209–2221 (2016). [DOI] [PMC free article] [PubMed] [Google Scholar]
- 2.Papaemmanuil, E. et al. Clinical and biological implications of driver mutations in myelodysplastic syndromes. Blood122, 3616–3627 (2013). [DOI] [PMC free article] [PubMed] [Google Scholar]
- 3.Miles, L. A. et al. Single-cell mutation analysis of clonal evolution in myeloid malignancies. Nature587, 477–482 (2020). [DOI] [PMC free article] [PubMed] [Google Scholar]
- 4.Morita, K. et al. Clonal evolution of acute myeloid leukemia revealed by high-throughput single-cell genomics. Nat. Commun.11, 5327 (2020). [DOI] [PMC free article] [PubMed] [Google Scholar]
- 5.Menssen, A. J. et al. Convergent clonal evolution of signaling gene mutations is a hallmark of myelodysplastic syndrome progression. Blood Cancer Discov.3, 330–345 (2022). [DOI] [PMC free article] [PubMed] [Google Scholar]
- 6.Makishima, H. et al. Dynamics of clonal evolution in myelodysplastic syndromes. Nat. Genet.49, 204–212 (2017). [DOI] [PMC free article] [PubMed] [Google Scholar]
- 7.Levine, A. J., Jenkins, N. A. & Copeland, N. G. The roles of initiating truncal mutations in human cancers: the order of mutations and tumor cell type matters. Cancer Cell35, 10–15 (2019). [DOI] [PMC free article] [PubMed] [Google Scholar]
- 8.Kent, D. G. & Green, A. R. Order matters: the order of somatic mutations influences cancer evolution. Cold Spring Harb. Perspect. Med.7, a027060 (2017). [DOI] [PMC free article] [PubMed] [Google Scholar]
- 9.Prior, I. A., Hood, F. E. & Hartley, J. L. The frequency of Ras mutations in cancer. Cancer Res.80, 2969–2974 (2020). [DOI] [PMC free article] [PubMed] [Google Scholar]
- 10.Lapidot, T. et al. A cell initiating human acute myeloid leukaemia after transplantation into SCID mice. Nature367, 645–648 (1994). [DOI] [PubMed] [Google Scholar]
- 11.Bonnet, D. & Dick, J. E. Human acute myeloid leukemia is organized as a hierarchy that originates from a primitive hematopoietic cell. Nat. Med.3, 730–737 (1997). [DOI] [PubMed] [Google Scholar]
- 12.Bennett, J. M. et al. Proposals for the classification of the acute leukaemias. French-American-British (FAB) co-operative group. Br. J. Haematol.33, 451–458 (1976). [DOI] [PubMed] [Google Scholar]
- 13.Shlush, L. I. et al. Tracing the origins of relapse in acute myeloid leukaemia to stem cells. Nature547, 104–108 (2017). [DOI] [PubMed] [Google Scholar]
- 14.Zeng, A. G. X. et al. A cellular hierarchy framework for understanding heterogeneity and predicting drug response in acute myeloid leukemia. Nat. Med.28, 1212–1223 (2022). [DOI] [PubMed] [Google Scholar]
- 15.Ng, S. W. et al. A 17-gene stemness score for rapid determination of risk in acute leukaemia. Nature540, 433–437 (2016). [DOI] [PubMed] [Google Scholar]
- 16.Konopleva, M. et al. Efficacy and biological correlates of response in a phase II study of venetoclax monotherapy in patients with acute myelogenous leukemia. Cancer Discov.6, 1106–1117 (2016). [DOI] [PMC free article] [PubMed] [Google Scholar]
- 17.DiNardo, C. D. et al. Azacitidine and venetoclax in previously untreated acute myeloid leukemia. N. Engl. J. Med.383, 617–629 (2020). [DOI] [PubMed] [Google Scholar]
- 18.Souers, A. J. et al. ABT-199, a potent and selective BCL-2 inhibitor, achieves antitumor activity while sparing platelets. Nat. Med.19, 202–208 (2013). [DOI] [PubMed] [Google Scholar]
- 19.DiNardo, C. D. et al. 10-day decitabine with venetoclax for newly diagnosed intensive chemotherapy ineligible, and relapsed or refractory acute myeloid leukaemia: a single-centre, phase 2 trial. Lancet Haematol.7, e724–e736 (2020). [DOI] [PMC free article] [PubMed] [Google Scholar]
- 20.Wei, A. H. et al. Venetoclax plus LDAC for newly diagnosed AML ineligible for intensive chemotherapy: a phase 3 randomized placebo-controlled trial. Blood135, 2137–2145 (2020). [DOI] [PMC free article] [PubMed] [Google Scholar]
- 21.Kadia, T. M. et al. Phase II study of venetoclax added to cladribine plus low-dose cytarabine alternating with 5-azacitidine in older patients with newly diagnosed acute myeloid leukemia. J. Clin. Oncol.40, 3848–3857 (2022). [DOI] [PMC free article] [PubMed] [Google Scholar]
- 22.Pei, S. et al. Monocytic subclones confer resistance to venetoclax-based therapy in patients with acute myeloid leukemia. Cancer Discov.10, 536–551 (2020). [DOI] [PMC free article] [PubMed] [Google Scholar]
- 23.Kuusanmaki, H. et al. Phenotype-based drug screening reveals association between venetoclax response and differentiation stage in acute myeloid leukemia. Haematologica105, 708–720 (2020). [DOI] [PMC free article] [PubMed] [Google Scholar]
- 24.Zhang, H. et al. Integrated analysis of patient samples identifies biomarkers for venetoclax efficacy and combination strategies in acute myeloid leukemia. Nat. Cancer1, 826–839 (2020). [DOI] [PMC free article] [PubMed] [Google Scholar]
- 25.Stahl, M. et al. Clinical and molecular predictors of response and survival following venetoclax therapy in relapsed/refractory AML. Blood Adv.5, 1552–1564 (2021). [DOI] [PMC free article] [PubMed] [Google Scholar]
- 26.Waclawiczek, A. et al. Combinatorial BCL2 family expression in acute myeloid leukemia stem cells predicts clinical response to azacitidine/venetoclax. Cancer Discov.13, 1408–1427 (2023). [DOI] [PMC free article] [PubMed] [Google Scholar]
- 27.Wang, T. et al. Sequential CRISPR gene editing in human iPSCs charts the clonal evolution of myeloid leukemia and identifies early disease targets. Cell Stem Cell28, 1074–1089 e1077 (2021). [DOI] [PMC free article] [PubMed] [Google Scholar]
- 28.Kotini, A. G. et al. Stage-specific human induced pluripotent stem cells map the progression of myeloid transformation to transplantable leukemia. Cell Stem Cell20, 315–328 e317 (2017). [DOI] [PMC free article] [PubMed] [Google Scholar]
- 29.Corces, M. R. et al. Lineage-specific and single-cell chromatin accessibility charts human hematopoiesis and leukemia evolution. Nat. Genet.48, 1193–1203 (2016). [DOI] [PMC free article] [PubMed] [Google Scholar]
- 30.Kotini, A. G. et al. Patient-derived iPSCs faithfully represent the genetic diversity and cellular architecture of human acute myeloid leukemia. Blood Cancer Discov.4, 318–335 (2023). [DOI] [PMC free article] [PubMed] [Google Scholar]
- 31.Nam, A. S. et al. Somatic mutations and cell identity linked by genotyping of transcriptomes. Nature571, 355–360 (2019). [DOI] [PMC free article] [PubMed] [Google Scholar]
- 32.Velten, L. et al. Human haematopoietic stem cell lineage commitment is a continuous process. Nat. Cell Biol.19, 271–281 (2017). [DOI] [PMC free article] [PubMed] [Google Scholar]
- 33.Lasry, A. et al. An inflammatory state remodels the immune microenvironment and improves risk stratification in acute myeloid leukemia. Nat Cancer4, 27–42 (2023). [DOI] [PMC free article] [PubMed] [Google Scholar]
- 34.Bernard, E. et al. Molecular international prognostic scoring system for myelodysplastic syndromes. NEJM Evid.1, EVIDoa2200008 (2022). [DOI] [PubMed] [Google Scholar]
- 35.Matarraz, S. et al. Introduction to the diagnosis and classification of monocytic-lineage leukemias by flow cytometry. Cytometry B Clin. Cytom.92, 218–227 (2017). [DOI] [PubMed] [Google Scholar]
- 36.Kotini, A. G. et al. Functional analysis of a chromosomal deletion associated with myelodysplastic syndromes using isogenic human induced pluripotent stem cells. Nat. Biotechnol.33, 646–655 (2015). [DOI] [PMC free article] [PubMed] [Google Scholar]
- 37.Bhatt, S. et al. Reduced mitochondrial apoptotic priming drives resistance to BH3 mimetics in acute myeloid leukemia. Cancer Cell38, 872–890 e876 (2020). [DOI] [PMC free article] [PubMed] [Google Scholar]
- 38.Pan, R. et al. Selective BCL-2 inhibition by ABT-199 causes on-target cell death in acute myeloid leukemia. Cancer Discov.4, 362–375 (2014). [DOI] [PMC free article] [PubMed] [Google Scholar]
- 39.Maiti, A. et al. Outcomes of relapsed or refractory acute myeloid leukemia after frontline hypomethylating agent and venetoclax regimens. Haematologica106, 894–898 (2021). [DOI] [PMC free article] [PubMed] [Google Scholar]
- 40.Schulze, C. J. et al. Chemical remodeling of a cellular chaperone to target the active state of mutant KRAS. Science381, 794–799 (2023). [DOI] [PMC free article] [PubMed] [Google Scholar]
- 41.Holderfield, M. et al. Concurrent inhibition of oncogenic and wild-type RAS-GTP for cancer therapy. Nature629, 919–926 (2024). [DOI] [PMC free article] [PubMed]
- 42.Pearce, D. J. et al. AML engraftment in the NOD/SCID assay reflects the outcome of AML: implications for our understanding of the heterogeneity of AML. Blood107, 1166–1173 (2006). [DOI] [PMC free article] [PubMed] [Google Scholar]
- 43.Eppert, K. et al. Stem cell gene expression programs influence clinical outcome in human leukemia. Nat. Med.17, 1086–1093 (2011). [DOI] [PubMed] [Google Scholar]
- 44.Pei, S. et al. A novel type of monocytic leukemia stem cell revealed by the clinical use of venetoclax-based therapy. Cancer Discov.13, 2032–2049 (2023). [DOI] [PMC free article] [PubMed] [Google Scholar]
- 45.Zhang, Q. et al. Activation of RAS/MAPK pathway confers MCL-1 mediated acquired resistance to BCL-2 inhibitor venetoclax in acute myeloid leukemia. Signal Transduct. Target Ther.7, 51 (2022). [DOI] [PMC free article] [PubMed] [Google Scholar]
- 46.Carter, B. Z. et al. Maximal activation of apoptosis signaling by cotargeting antiapoptotic proteins in BH3 mimetic-resistant AML and AML stem cells. Mol. Cancer Ther.21, 879–889 (2022). [DOI] [PMC free article] [PubMed] [Google Scholar]
- 47.Caenepeel, S. et al. AMG 176, a selective MCL1 inhibitor, is effective in hematologic cancer models alone and in combination with established therapies. Cancer Discov.8, 1582–1597 (2018). [DOI] [PubMed] [Google Scholar]
- 48.Kreso, A. & Dick, J. E. Evolution of the cancer stem cell model. Cell Stem Cell14, 275–291 (2014). [DOI] [PubMed] [Google Scholar]
- 49.Wang, J. C. & Dick, J. E. Cancer stem cells: lessons from leukemia. Trends Cell Biol.15, 494–501 (2005). [DOI] [PubMed] [Google Scholar]
- 50.Song, W. J. et al. Haploinsufficiency of CBFA2 causes familial thrombocytopenia with propensity to develop acute myelogenous leukaemia. Nat. Genet.23, 166–175 (1999). [DOI] [PubMed] [Google Scholar]
- 51.Krutein, M. C. et al. Restoring RUNX1 deficiency in RUNX1 familial platelet disorder by inhibiting its degradation. Blood Adv.5, 687–699 (2021). [DOI] [PMC free article] [PubMed] [Google Scholar]
- 52.Chang, C. J. et al. Dissecting the contributions of cooperating gene mutations to cancer phenotypes and drug responses with patient-derived iPSCs. Stem Cell Rep.10, 1610–1624 (2018). [DOI] [PMC free article] [PubMed] [Google Scholar]
- 53.Gonzalez, F. et al. An iCRISPR platform for rapid, multiplexable, and inducible genome editing in human pluripotent stem cells. Cell Stem Cell15, 215–226 (2014). [DOI] [PMC free article] [PubMed] [Google Scholar]
- 54.Butler, A., Hoffman, P., Smibert, P., Papalexi, E. & Satija, R. Integrating single-cell transcriptomic data across different conditions, technologies, and species. Nat. Biotechnol.36, 411–420 (2018). [DOI] [PMC free article] [PubMed] [Google Scholar]
- 55.Angerer, P. et al. destiny: diffusion maps for large-scale single-cell data in R. Bioinformatics32, 1241–1243 (2016). [DOI] [PubMed] [Google Scholar]
- 56.Korsunsky, I. et al. Fast, sensitive and accurate integration of single-cell data with Harmony. Nat. Methods16, 1289–1296 (2019). [DOI] [PMC free article] [PubMed] [Google Scholar]
- 57.Tsoucas, D. et al. Accurate estimation of cell-type composition from gene expression data. Nat. Commun.10, 2975 (2019). [DOI] [PMC free article] [PubMed] [Google Scholar]
- 58.Dohner, H. et al. Diagnosis and management of AML in adults: 2017 ELN recommendations from an international expert panel. Blood129, 424–447 (2017). [DOI] [PMC free article] [PubMed] [Google Scholar]
- 59.Xu, J., Jorgensen, J. L. & Wang, S. A. How do we use multicolor flow cytometry to detect minimal residual disease in acute myeloid leukemia? Clin. Lab. Med.37, 787–802 (2017). [DOI] [PubMed] [Google Scholar]
Associated Data
This section collects any data citations, data availability statements, or supplementary materials included in this article.
Supplementary Materials
Supplementary Discussion, Figs. 1–4, Tables 1, 5, 6 and References.
List of RAS-late genes.
List of RAS-late peaks.
List of 65 genes related to RAS signalling found selectively upregulated by late RAS (Extended Data Fig. 6h, cluster 4).
Data Availability Statement
RNA-seq, ATAC-seq and scRNA-seq data have been deposited in the NCBI Gene Expression Omnibus under the accession number GSE253715. Alignment was performed using the GRCh38 reference genome (v.36; https://www.gencodegenes.org/human/release_36.html). Source data are provided with this paper.


