Abstract
Background:
This study primarily aimed to assess the volumetric attributes of the midbrain and perimesencephalic structures preoperatively and following surgical interventions in patients diagnosed with brain herniation secondary to traumatic brain injury (TBI).
Methods:
We evaluated patients based on radiological findings and clinical symptoms indicative of brain herniation. We performed semi-automated segmentation of the intracranial structures most relevant to trauma and of interest for the current study, such as hematoma, ventricles, midbrain, and perimesencephalic cisterns. Using preoperative and postoperative computed tomography scans, we measured and analyzed the volume of these structures. Patients were grouped based on their discharge Glasgow Coma Scale (GCS) scores: GCS 15 and non-GCS 15.
Results:
From May 2018 to February 2020, we included 20 patients in the study. Our volumetric analysis revealed that preoperative midbrain volume (5.84 cc vs. 4.37 cc, P = 0.034) was a significant differentiator between GCS 15 and non-GCS 15 groups. Preoperative midbrain volume remained significant in univariate (odds ratio [OR] = 2.280, 95% confidence interval (CI) = 1.126–5.929, P = 0.04) and multivariate logistic regression analysis (adjusted OR = 3.204, 95% CI = 1.228–12.438, P = 0.038) even after adjusting for age, sex, and admission GCS score. We identified a cut-off point of 4.86 ccs in preoperative midbrain volume, which demonstrated a discriminatory performance of 0.788 area under the receiver operating characteristic curve, 80.0% accuracy, 77.8% sensitivity, and 81.8% specificity between the two groups.
Conclusion:
Our findings suggest that patients presenting with lesser midbrain compression preoperatively tended to have improved clinical outcomes postsurgery. Thus, we propose that this preoperative midbrain volume cut-off point holds predictive value for clinical outcomes within our cohort.
Keywords: Brain herniation, Hematoma, Midbrain, Traumatic brain injury, Volumetric analysis

INTRODUCTION
The complexities of traumatic brain injuries (TBIs) have become an area of intensive research in recent years, particularly with an emphasis on how anatomical regions such as the perimesencephalic structures and midbrain might impact patient outcomes. Evidence has indicated that these structures could have crucial implications in post-TBI outcomes.[1,3,18]
Moreover, the structural and functional alterations in these regions, especially the midbrain, in determining the severity of TBIs and the subsequent patient recovery processes are also being explored.[2,8,10]
Previous literature on this subject has largely focused on clinical and demographic factors, with less attention paid to the predictive value of anatomical structures discerned through imaging techniques. The advancements in computed tomography scan (CT) and magnetic resonance imaging (MRI) technologies have prompted a need for more extensive investigations into the volumetric attributes of the brain and their possible correlation with TBI prognosis.[4,5,7] However, a comprehensive study analyzing volumetric attributes of the midbrain and perimesencephalic structures and their impact on post-TBI patient outcomes remains limited.
Against this backdrop, our aim in this study is twofold. First, we aim to explore the potential associations between the volumetric attributes of the midbrain and perimesencephalic structures and the prognosis of TBI patients. Second, we aspire to determine whether these measurements can serve as reliable predictors for patient outcomes, specifically focusing on the discharge Glasgow Coma Scale (GCS) score.
MATERIALS AND METHODS
We conducted a retrospective review of prospectively gathered data from a Level II trauma center, collected between May 2018 and February 2020, with the approval of the Icahn School of Medicine at Mount Sinai institutional review board.
Inclusion criteria
We included patients above 18 years of age who suffered a TBI and required surgical treatment for intracranial pathologies such as acute subdural hematoma (SDH), acute-on-chronic SDH, acute brain contusion, and acute epidural hematoma (EDH). The inclusion was further based on clinical or radiological evidence of brain herniation. Clinical signs of brain herniation included a GCS score of <8 upon arrival, sudden GCS decline, or anisocoria. Radiological evidence from the CT included midbrain compression, midline shift, uncal herniation, and compression of mesencephalic cisterns.
Data collection
We compiled demographic and clinical data, encompassing age, sex, admission GCS score, pupillary reactivity, length of stay (LOS), length of intensive care unit (ICU) stay (ICULOS), days on ventilation, Injury Severity Score (ISS), surgical intervention necessity, discharge motor examination, discharge destination, mortality, and discharge GCS score.
CT scans upon arrival and immediately postsurgery were obtained. The standard “trauma protocol” included 5-mm axial slides from the foramen magnum to the vertex. We used the free software 3D Slicer[6] for semiautomated segmentation of CT scans. The segmented structures included “perimesencephalic cistern” (blue sky), “midbrain” (yellow), “right ventricle” (light green), “left ventricle” (dark green), and “hematoma” (red), which encompassed SDH, EDH, and contusions. Each segmentation was meticulously supervised and manually corrected as necessary.
Volumetric analysis
After loading images into 3D Slicer, we employed the automated “Volume/Density” tool, consistent with “brain,” and ensured axial cuts were at 5.0-mm slides. Initially, a semi-automatic volume analysis was conducted, adjusting the desired Hounsfield Units (HU) for each structure. The HU range for “perimesencephalic cistern,” “right ventricle,” and “left ventricle” was set between 0 and 10, matching cerebrospinal fluid (CSF) density. The “midbrain” was set between 20 and 40, consistent with gray and white matter, while the “hematoma” density ranged between 60 and 80 HU. Subsequently, the “Draw” tool was used for manual segmentation, examining all slices and outlining the boundary of the intended structure.
For the midbrain, we defined its boundaries in a caudalrostral and anterior-posterior orientation. The caudal anatomical limit was the mesencephalic-pons groove; rostrally, we selected the final slice where the cerebral peduncle can be identified under the thalamus. Anteriorly, the silhouette of the peduncles and the interpeduncular fossa were used as reference points, while the identification of the quadrigeminal plate demarcated the posterior boundary. In general, midbrain segmentation requires 2 or 3 slides to cover these specified boundaries.
The perimesencephalic cistern was defined based on anatomical landmarks on the CT, including the interpeduncular, crural, ambient, and quadrigeminal cisterns. Given the compression of these cisterns, we incorporated every segment with permeable CSF space around the midbrain, which typically involved 2 or 3 axial slices for analysis.
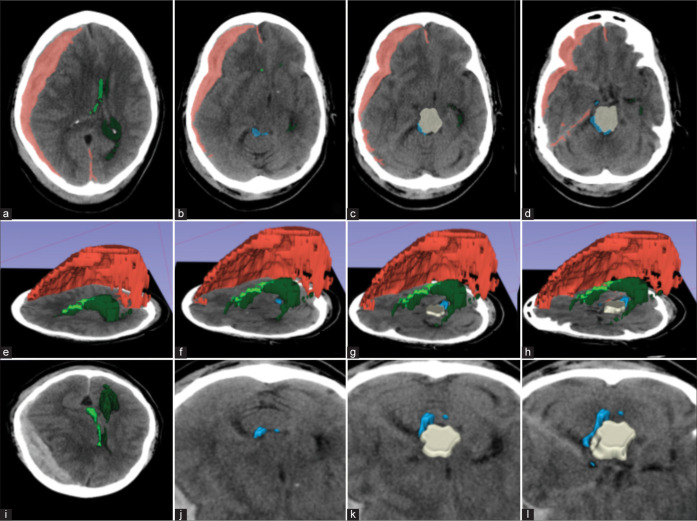
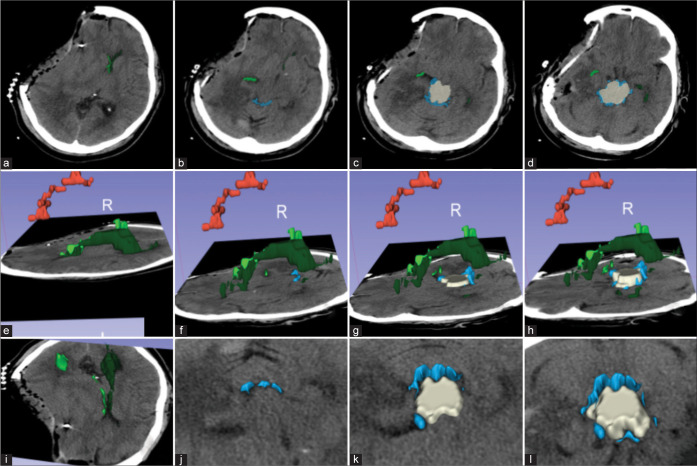
Upon finishing the drawing, we executed the volumetric (expressed in cm3) analysis for the structures of interest. Figures 1 and 2 illustrate an example of the volumetric analysis using this software.
Figure 1:
Example of a patient with large right acute subdural hematoma (red) causing significant mass effect. (a) Axial images showing displacement of the right (light green) and left (dark green) lateral ventricles, (b-d) the perimesencephalic cisterns (blue sky), and the midbrain (beige); (e-h) 3D reconstruction with a left lateral view showing the structures above; (i-l) A frontosuperior view of the axial images showing the compression of the midbrain and partial effacement of perimesencephalic cisterns. Red: Subdural hematoma; beige: midbrain; light green: right lateral ventricles; dark green: left lateral ventricles; blue: perimesencephalic cisterns.
Figure 2:
Assessment of postoperative changes on the same patient as Figure 2. (a) Axial images showing relief of midline shift over the right (light green) and left (dark green) lateral ventricles and a new right cranial defect after a decompressive hemicraniectomy, and (b-d) improvement of the visibility of the perimesencephalic cisterns (blue sky) and midbrain (beige); (e-h) 3D reconstruction with a left lateral view showing residual subdural hematoma and improvement in ventricular diameter; (i-l) A frontosuperior view of the axial images showing improvement over the midbrain compression and perimesencephalic cisterns. Red: Subdural hematoma; beige: midbrain; light green: right lateral ventricles; dark green: left lateral ventricles; blue: perimesencephalic cisterns.
Outcome of interest
The outcome of interest of the current study was the discharge GCS group. Two discharge GCS groups, “GCS 15” and “non-GCS 15”, were obtained by dichotomizing the variable discharge GCS score.
Predictor variables
The predictor variables included (1) clinical and demographic data, including age, sex, admission GCS score, pupil reactivity, LOS, presence of surgical intervention, ICU-LOS, days on ventilation, and ISS; (2) preoperative volumetric measurements, including preoperative hematoma, midbrain, perimesencephalic subarachnoid space (SAS), right ventricle, left ventricle, and total ventricular volumes; (3) postoperative volumetric measurements, including postoperative hematoma, midbrain, perimesencephalic SAS, right ventricle, left ventricle, and total ventricular volumes; and (4) the change in these preoperative and postoperative measurements.
Statistical analysis
We conducted all statistical analyses using R 4.1.3[15] in conjunction with RStudio 2022.02.1 + 461.[16] Descriptive analyses reported means (± standard deviations) for normally distributed continuous variables, medians (interquartile ranges) for nonnormally distributed continuous variables, and counts (percentages) for patients. We used the independent t-test to compare normally distributed continuous variables with equal variances between groups, the Welch’s t-test for normally distributed continuous variables with unequal variances, the Mann–Whitney U test for nonnormally distributed continuous variables, and the Pearson’s Chi-squared test for categorical variables. Normality was tested through the Shapiro–Wilk test and Levene’s test evaluated the equality of variance. For variables derived from preoperative and postoperative volumetric analyses, paired samples t-tests determined any statistically significant differences. Differences were deemed significant at a P-value of 0.05.
In addition to descriptive statistical analyses, we carried out univariate and multivariate logistic regression analyses to inspect the relationship between the variables and the outcome. Initially, a univariate analysis was performed to uncover potential associations of all variables with the outcome defined by the discharge GCS. Variables with a P < 0.05 in the univariate logistic regression analysis were subsequently included in the multivariate analysis, adjusted for age, sex, and admission GCS due to their potential predictive value. Variables with a P < 0.05 in the multivariate logistic regression analysis were considered independent predictors of the outcome. Receiver operating characteristic (ROC) curves and cutoff values for the independent predictors were obtained using the R package, cutpointr.[17]
RESULTS
Table 1 presents demographic and clinical variables of the patient population for both the GCS 15 (n = 9) and GCS<15 (n = 11) groups, as well as the total sample. The LOS, ICU LOS, days on ventilation, and discharge motor examination findings significantly differed between the two groups. Among the variables derived from volumetric analyses, only the preoperative midbrain volume [Figure 3] demonstrated statistical significance [Table 1]. Table 2 contains the results regarding the change in preoperative and postoperative volumetric measurements. It was observed that “hematoma volume” and “perimesencephalic SAS volume” significantly changed post-operatively.
Table 1:
Patient characteristics.
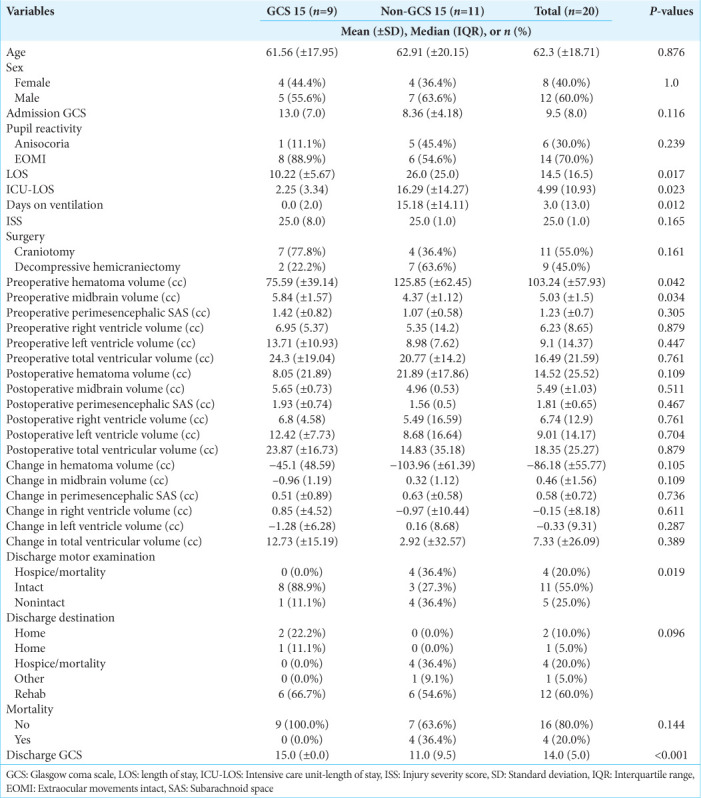
Figure 3:
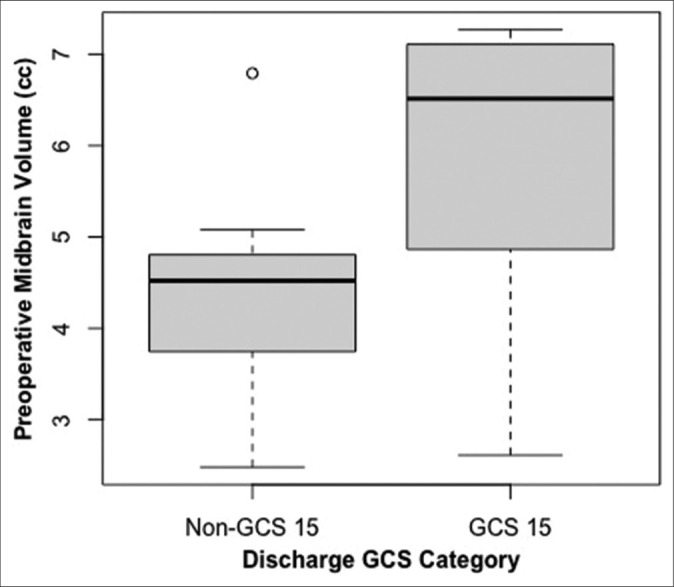
Variation in preoperative midbrain volume comparing discharge Glasgow Coma Scale (GCS) 15 versus non-15 groups. O: Outlier
Table 2:
Changes of the volumetric attributes between preoperative and postoperative measurements.

In the univariate logistic regression analysis [Table 3], the only variable that was found to be statistically significant was the preoperative midbrain volume (odds ratio [OR] = 2.280, 95% confidence interval [CI] = 1.126–5.929, P = 0.043). Since it was the only statistically significant variable, preoperative midbrain volume was the only variable analyzed with the multivariate logistic regression model [Table 4]. When it was adjusted for age, sex, and admission GCS, the preoperative midbrain volume remained statistically significant (adjusted OR = 3.204, 95% CI = 1.228–12.438, P = 0.038) and, therefore, deemed as an independent predictor. With the help of the cutpointr package, 4.864 ccs were found to be the cutoff point with the best discriminatory performance. Using this cutoff point, preoperative midbrain volume classified GCS 15 and non-GCS 15 groups with 80.0% accuracy, 77.8% sensitivity, and 81.8% specificity [Figure 4]. The ROC curve, which has an area under the curve value of 0.788 for the predictive ability of preoperative midbrain volume, is shown in Figure 5.
Table 3:
Univariate logistic regression analysis.
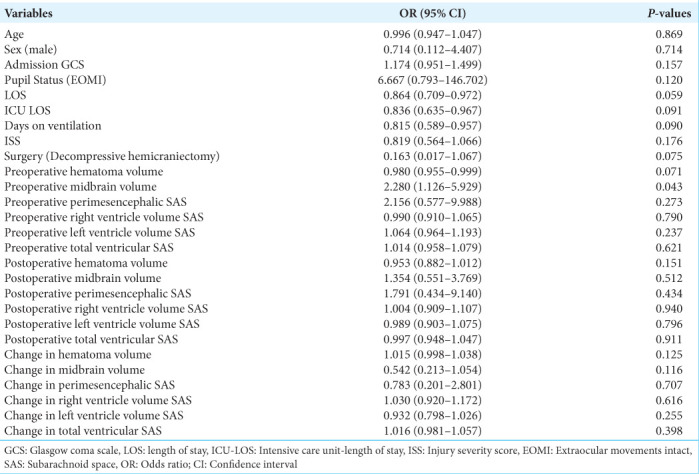
Table 4:
Multivariate logistic regression analysis.

Figure 4:
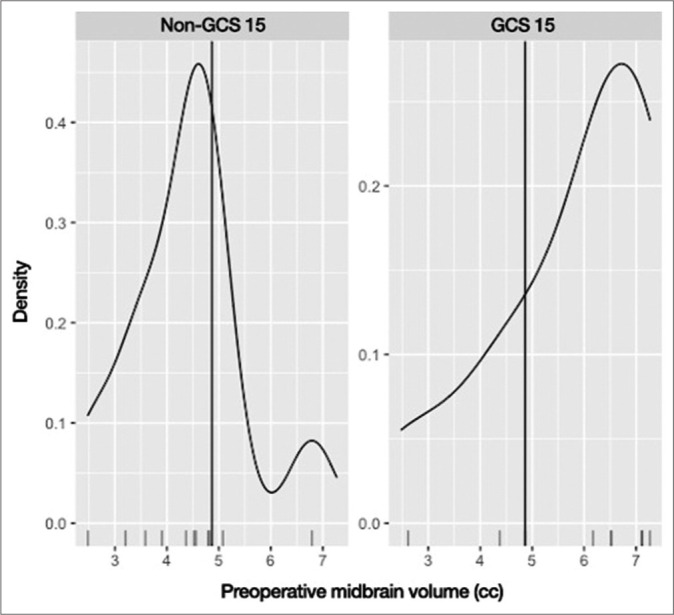
The cutoff point to differentiate between Glasgow Coma Scale (GCS) 15 and non-GCS 15 groups in the midbrain volume was 4.864 cc, with an 80.0% accuracy, 77.8% sensitivity, and 81.8% specificity.
Figure 5:
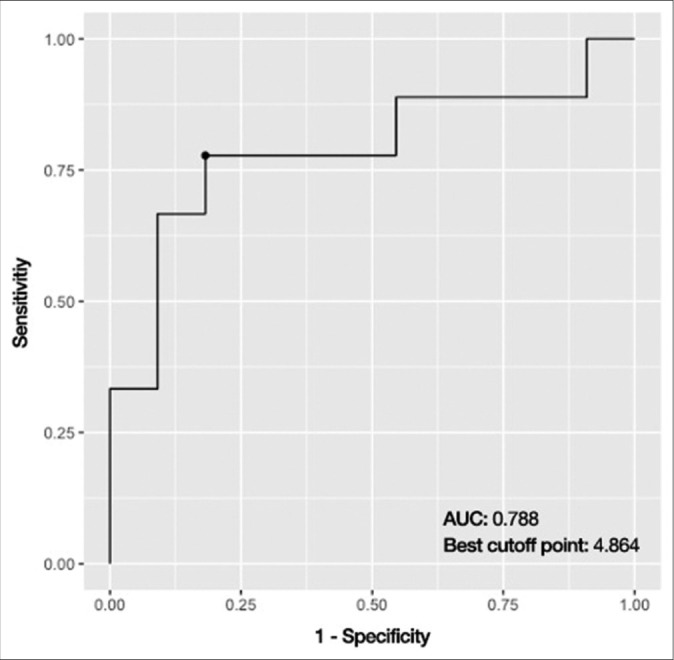
The receiver operating characteristic curve, which has an area under the curve value of 0.788, displays the predictive ability of preoperative midbrain volume. AUC: Area under curve
DISCUSSION
In our study, we found that preoperative midbrain volume emerged as a pivotal prognostic factor in TBI patients who also exhibited brain herniation. Our key finding was that less compression over the midbrain before surgery served as the single most predictive factor in discriminating between patients with a discharge GCS score of 15 and patients with a discharge GCS score of <15. This insight is particularly impactful as it furnishes clinicians with a new measurable and, therefore, actionable data point when handling cases of TBI, especially those that require immediate surgical intervention.
Furthermore, we found that patients in the GCS 15 group had a preoperative midbrain volume of 5.84 cc (SD: ± 1.57) as compared to 4.37 cc (SD: ± 1.12) in patients in the non-GCS 15 group. This stark comparison accentuates the potential of preoperative midbrain volume to function as a distinguishing variable between these two distinct clinical outcome groups. Moreover, our results showcased 4.864 ccs as the optimal cutoff value of the midbrain volume in discerning between the groups, further solidifying its role as a critical parameter in patient prognosis.
It is worth noting that we did not identify any other independent predictors of post-TBI GCS scores after an exhaustive volumetric analysis of other anatomical structures. We did, however, find a larger postoperative volume of the midbrain and perimesencephalic cisterns in patients with a discharge GCS score of 15 compared to patients with a GCS score of <15, but these differences did not attain statistical significance.
Our study aligns with a body of comprehensive research, highlighting the crucial role that cistern integrity plays in foretelling both functional outcomes and mortality rates following a TBI.[9,11,12,14,19] Marshall et al. seminal work reported a mortality rate of 34% in patients exhibiting compressed or absent cisterns and an even more concerning 56.2% in cases where CT imaging revealed a shift exceeding 5 mm.[13] Adding to this, Toutant et al. documented an alarmingly high mortality rate of 77% in patients whose CT scans showed no cisterns, dropping to 39% in cases with compressed cisterns and down to 22% for those with normal cisterns.[19] Expanding upon the Marshall scale, Maas et al. incorporated additional patient features into their study, including intraventricular hemorrhage, traumatic subarachnoid hemorrhage, and an intricate assessment of basal cisterns status and midline shift.[12] Their study underscored that patients with absent or compressed basal cisterns coupled with a midline shift larger than 5 mm faced the highest mortality rate, standing at 44%.[12]
Paralleling our findings, Kayhanian et al. used 3D Slicer software to observe an average basal cistern volume of 7.45 mL in a pediatric cohort comprising 38 TBI patients needing ICP monitoring.[11] They identified that the most predictive threshold of basal cistern volume for indicating high ICP (≥20 mmHg) was a relative volume of 0.0055. This threshold demonstrated a sensitivity of 79% and a specificity of 80%, solidifying the volume of basal cisterns as the singular quantifiable CT parameter having a significant correlation with initial ICP in their pediatric cohort. Within the scope of our research, we observed a remarkable increase of 45% in the volume of perimesencephalic cisterns following surgery. Although this increase did not reach statistical significance in the context of determining patient outcomes, its existence is an intriguing observation, potentially guiding the direction of subsequent research in this field.
Despite the insightful results, our study does have limitations that must be acknowledged. The retrospective nature of our data and the relatively small patient cohort limit the generalizability of our findings. Future prospective studies should aim to validate our observations in a larger patient population. Furthermore, our reliance on preoperative and immediate postoperative CT for volumetric segmentation might not fully capture the long-term radiological changes that correlate with the patient’s clinical outcomes. Finally, our approach of dichotomizing GCS scores into 15 and <15 might oversimplify the diverse range of functional outcomes seen in TBI patients. Future studies should consider additional outcome measures, such as the discharge motor examination, which might offer valuable insights into the patient’s postoperative quality of life.
CONCLUSION
Our study underscores the pivotal prognostic role of preoperative midbrain volume in TBI patients with brain herniation. We demonstrated a discernible difference in preoperative midbrain volume between patients with a discharge GCS score of 15 and those scoring <15, indicating its potential as a crucial, quantifiable parameter for clinicians managing TBI cases requiring immediate surgical intervention. Our finding of an optimal cutoff value for midbrain volume of 4.864 cc further strengthens its significance in patient prognosis. These insights align with existing literature emphasizing the integral role of cistern integrity in predicting outcomes following TBI. Despite our study’s limitations due to its retrospective nature and relatively small cohort size, the results offer promising directions for future, larger-scale prospective studies. The key takeaway from our investigation is the potential for preoperative midbrain volume to serve as a valuable prognostic tool in managing TBI patients.
Footnotes
How to cite this article: Lara-Reyna J, Karabacak M, Wedderburn R, Legome E, Margetis K. Midbrain volume in brain herniation: A volumetric analysis in operative traumatic brain injury. Surg Neurol Int. 2024;15:437. doi: 10.25259/SNI_389_2024
Contributor Information
Jacques Lara-Reyna, Email: jacques.lara.r@gmail.com.
Mert Karabacak, Email: mert.karabacak@mountsinai.org.
Raymond Wedderburn, Email: raymond.wedderburn@mountsinai.org.
Eric Legome, Email: eric.legome@mountsinai.org.
Konstantinos Margetis, Email: konstantinos.margetis@mountsinai.org.
Ethical approval
The research/study was approved by the Institutional Review Board, Mount Sinai School of Medicine, number STUDY-20-01908, dated March 25, 2021.
Declaration of patient consent
The authors certify that they have obtained all appropriate patient consent.
Financial support and sponsorship
Nil.
Conflicts of interest
There are no conflicts of interest.
Use of artificial intelligence (AI)-assisted technology for manuscript preparation
The authors confirm that there was no use of artificial intelligence (AI)-assisted technology for assisting in the writing or editing of the manuscript and no images were manipulated using AI.
Disclaimer
The views and opinions expressed in this article are those of the authors and do not necessarily reflect the official policy or position of the Journal or its management. The information contained in this article should not be considered to be medical advice; patients should consult their own physicians for advice as to their specific medical needs.
REFERENCES
- 1.Abu Hamdeh S, Marklund N, Lewén A, Howells T, Raininko R, Wikström J, et al. Intracranial pressure elevations in diffuse axonal injury: Association with nonhemorrhagic MR lesions in central mesencephalic structures. J Neurosurg. 2019;131:604–11. doi: 10.3171/2018.4.JNS18185. [DOI] [PubMed] [Google Scholar]
- 2.Atsumi N, Iwamoto M, Nakahira Y, Asano Y, Shinoda J. Investigation of dynamic deformation of the midbrain in rear-end collision using human brain FE model. Comput Methods Biomech Biomed Eng. 2020;23:1236–46. doi: 10.1080/10255842.2020.1795142. [DOI] [PubMed] [Google Scholar]
- 3.Avanali R, Bhadran B, Panchal S, Kumar PK, Abhishek V, Gulhane K, et al. Antero posterior elongation of midbrain in traumatic brain injury-significant sign yet a mistaken entity. Br J Neurosurg. 2018;32:129–35. doi: 10.1080/02688697.2018.1432748. [DOI] [PubMed] [Google Scholar]
- 4.Bigler ED. Volumetric MRI findings in mild traumatic brain injury (mTBI) and neuropsychological outcome. Neuropsychol Rev. 2023;33:5–41. doi: 10.1007/s11065-020-09474-0. [DOI] [PubMed] [Google Scholar]
- 5.Bourke NJ, Yanez Lopez M, Jenkins PO, De Simoni S, Cole JH, Lally P, et al. Traumatic brain injury: A comparison of diffusion and volumetric magnetic resonance imaging measures. Brain Commun. 2021;3:fcab006. doi: 10.1093/braincomms/fcab006. [DOI] [PMC free article] [PubMed] [Google Scholar]
- 6.Fedorov A, Beichel R, Kalpathy-Cramer J, Finet J, Fillion-Robin JC, Pujol S, et al. 3D Slicer as an image computing platform for the Quantitative Imaging Network. Magn Reson Imaging. 2012;30:1323–41. doi: 10.1016/j.mri.2012.05.001. [DOI] [PMC free article] [PubMed] [Google Scholar]
- 7.Fletcher-Sandersjöö A, Tatter C, Tjerkaski J, Bartek J, Maegele M, Nelson DW, et al. Time course and clinical significance of hematoma expansion in moderate-to-severe traumatic brain injury: An observational cohort study. Neurocrit Care. 2023;38:60–70. doi: 10.1007/s12028-022-01609-w. [DOI] [PMC free article] [PubMed] [Google Scholar]
- 8.Gao L, Xue Q, Gong S, Li G, Tong W, Fan M, et al. Structural and functional alterations of Substantia Nigra and associations with anxiety and depressive symptoms following traumatic brain injury. Front Neurol. 2022;13:719778. doi: 10.3389/fneur.2022.719778. [DOI] [PMC free article] [PubMed] [Google Scholar]
- 9.Jain S, Vyvere TV, Terzopoulos V, Sima DM, Roura E, Maas A, et al. Automatic quantification of computed tomography features in acute traumatic brain injury. J Neurotrauma. 2019;36:1794–803. doi: 10.1089/neu.2018.6183. [DOI] [PMC free article] [PubMed] [Google Scholar]
- 10.Jang SH, Kim TH, Kwon YH, Lee MY, Lee HD. Postural instability in patients with injury of corticoreticular pathway following mild traumatic brain injury. Am J Phys Med Rehabi. 2016;95:580–7. doi: 10.1097/PHM.0000000000000446. [DOI] [PubMed] [Google Scholar]
- 11.Kayhanian S, Young AM, Ewen RL, Piper RJ, Guilfoyle MR, Donnelly J, et al. Thresholds for identifying pathological intracranial pressure in paediatric traumatic brain injury. Sci Rep. 2019;9:3537. doi: 10.1038/s41598-019-39848-1. [DOI] [PMC free article] [PubMed] [Google Scholar]
- 12.Maas AI, Hukkelhoven CW, Marshall LF, Steyerberg EW. Prediction of outcome in traumatic brain injury with computed tomographic characteristics: A comparison between the computed tomographic classification and combinations of computed tomographic predictors. Neurosurgery. 2005;57:1173–82. doi: 10.1227/01.neu.0000186013.63046.6b. [DOI] [PubMed] [Google Scholar]
- 13.Marshall LF, Marshall SB, Klauber MR, Van Berkum Clark M, Eisenberg H, Jane JA, et al. The diagnosis of head injury requires a classification based on computed axial tomography. J Neurotrauma. 1992;9(Suppl 1):S287–92. [PubMed] [Google Scholar]
- 14.Raj R, Siironen J, Skrifvars MB, Hernesniemi J, Kivisaari R. Predicting outcome in traumatic brain injury: Development of a novel computerized tomography classification system (Helsinki Computerized Tomography Score) Neurosurgery. 2014;75:632–47. doi: 10.1227/NEU.0000000000000533. [DOI] [PubMed] [Google Scholar]
- 15.R Core Team . R Foundation for Statistical Computing. Vienna, Austria: 2021. R: A language and environment for statistical computing. Available from: https://www.R-project.org [Last accessed on 2024 May 13] [Google Scholar]
- 16.R Studio Team . RStudio, PBC. Boston, MA: 2020. RStudio: Integrated development for R. Available from: http://www.rstudio.com [Last accessed on 2024 May 13] [Google Scholar]
- 17.Thiele C, Hirschfeld G. Cutpointr: Improved estimation and validation of optimal Cutpoints in R. J Stat Softw. 2021;98:1–27. [Google Scholar]
- 18.Toledo JA, Namias R, Milano MJ. A novel automated calculation of basal cistern effacement status on computed tomographic imaging in traumatic brain injury. Cureus. 2021;13:e13144. doi: 10.7759/cureus.13144. [DOI] [PMC free article] [PubMed] [Google Scholar]
- 19.Toutant SM, Klauber MR, Marshall LF, Toole BM, Bowers SA, Seelig JM, et al. Absent or compressed basal cisterns on first CT scan: Ominous predictors of outcome in severe head injury. J Neurosurg. 1984;61:691–4. doi: 10.3171/jns.1984.61.4.0691. [DOI] [PubMed] [Google Scholar]


