

Abstract
Identifying factors that contribute to spatial thinking is of great interest given links between spatial thinking and success in STEM. Working memory has been found to be predictive of spatial thinking but little research has explored other components of executive function (i.e., inhibition, shifting) in relation to spatial thinking. A total of 131 four- to six-year-olds (Mage = 5.06; 53.4% male; 56% Latinx, 18% White, 12% Mixed Race, 5% Asian, and 5% other) were assessed using spatial, executive function, and intelligence tasks. Results show that inhibition, shifting, and working memory are all associated with intrinsic and extrinsic spatial task scores. These results advance developmental theory on spatial thinking and offer a promising route for future interventions in improving spatial ability.
Keywords: spatial thinking, individual differences, executive function, spatial scaling, mental rotation
Spatial thinking refers to the ability to understand size, shape, location, and direction/distance, navigate/wayfind in space, effectively use maps and understand diagrams, mentally transform/rotate objects, and create and copy patterns (Sinton, Bednarz, Gersmehl, & Uttal, 2013). Research shows individual differences in spatial ability predict children’s math and science ability (Bower & Liben, 2021; Gilligan, Flouri, & Farran, 2017; Gunderson, Ramirez, Beilock, & Levine, 2012; Hodgkiss, Gilligan, Tolmie, Thomas & Farran, 2018; Träff, Olsson, Skagerlund, Skagenholt, & Östergren, 2019; Verdine, Irwin, Golinkoff, & Hirsh-Pasek, 2014) and adult entry into Science, Technology, Engineering, and Mathematics (STEM) disciplines (Lubinski, 2010; Wai, Lubinski, & Benbow, 2009). Spatial thinking is malleable, with improvement resulting from task-specific practice of a spatial skill or completing coursework that demands spatial thinking (Newcombe, 2010; Terlecki, Newcombe & Little, 2008; Uttal et al., 2013). More knowledge is needed about other contributors to individual differences in spatial ability in order to develop spatial interventions. The current study examines executive function as a potential contributor to individual differences in spatial thinking in young children.
Spatial tasks are organized into a 2 x 2 classification schema: dynamic/static and extrinsic/intrinsic (Newcombe & Shipley, 2015). Dynamic tasks involve objects in motion, while static tasks involve objects presented in stable positions. Extrinsic tasks look at relations between spaces and objects, while intrinsic tasks focus on features of objects or relations between parts of objects. Mix and colleagues (2018) found the 2-factor extrinsic/intrinsic schema better fit actual behavioral data. Given these data, we selected spatial tasks that span this extrinsic/intrinsic schema for the present study.
Factors that influence spatial thinking development include child and adult/parent use of spatial language (e.g., Casasola, Wei, Suh, Donskoy, & Ransom, 2020; Pruden, Levine, & Huttenlocher, 2011; Ralph, Berinhout, & Maguire, 2020; Turan, Kobaş, & Göksun, 2021), motor skill (Jansen & Heil, 2010; Jansen, Kellner, & Rieder, 2013; Jansen, Schmelter, Kasten, & Heil, 2011; Lehmann, Quaiser-Pohl, & Jansen, 2014; Richter et al., 2000), play experiences (Casey et al., 2008; Jirout & Newcombe, 2015; Levine, Ratliff, Huttenlocher, & Cannon, 2012), and spatial anxiety (Lauer, Esposito, & Bauer, 2018; Ramirez, Gunderson, Levine, & Beilock, 2012). Less is known about whether, and how, cognitive factors, including executive function, explain individual differences in children’s spatial ability.
Executive function is a catch-all term describing higher-order cognitive processes involved in formulating/carrying out action plans (Best & Miller, 2010). Three core executive functions have been proposed: inhibition, shifting, and working memory (Best & Miller, 2010; Friedman & Miyake, 2017; Miyake et al., 2000). Inhibition is the ability to selectively attend to specific stimuli while suppressing stimuli that interferes with reaching the goal (Diamond, 2013). Shifting is the ability to switch between rules and tasks depending on changing priorities (Diamond, 2013). Working memory is the ability to store, maintain, and update information temporarily in memory (Best & Miller, 2010).
There is reason to believe executive function relates to individual differences in spatial thinking. Most prior work focuses on working memory. Working memory is involved in maintaining activation of visual representations of an original stimulus during manipulation of the stimulus in mental rotation tasks (Hyun & Luck, 2007). Working memory partially explains variability in children’s mental rotation scores (He, Li, & Yin, 2019; Lehmann et al., 2014, Vander Heyden, Huizinga, & Jolles, 2017). However, other components of executive function may predict variability in spatial ability. Inhibition and working memory predicts spatial visualization, spatial relations, and perceptual speed in adults (Miyake et al., 2001). Inhibition accounted for variability in spatial domain scores of the Child Math Assessment and partially explained mental rotation performance in children (Harvey & Miller, 2017; He et al., 2014). There are no studies that explore relations between shifting and spatial ability. We speculate relations exist because spatial tasks demand respondents shift between stimuli.
We examine whether there are direct effects of executive function on young children’s spatial thinking. This study extends previous literature because it examines whether executive function is related to extrinsic spatial tasks, which has not been done, and the relations between three components of executive function (inhibition, shifting, and working memory) and spatial ability in children in a single study. It is hypothesized that children with higher executive functioning will show better performance on both intrinsic and extrinsic spatial tasks, even after controlling for receptive vocabulary, processing speed, child age, and socioeconomic status. In keeping with prior literature, we included receptive vocabulary and processing speed as covariates to ensure our results are not explained by general intelligence.
Method
Participants
A total of 131 four- to six-year-old children (M = 60.73 months, SD = 7.99) were recruited from 17 daycare centers and preschools across Miami-Dade county to participate in this study. Of these 131 children tested, 70 were male (53.4%) and 61 were female (46.6%). Primary caregivers were asked to report on several demographic characteristics including child’s race/ethnicity and mother’s education. Participating children were racially and ethnically diverse (56% Latinx, 18% White, 12% Mixed Race, 5% Asian, and 5% other) and generally representative of the population in the Miami area. Five participants (4%) chose not to report their race or ethnicity. Primary caregivers reported the following for mother’s education: less than high school (2.3%), high school diploma (14.5%), some college, no degree (12.2%), associate’s degree (10.7%), bachelor’s degree (26%), master’s degree (14.5%), professional degree (9.2%), doctorate (5.3%), and unknown or did not report (5.3%). Participating children had to be proficient in English in order to be included in this study. Proficiency in the English language was tested using the NIH Toolbox Picture Vocabulary Test (Gershon et al., 2013a; 2013b).
Measures
Measures of executive function, intrinsic spatial thinking, extrinsic spatial thinking, receptive vocabulary, and processing speed were administered to children. Demographic information was also collected via caregiver/guardian self-report.
Measures of executive function.
NIH Toolbox Flanker Inhibitory Control and Attention Test.
The NIH Toolbox Flanker Inhibitory Control and Attention Test (Gershon et al., 2013b; Zelazo et al., 2013) was used to assess inhibition and administered via an iPad. The NIH Toolbox version of this task consists of instruction slides with a trained experimenter, a practice block, a child-friendly block using fish stimuli, and a more difficult block using arrow stimuli. Children were instructed to touch one of two buttons on the screen corresponding to the direction the middle stimuli (fish or arrow) was facing. In congruent trials, the centrally presented stimulus faced the same direction as the surrounding stimuli. In incongruent trials, the centrally presented stimulus faced the opposite direction as the surrounding stimuli. Participants typically respond slower and are more likely to make errors in incongruent trials.
During the instruction slides, the experimenter said “Sometimes all the fish point the same way. Sometime the middle fish points a different way like this (points). You should always choose the button that matches the way the middle fish is pointing. You will hear the word middle to remind you.” The word “middle” was presented auditorily to all participants in each trial. In the practice block, children were presented with four trials (two congruent and two incongruent) and had to answer at least three correctly in order to pass to the test trials. Participants who passed to the fish test trials received 16 congruent and 9 incongruent trials. Participants who answered at least 5 of the 9 incongruent trials correctly advanced to the arrows test trial. Similarly, the arrows test block consisted of 25 trials (16 congruent and 9 incongruent). The approximate time to administer this task was 3-5 minutes, depending on the child’s skill. The standard toolbox score, which takes into account both accuracy and reaction time and is age-corrected, was used as our variable of interest, Inhibition. Possible scores range from 0 to 40.
NIH Toolbox Dimensional Change Card Sort Test.
The NIH Toolbox Dimensional Change Card Sort Test (Gershon et al., 2013b; Zelazo et al., 2013) based on the DCCS developed by Zelazo (2006) was used to assess shifting. In this task, participants were presented two target pictures and asked to sort test pictures according to a rule. This task allows us to determine whether the participant can shift attention to a new rule successfully after establishing a specific behavioral pattern. The NIH Toolbox version of this task consists of a practice block, a pre-switch block, a post-switch block, and a mixed block. The practice block consisted of four practice trials that required the participant to match stimuli by one dimension (for example, shape) and then to match by another stimuli (for example, color). Feedback was given on incorrect responses throughout the practice trials. Participants who got three out of four practice trials correct advanced to a pre-switch block. The pre-switch block consisted of five trials in which children were instructed to sort by a dimension (for example, color). Then, in the post-switch block, participants were asked to match by the second dimension (for example, shape). Lastly, the mixed block consisted of 50 trials that included trials asking participants to match by both dimensions (i.e., color and shape) in a random order. The approximate time to administer this task was about 3-5 minutes, depending on the child’s skill. The standard toolbox score, which takes into account both accuracy and reaction time and is age-corrected, was used as our variable of interest, Shifting. Possible scores range from 0 to 40.
Working Memory.
The following 6 working memory measures, digit span forward, digit span reverse, word span forward, word span reverse, path span forward, and path span reverse, were combined into a component score known as our variable Working Memory. Six working memory tasks were used because we wanted to include working memory tasks that were not inherently spatial (e.g., word and digit span). Both forward and backward digit, word, and path span were included since prior research suggests potentially different working memory processes may be at play when completing a forward versus a backward task (e.g., Rosenthal, Riccio, Gsanger, & Jarratt, 2006). Thus, to have a working memory score that reflects the vast underlying working memory processes, we assess forward and backward span for word, digit and path span.
Digit span forward and reverse.
Digit span was used to measure working memory capacity. In this task, participants were instructed to repeat the string of numbers, in the same order, that were orally presented to them by the experimenter. The experimenter told the participant, “In this game, I am going to read you a list of numbers. You have to say the numbers again in the same order.” Participants were given two practice trials with feedback. After completing the practice trials, participants moved on to the test trials. Each sequence consisted of three trials and the length of sequence ranged from 2 items to 9 items. The string of numbers increased in length until the child reached discontinuation criteria which was defined as incorrectly recalling all three trials of a particular length of sequence. The score was calculated as highest length of sequence attempted by the participant. Possible scores range from 2 to 9. Digit span reverse was identical to “Digit span forward” with the exception that participants were asked to repeat the list of numbers in reverse order.
Word span forward and reverse.
Word span was also used to measure working memory capacity. The participants were instructed to repeat the string of words, in the same order, that were orally presented by the experimenter. The experimenter told the participant, “In this game, I am going to read you a list of words. You have to say the words again in the same order.” Participants were given two practice trials with feedback. After completing the practice trials, participants moved on to the test trials. Each sequence consisted of three trials and the length of sequence ranged from 2 items to 9 items. The string of words increased in lengths of sequence until the child incorrectly recalled three trials of a particular length of sequence. The score was calculated as highest length of sequence attempted by the participants. Possible scores range from 2 to 9. Word span reverse was identical to “Word span forward” with the exception that participants were asked to repeat the list of words in reverse order.
Path span forward and reverse.
An iPad version of the Corsi Block-Tapping task named PathSpan (Hume & Hume, 2015) was used to assess visuo-spatial working memory. In this task, participants were presented with a set of 9 green circles and were instructed to watch as the circles lit up one at a time. Participants were then asked to touch the buttons in the same order as the presented sequence. The experimenter told the child, “You watch the pattern. When it is done, you copy the pattern by touching the same buttons and then press the ‘Done’ button to show that you are finished copying. Try and copy the pattern in the same order that you saw. I’ll show you how to do it on the on the first one. Watch me watch the pattern and then copy it.” These instructions were followed by an example trial in which the experimenter copied the pattern, and followed by the participant’s test trials. Three trials were presented for each length of a sequence. Sucessful recall of one, two, or three of the presented sequences of a particular length would allow the child to progress to the next sequence length. The task was discontinued when the participant failed to recall all three sequences of the given sequence length. The approximate test time was 5 minutes. The score was calculated as highest sequence attempted by the participant. Possible scores range from 2 to 9. Path span reverse was identical to path span forward with the exception that participants were asked to touch the circles in the reverse order.
Measures of intrinsic spatial thinking.
Two intrinsic spatial tasks were used because the Children’s Mental Transformation Task (CMTT) and Block Design Test tap into different aspects of intrinsic spatial skill. CMTT measures children’s ability to mentally rotate shapes whereas block design assesses children’s ability to recreate patterns. Mental rotation scores and block design scores were combined into a component score, which was used to represent Intrinsic Spatial Thinking.
Children’s Mental Transformation Task.
The Children’s Mental Transformation Task (CMTT; Levine et al., 1999) assesses children’s ability to mentally rotate shapes. In this task, participants were shown the stimulus card (two pieces of shapes) and the choice array (card with four whole shapes) and were asked to point to the shape that the two pieces would make if they were put together. The experimenter told the child, “Look at these pieces. Now look at these shapes. If you put these pieces together, they will make one of these shapes. Point to the shape the pieces make.” No feedback was given on any trial. See Figure 1 for a sample trial. We administered an adapted version of this task consisting only of the 16 trials of the CMTT that measure rotation. The other 16 trials that are typically administered in task were omitted from this study because those trials are associated with measuring transformation and for the purposes of this study as we were only interested in a measure of children’s mental rotation ability (rotating both horizontally and vertically at the same time) and not their ability to simply transform objects. This task took approximately 10 minutes to complete. CMTT scores were calculated based on the number of items answered correctly out of the total 16 items administered. Possible scores range from 0 to 16.
Figure 1.

Sample item requiring rotation from Children’s Mental Transformation Task (CMTT; Levine et al., 2019).
WPPSI-III Block Design Test.
The Wechsler Preschool and Primary Scale of Intelligence-Third Edition (Wechsler, 2002) block design test assesses visuospatial ability. There were twenty items in total; the first ten items used single-colored blocks and the last ten items used a combination of single and two-colored blocks. For items 1-12, participants were asked to recreate the block design according to a three-dimensional model constructed by a trained research assistant. Beginning with item 13, participants were asked to recreate the block according to a picture. The session was discontinued once a participant answered three consecutive items incorrectly. On average, this task took 15-20 minutes to complete. A raw score was calculated based on accuracy as well as performance within the time limit. Block design scores could range from 0 to 40.
Measures of extrinsic spatial thinking.
Spatial Scaling Test.
The Spatial Scaling Test (SST; Frick & Newcombe, 2012), which assesses spatial scaling, or the ability to transfer information from one representation to another representation of a different size, was administered as our measure of extrinsic spatial thinking. In this task, the experimenter read the participant a story about Farmer Fred and asked the participant to help Farmer Fred locate the hidden eggs. The following instructions were read to the child,“The first chicken hid her egg somewhere in this field. This small picture shows you where the chicken hid her egg. The egg is in the same spot in the field as it is on this picture. Can you touch where you think the egg is hidden in this big field?” Participants were asked to point to where they think that the hidden egg (target) is located in a two-dimensional spatial layout (big field) using information from a second two-dimensional spatial layout (small field). The experimenter marked where the child pointed on the large picture with a marker to indicate the child’s location. See Figure 2 for a sample trial. This task consisted of twenty-four trials all of which used a 1:4 scaling factor. Feedback was not given for any of the test trials. The approximate test time was 10 minutes. The Extrinsic Spatial Thinking variable was calculated as the difference between the total possible deviation (352.84 millimeters) and the participant’s mean deviation in millimeters. Therefore, scores could potentially range from 0 to 352.84 millimeters, where lower scores reflected better performance.
Figure 2.

Sample item of the Spatial Scaling Test (SST; Frick & Newcombe, 2012). (Note: Images are not shown to scale).
Measures of intelligence.
NIH Toolbox Picture Vocabulary Test.
The NIH Toolbox Picture Vocabulary Test (Gershon et al., 2013a; 2013b) is a standardized assessment of receptive vocabulary. In this task, four images of objects, actions, or concepts were presented simultaneously with an audio clip of a single word on an iPad. Participants were asked to touch the image that corresponds best to the word that they heard. Two practice trials were administered followed by 25 test trials. The approximate time to administer this task was 5 minutes. The NIH toolbox age-corrected score based on accurary was used as the Receptive Vocabulary variable.
NIH Toolbox Processing Speed Test.
The NIH Toolbox Pattern Comparison Processing Speed Test (Carlozzi, Tulsky, Kail, & Beaumont, 2013; Gershon et al., 2013b) assesses processing speed. In this task, participants were asked to touch the “smiley” face if the two visual patterns presented on the screen were the same and the “frowny” face if the two visual patterns presented on the screen were not the same as quickly as possible. The participants were given 90 seconds to get through as many trials as they could. We used this measure as a control variable in all analyses to rule out the possibility that children with better executive function and spatial abilities are simply faster processors of information and this is why there is a relation between our variables of interest. Processing Speed was calculated as the number of correct items (out of a possible 130) in 90 seconds.
Demographic information questionnaire.
The demographic information questionnaire consisted of seven questions regarding child age, child sex, child race/ethnicity, child handedness, child’s ability to speak and/or understand a second language, and highest education level completed by the child’s mother. Mother education level served as our proxy for family socioeconomic status (SES). Data collected from the demographic information questionnaire were used to statistically control for child age and mother education in our analyses. The variable Mother Education Level was coded as, 1 = less than high school, 2 = high school graduate/GED, 3 = some college credit, no degree, 4 = associate’s degree (AA, AS), 5 = bachelor’s degree (BA,BS), 6 = master’s degree (MA, MS, Med, MSW, MBA), 7 = professional degree (MD, DDS, JD), 8 = doctorate degree (PhD, EdD), and 9 = unknown.
Procedure
Prior to the child visit, parents or guardians at participating schools were asked to sign an informed consent form and complete a demographic information questionnaire. During the child visit, participating children were assessed individually in a quiet room at their school on a battery of executive function, spatial thinking, and intelligence tasks by a trained research assistant during school hours. To avoid children’s fatigue, the testing was performed in two sessions on two consecutive days (with the exception that Friday sessions were followed up on Mondays). Each session lasted approximately 30 minutes. Session A consisted of the following tasks in a fixed order, digit span forward and reverse, Spatial Scaling Test, NIH Toolbox Picture Vocabulary Test, NIH Toolbox Flanker Inhibitory Control and Attention Test, NIH Toolbox Dimensional Change Card Sort Test, and NIH Toolbox Pattern Comparison Processing Speed Test. Session B consisted of the following tasks in a fixed order, Block Design, Path span forward and reverse, Children’s Mental Transformation Task, word span forward and reverse. Session A and session B were counterbalanced across participants such that half of the children were administered Session A first and the remaining half were administered Session B first. Children received their choice of a sticker or small toy after completion of both sessions as compensation for their participation.
Outliers and Missing Data
Data were examined for missingness. Missing data was minimal for several measures (3% for maternal education and Spatial Scaling Test, and 1% for Path Span forward and reverse). Missingness was more substantial for the Digit and Word Span tasks (15%). The higher degree of missingness on these measures is due to the fact that the measures were added after the first few participants tolerated the length of time it took to complete the other assessments, and thus these data are assumed to be missing at random (MAR). No other measures had missing data. Proceeding on the MAR assumption, multiple imputation was used to impute all missing data points. This was accomplished using the Multiple Imputation via Chained Equations (MICE) package in R (mice v.3.13.0). Twenty imputations were applied, and standard errors are estimated across those imputations.
Computation of Component Scores
Confirmatory factor analysis comparing multiple models of executive function in preschool-aged children have found a single-factor model best accounts for the data (Wiebe, Espy, & Charak, 2008). Therefore, in addition to examining individual measures, we calculated summary measures for executive function and for working memory. For the summary executive function measure, the six working memory measures (forward and backward digit, word, and path span) and the DCCS and Flanker were subjected to a principal components analysis establishing a single factor (with varimax rotation), and component scores were saved for each participant. We conducted a similar analysis to compute a working memory component alone (of the six working memory measures), and an intrinsic spatial component (comprised of CMTT and block design).
Analyses
To assess the association between executive function and intrinsic and extrinsic spatial ability, eight ordinary least squares multiple regression analyses were conducted using R (v. 4.0.1; https://cran.r-project.org/), pooling the model fits across the 20 imputations. Each regression controlled for age (in months), mother’s education level, processing speed, and receptive vocabulary. The regressions assessed the two spatial variables as outcomes (i.e., the Intrinsic Principal Component score comprised of block design and CMTT) and the extrinsic SST and the following four variables as predictors of interest: 1) the EF principal component; 2) Flanker; 3) DCCS; and 4) Working Memory Principal Component (comprised of forward and backward word, digit, and path span measures). We also entered age as a moderator on each of these predictors, but, as we see below, none of the interaction effects were statistically significant, and in no case did it improve model fit. Therefore, the interaction effect was removed and all analyses are reported without it. In addition to standardized β and associated statistics, semipartial r effect size (rsp) of the predictors of interest are also reported. This measure is the correlation between the predictor and the outcome unique from the other variables in the model, and its size can be understood in the same way as the Pearson correlation.
Due to the number of regressions, we applied a False Discovery Rate (Benjamini & Hochberg, 1995) correction at q = .05 across the eight regressions for our predictors of interest (i.e., we corrected for eight comparisons).
Results
Descriptive Statistics
Table 1 presents the descriptive statistics including means, standard deviations, and minimum and maximum scores for all of the assessments in this study. No floor or ceiling effects were found for any measures suggesting sufficient variability. As a first pass at assessing possible relations between children’s executive function and their spatial abilities, bivariate partial correlations were calculated, controlling for age in months (Table 2).
Table 1.
Descriptive statistics by measure.
| Measure | M | SD | Min | Max |
|---|---|---|---|---|
| Flanker (Inhibition)* | 27.43 | 12.59 | 0 | 40 |
| DCCS (Shifting)* | 20.88 | 14.52 | 0 | 40 |
| Digit Span (Forward) | 5.37 | 1.21 | 2 | 8 |
| Digit Span (Reverse) | 2.46 | 0.72 | 2 | 5 |
| Word Span (Forward) | 4.41 | 1.10 | 2 | 7 |
| Word Span (Reverse) | 2.65 | 0.83 | 2 | 5 |
| Path Span (Forward) | 3.65 | 1.60 | 2 | 9 |
| Path Span (Reverse) | 2.94 | 1.35 | 2 | 7 |
| SST | 319.22 | 18.59 | 264.75 | 341.29 |
| CMTT | 6.44 | 2.98 | 0 | 14 |
| Block Design | 21.13 | 8.49 | 0 | 38 |
| Receptive Vocabulary* | 72.40 | 24.88 | 31 | 128 |
| Processing Speed | 21.60 | 8.66 | 0 | 39 |
Note: Tasks with age-adjusted scores are denoted with a *.
Table 2.
Partial correlation matrix, controlling for age, for all measures of interest.
| Measure | 1 | 2 | 3 | 4 | 5 | 6 | 7 | 8 | 9 | 10 | 11 | 12 | 13 | 14 | 15 |
|---|---|---|---|---|---|---|---|---|---|---|---|---|---|---|---|
| 1. Flanker (Inhibition) | - | ||||||||||||||
| 2. DCCS (Shifting) | .35*** (.46) | - | |||||||||||||
| 3. Digit Span (Forward) | .32*** (.48) | .13 (.30) | - | ||||||||||||
| 4. Digit Span (Reverse) | .25** (.45) | .22* (.39) | .41*** (.58) | - | |||||||||||
| 5. Word Span (Forward) | .21* (.35) | .28*** (.39) | .53*** (.61) | .28*** (.43) | - | ||||||||||
| 6. Word Span (Reverse) | .38*** (.54) | .33*** (.47) | .36*** (.54) | .60*** (.74) | .33*** (.47) | - | |||||||||
| 7. PathSpan (Forward) | .22* (.41) | −.02 (.19) | .22* (.43) | .18* (.45) | .10 (.29) | .18* (.44) | - | ||||||||
| 8. PathSpan (Reverse) | .18* (.39) | .11 (.31) | .25** (.46) | .45*** (.64) | .09 (.28) | .37*** (.58) | .17* (.43) | - | |||||||
| 9. SST | .37*** (.49) | .24** (.37) | .22* (.39) | .15 (.38) | .15 (.29) | .19* (.40) | .26** (.44) | .16 (.37) | - | ||||||
| 10. CMTT | .22* (.39) | .20* (.35) | .27** (.45) | .41*** (.59) | .24** (.38) | .47*** (.62) | .11 (36) | .32*** (.51) | .29*** (.45) | - | |||||
| 11. Block Design | .29*** (.46) | .24** (.39) | .40*** (.55) | .18* (.44) | .32*** (.45) | .30*** (.51) | .13 (.38) | .16 (.41) | .17 (.36) | .25** (.45) | - | ||||
| 12. Receptive Vocabulary | .25** (.40) | .12 (.28) | .36*** (.51) | .37*** (.54) | .46*** (.56) | .42*** (.57) | .09 (.32) | .14 (.37) | .24** (.40) | .35*** (.50) | .26** (.44) | - | |||
| 13. Processing Speed | .32*** (.50) | −.03 (.22) | .09 (.37) | .04 (.40) | .11 (.31) | .17* (.47) | .19* (.46) | .09 (.42) | .13 (.37) | .08 (.37) | .08 (.38) | .10 (.36) | - | ||
|
| |||||||||||||||
| 14. EF Component | .60*** (.70) | .49*** (.59) | .69*** (.77) | .72*** (.83) | .59*** (.66) | .75*** (.84) | .40*** (.62) | .54*** (.72) | .35*** (.54) | .47*** (.64) | .42*** (.62) | .47*** (.62) | .20* (.55) | - | |
|
| |||||||||||||||
| 15. WM Component | .40*** (.57) | .28** (.45) | .72*** (.80) | .76*** (.86) | .60*** (.66) | .75*** (.84) | .44*** (.64) | .60*** (.75) | .29*** (.49) | .47*** (.65) | .39*** (.60) | .48*** (.63) | .17* (.53) | .96*** (.98) | - |
Note.
= p < .05,
= p < .01,
= p < .001.
Numbers in parentheses are correlations without controlling for age.
Executive function and intrinsic spatial thinking.
In order to determine whether executive function predicted intrinsic spatial thinking, we estimated a multiple regression model with intrinsic spatial thinking as the outcome variable, and the following predictors: executive function, age (in months), mother’s education level, processing speed, and receptive vocabulary. Age was also entered as a moderator, but the interaction was non-significant (p = 0.33) and did not improve model fit, so the interaction effect was removed. The results of the multiple regression indicated that the EF principal component was a significant predictor of intrinsic spatial thinking, β = 0.55, t(123.03) = 6.10, p < 0.001, rsp = 0.35 (Table 3 for other predictors). This effect survived the FDR correction for multiple comparsions. Figure 3 shows the scatterplot depicting the relation between executive function and intrinsic spatial thinking, while controlling for all relevant variables.
Table 3.
Multiple regression model for intrinsic spatial thinking based on the following predictors: executive function, age (in months), mother education level, processing speed, and receptive vocabulary.
| Predictor | β (rsp) | SE | p |
|---|---|---|---|
| Executive Function | 0.55 (0.35) | 0.09 | < 0.001*** |
| Age | 0.16 (0.11) | 0.01 | 0.09 |
| Mother Education Level | −0.01 (−0.01) | 0.03 | 0.84 |
| Processing Speed | −0.01 (−0.02) | 0.01 | 0.81 |
| Receptive Vocabulary | 0.14 (0.10) | 0.00 | 0.07 |
Note:
= p <.001
Figure 3.
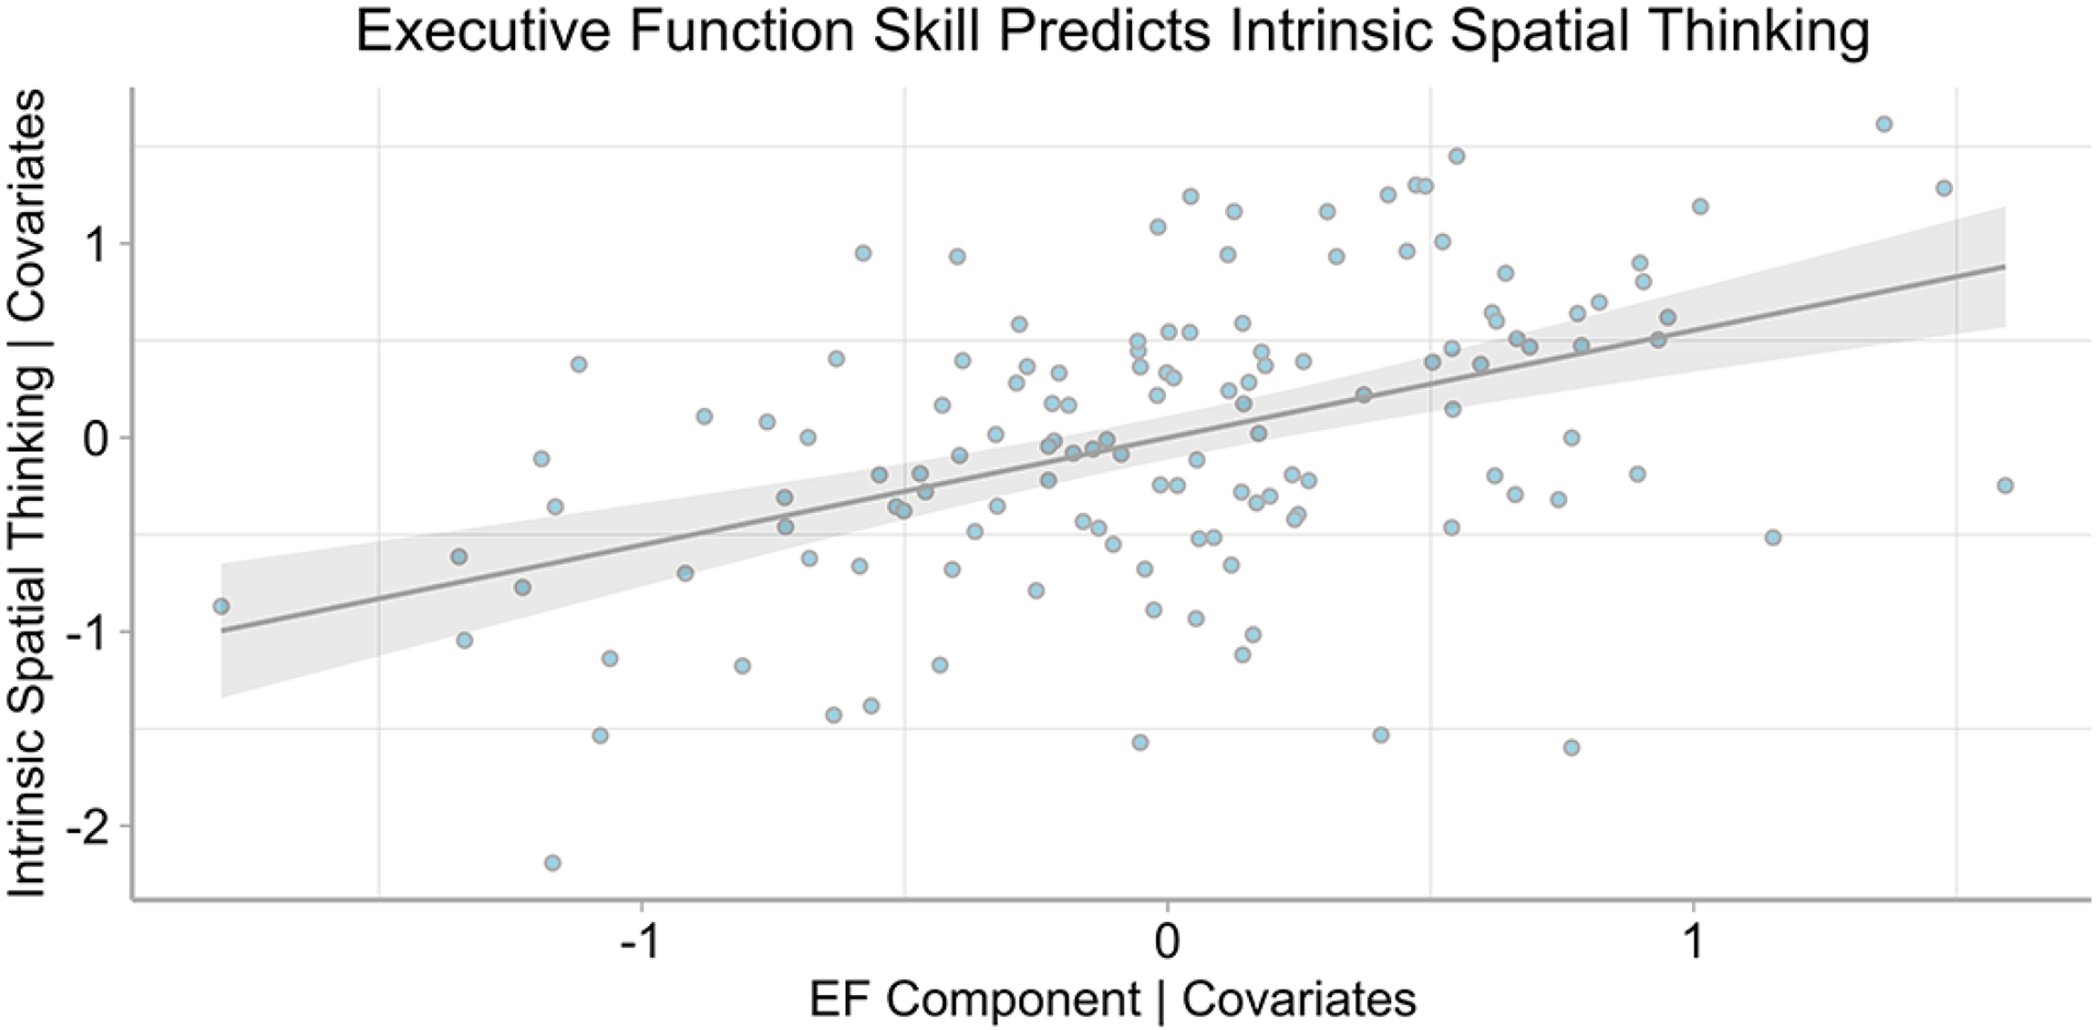
Added variable plot of relation between executive function and intrinsic spatial thinking, controlling for covariates. Shading represents 95% confidence interval of the regression line.
Individual components of EF on intrinsic spatial thinking.
All three components of executive function (inhibition, shifting, and working memory) were also assessed in relation to intrinsic spatial thinking individually. These are reported in Table 4. As the Table shows, each of the component measures were also statistically significant predictors of intrinsic spatial thinking, even after controlling for the relevant covariates. Again, age was also entered as a moderator, but the interaction was non-significant (p = 0.28, 0.96, 0.24 respectively) and did not improve model fit, so the interaction effect was removed for these analyses. All of these effects survived the FDR correction for multiple comparsions.
Table 4.
Multiple regression models for intrinsic spatial thinking controlling for the following factors: age (in months), mother education level, processing speed, and receptive vocabulary.
| Predictor | β (rsp) | SE | p |
|---|---|---|---|
| Flanker (Inhibition) | 0.21 (0.18) | 0.01 | <0.01** |
| Age | 0.37 (0.27) | 0.01 | <0.001*** |
| Mother Education Level | 0.01 (0.01) | 0.03 | 0.85 |
| Processing Speed | −0.01 (−0.00) | 0.01 | 0.95 |
| Receptive Vocabulary | 0.29 (0.25) | <0.001 | <0.01*** |
|
| |||
| DCCS (Shifting) | 0.20 (0.18) | 0.00 | <0.01** |
| Age | 0.33 (0.24) | 0.01 | <0.01** |
| Mother Education Level | 0.01 (0.01) | 0.03 | 0.85 |
| Processing Speed | 0.08 (0.06) | 0.01 | 0.35 |
| Receptive Vocabulary | 0.31 (0.27) | 0.00 | <0.01** |
|
| |||
| Working Memory | 0.52 (0.32) | 0.09 | <0.01** |
| Age | 0.17 (0.11) | 0.01 | 0.08 |
| Mother Education Level | −0.00 (−0.00) | 0.03 | 0.93 |
| Processing Speed | 0.01 (0.00) | 0.01 | 0.98 |
| Receptive Vocabulary | 0.15 (0.11) | 0.00 | 0.06 |
Note:
= p <.01,
= p <.001
Executive function and extrinsic spatial thinking.
A multiple regression model was also estimated to determine whether executive function predicted extrinsic spatial thinking after controlling for age, mother’s education level, processing speed, and receptive vocabulary. Age was also entered as a moderator, but the interaction was non-significant (p = 0.27) and did not improve model fit, so the interaction effect was removed. The results of the multiple regression indicated that the EF principal component was a significant predictor of extrinsic spatial thinking, β = 0.38, t(110.34) = 2.35, p < 0.01, rsp = 0.23 (Table 5 for other predictors). This effect survived the FDR correction for multiple comparsions. Figure 4 shows the scatterplot depicting the relation between executive function and extrinsic spatial thinking, while controlling for all relevant variables.
Table 5.
Multiple regression model for extrinsic spatial thinking based on the following predictors: executive function, age (in months), mother education level, processing speed, and receptive vocabulary.
| Predictor | β (rsp) | SE | p |
|---|---|---|---|
| Executive Function | 0.38 (0.23) | 2.35 | <0.01** |
| Age | 0.10 (0.07) | 0.27 | 0.38 |
| Mother Education Level | −0.03 (−0.03) | 0.76 | 0.65 |
| Processing Speed | 0.07 (0.05) | 0.22 | 0.53 |
| Receptive Vocabulary | 0.09 (0.07) | 0.07 | 0.31 |
Note:
= p <.01
Figure 4.
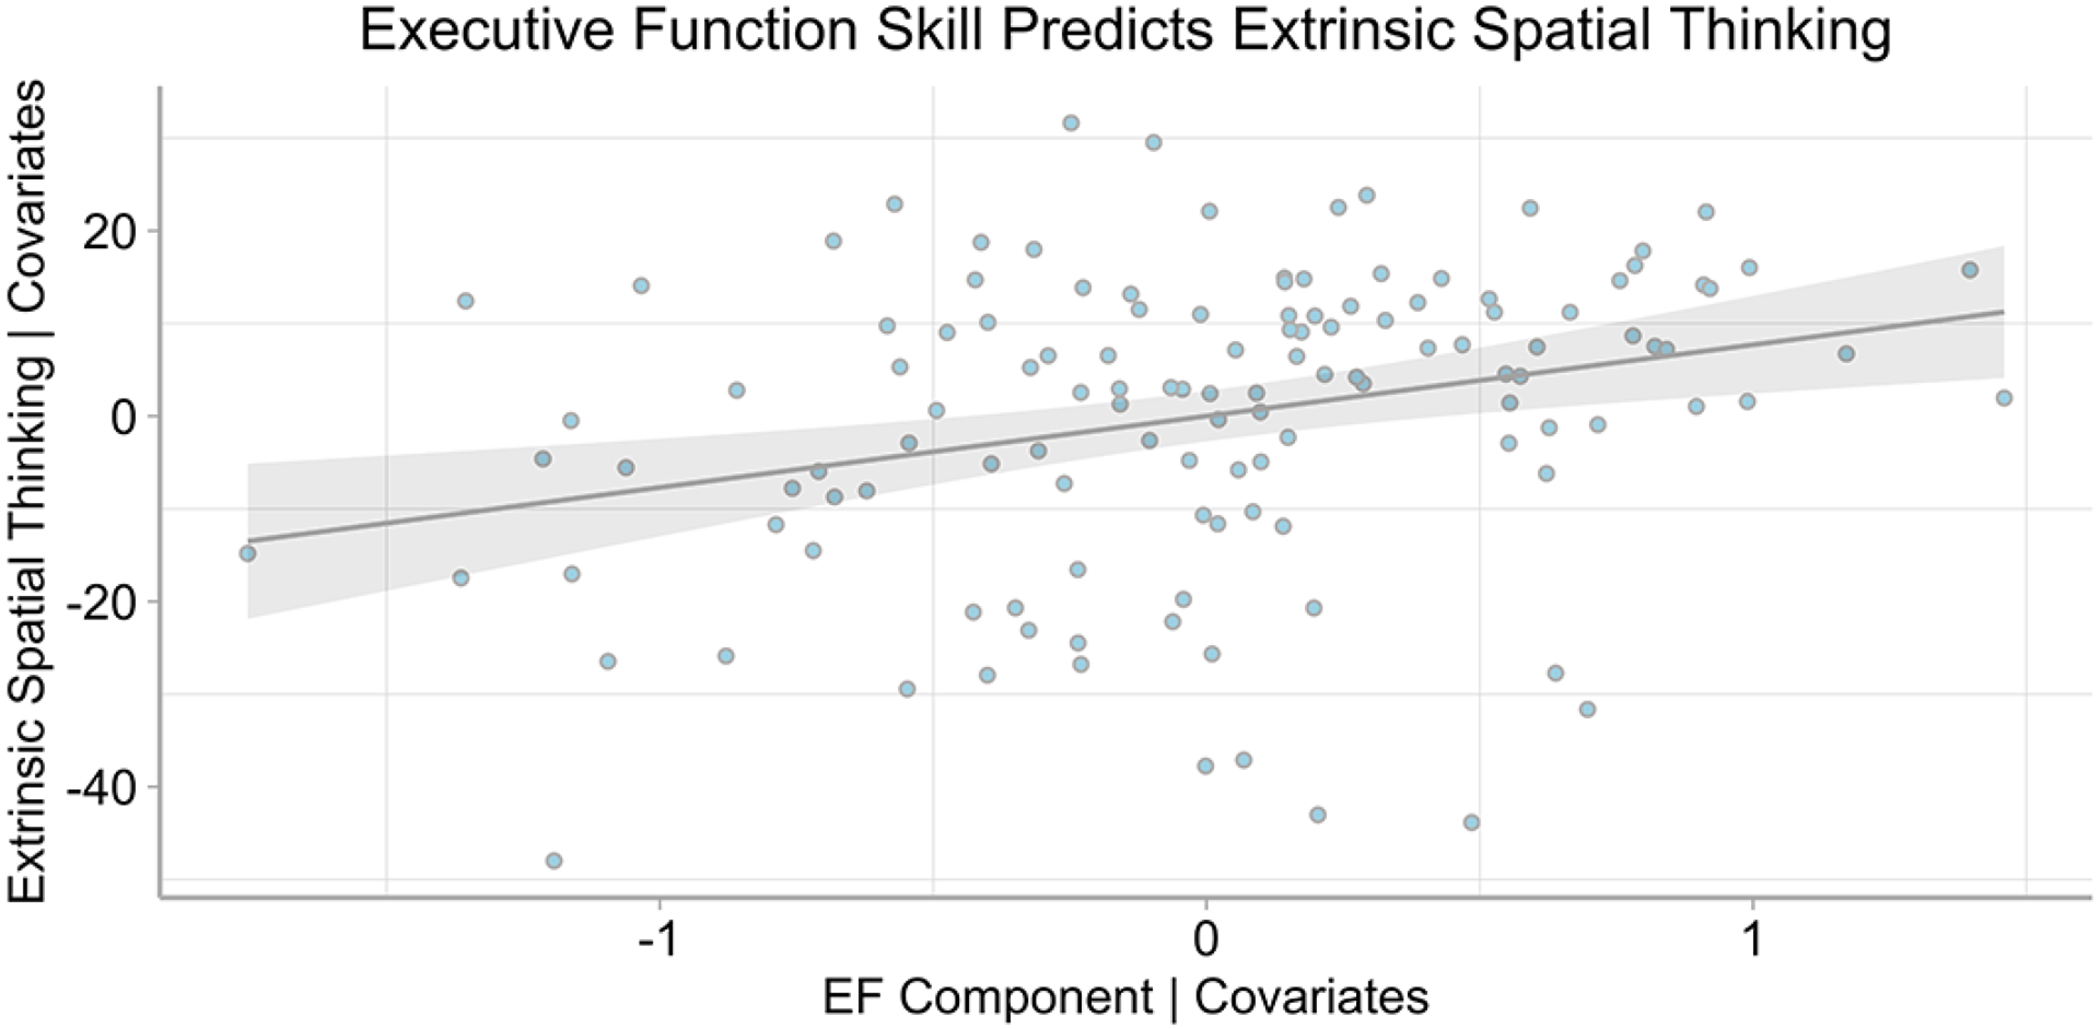
Added variable plot of relation between executive function and extrinsic spatial thinking, controlling for covariates. Shading represents 95% confidence interval of the regression line.
Components of EF on extrinsic spatial thinking.
Next, we conducted separate multiple regression analyses with each of three main components of executive function (i.e., inhibition, shifting, and working memory) in relation to extrinsic spatial thinking. Again, age was also entered as a moderator, but the interaction was non-significant (p = 0.27, 0.93, 0.38 respectively) and did not improve model fit, so the interaction effect was removed for these analyses. These are reported in Table 6. As the Table shows, each of the component measures were also statistically significant predictors of extrinsic spatial thinking, even after controlling for the relevant covariates. All of these effects survived the FDR correction for multiple comparsions.
Table 6.
Multiple regression models for extrinsic spatial thinking controlling for the following factors: age (in months), mother education level, processing speed, and receptive vocabulary.
| Predictor | β (rsp) | SE | p |
|---|---|---|---|
| Flanker (Inhibition) | 0.33 (0.27) | 0.13 | <0.001*** |
| Age | 0.22 (0.16) | 0.24 | 0.03* |
| Mother Education Level | −0.02 (−0.02) | 0.74 | 0.68 |
| Processing Speed | 0.01 (0.01) | 0.22 | 0.95 |
| Receptive Vocabulary | 0.16 (0.14) | 0.07 | 0.06 |
|
| |||
| DCCS (Shifting) | 0.21 (0.19) | 0.11 | <0.01** |
| Age | 0.19 (0.14) | 0.25 | 0.08 |
| Mother Education Level | −0.02 (−0.02) | 0.76 | 0.74 |
| Processing Speed | 0.13 (0.10) | 0.22 | 0.20 |
| Receptive Vocabulary | 0.20 (0.18) | 0.07 | 0.02* |
|
| |||
| Working Memory | 0.26 (0.16) | 2.39 | 0.049 * |
| Age | 0.15 (0.10) | 0.27 | 0.20 |
| Mother Education Level | −0.02 (−0.02) | 0.77 | 0.75 |
| Processing Speed | 0.09 (0.07) | 0.22 | 0.39 |
| Receptive Vocabulary | 0.13 (0.10) | 0.08 | 0.17 |
Note:
= p <.05,
= p <.01,
= p <.001
Discussion
We investigated executive functions contributions to individual differences in intrinsic and extrinsic spatial thinking in young children. Working memory is associated with children’s (Lehmann et al., 2014) and adult’s spatial thinking (Kaufman, 2007; Miyake et al., 2001; Wang & Carr, 2014), but relations between other aspects of executive function, inhibition and shifting, and spatial thinking remain unclear. Research has also only examined executive function in relation to intrinsic spatial ability (mental rotation). We examined inhibition, shifting, and working memory in relation to children’s intrinsic and extrinsic spatial thinking.
Creating a composite score using inhibition, shifting, and working memory performance, we examined scores in relation to intrinsic and extrinsic spatial thinking, controlling for mother’s education level and child age, processing speed, and receptive vocabulary. When treated as one latent variable, executive functions related to performance on both intrinsic and extrinsic spatial tasks. Examination of effect sizes showed effects are notable (rsp=0.35; rsp=0.23), especially considering semipartial correlations control for covariates, and effects were larger than covariate contributions. For example, the next largest effect was age, with a semipartial correlation rsp=0.11. Thus, executive function effects were two to three times larger than age effects.
To further evaluate relations between executive function and spatial thinking, we conducted separate analyses exploring relations between individual components of executive function and intrinsic and extrinsic spatial thinking. All three individual components of executive function were significant predictors of intrinsic thinking. Inhibition predicted intrinsic thinking, likely due to competition present in both intrinsic tasks. In block design, selection of correct block faces/colors requires inhibiting or ignoring competing block faces/colors. Shifting was associated with performance on intrinsic tasks due to switching between CMTT target and response options and/or target pictures, and to switching between block design blocks and target picture/design for pattern recreation. Lastly, intrinsic spatial thinking measures demand working memory as participants maintain, manipulate, and update spatial information in working memory while matching pieces of shapes with correct shapes in the CMTT, and recreating patterns in block design. Results replicate reports of working memory explaining mental rotation scores (Kaufman, 2007; Lehmann et al., 2014).
All three components related to extrinsic spatial thinking. Inhibition was related to extrinsic thinking due to competing response options on the SST. Shifting was associated with extrinsic thinking as shifting requires changing perspectives or imagining how objects look when viewed from different perspectives (Diamond, 2000). The SST is dependent on abilities to change perspectives, thus the relation between shifting and SST performance. Associations between working memory and SST performance were likely the result of participants’ need to shift between two representations and maintain where the target was located in the small representation in working memory during this translation of dimensionality. It is assumed that individuals with reduced working memory processing capacity would not be able to effectively retain location information of the target in one map when trying to make a decision about location on the second map.
We replicated reports of working memory’s association with spatial thinking (Lehmann et al., 2014; Kaufman, 2007), and showed inhibition and shifting also relate to individual differences in spatial thinking. This is an important finding as research suggests spatial thinking is malleable. The discovery that executive function relates to spatial ability can lead to development of effective interventions to improve spatial thinking overall and reduce gender and socioeconomic status gaps in STEM (Newcombe & Frick, 2010). Thus, it can be hypothesized that providing children with opportunities to practice executive function skills may help improve spatial ability.
This study has limitations. First, data were correlational and do not allow for causal claims. Second, data were gathered at one timepoint and do not allow for examination of change over time. Third, most, if not all, executive function measures have at least some spatial demands making it difficult to find a pure executive function task that does not include a spatial component to use in this research study. Lastly, one measure of extrinsic spatial ability was assessed, so future studies should replicate using additional extrinsic tasks.
Future research should replicate relations between executive function and spatial ability to determine whether results are observed in older children, use experimental manipulations to examine causal and/or bidirectional relations, develop training studies to determine whether training executive function is a way to increase intrinsic and extrinsic spatial skill, conduct classroom interventions targeting executive function, spatial skills, or both, as an avenue for assessing the relations between these constructs, and conduct longitudinal studies to see if early executive function skill is associated with later spatial ability.
References
- Anderson PJ, & Reidy N (2012). Assessing executive function in preschoolers. Neuropsychology Review, 22, 345–360. 10.1007/s11065-012-9220-3 [DOI] [PubMed] [Google Scholar]
- Ansari D, Donlan C, Thomas MSC, Ewing SA, Peen T, & Karmiloff-Smith A (2003). What makes counting count? Verbal and visuo-spatial contributions to typical and atypical number development. Journal of Experimental Child Psychology, 85, 50–62. 10.1016/S0022-0965(03)00026-2 [DOI] [PubMed] [Google Scholar]
- Benjamini Y, & Hochberg Y (1995). Controlling the False Discovery Rate: A practical and powerful approach to multiple testing. Journal of the Royal Statistical Society, Series B, 57, 289–300. [Google Scholar]
- Best JR, & Miller PH (2010). A developmental perspective on executive function. Child Development, 81(6), 1641–1660. [DOI] [PMC free article] [PubMed] [Google Scholar]
- Bower CA, & Liben LS (2021). Can a domain-general spatial intervention facilitate children’s science learning? A lesson from astronomy. Child Development, 92, 76–100. 10.1111/cdev.13439 [DOI] [PubMed] [Google Scholar]
- Carlozzi NE, Tulsky DS, Kail RV, & Beaumont JL (2013). VI. NIH Toolbox Cognition Battery (CB): Measuring processing speed. Monographs of the Society for Research in Child Development, 78: 88–102. 10.1111/mono.12036 [DOI] [PMC free article] [PubMed] [Google Scholar]
- Casasola M, Wei WS, Suh DD, Donskoy P, & Ransom A (2020). Children’s exposure to spatial language promotes their spatial thinking. Journal of Experimental Psychology: General, 149, 1116–1136. 10.1037/xge0000699 [DOI] [PubMed] [Google Scholar]
- Casey BM, Andrews N, Schindler H, Kersh JE, Samper A, & Copley J (2008). The development of spatial skills through interventions involving block building activities. Cognition and Instruction, 26, 269–309. 10.1080/07370000802177177 [DOI] [Google Scholar]
- Clements DH, & Sarama J (2011). Early childhood teacher education: The case of geometry. Journal of Mathematics Teacher Education, 14, 133–148. 10.1007/s10857-011-9173-0 [DOI] [Google Scholar]
- Diamond A (2012). Activities and programs that improve children’s executive functions. Current Directions in Psychological Science, 21, 335–341. 10.1177/0963721412453722 [DOI] [PMC free article] [PubMed] [Google Scholar]
- Diamond A (2013). Executive functions. Annual Review of Psychology, 64, 135–168. 10.1146/annurev-psych-113011-143750 [DOI] [PMC free article] [PubMed] [Google Scholar]
- Frick A, & Newcombe NS (2012). Getting the big picture: Development of spatial scaling abilities. Cognitive Development, 27, 270–282. 10.1016/j.cogdev.2012.05.004 [DOI] [Google Scholar]
- Friedman NP & Miyake A (2017). Unity and diversity of executive functions: Individual differences as a window on cognitive structure. Cortex, 86, 186–204. 10.1016/j.cortex.2016.04.023 [DOI] [PMC free article] [PubMed] [Google Scholar]
- Gershon RC, Slotkin J, Manly JJ, Blitz DL, Beaumont JL, Schnipke D, Wallner-Allen K, Golinkoff RM, Gleason JB, Hirsh-Pasek K, Adams MJ, & Weintraub S (2013a), IV. NIH Toolbox Cognition Battery (CB): Measuring language (vocabulary comprehension and reading decoding). Monographs of the Society for Research in Child Development, 78: 49–69. 10.1111/mono.12034 [DOI] [PMC free article] [PubMed] [Google Scholar]
- Gershon RC, Wagster MV, Hendrie HC, Fox NA, Cook KF, & Nowinski CJ (2013b). NIH toolbox for assessment of neurological and behavioral function. Neurology, 80(11 Supplement 3), S2–S6. 10.1212/WNL.0b013e3182872e5f [DOI] [PMC free article] [PubMed] [Google Scholar]
- Gunderson EA, Ramirez G, Beilock SL, & Levine SC (2012). The relation between spatial skill and early number knowledge: The role of the linear number line. Developmental Psychology, 48, 1229–1241. 10.1037/a0028593 [DOI] [PMC free article] [PubMed] [Google Scholar]
- Harvey HA & Miller GE (2017). Executive function skills, early mathematics, and vocabulary in head start preschool children. Early Education and Development, 28, 290–307. 10.1080/10409289.2016.1218728 [DOI] [Google Scholar]
- Hawes Z, LeFevre JA, Xu C, & Bruce CD (2015). Mental rotation with tangible three-dimensional objects: A new measure sensitive to developmental differences in 4- to 8 year-old children. Mind, Brain, and Education, 9, 10–18. 10.1111/mbe.12051 [DOI] [Google Scholar]
- He ZH, Li BH, & Yin WG (2019). Executive function and mental rotation during middle childhood: The effect of age. The Journal of Genetic Psychology, 180(2-3), 96–102. 10.1080/00221325.2019.1582474 [DOI] [PubMed] [Google Scholar]
- Hegarty M, & Waller DA (2005). Individual differences in spatial abilities. In Shah P & Miyake A (Eds.), The Cambridge Handbook of Visuospatial Thinking (p. 121–169). Cambridge University Press. 10.1017/CBO9780511610448.005 [DOI] [Google Scholar]
- Hodgkiss A, Gilligan KA, Tolmie AK, Thomas MS, & Farran EK (2018). Spatial cognition and science achievement: The contribution of intrinsic and extrinsic spatial skills from 7 to 11 years. British Journal of Educational Psychology, 88, 675–697. 10.1111/bjep.12211 [DOI] [PMC free article] [PubMed] [Google Scholar]
- Hume T, & Hume S (2015). PathSpan (Version 2.0.1). [Mobile application software]. Retrieved from http://itunes.apple.com
- Hyun J-S, & Luck SJ (2007). Visual working memory as the substrate for mental rotation. Psychonomic Bulletin & Review, 14, 154–158. 10.3758/BF03194043 [DOI] [PubMed] [Google Scholar]
- Jansen P, & Heil M (2010). The relation between motor development and mental rotation ability in 5- to 6-year-old children. European Journal of Developmental Science, 4, 66–74. 10.3233/DEV-2010-4105 [DOI] [Google Scholar]
- Jansen P, Kellner J, & Rieder C (2013). The improvement of mental rotation performance in second graders after creative dance training. Creative Education, 4, 418–422. 10.4236/ce.2013.46060. [DOI] [Google Scholar]
- Jansen P, Schmelter A, Kasten L, & Heil M (2011). Impaired mental rotation performance in overweight children. Appetite, 56, 766–769. 10.1016/j.appet.2011.02.021 [DOI] [PubMed] [Google Scholar]
- Jirout J, & Newcombe NS (2015). Building blocks for developing spatial skills: Evidence from a large, representative U.S. sample. Psychological Science, 26, 302–310. 10.1177/0956797614563338 [DOI] [PubMed] [Google Scholar]
- Kaufman SB (2007). Sex differences in mental rotation and spatial visualization ability: Can they be accounted for by differences in working memory capacity? Intelligence, 35, 211–223. 10.1016/j.intell.2006.07.009 [DOI] [Google Scholar]
- Könen T, Strobach T, & Karbach J (2021). Working memory training. In Strobach T & Karbach J (Eds.). Cognitive Training (pp. 155–167). Springer, Cham. [Google Scholar]
- Lauer JE, Esposito AG, & Bauer PJ (2018). Domain-specific anxiety relates to children’s math and spatial performance. Developmental Psychology, 54, 2126–2138. 10.1037/dev0000605 [DOI] [PMC free article] [PubMed] [Google Scholar]
- Lehmann J, Quaiser-Pohl C, & Jansen P (2014). Correlation of motor skill, mental rotation, and working memory in 3- to 6-year-old children. European Journal of Developmental Psychology, 11, 560–573. 10.1080/17405629.2014.888995 [DOI] [Google Scholar]
- Levine SC, Huttenlocher J, Taylor A, & Langrock A (1999). Early sex differences in spatial skill. Developmental Psychology, 35, 940–949. 10.1037/0012-1649.35.4.940 [DOI] [PubMed] [Google Scholar]
- Levine SC, Ratliff KR, Huttenlocher J, & Cannon J (2012). Early puzzle play: A predictor of preschoolers’ spatial transformation skill. Developmental Psychology, 48, 530–542. 10.1037/a0025913 [DOI] [PMC free article] [PubMed] [Google Scholar]
- Lubinski D (2010). Spatial ability and STEM: A sleeping giant for talent identification and development. Personality and Individual Differences, 49, 344–351. 10.1016/j.paid.2010.03.022 [DOI] [Google Scholar]
- Mix KS, Hambrick DZ, Satyam VR, Burgoyne AP, & Levine SC (2018). The latent structure of spatial skill: A test of the 2x2 typology. Cognition, 180, 268–278. 10.1016/j.cognition.2018.07.012 [DOI] [PubMed] [Google Scholar]
- Miyake A, Friedman NP, Emerson MJ, Witzki AH, Howerter A, & Wager TD (2000). The unity and diversity of executive functions and their contributions to complex “frontal lobe” tasks: A latent variable analysis. Cognitive psychology, 41, 49–100. 10.1006/cogp.1999.0734 [DOI] [PubMed] [Google Scholar]
- Miyake A, Friedman NP, Rettinger DA, Shah P, & Hegarty M (2001). How are visuospatial working memory, executive functioning, and spatial abilities related? A latent-variable analysis. Journal of Experimental Psychology: General, 130, 621–640. 10.1037/0096-3445.130.4.621 [DOI] [PubMed] [Google Scholar]
- Newcombe N (2010). Picture this: Increasing math and science by improving spatial thinking. American Educator, 34, 29–43. 10.1037/A0016127 [DOI] [Google Scholar]
- Newcombe NS, & Frick A (2010). Early education for spatial intelligence: Why, what, and how. Mind, Brain, and Education, 4, 102–111. 10.1111/j.1751228X.2010.01089.x [DOI] [Google Scholar]
- Newcombe NS, & Shipley TF (2015). Thinking about spatial thinking: New typology, new assessments. In Studying visual and spatial reasoning for design creativity (pp. 179–192). Springer, Dordrecht. [Google Scholar]
- Pruden SM, Levine SC, & Huttenlocher J (2011). Children’s spatial thinking: Does talk about the spatial world matter? Developmental Science, 14, 1417–1430. 10.1111/j.1467-7687.2011.01088.x [DOI] [PMC free article] [PubMed] [Google Scholar]
- Ralph YK, Berinhout K, & Maguire MJ (2020). Gender differences in mothers’ spatial language use and children’s mental rotation abilities in preschool and kindergarten. Developmental Science, e13037. 10.1111/desc.13037 [DOI] [PubMed] [Google Scholar]
- Ramirez G, Gunderson EA, Levine SC, & Beilock SL (2012). Spatial anxiety relates to spatial abilities as a function of working memory in children. Quarterly Journal of Experimental Psychology, 65, 474–487. 10.1080/17470218.2011.616214 [DOI] [PubMed] [Google Scholar]
- Richter W, Somorjai R, Summers R, Jarmasz M, Menon RS, Gati JS, Georgopoulos AP, Tegeler C, Ugurbil K, & Kim S-G (2000). Motor activity during mental rotation studied by time-resolved single-trial fMRI. Journal of Cognitive Neuroscience, 12, 310–320. 10.1162/089892900562129 [DOI] [PubMed] [Google Scholar]
- Rosenthal EN, Riccio CA, Gsanger KM, & Jarratt KP (2006). Digit Span components as predictors of attention problems and executive functioning in children. Archives of Clinical Neuropsychology, 21, 131–139. 10.1016/j.acn.2005.08.004 [DOI] [PubMed] [Google Scholar]
- Sinton D, Bednarz SW, Gersmehl P, & Uttal DH (2013). The People’s Guide to Spatial Thinking. Washington, D.C.: National Council for Geographic Education. [Google Scholar]
- Terlecki MS, Necombe NS, & Little M (2008). Durable and generalized effects of spatial experience on mental rotation: Gender differences in growth patterns. Applied Cognitive Psychology, 22, 996–1013. 10.1002/acp.1420 [DOI] [Google Scholar]
- Träff U, Olsson L, Skagerlund K, Skagenholt M, & Östergren R (2019). Logical reasoning, spatial processing, and verbal working memory: Longitudinal predictors of physics achievement at age 12–13 years. Frontiers in Psychology, 10, 1929. 10.3389/fpsyg.2019.01929 [DOI] [PMC free article] [PubMed] [Google Scholar]
- Turan E, Kobaş M, & Göksun T (2021). Spatial language and mental transformation in preschoolers: Does relational reasoning matter? Cognitive Development, 57, 100980. 10.1016/j.cogdev.2020.100980 [DOI] [Google Scholar]
- Uttal DH, Meadow NG, Tipton E, Hand LL, Alden AR, Warren C, & Newcombe NS (2013). The malleability of spatial skills: A meta-analysis of training studies. Psychological Bulletin, 139, 352. 10.1037/a0028446 [DOI] [PubMed] [Google Scholar]
- Vander Heyden KM, Huizinga M, & Jolles J (2017). Effects of a classroom intervention with spatial play materials on children’s object and viewer transformation abilities. Developmental Psychology, 53, 290–305. 10.1037/dev0000224 [DOI] [PubMed] [Google Scholar]
- Verdine BN, Golinkoff RM, Hirsh-Pasek K, Newcombe NS, Filipowicz AT, & Chang A (2014a). Deconstructing building blocks: Preschoolers’ spatial assembly performance relates to early mathematical skills. Child Development, 85, 1062–1076. 10.1111/cdev.12165 [DOI] [PMC free article] [PubMed] [Google Scholar]
- Verdine BN, Irwin CM, Golinkoff RM, & Hirsh-Pasek K (2014b). Contributions of executive function and spatial skills to preschool mathematics achievement. Journal of Experimental Child Psychology, 126, 37–51. 10.1016/j.jecp.2014.02.012 [DOI] [PMC free article] [PubMed] [Google Scholar]
- Wai J, Lubinski D, & Benbow CP (2009). Spatial ability for STEM domains: Aligning over 50 years of cumulative psychological knowledge solidifies its importance. Journal of Educational Psychology, 101, 817–835. 10.1037/a0016127 [DOI] [Google Scholar]
- Wang L, & Carr M (2014). Working memory and strategy use contribute to gender differences in spatial ability. Educational Psychologist, 49, 261–282. 10.1080/00461520.960568 [DOI] [Google Scholar]
- Wechsler D (2002). The Wechsler Preschool and Primary Scale of Intelligence, Third Edition (WPPSI-III). San Antonio, TX: The Psychological Corporation. [Google Scholar]
- Wiebe SA, Espy KA, & Charak D (2008). Using confirmatory factor analysis to understand executive control in preschool children: I. Latent structure. Developmental Psychology, 44, 575–587. 10.1037/0012-1649.44.2.575 [DOI] [PubMed] [Google Scholar]
- Zelazo PD (2006). The Dimensional Change Card Sort (DCCS): A method of assessing executive function in children. Nature Protocols, 1, 297–301. 10.1038/nprot.2006.46 [DOI] [PubMed] [Google Scholar]
- Zelazo PD, Anderson JE, Richler J, Wallner-Allen K, Beaumont JL and Weintraub S (2013), II. NIH Toolbox Cognition Battery (CB): Measuring executive function and attention. Monographs of the Society for Research in Child Development, 78, 16–33. 10.1111/mono.12032 [DOI] [PubMed] [Google Scholar]
- Zhang Q, Wang C, Zhao Q, Yang L, Buschkuehl M, & Jaeggi SM (2019). The malleability of executive function in early childhood: Effects of schooling and targeted training. Developmental Science, 22: e12748. 10.1111/desc.12748 [DOI] [PMC free article] [PubMed] [Google Scholar]