Abstract
Embryos across metazoan lineages can enter reversible states of developmental pausing, or diapause, in response to adverse environmental conditions. The molecular mechanisms that underlie this remarkable dormant state remain largely unknown. Here we show that m6A RNA methylation by Mettl3 is required for developmental pausing in mouse blastocysts and embryonic stem cells (ESCs). Mettl3 enforces transcriptional dormancy via two interconnected mechanisms: i) it promotes global mRNA destabilization, and ii) it suppresses global nascent transcription by destabilizing the mRNA of the transcriptional amplifier and oncogene N-Myc, which we identify as a critical anti-pausing factor. Knockdown of N-Myc rescues pausing in Mettl3−/− ESCs, and forced demethylation and stabilization of Mycn mRNA in paused wild-type ESCs largely recapitulates the transcriptional defects of Mettl3−/− ESCs. These findings uncover Mettl3 as a key orchestrator of the crosstalk between transcriptomic and epitranscriptomic regulation during developmental pausing, with implications for dormancy in adult stem cells and cancer.
Development is often assumed to be a sequential unfolding of genetic programs towards increased complexity and occurring with a stereotypical timing. However, adjusting developmental timing can enhance survival in adverse conditions1,2. In mammals, this manifests as embryonic diapause, the delayed implantation of the blastocyst3,4. The switch to a dormant state of paused pluripotency can be induced in mouse blastocysts and embryonic stem cells (ESCs) by inhibition of mTOR, a conserved growth-promoting kinase, and is characterized by a drastic global decrease in biosynthetic activity, including gene transcription5. Global inhibition of translation6 or of Myc transcription factors7 can capture features of ESC pausing but, unlike mTOR inhibition, does not recapitulate blastocyst diapause5. How the transcriptionally dormant state, or hypotranscription, of paused ESCs and blastocysts is enforced remains poorly understood.
RNA modifications have recently emerged as a key layer of regulation of the transcriptome. N6-methyladenosine (m6A) is the most abundant and best understood of all known mRNA modifications8. The methyl group is deposited on nascent RNA by a methyltransferase complex, with Mettl3 as the catalytically active subunit9,10. The mark plays essential roles during post-implantation development via mRNA destabilization of key cell fate regulators, including Klf4, Nanog, and Sox211–13. In mouse ESCs, the m6A readers Ythdf1–3 promote RNA decay, with possible compensation between the readers14. In addition, m6A RNA methylation was recently reported to modulate the transcriptional state of ESCs by destabilizing chromosome-associated RNAs and transposon-derived RNAs15–17 and by promoting the recruitment of heterochromatin regulators18. Given these documented roles of m6A in the transcriptome of ESCs, we set out to explore a potential function for RNA modifications in the regulation of transcriptional dormancy during diapause. Our results show that Mettl3-mediated m6A RNA methylation is essential for mouse developmental pausing, and uncover a Mettl3/N-Myc mRNA axis that orchestrates transcriptional dormancy of paused cells.
Results
Mettl3 is required for paused pluripotency
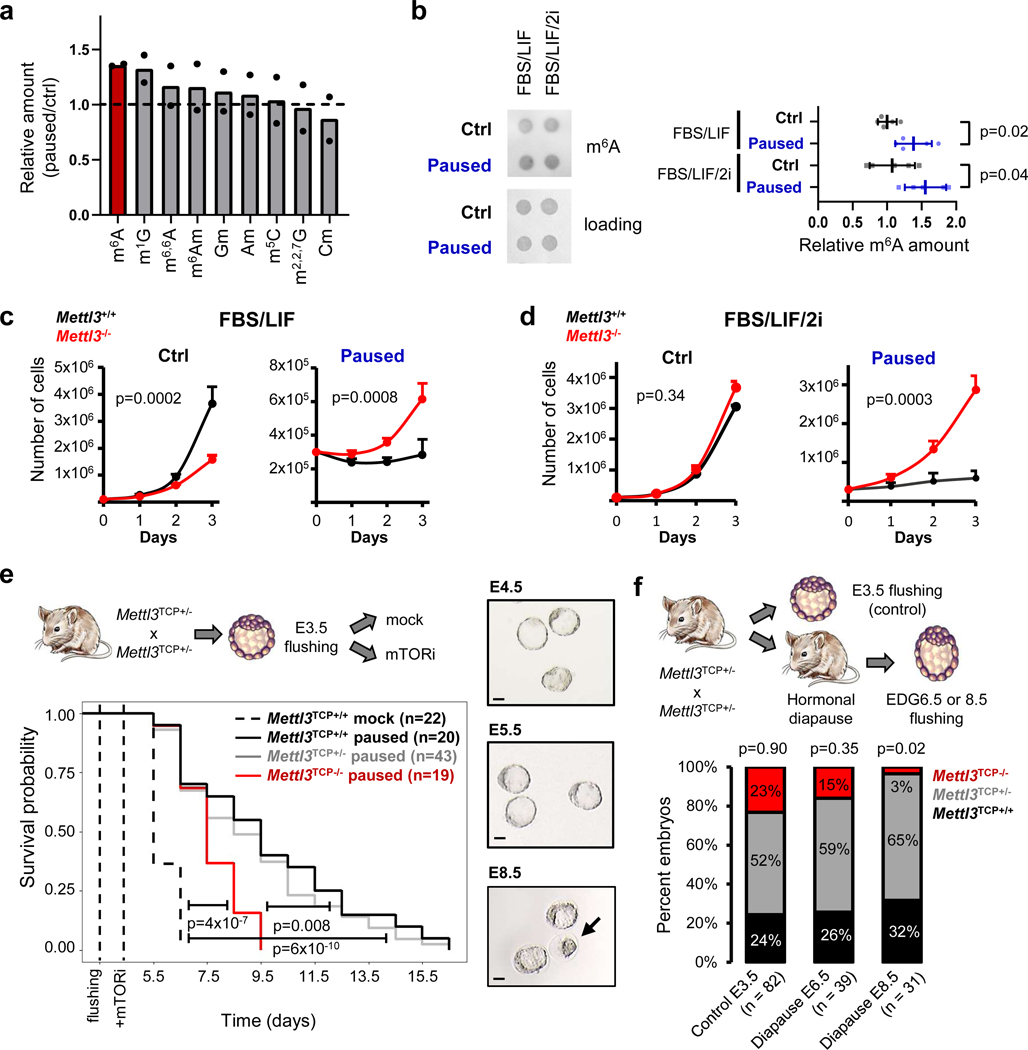
To investigate a potential role of RNA modifications in developmental pausing, we first performed a comprehensive screen in ESCs paused by mTOR inhibition. Mass spectrometry revealed significantly increased levels of m6A in paused ESCs, relative to control condition (Fig. 1a, Extended Data Fig. 1a). The increase in m6A was also observed by dot blot in paused ESCs induced both by chemical inhibition of mTOR or dual knockdown of mTORC1/2 (Fig. 1b, Extended Data Fig. 1b–d). Paused ESCs, induced by mTOR inhibition, are viable and pluripotent but proliferate very slowly compared to control ESCs5. Interestingly, we found that paused Mettl3−/− ESCs grow at a much faster rate than paused wildtype (Mettl3+/+) ESCs, suggesting defective suppression of proliferation upon loss of Mettl3 (Fig. 1c–d, Extended Data Fig. 1e–h). Interestingly, this faster proliferation rate of Mettl3−/− ESCs relative to Mettl3+/+ is observed only in the paused state and not in control conditions (Fig. 1c–d, Extended Data Fig. 1h), suggesting a specific role in developmental pausing. To explore a potential role of Mettl3 in blastocyst pausing, we turned to Mettl3−/− mice (see model in Extended Data Fig. 1i–j). As we reported previously, inhibition of mTOR prolongs survival of blastocysts ex vivo for 1–2 weeks and induces a paused state5, a finding reproduced here with Mettl3+/+ embryos (Fig. 1e). By contrast, we found that Mettl3−/− blastocysts are prematurely lost during ex vivo pausing (Fig. 1e). Mettl3−/− embryos are also largely incompatible with hormonally induced diapause (Fig. 1f). Taken together, these findings reveal an essential role for Mettl3 in ESC and blastocyst pausing.
Figure 1: The m6A methyltransferase Mettl3 is essential for paused pluripotency.
a. Screening of RNA modifications by mass spectrometry in poly(A) RNA. Levels in paused ESCs are normalized to control ESCs. Data are mean, n=2 biological replicates. b. Dot blot showing an increase in m6A levels in paused ESCs in FBS/LIF and FBS/LIF/2i media. Levels of m6A are normalized to RNA loading control (methylene blue staining). Data are mean ± SD, n=5 biological replicates. c-d. Growth curves showing that Mettl3−/− ESCs fail to suppress proliferation in paused conditions in both FBS/LIF (c) and FBS/LIF/2i (d) media. Data are mean ± SEM, n=3 biological replicates. e. Mettl3 loss leads to the premature death of mouse blastocysts cultured ex vivo in paused conditions. Right: sample images of cultured embryos, with black arrow indicating a dead embryo and scale bar at 50μm. f. Quantification of recovered (live) embryos at E3.5 (control) or at Equivalent Days of Gestation (EDG) 6.5 and 8.5 following hormonal diapause, showing that Mettl3TCP−/− embryos are impaired at undergoing hormonal diapause.
Number of embryos (n) as indicated (e-f). P-values (as indicated on figure) by two-tailed Student’s t-tests (b), linear regression test with interaction (c-d), log-rank test (e), and χ2 test (f).
Mettl3 is required for transcriptional dormancy
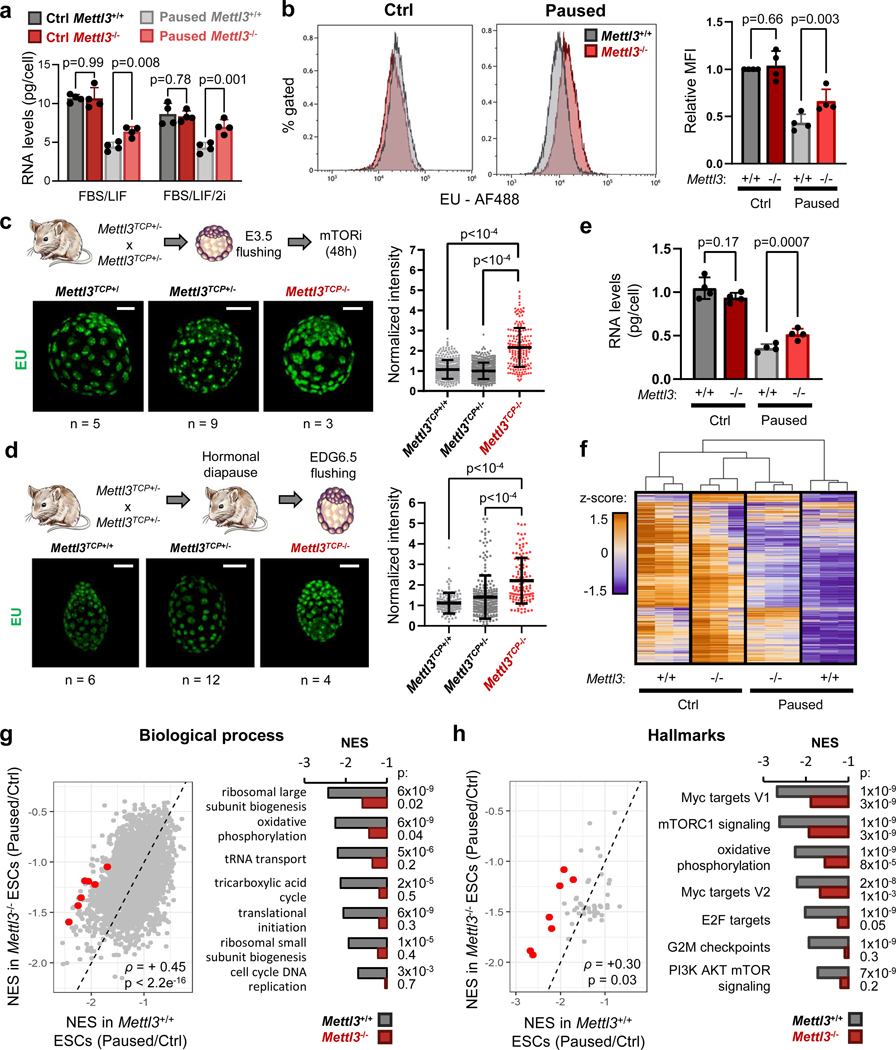
In light of the global hypotranscription observed in diapause5, we next explored the status of transcription in Mettl3−/− paused ESCs and blastocysts. In comparison with paused Mettl3+/+ cells, paused Mettl3−/− ESCs display increased levels of both total and nascent RNA per cell (Fig. 2a–b, Extended Data Fig. 2a). Levels of nascent RNA are also elevated in ex vivo paused and hormonally diapaused Mettl3−/− blastocysts, as compared with Mettl3+/− or Mettl3+/+ embryos (Fig. 2c–d, Extended Data Fig. 2b).
Figure 2: Mettl3 regulates hypotranscription in paused pluripotency.
a. Quantification of total RNA per cell in Mettl3+/+ and Mettl3−/− ESCs, grown in control and paused conditions, in FBS/LIF or FBS/LIF/2i media. Data are mean ± SD, n=4 biological replicates.
b. Representative histograms (left) of nascent transcription in Mettl3+/+ and Mettl3−/− ESCs grown in control or paused conditions and quantification (right) by median fluorescence intensity (MFI) relative to control Mettl3+/+ in each experiment, showing increased transcription in paused Mettl3−/− ESCs. Data are mean ± SD, n=4 biological replicates. Examples of FACS gating have been deposited on the Figshare repository (10.6084/m9.figshare.23551986). c-d. Immunofluorescence images and nuclear signal quantification of EU incorporation in ex vivo paused (c) and hormonally diapaused (d) blastocysts, showing increased nascent transcription in Mettl3TCP−/−. Data are mean ± SD. Number of embryos (n) as indicated, with scale bar at 50μm. e. Quantification of poly(A) RNA per cell in Mettl3+/+ and Mettl3−/− ESCs, grown in control and paused conditions. Data are mean ± SD, n=4 biological replicates. f. Heatmap of gene expression (by RNA-seq) for all genes expressed in Mettl3+/+ or Mettl3−/− ESCs, showing defective hypotranscription in paused Mettl3−/− ESCs. Data as z-score normalized per gene, with all samples displayed (n=3 biological replicates per group). g-h. Gene set enrichment analysis (GSEA) of gene expression changes in paused Mettl3+/+ and Mettl3−/− ESCs (as shown in Fig. 2f), using the “GO biological processes” (g) and “hallmarks” collections (h). Scatter plots (left) of the normalized enrichment scores (NES), with Spearman correlation coefficient (ρ). Representative pathways with defective hypotranscription in Mettl3−/− (red dots) are highlighted (right).
P-values (as indicated on figure) by two-tailed paired Student’s t-tests (a-b, e), one-way ANOVA with Dunnett’s multiple comparison test (c-d), two-sided pre-ranked gene set enrichment analysis with Benjamini-Hochberg FDR correction (f-g).
Paused Mettl3−/− ESC also display higher levels of poly(A) RNA per cell (Fig. 2e). Therefore, we performed cell number-normalized mRNA-sequencing, which uses exogenous RNA spike-ins and allows for quantification of global shifts in transcriptional output19, in Mettl3+/+ and Mettl3−/− control and paused ESCs (Extended Data Fig. 2c, Supplementary Table 1, and see Methods). In line with the global changes observed in poly(A) RNA levels (Fig. 2e), paused Mettl3−/− ESCs displayed a defective hypotranscriptional state (Fig. 2f, Extended Data Fig. 2d–f). Indeed, while 10,656 genes are downregulated in paused Mettl3+/+ cells, only 5,916 genes (i.e. 55.5%) are downregulated in paused Mettl3−/− cells (Extended Data Fig. 2e). This suppression of hypotranscription in paused Mettl3−/− ESCs is particularly evident for pathways and functional categories whose silencing is a feature of developmental pausing, such as translation, ribosome biogenesis, mTOR signaling, Myc targets and energy metabolism4,5,7,20,21 (Fig. 2g–h, Extended Data Fig. 2g–h, Supplementary Table 2). We found that the kinase activity of the mTORC1 complex itself does not appear to be aberrantly activated in paused Mettl3−/− ESCs (Extended Data Fig. 2i), suggesting that the mTORC1 pathway signature in Fig. 2h is driven by the overall transcriptional shift of Mettl3−/− ESCs towards a less paused, more proliferative state, with which the mTOR pathway is often associated. Overall, these results reveal that Mettl3 contributes to the state of global transcriptional dormancy observed during developmental pausing.
Mettl3 sustains dormancy via its methyltransferase activity
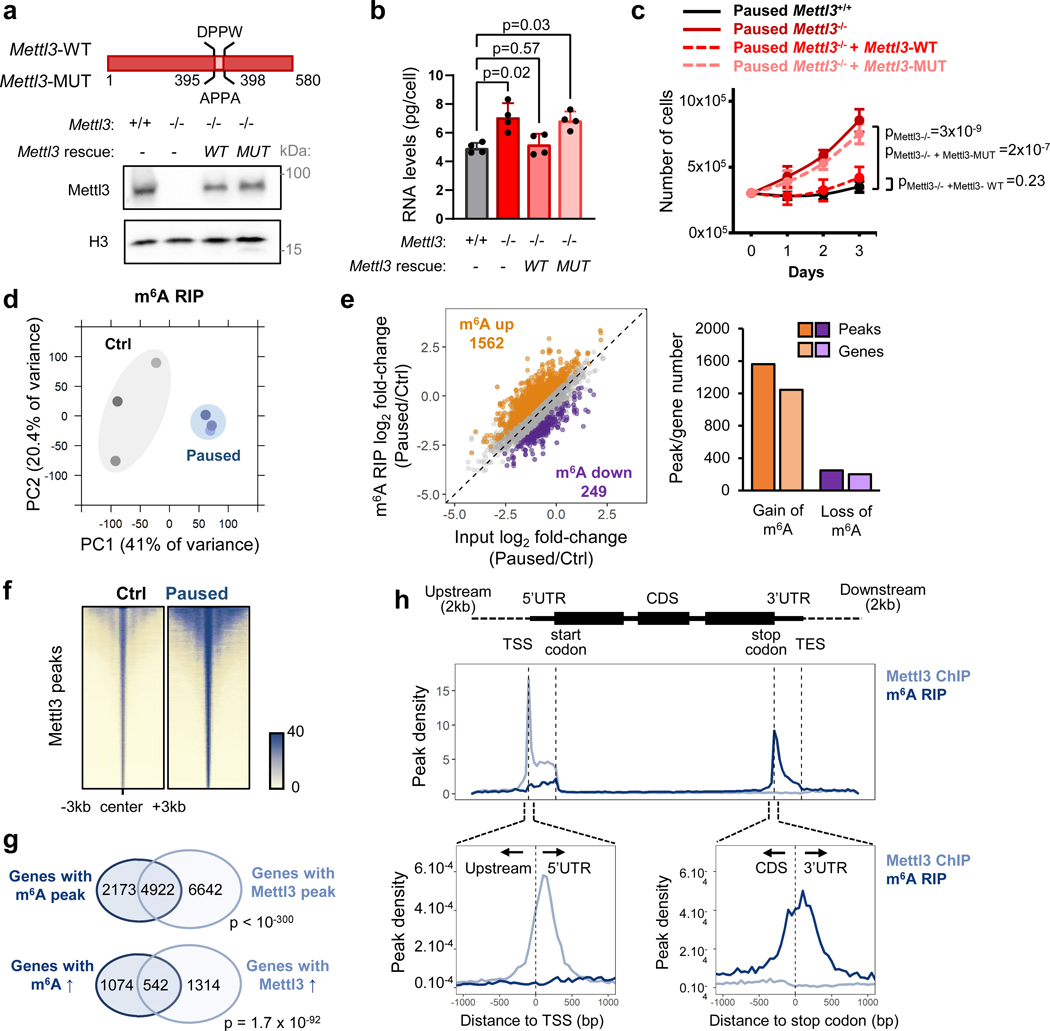
To probe the mechanism by which Mettl3 regulates pausing, we transfected Mettl3−/− ESCs with either wildtype Mettl3 or a catalytically inactive mutant protein (Fig. 3a)22. We found that only wildtype Mettl3 rescues the ESC pausing phenotype of Mettl3−/− ESCs (Fig. 3b–c), indicating that m6A methyltransferase activity is necessary to implement paused pluripotency. Thus, we next mapped m6A modifications transcriptome-wide by methylated RNA immunoprecipitation followed by sequencing (MeRIP-seq), using a cell number-normalization approach (Extended Data Fig. 3a–e, and see Methods). We identified 15,046 m6A peaks within 7,095 genes, which represents 48% of all genes expressed in control or paused ESCs (Supplementary Table 3). Principal Component Analysis (PCA) revealed that paused ESCs are in a distinct state with regards to the m6A RNA profile (Fig. 3d). Consistent with the quantitative mass spectrometry analysis (Fig. 1a), MeRIP-seq showed a global increase in m6A in paused ESCs, with 1,562 peaks significantly hypermethylated versus only 249 regions being hypomethylated relative to control ESCs (Fig. 3e, Extended Data Fig. 3f–h).
Figure 3: The methyltransferase activity of Mettl3 sustains paused pluripotency.
a. Schematic of wildtype (WT) and catalytically inactive mutant (MUT) Mettl3 protein (top), and western blot of rescue by transfection in Mettl3−/− ESCs (bottom, representative of 3 biological replicates). b-c. Transfection with wildtype Mettl3, but not its catalytic mutant, restores the in vitro pausing phenotype of hypotranscription (b) and suppressed proliferation (c) in paused Mettl3−/− ESCs (n=4 biological replicates). d. PCA plot for all m6A peaks across all samples by MeRIP-seq, showing that paused ESCs have distinct m6A profiles (n = 3 biological replicates per condition). e. MeRIP-seq shows increased m6A in paused ESCs. Scatter plot (left) and number of peaks/genes with significant gain and loss of m6A (right, fold-change > 1.5 and adjusted P < 0.05). f. Heatmaps of Mettl3 ChIP-seq signal in control and paused ESCs, showing increased Mettl3 binding in paused ESCs. Signal was merged from 2 biological replicates per condition. g. Venn diagrams showing significant overlap between target genes of m6A (on related RNA) and Mettl3, identifying all target genes (top) or genes with increased levels of m6A and Mettl3 (fold-change > 1.5, no statistical threshold) in paused ESCs (bottom). h. Metagene profiles of peaks indicate that Mettl3 mainly targets the promoter and 5’UTR regions, while m6A mainly targets the stop codon and 3’UTR.
All data are mean ± SD (b, c). P-values (as indicated on figure) by one-way ANOVA with Dunnett’s multiple comparison test (b), linear regression test with interaction (c), two-sided t-test adjusted by Benjamini-Hochberg FDR (e), and one-sided hypergeometric test (g).
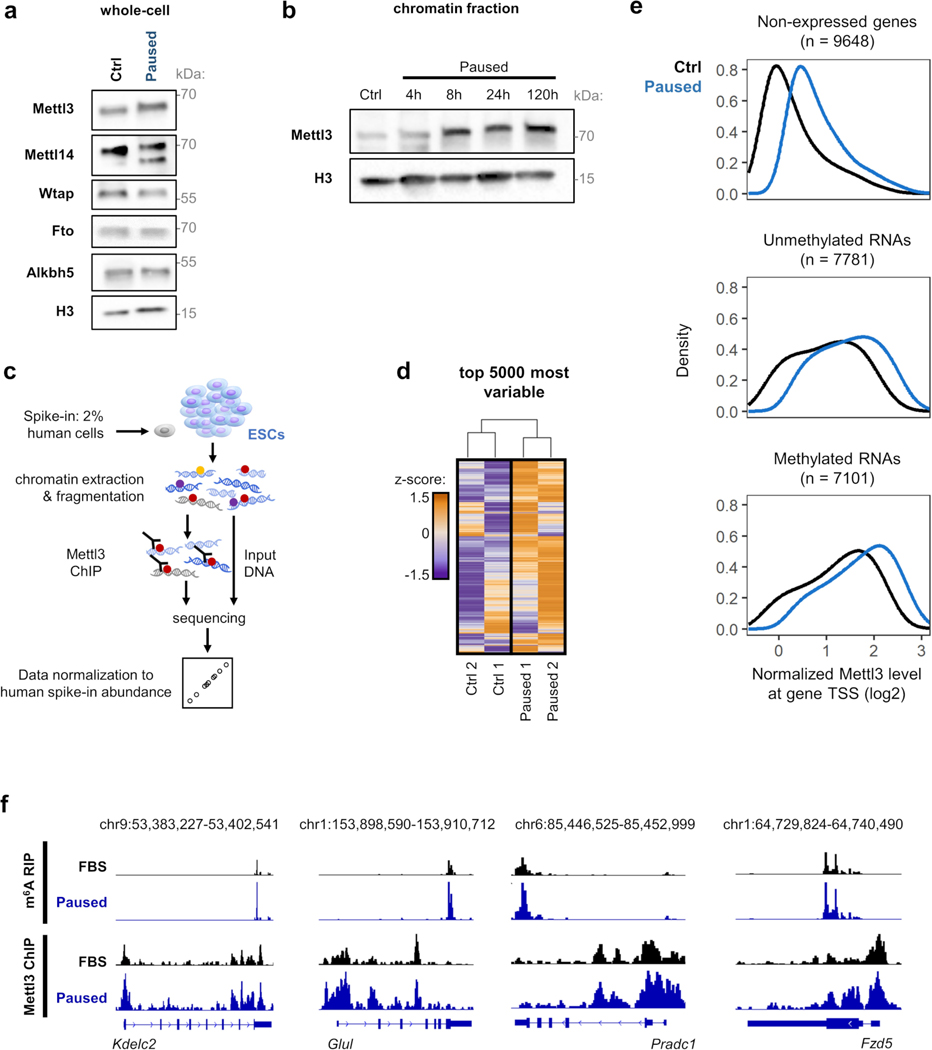
To understand the gain in m6A in paused ESCs, we investigated the levels of Mettl3 protein. Interestingly, despite no change in whole cell levels of the m6A writers or erasers, Mettl3 is greatly increased in the chromatin compartment upon transition to the paused state (Extended Data Fig. 4a–b). Mettl3 has previously been shown to bind to chromatin in normal ESCs and cancer cells, where it deposits m6A co-transcriptionally18,23–25. We therefore mapped the genome-wide distribution of Mettl3 by chromatin immunoprecipitation-sequencing (ChIP-seq), using a cell number-normalization approach (Extended Data Fig. 4c–d, and see Methods). As anticipated, we observed higher levels of Mettl3 occupancy in paused ESCs relative to control ESCs (Fig. 3f). Although Mettl3 binds extensively throughout the genome, it is more abundant over expressed genes, particularly if their RNAs are also m6A methylated (Extended Data Fig. 4e). The majority of m6A methylated RNAs (4,922/7,095, 69.4%) are transcribed from genes occupied by Mettl3 in ESCs, and transcripts gaining m6A during pausing often arise from genes with elevated Mettl3 binding in paused ESCs (542/1,616, 33.5%, Fig. 3g, Extended Data fig. 4f). In agreement with recent reports18,23, Mettl3 localizes mainly to the transcriptional start site (TSS), while m6A is enriched near the stop codon and 3’ untranslated region (UTR) of coding genes in ESCs (Fig. 3h). Overall, these results indicate that an increased chromatin recruitment of Mettl3 underlies the gains of m6A RNA methylation during paused pluripotency, although we cannot exclude that Mettl3 may also exert other functions at chromatin.
Mettl3 promotes mRNA decay during developmental pausing
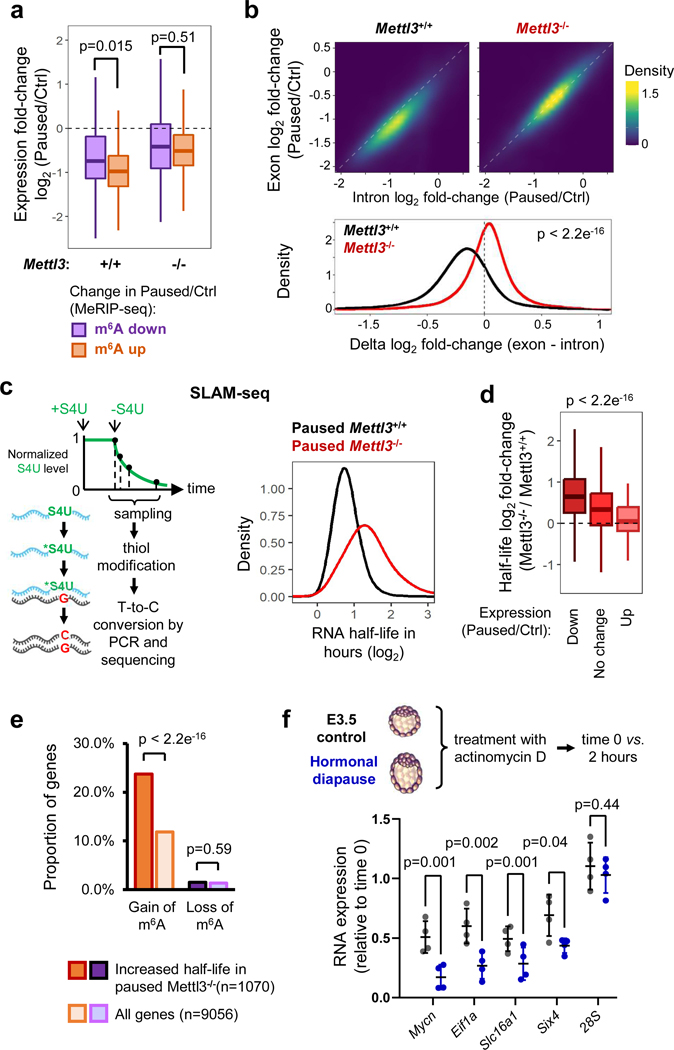
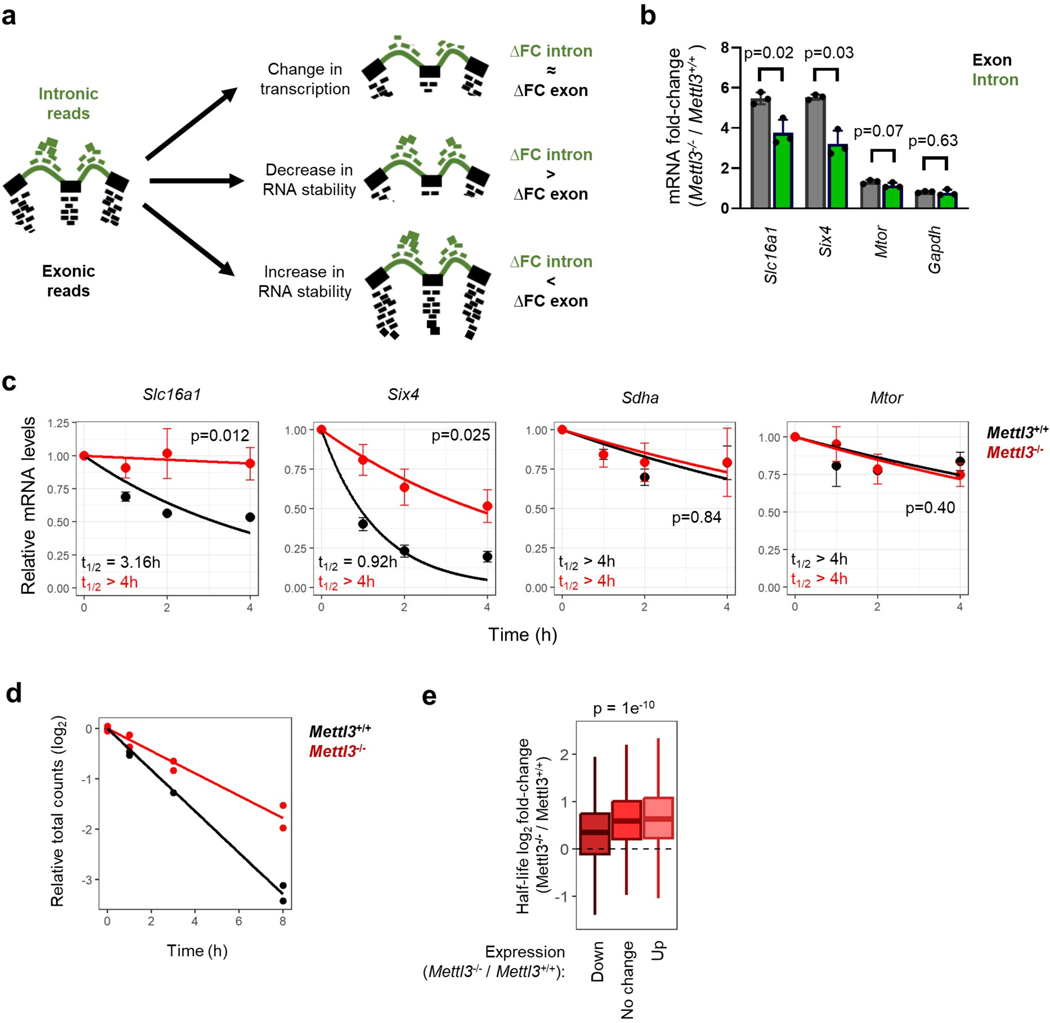
m6A methylation regulates numerous aspects of mRNA biology, including splicing, stability, translation and localization12,15,25–27. To dissect the function of m6A RNA methylation during pausing, we asked how changes in m6A impact mRNA levels during ESC pausing. In the context of global hypotranscription in wildtype ESCs upon pausing (5 and Fig. 2f), RNAs with increased m6A are significantly more downregulated than RNAs with decreased m6A (Fig. 4a). However, this association is lost in Mettl3−/− cells, when analyzing the same genes (Fig. 4a). As m6A is known to control the expression of pluripotency genes in ESCs via RNA decay, we next examined whether such mechanism also occurs during embryonic pausing. First, we re-analyzed the RNA-seq data from control and paused Mettl3+/+ and Mettl3−/− ES cells to assess post-transcriptional regulation (Fig. 2f and Extended Data Fig. 2). Exonic reads reflect steady-state mature mRNAs, whereas intronic reads mostly represent pre-mRNAs, and therefore comparing the difference between these has been shown to effectively quantify post-transcriptional regulation of gene expression28 (Extended Data Fig. 5a–c). This analysis pointed to a global destabilization of the transcriptome when Mettl3+/+ ESCs are induced to the paused state (Fig. 4b). In contrast, this global destabilization effect of pausing is entirely lost in Mettl3−/− ESCs (Fig. 4b). To follow up on these insights, we performed a transcriptome-wide analysis of RNA decay kinetics by transiently labeling transcripts with a uridine analogue and tracking their dynamics over time (SLAM-seq, see Fig. 4c and Methods). In line with the exon/intron read analysis (Fig. 4a–b), we found that paused Mettl3−/− ESCs display significantly longer RNA half-lives overall (Fig. 4c, Extended Data Fig. 5d, and Supplementary Table 4). Importantly, increased RNA stability in paused Mettl3−/− ESCs is significantly associated with gain of m6A and gene downregulation during pausing of wildtype ESCs (Fig. 4d–e, Extended Data Fig. 5e). We also validated, for a subset of diagnostic mRNAs derived from the ESC SLAM-seq data, that this increase in stability occurs in hormonally diapaused embryos as well (Fig. 4f). Taken together, these results indicate that Mettl3-dependent m6A methylation is responsible for a global destabilization of the transcriptome in paused ESCs.
Figure 4: Mettl3 promotes RNA destabilization during pausing.
a. RNAs with increased m6A in pausing (as defined in Fig. 3e) are significantly more downregulated than RNAs with decreased m6A. This pattern is Mettl3-dependent, as analyzing the same RNAs in Mettl3−/− ESCs shows no effect. RNA-seq data as shown in Fig. 2f (n=3 biological replicates per group).
b. Differences in expression (log2FC paused/Ctrl) between exonic and intronic RNA-seq data indicate a global decrease in RNA stability in Mettl3+/+ ESCs upon pausing. This effect is absent in Mettl3−/− ESCs. c. Schematic of the measurement of RNA degradation kinetics by SLAM-seq (left). In the paused state, Mettl3−/− ESCs display an overall longer half-life of the transcriptome compared to Mettl3+/+ ESCs (right). Half-lives were measured using 4 time points, with samples collected over 2 independent experiments (see Extended Data Fig. 5d). S4U: 4-thiouridine. d. Changes in RNA expression during pausing in wild-type ESCs (Paused/Ctrl, fold-change > 1.5) are anti-correlated with changes in RNA half-life in paused Mettl3−/− ESCs (as measured in Fig. 4c). e. RNAs with increased m6A in pausing (as defined in Fig. 3e) are enriched among RNAs stabilized in Mettl3−/− ESCs (half-life fold-change > 1.5). f. Increased RNA stability in control E3.5 blastocysts compared to diapaused blastocysts, as measured by treatment with actinomycin D for 2 hours followed by RT-qPCR (n = 4 biological replicates). Ribosomal 28S as negative control for RNA decay. All data are mean ± SD.
P-values (as indicated on figure) by two-tailed Student’s t-tests (a-b, f), one-way ANOVA (d) and two-proportion z-tests (e). Boxes in the box plots define the interquartile range (IQR) split by the median, with whiskers extending to the most extreme values within 1.5 × IQR beyond the box.
N-Myc is a key “anti-pausing” factor regulated by m6A
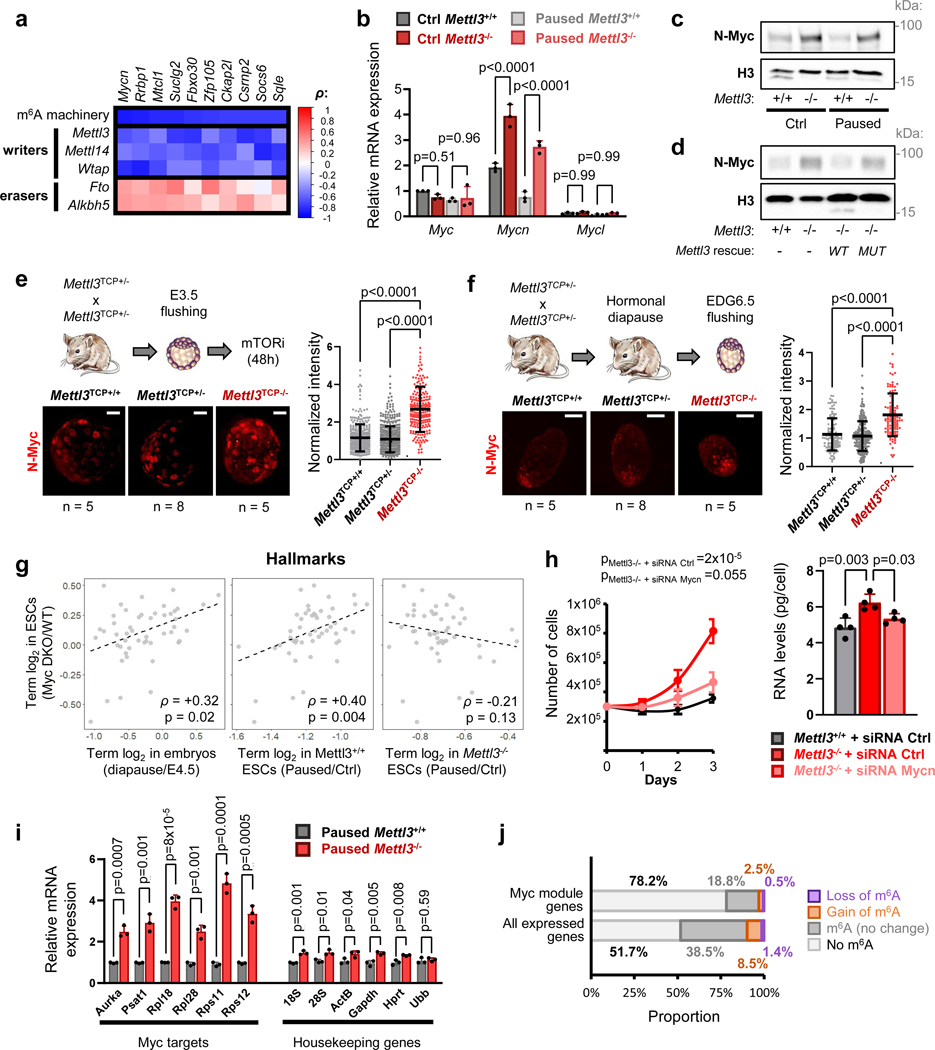
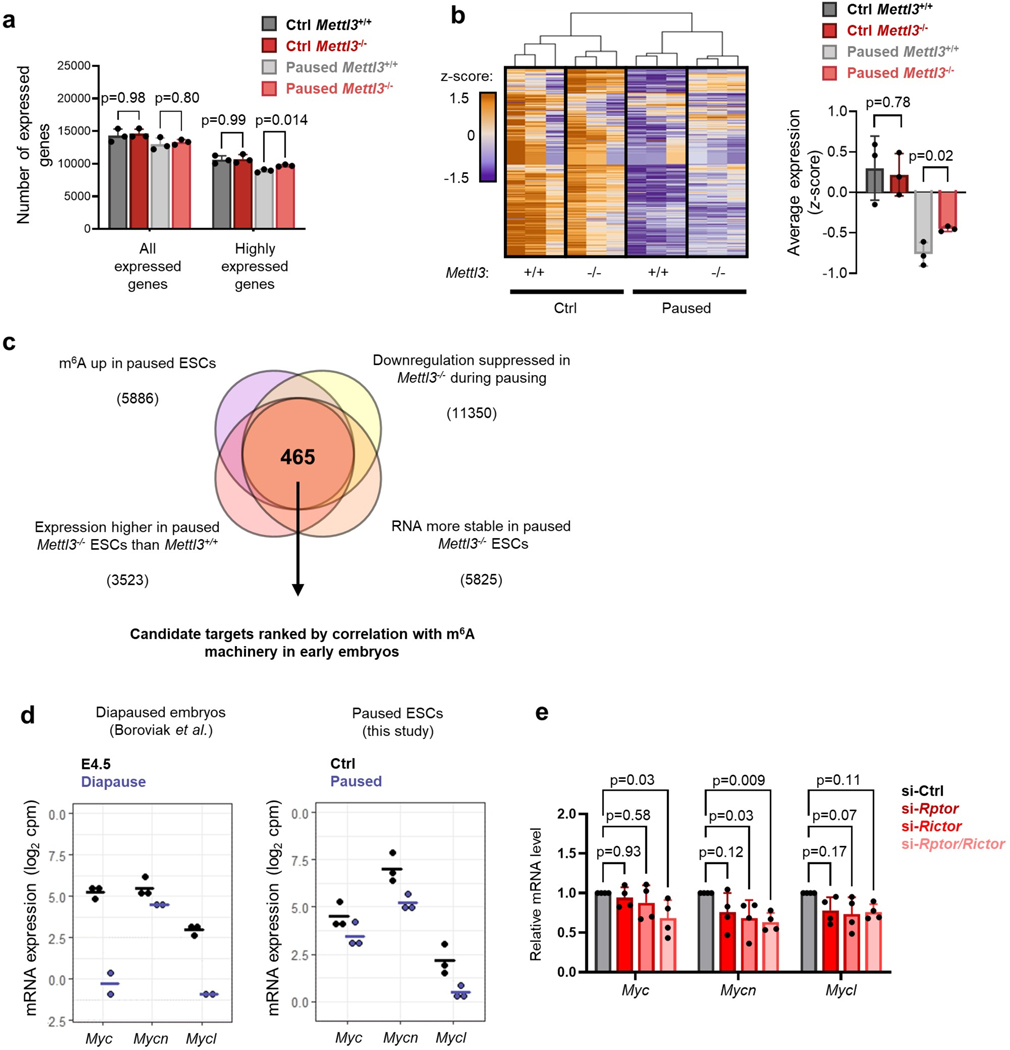
Our findings to this point indicate that the transcriptionally dormant state of paused cells is imparted by a combination of reduced nascent transcription and increased transcript destabilization, effects that are muted in Mettl3−/− paused ESCs (Fig. 2, Fig. 4, Extended Data Fig. 6a–b). We hypothesized that m6A may contribute to destabilizing mRNAs encoding putative “anti-pausing” factors. To identify such factors, we mined the RNA-seq, MeRIP-seq and SLAM-seq data for genes that i) gain m6A in paused ESCs; ii) are downregulated upon pausing but to a lesser extent in Mettl3−/− ESCs; iii) are expressed at least 2× higher in paused Mettl3−/− ESCs relative to control paused ESCs; and iv) have increased half-life in paused Mettl3−/− ESCs. This analysis identified 465 candidate anti-pausing factors (Extended Data Fig. 6c, see Methods). We then took advantage of published data from early mouse embryos4 to rank the candidates by their correlation with an expression signature of the m6A machinery. We reasoned that, if these candidate genes are regulated by m6A in vivo, their expression should be anti-correlated with expression of the methyltransferase complex and correlated with expression of the m6A demethylation machinery (Fig. 5a, Supplementary Table 5, see Methods for details). Remarkably, the top-ranked candidate from this analysis is Mycn, which codes for the N-myc proto-oncogene (N-Myc) and is highly expressed in both ESCs and embryos (Extended Data Fig. 6d–e). The Myc-regulated set of genes is a major module of the ESC pluripotency network29 and it is downregulated in diapause4,7. Importantly, Myc family members can act as global transcriptional amplifiers in the context of development and cancer29–31. We therefore investigated in-depth the regulation of Mycn by m6A RNA methylation and its potential impact in paused ESCs.
Figure 5: The transcription factor N-Myc is a key mediator of the pausing defects of Mettl3−/− ESCs.
a. To identify m6A targets relevant in vivo, candidate genes were ranked by their Spearman correlation coefficient (ρ) with the m6A machinery in early mouse embryos (see Methods, n=11 independent samples). The top 10 ranked candidates are shown. b, c. Increased expression of N-Myc in Mettl3−/− ESCs, shown by RT-qPCR (b, n=3 biological replicates) and western blot (c, representative of 4 biological replicates). d. Transfection with wildtype Mettl3, but not its catalytic mutant, restores N-Myc expression in Mettl3−/− ESCs (representative of 3 biological replicates). e, f. Immunofluorescence images (left) and nuclear signal quantification (right) of N-Myc protein in ex vivo paused (c) and hormonally diapaused (d) blastocysts, showing increased levels in Mettl3TCP−/−. Data are mean ± SD. Number of embryos (n) as indicated, with scale bar at 30μm. g. Scatter plots of the median log2 fold-changes for each “hallmark” gene set, showing a positive correlation between in Myc/Mycn DKO ESCs and diapaused embryos or paused Mettl3+/+ (but not Mettl3−/−) ESCs, with spearman correlation coefficient (ρ). h. Knockdown of Mycn restores the in vitro pausing phenotype of suppressed proliferation (left, n=3 biological replicates) and total RNA levels per cell (right, n=4 biological replicates) in paused Mettl3−/− ESCs. i. Nascent RNA capture by EU incorporation shows increased transcription for canonical Myc target genes in paused Mettl3−/− ESCs (n=3 biological replicates). j. The majority of Myc module genes are not direct targets of m6A in paused pluripotency. The proportion in all expressed genes is shown for comparison.
All data are mean ± SD (b, e-f, h-i). P-values (as indicated on figure) by two-way ANOVA with Tukey’s multiple comparisons test (b), one-way ANOVA with Dunnett’s multiple comparison tests (e-f, h right), two-sided Spearman correlation test (g), linear regression test with interaction (h left), and two-way Student’s t-tests (i).
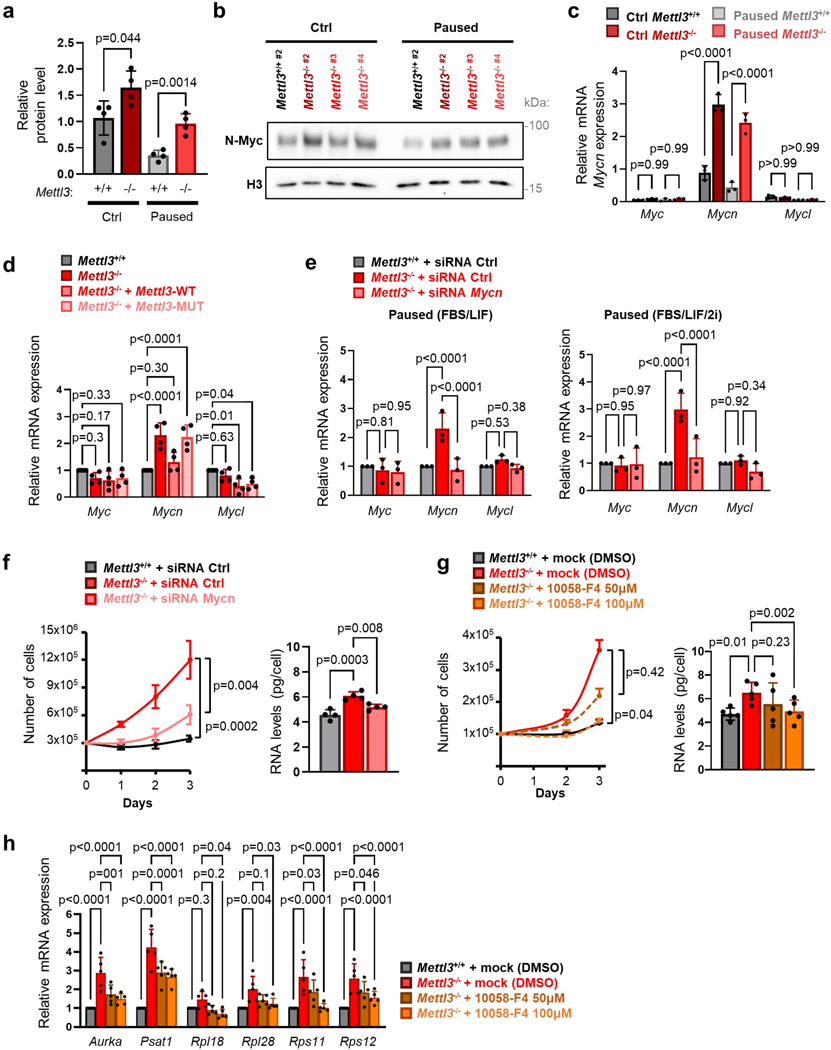
We found that N-Myc expression is elevated at the RNA and protein level in paused Mettl3−/− ESCs (Fig. 5b–c, Extended Data Fig. 7a–c), and that its expression can be rescued by transfection of a catalytically active form of Mettl3 (Fig. 5d, Extended Data Fig. 7d), further supporting its status as an m6A target. N-Myc levels are also elevated in ex vivo paused and hormonally diapaused Mettl3−/− blastocysts, as compared with Mettl3+/− or Mettl3+/+ embryos (Fig. 5e–f). Additionally, ESCs depleted for both c-Myc and N-Myc (Myc DKO) partially recapitulate gene expression changes in diapaused embryos and paused ESCs5,7, but this relationship is entirely abolished in paused Mettl3−/− ESCs (Fig. 5g). In agreement with this result, the downregulation of Myc target genes that occurs upon pausing is suppressed in Mettl3−/− ESCs (Fig. 2h). We thus wondered whether elevated Myc signaling contributes to the defective pausing observed in Mettl3−/− ESCs. Accordingly, knockdown of Mycn or treatment with the Myc inhibitor 10058-F4 both restore the decreases in proliferation and total RNA content in paused Mettl3−/− ESCs to levels equivalent to paused Mettl3+/+ cells (Fig. 5h, Extended Data Fig. 7e–h). The downregulation of Myc target genes in pausing is imparted via reduced nascent transcription, rather than by being directly targeted by m6A themselves (Fig. 5i–j), consistent with the established role of Myc as a transcriptional activator30,31. Taken together, these results indicate that N-Myc levels are downregulated in an m6A-dependent manner in paused ESCs, and that the subsequent decrease in Myc signaling results in reduced transcriptional output and proliferation.
m6A-methylated Mycn mRNA is targeted by the Ythdf2 reader
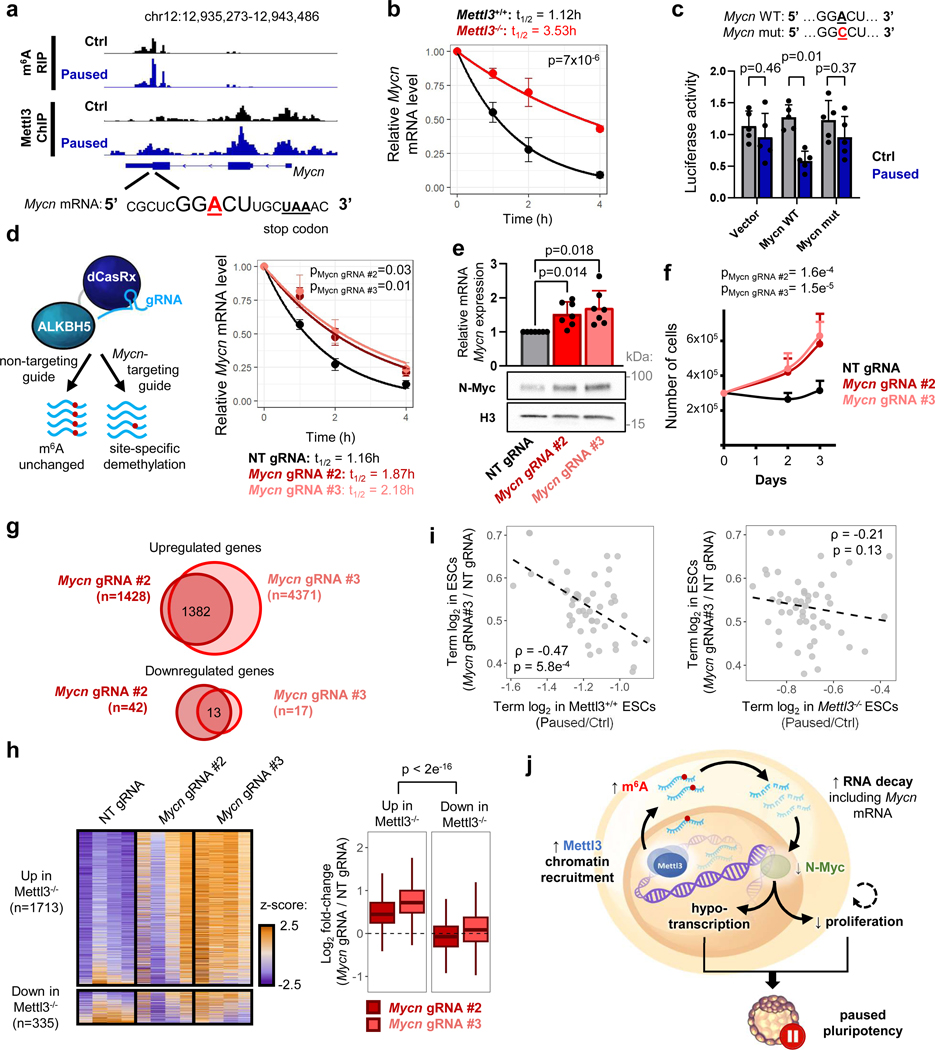
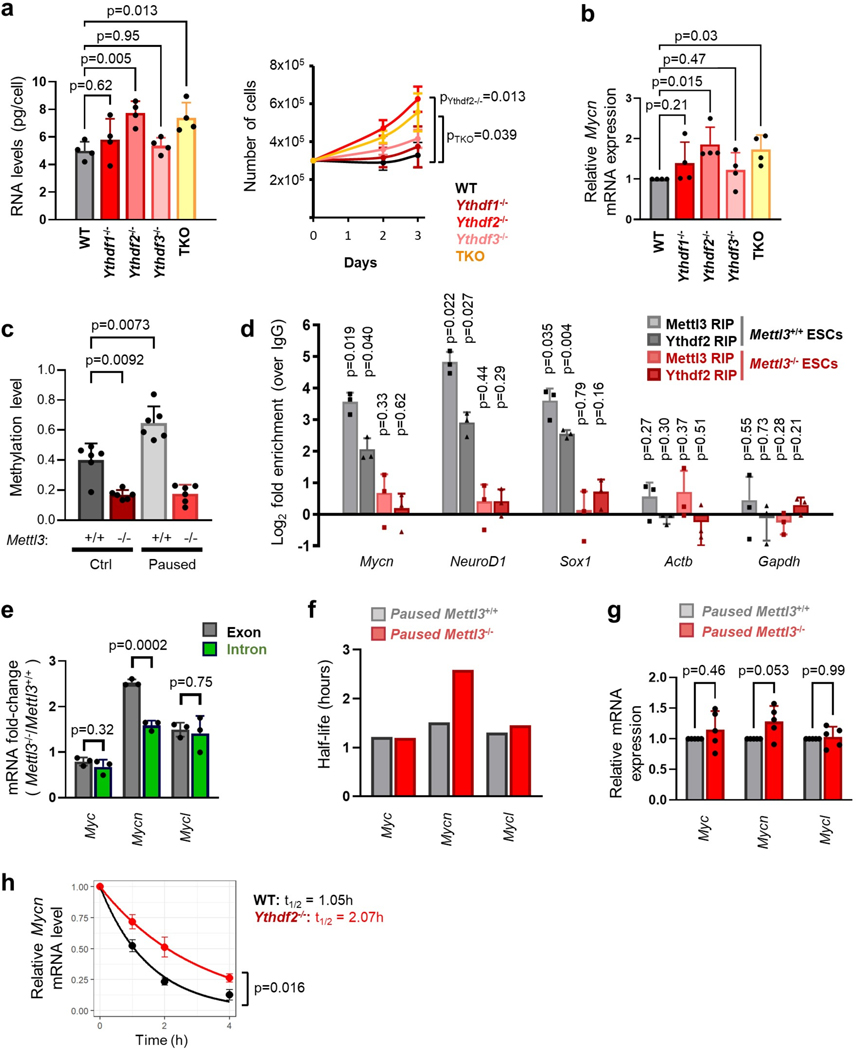
To further probe the regulation of Mycn mRNA by methylation during pausing, we investigated the role of m6A readers. The m6A mark can affect mRNA metabolism through binding of reader proteins, including the YTH domain family proteins32–35. Knockout of the m6A reader Ythdf2, in particular, closely phenocopies the defects in proliferation and RNA levels observed in paused Mettl3−/− ESCs (Extended Data Fig. 8a–b). As Ythdf2 can mediate destabilization of m6A methylated mRNAs, including in ESCs12,13,36, we next examined whether Ythdf2 is responsible for the regulation of Mycn mRNA. We used our MeRIP-seq data (Fig. 6a) to further refine the site of m6A methylation and identified a hypermethylated m6A site near the stop codon of the Mycn mRNA (Extended Data Fig. 8c). RNA immunoprecipitation (RIP-qPCR) revealed that Mycn mRNA is bound by both Mettl3 and Ythdf2 in paused ESCs, and this binding is abolished by knockout of Mettl3 (Extended Data Fig. 8d). Moreover, the half-life of Mycn mRNA is significantly increased in Mettl3−/− ESCs, specific to Mycn among the Myc family members, whereas no significant change in nascent transcription was observed (Fig. 6b, Extended Data Fig. 8e–g). A similar change in Mycn mRNA stability occurs in Ythdf2−/− ESCs (Extended Data Fig. 8h). Lastly, using a luciferase reporter assay, we found that the identified m6A site at the 3’ end of Mycn mRNA confers transcript destabilization in paused ESCs in a manner dependent on the integrity of the m6A site, as an A to C mutation nullifies this effect (Fig. 6c). These results corroborate that m6A methylation regulates Mycn mRNA stability in paused ESCs via binding of the Ythdf2 reader.
Figure 6: Mettl3 regulates pausing via m6A-mediated destabilization of Mycn mRNA.
a. Gene track view of MeRIP-seq and Mettl3 ChIP-seq for Mycn mRNA. b. Increased Mycn mRNA stability in paused Mettl3−/− ESCs compared to paused Mettl3+/+ ESCs, as measured by an actinomycin D stability assay (n=3 biological replicates). t1/2: half-life. c. Insertion of the identified Mycn m6A site, but not its mutated version, reduces transcript stability in paused ESCs, as measured by a luciferase reporter assay (n=5 biological replicates). d. Site-specific demethylation of Mycn, achieved with a dCasRx conjugated to the m6A demethylaseALKBH5, directed by gRNAs (left), leads to increased Mycn mRNA stability (right, n=3 biological replicates). NT: non-targeting. e-f. Site-specific demethylation of Mycn phenocopies Mettl3−/− in paused ESCs, with increased expression of N-Myc by RT-qPCR (e top, n=7 biological replicates) and western blot (e bottom, representative of 3 biological replicates), and higher proliferation (f, n=5 biological replicates). g. Differential gene expression, as measured by RNA-seq, induced by targeted demethylation of Mycn mRNA in paused ESCs (n=4 biological replicates per condition, fold-change > 1.5 and adjusted P < 0.05). h. Genes upregulated in paused Mettl3−/− ESCs (compared to paused Mettl3−/− ESCs) are also significantly upregulated following the demethylation of Mycn mRNA. Number of genes (n) as indicated. Data as z-score normalized per gene, with all samples displayed (n=4 biological replicates per group, left) and log2 fold-change over NT gRNA control (right). (i) Scatter plots of the median log2 fold-changes for each “hallmark” gene set, showing a significant negative correlation between paused ESCs with demethylated Mycn mRNA and paused Mettl3+/+ (but not Mettl3−/−) ESCs. Spearman correlation coefficient (ρ) is indicated. j. Model for the role of Mettl3-dependent m6A methylation in paused pluripotency. Elevated chromatin recruitment of Mettl3 increases m6A in the transcriptome. Hypermethylation destabilizes many transcripts, including the mRNA encoding the “anti-pausing” factor N-Myc. In absence of Mettl3, upregulated N-Myc enhances transcription and proliferation, disrupting pausing.
All data are mean ± SD (c, e-f) or mean ± SEM (b, d). P-values (as indicated on figure) by linear regression test with interaction (b, d, f), two-tailed paired Student’s ratio t-tests (c), one-way ANOVA with Dunnett’s multiple comparison tests (e), two-way ANOVA (h), two-sided Spearman correlation test (i). Box plots present center lines as medians, with box limits as upper and lower quartiles and whiskers as 1.5×IQR.
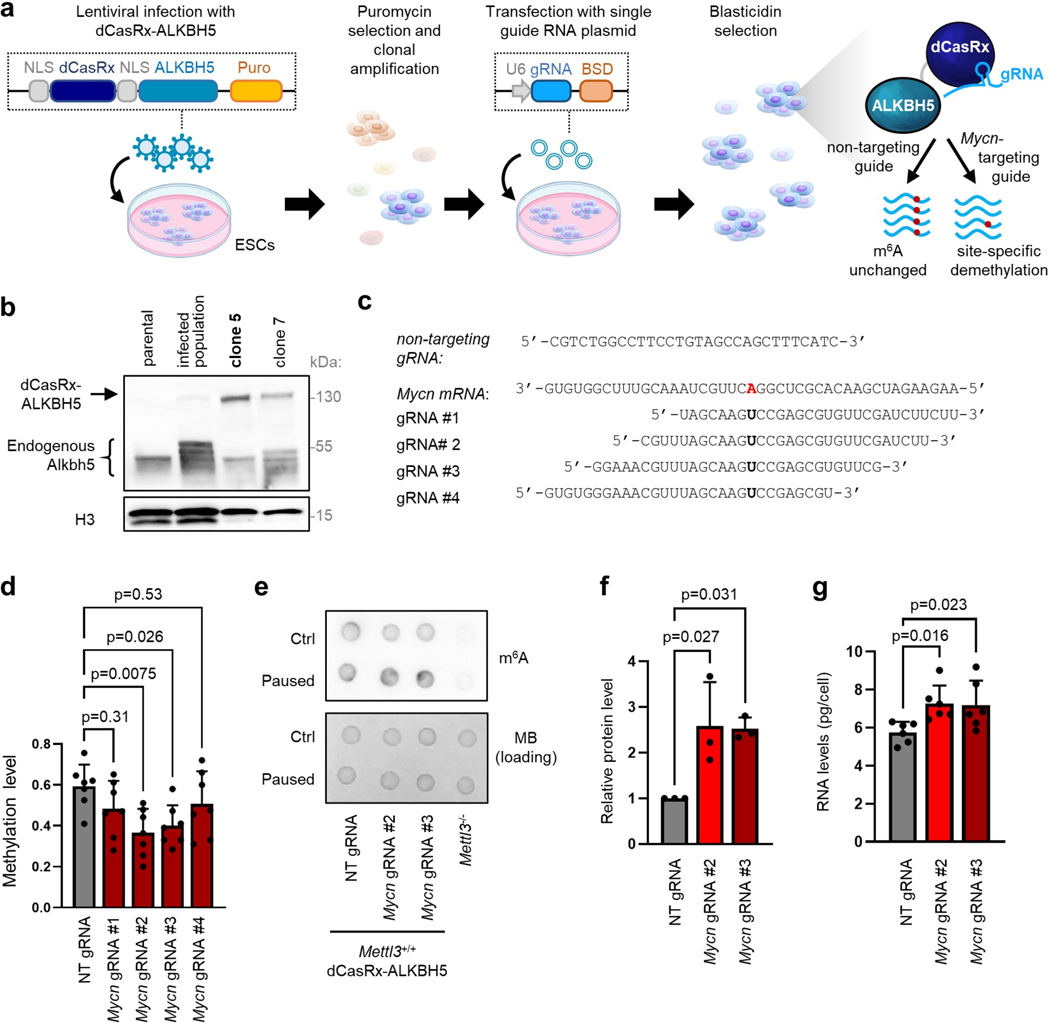
Finally, we explored how RNA methylation impacts Mycn transcript stability and its downstream effects. We performed site-specific RNA demethylation using dCasRx-conjugated ALKBH537 (Extended Data Fig. 9a–c). We validated that targeting dCasRx-ALKBH5 to the identified methylated site at the 3’ end of Mycn mRNA results in decreased levels of m6A at this site in Mettl3+/+ paused ESCs, using two independent gRNAs (Extended Data Fig. 9d). Notably, global levels of m6A RNA are not affected by this approach (Extended Data Fig. 9e). We found that targeted demethylation of Mycn mRNA in Mettl3+/+ paused ESCs stabilizes the transcript, leading to higher steady-state levels of N-Myc mRNA and protein (Fig. 6d–e, Extended Data Fig. 9f).
Mycn mRNA demethylation recapitulates loss of Mettl3
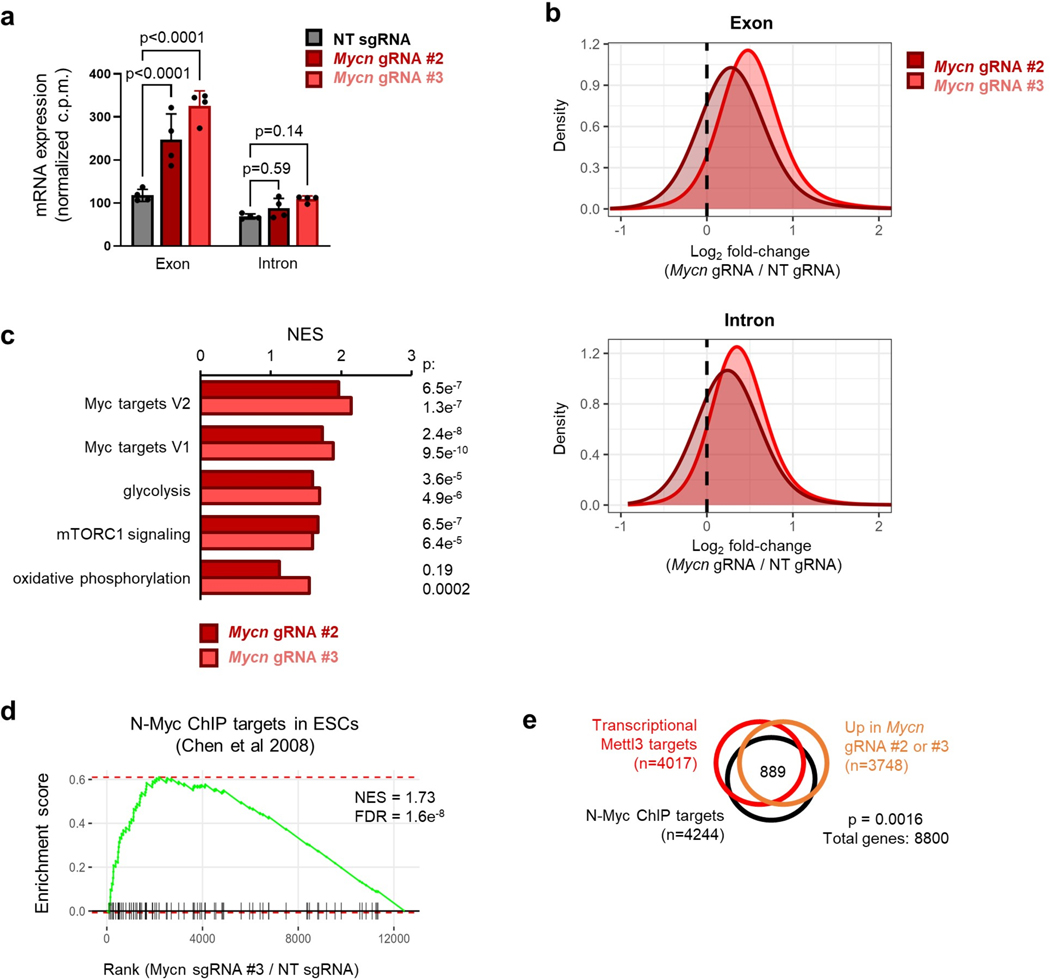
Remarkably, the targeted loss of m6A at the Mycn mRNA is sufficient to increase levels of total RNA and proliferation in paused ESCs (Fig. 6f, Extended Data Fig. 9g). We further examined the transcriptional impact of Mycn mRNA stabilization by performing cell number-normalized RNA-seq (Supplementary Table 6). We first confirmed that targeted demethylation of Mycn mRNA in paused ESCs leads to increased global transcriptional output (Fig. 6g, Extended Data Fig. 10 a–b). Overall, transcriptional changes induced by Mycn mRNA stabilization significantly recapitulate those observed upon loss of Mettl3, particularly for genes upregulated (Fig. 6h–i). Notably, pathways enriched in paused ESCs with targeted demethylation of Mycn mRNA include both Myc targets and functional categories related to energy metabolism (Extended Data Fig. 10c), further echoing defects in hypotranscription observed in paused Mettl3−/− ESCs (Fig. 2h). Genes upregulated following Mettl3 knockout and Mycn mRNA demethylation are both highly enriched for targets of N-Myc identified in wild-type ESCs by ChIP-seq38 (Extended Data Fig. 10d–e). In conclusion, m6A demethylation of Mycn mRNA in otherwise wildtype ESCs recapitulates the suppression of pausing observed in Mettl3−/− ESCs.
Discussion
In summary, we show here that Mettl3-dependent m6A RNA methylation is required for developmental pausing by maintaining transcriptional dormancy (Fig. 6j). Mettl3 does so by two interconnected mechanisms. First, Mettl3-dependent m6A RNA methylation promotes global mRNA destabilization, leading to reduced levels of thousands of transcripts. Secondly, a direct target of m6A-mediated destabilization is the mRNA for the transcriptional amplifier N-Myc, thereby suppressing global nascent transcription. Our findings shed light on the molecular mechanisms that underlie mammalian developmental pausing and reveal Mettl3 as a key orchestrator of the crosstalk between transcriptomic and epitranscriptomic levels of gene regulation.
m6A RNA methylation has been shown to play roles in other developmental contexts where large-scale shifts in transcriptional program have to occur rapidly, notably in maternal-to-zygotic transition and exit from naïve pluripotency12,39,40. The transition into diapause similarly involves a dramatic global downregulation and reprogramming of the transcriptiome4,5. Moreover, a corresponding large-scale reversal of these transcriptional shifts is anticipated to occur upon exit from diapause back into normal development41, although this transition is less well understood. We therefore posit that the biological function of m6A in developmental pausing may be two-fold. Firstly, m6A-mediated RNA decay may allow for rapid changes in the mRNA levels of key master regulators of developmental timing, including Mycn, both in entry into and exit from diapause. Secondly, the integration of suppression of nascent transcription with transcript destabilization may constitute a more robust mechanism of hypotranscription than either process alone.
Surprisingly, even though Mettl3 methylates thousands of transcripts, we found that one target, Mycn mRNA, is key for its function in maintaining the suppressed transcriptional state of paused cells. Future studies may uncover additional functions of other m6A-regulated putative anti-pausing factors identified here.
In agreement with previous reports, our results support the notion that Mettl3 acts at chromatin and methylates RNA co-transcriptionally23,24,42. Our data indicate that the global rise in m6A RNA level upon pausing is mediated by an increase in Mettl3 recruitment to the chromatin, but it remains unclear how this is regulated. Differential recruitment of Mettl3 to chromatin may be mediated by interactions with transcription factors23,24, and/or post-translational modifications43,44. It will be of interest to explore these or other possible mechanisms by which Mettl3 and its partners may gain increased access to chromatin during diapause.
We anticipate that the regulatory relationship between m6A RNA methylation and cellular dormancy will have implications extending well beyond embryonic diapause. Modulations of mTOR signaling have been implicated in the control of stem cell dormancy in various embryonic and adult tissues45–47. Moreover, we and others have shown that cancer cells can enter a dormant state molecularly and functionally similar to diapause to survive chemotherapy48–50. The insights gained here, together with the recent development of small-molecule inhibitors targeting the m6A machinery51–53, provide exciting new opportunities to explore the biology of m6A RNA methylation in the fields of developmental biology, reproductive health, regenerative medicine and cancer.
Methods
Procedures involving animals were performed according to the Animals for Research Act of Ontario and the Guidelines of the Canadian Council on Animal Care. Procedures conducted on animals were approved by The Animal Care Committee at The Centre for Phenogenomics, Toronto (TCP, Protocol 22–0331).
Mouse models.
Mice were housed at 18–23C with 40–60% humidity, maintained on a 12 h light/dark cycle and with food and water ad libitum in individually ventilated units (Tecniplast) in the specific pathogen-free facility at TCP.
The mouse line C57BL/6NCrl-Mettl3em1(IMPC)Tcp/Tcp was generated as part of the Knockout Mouse Phenotyping Program (KOMP2) project at TCP by Cas9-mediated deletion of a 142 bp region (Chr14:52299764 to 52299905 in ENSMUSE00001224053, GRCm38), causing a frameshift and early truncation (I171Mfs*4). The line was obtained from the Canadian Mouse Mutant Repository. Heterozygotes mice (referred to as “Mettl3TCP+/−”) were maintained on a hybrid C57BL/6N×CD-1 background. Genotyping of mice was performed by Transnetyx.
For all embryo experiments, 6 to 12-week-old Mettl3TCP+/− females were mated with 6-week- to 8-month-old Mettl3TCP +/− males. Collection and ex vivo culture of blastocysts was performed as previously described5, with pausing induced by flushing blastocysts at E3.5 with M2 and culturing them at 5% O2, 5% CO2 at 37 °C in KSOMAA, with addition of 200nM RapaLink-1 on the day after flushing. M2 (Millipore Sigma MR-015) and Life Global medium (Cooper Surgical LGGG-050) were provided by the TCP Transgenic Core. Blastocysts with collapsed blastocoel were considered non-viable and collected for genotyping every day. Hormonal diapause was induced as previously described5, and blastocysts were collected at EDG6.5 or 8.5, imaged and genotyped. For genotyping of embryos, DNA was extracted from individual blastocysts using the Red Extract-N-Amp kit (Sigma), in 36μl final volume. Mettl3 status was assessed by PCR using 1μl DNA extract in 15μl total volume reaction with Phire Green Hot Start II PCR Master Mix (Thermo Fisher). Cycling conditions: 98°C for 30 s; 35 cycles of 98°C for 5s, 57°C for 5s, 72°C for 5s; 72°C for 1 min. See Supplementary Table 7 for primer sequences.
Mouse embryonic stem cell culture.
Mouse ESCs were grown on gelatin-coated plates in standard serum/LIF medium: DMEM GlutaMAX with Na Pyruvate, 15% FBS (Atlanta Biologicals), 0.1 mM Nonessential amino acids, 50U/ml Penicillin/Streptomycin, 0.1mM EmbryoMax 2-Mercaptoethanol, and 1000 U/ml ESGRO LIF (referred to as FBS/LIF medium). For FBS/LIF/2i culture, the FBS/LIF medium was supplemented with 1μM PD0325901 and 3μM CHIR99021. Pausing was induced by adding 200nM INK128 to the medium, as described5. Unless otherwise stated, ESCs were grown in FBS/LIF and paused for at least 5 days before use, and for exactly 2 weeks for all sequencing experiments.
Cell models.
E14 ESCs were provided by B. Skarnes (Sanger Institute), and derived as previously described54,55. HeLa (ATCC CVCL_0030) and HEK293T (ATCC CRL-3216) were kindly provided by R. Blelloch and M. McManus (UCSF). Mettl3 and Ythdf1–3 knockout ESCs were kindly provided by J. Hanna12,14. Independent ESC lines Mettl3−/− #2–4 cells were generated via CRISPR/Cas9 for validation of key results. Cloning was performed by annealing targeting oligos into pSpCas9(BB)-2A-GFP (PX458), a gift from Feng Zhang (Addgene plasmid #48138; RRID:Addgene_48138)56. E14 cells were transfected with lipofectamine 2000, isolated by FACS, clonally expanded and validated for Mettl3 loss.
Rescue experiments were performed by transfecting Mettl3−/− cells with pCDNA-FLAGMETTL3 or pCDNA-FLAG-METTL3-APPA using Lipofectamine 2000, followed by 3 days of selection with 250μg/ml geneticin. The plasmids were gifts from A. Fatica (Addgene plasmids #160250 and #160251; RRID:Addgene_160250, RRID:Addgene_160251)22.
ON-TARGETplus siRNAs against Rptor, Rictor, Mycn and non-targeting control (Horizon L-058754–01, L-064598–01, L-058793–01, D-001810–10) were transfected in a 6-well plate at a final concentration of 30nM using Lipofectamine 2000 (Invitrogen).
Site-specific m6A demethylation.
HEK293T cells were transfected with pMSCV-dCasRx-ALKBH5-PURO and viral packaging/envelope vectors pMD2.G and psPax2, gifts from Qi Xie and Didier Trono (Addgene plasmid #175582, #12259 and #12260; RRID:Addgene_175582; RRID:Addgene_12259, RRID:Addgene_12260)37. E14 cells were infected with pMSCV-dCasRx-ALKBH5-PURO lentivirus and selected with 2μg/mL puromycin. Clonal lines were selected for expression of dCasRx-ALKBH5 by western blot. Guide RNAs were cloned using lenti-sgRNA-BSD, a gift from Qi Xie (Addgene plasmid #175583; RRID:Addgene_175583)37. Each guide plasmid (1μg) was transfected with Lipofectamine 2000 into dCasRx-ALKBH5-expressing cells in a 6-well plate. Cells were selected with 8μg/mL blasticidin for 3 days before use. See Supplementary Table 7 for primer sequences.
Cell number-normalized (CNN) RNA analyses.
Total RNA was extracted from equal number of cells (typically ~2×10⁵) using the RNeasy Micro Kit with on-column DNase I digestion (QIAGEN). Poly(A) RNA was extracted from 1×10⁶ cells using the Magnetic mRNA Isolation Kit (NEB). RNA concentration was measured with Qubit™ RNA High Sensitivity. cDNAs were generated using SuperScript IV VILO Master Mix using equal volumes of extracted RNAs, and qPCR data were acquired on a QuantStudio5 (Thermo Fisher Scientific). Unless otherwise stated, gene expression was normalized to cell number. See Supplementary Table 7 for primer sequences.
CNN RNA-sequencing and data analysis.
RNA extracted from equal number of ESCs was spiked by adding 2μl of 1:100 dilution of External RNAs Control Consortium (ERCC) Spike-in Mix1 (Thermo Fisher) to 10μl of RNA (equivalent to ~1–2μg). Library preparation was done using the NEBNext Ultra II Directional Library Prep Kit for Illumina with the mRNA Magnetic Isolation Module from 1μg RNA, per manufacturer’s instructions (NEB). Sequencing was performed on a NextSeq500 (Illumina) with 75bp single-end reads at the Lunenfeld-Tanenbaum Research Institute Sequencing Facility.
Libraries underwent adaptor trimming and quality-check using Trim Galore! v0.4.0. Alignment to the mm10 transcriptome with ERCC sequences was performed using TopHat2 v2.0.13. Gene counts were obtained using the featureCounts function of subread v1.5.0 with options -t exon -g gene_id. Raw counts were imported into R and normalized to ERCCs using edgeR v3.32.131,57. Data were further analyzed using tidyverse v1.3.0 and plotted using ggplot2 v3.3.5. The significance threshold for differential expression was adjusted P < 0.05 and absolute fold-change > 1.5. Normalized counts were mean-centered per batch and log-transformed for PCA and heatmaps. Gene Set Enrichment Analysis was carried out with the fGSEA package v1.16.0, with genes pre-ranked by t-values from the differential analysis (paused/ctrl). Gene set collections were downloaded from the Molecular Signatures Database v7.5.1 (http://www.gsea-msigdb.org/gsea/msigdb/index.jsp). For intron analysis, RefSeq-annotated intronic regions were shortened by 50bp on each side and counts were obtained with featureCounts, followed by analysis in R as for exons.
Global m6A quantification.
Nucleoside digestion was performed as previously described58. Separation was accomplished by reversed phase chromatography with an Acquity UPLC HSS T3 (Waters) on a Vanquish™ Flex Quaternary UHPLC system (Thermo Fisher Scientific). Mass spectrometry was performed on a Quantiva™ triple quadrupole mass spectrometer interfaced with an H-ESI electrospray source (Thermo Fisher Scientific). Data were analyzed with Tracefinder 4.1 (Thermo Fisher Scientific) and Qual browser of Xcalibur 3.0. The mass transitions (precursor → product) for m6A were 282 → 94, 282 → 123 and 282 → 150.
Changes in m6A were also measured by dot blot from 50ng of poly(A) RNA. Blotting was performed as previously described59,60, except that Diagenode C15410208 (1:400) was used as primary antibody.
m6A MeRIP-seq.
Immunoprecipitation of methylated RNA (MeRIP) was done using the EpiMark® N6-Methyladenosine Enrichment Kit with 4μg spiked poly(A) RNA of ESCs spiked with 2% of human cells (HeLa). Specificity of the IP was verified with m6A modified and unmodified exogenous controls, per manufacturer’s instructions. The normalization approach with human cells was validated beforehand by spiking ESCs with 1, 2 or 4% human cells (see Extended Data Fig. 3b): m6A enrichment was measured by RT-qPCR in 3 mouse mRNAs (Neurod1, Nr5a2, Sox1) known to be methylated in ESCs33 and normalized to the average levels of 5 highly-expressed and methylated human mRNAs (HSBP1, PCNX3, GBA2, ITMB2, PCBP1)53. MeRIP libraries were constructed from 0.5–1ng of input or IP RNA and prepared using the SMARTR-seq RNA library prep v2 kit (TakaraBio), per manufacturer’s recommendations. Samples were sequenced on a HiSeq 4000 using single-end 50 bp reads at the UCSF Center for Advanced Technology.
Pre-processing of sequencing data was performed similarly to RNA-seq, but with reads unmapped to mm10 being aligned to hg19. For input samples, gene expression was normalized as for CNN RNA-seq, except that the ratio of hg19/mm10 reads was used for normalization instead of ERCCs. For m6A RIP samples, peaks were called with MACS2 (with IP samples and their input counterpart as controls and q<0.01). Peaks were annotated by intersecting center positions with RefSeq annotations. Peak analysis was performed using DiffBind v3.0.15, with the options minOverlap=2, score=DBA_SCORE_READS. MeRIP peaks were then first normalized using the ratio of hg19/mm10 reads in each sample for normalization, then adjusted by dividing values by the ratio Inputsample/Inputaverage of the corresponding gene to consider expression changes. In the following differential analysis with edgeR, these normalized m6A levels were protected from further re-scaling by fixing the library size for all samples as lib.size = rep(10^6, 6) in the voom function. The threshold for significant differential expression was adjusted P < 0.05 and absolute fold-change >1.5. For motif analysis, peaks were limited to 100bp surrounding the center and submitted to DREME of the Meme-suite (http://meme-suite.org). Bigwig files were generated by Deeptools v3.3.0 and visualized in Integrated Genome Viewer (IGV v2.9.4), with the vertical scale being adjusted to consider expression changes individually for each gene.
Site-specific quantification of m6A.
We identified a putative m6A site within the Mycn MeRIP peak using the m6A-Atlas database (http://www.xjtlu.edu.cn/biologicalsciences/atlas)61. We measured m6A by RT-qPCR, exploiting the diminished capacity of Bst to retrotranscribe m6A residues compared to the MRT control enzyme, and RT primers targeting just before or after the site (+ or −)62,63. cDNA was generated with ~100ng of total RNA, 100nM primer (+ or −), 50μM dNTPs and 0.1U of Bst3.0 (NEB) or 0.8U of MRT (ThermoScientific). The cycling conditions were 50°C for 15min, 85°C for 3min, then 4°C. RT-qPCR data were normalized as [2^-(CtBst− - CtMRT−) - 2^-(CtBst+ - CtMRT+)] / 2^-(CtBst− - CtMRT−). Negative values were considered below the detection threshold and rounded to 0.
Mettl3 ChIP-seq.
ESCs were spiked with 2% of human cells (HeLa), then cross-linked in 1% formaldehyde/PBS for 10min at room temperature. After quenching with 125mM glycine for 5min at room temperature, followed by 15min at 4°C, cells were washed in cold PBS and stored at −80 °C. Cells were diluted at 5 million cells per 100μl in shearing buffer (1% SDS, 10mM EDTA, 50mM Tris-HCl pH8.0, 5mM NaF, Halt™ Protease Inhibitor Cocktail (Thermo Fisher), 1mM PMSF), rotating at 4°C for 30min, then 100μl of lysate was passed into a microTUBE AFA Fiber Snap-Cap (Covaris). Chromatin was sheared to 200–500 bp fragments on a Covaris E220 with settings PIP 175, Duty 10%, CPB 200, for 7min. Immunoprecipitation was performed overnight using 200μl of each lysate (~chromatin from 10 million cells) and 5μg of antibody (Proteintech 15073–1-AP), following the iDeal ChIP-seq kit for Transcription Factors (Diagenode) protocol. Elution, de-crosslinking, and DNA purification were performed per instructions. Libraries were constructed from ~2ng DNA with the NEBNext Ultra II DNA Library Prep Kit for Illumina (NEB). Samples were sequenced on a NextSeq500 (Illumina) with 75bp single-end reads at the Lunenfeld-Tanenbaum Research Institute Sequencing Facility.
Reads were trimmed of adaptors using Trim Galore! v0.4.0 and aligned to mm10 using bowtie2 v2.2.5131. Unmapped reads were then mapped to hg19. SAM files were converted to BAM files, sorted, and indexed with samtools v1.9. Bam files were deduplicated using MarkDuplicates (picard v2.18.14). Peaks were called with MACS2 (using IP samples and their input as controls) with the options --gsize 3.0e9 -q 0.05 --nomodel --broad and annotated by intersecting center positions with RefSeq annotations. The most upstream and downstream annotated TSS and TES, respectively, were considered for each gene. Peak analysis was performed using DiffBind v3.0.15 with score=DBA_SCORE_TMM_READS_FULL_CPM. Normalization was done with edgeR, using the ratio of mm10/hg19 reads (relative to respective input sample). For TSS analysis, a 1kb window surrounding the TSS of every RefSeq gene was used. Bigwig files were generated with Deeptools v3.3.0 using –scaleFactor for normalisation and visualized in Integrated Genome Viewer (IGV v2.9.4).
SLAM-seq.
RNA decay was measured using the SLAMseq Kinetics Kit – Catabolic Kinetics Module (Lexogen)64. Briefly, 8×10⁵ paused mESCs were seeded in a 6-well plate. After 12h, the cells were incubated in standard paused medium supplemented with 100μM S4U, protected from light and with medium exchange every 3h. After 12h of labeling, the medium was changed back to standard paused medium without S4U and cells were harvested at the indicated time points, followed by total RNA isolation using phenol-chloroform extraction. RNAs were treated with 10mM iodoacetamide, ethanol precipitated and subjected to Quant-seq 3′-end mRNA library preparation (Lexogen) using 100ng RNA.
Reads were trimmed and mapped to the mouse genome (GRCm38/mm10) using the Next Flow (v22.10.6) SLAMseq pipeline (v1.0.0) with -profile singularity, -read_length 100, and a 3’UTR exons table was downloaded from UCSC genome browser65–67. 3’UTR counts were then analyzed with edgeR, as detailed for RNA-seq, with T-to-C conversion counts being normalized to total counts. Expression values were then fitted to an exponential decay model using linear regression in R.
Screening for m6A targets.
The selection criteria were the following: (1) gain of m6A in pausing (MeRIP-seq: log2FC > 0), (2) downregulation suppressed in Mettl3−/− ESCs (RNA-seq: logFCMettl3+/+ < 0 & log2FCMettl3+/+ < log2FCMettl3−/−), (3) expression at least 2× higher in paused Mettl3−/− ESCs (RNA-seq: CPMMettl3−/− > 2× CPMMettl3+/+), (4) RNA more stable in paused Mettl3−/− ESCs (SLAM-seq: log2FCexon > 1.5 × log2FCintron). Then, using published RNA-seq data from mouse embryos4, we averaged the z-scores of the writers (Mettl3, Mettl14, Wtap) and the z-scores of the erasers (Fto, Alkbh5) multiplied by −1. Finally, we ranked all targets by their Spearman correlation coefficients with this m6A machinery signature, focusing on genes with negative correlations.
RNA immunoprecipitation.
2μg anti-Mettl3, Ythdf2 or control IgG antibodies were pre-bound to 20μL Protein A Dynabeads (Thermo Fisher), rotating for 3h at 4°C. Beads were collected on a DynaMag (Thermo Fisher) and resuspended in RIP buffer (150mM KCl, 25mM Tris pH7.4, 5mM EDTA, 0.5mM DTT, 0.5% NP40, protease and RNase inhibitors) containing 500ng/mL tRNA (Thermo Fisher) and 1mg/mL BSA to block for 30 min. ESCs were collected and lysed in RIP buffer on ice for 20min. Supernatants (500μl, equivalent to 10 million cells) were pre-cleared with 20μL Protein A Dynabeads, rotating for 30min at 4°C. Cleared lysates were incubated together with antibody-bound blocked beads overnight at 4°C. Lysates were washed 5 times in RIP buffer, and RNA was extracted using Direct-zol RNA Kits (Zymo Research), before analyzing by RT-qPCR.
Western blot analysis.
Whole-cell and chromatin extract were prepared as previously described previously68,69. Denatured samples were separated on 4–15% Mini-Protean TGX SDS-PAGE gels and transferred to nitrocellulose membranes using wet transfer. Membranes were blocked in 5% milk/TBS-T and incubated with primary antibodies overnight at 4 °C. HRP-conjugated secondary antibodies were incubated for 1h at room temperature. Protein detection was performed using ECL (Pierce) or Clarity Max (Bio-Rad). Quantification of bands was done using ImageJ. See Supplementary Table 6 for antibody details.
mRNA stability assay.
Cells were treated with 5μg/ml actinomycin D for 0, 1, 2, or 4h. RNA level was measured by RT-qPCR and normalized to Actb. Expression values were fitted to an exponential decay model using linear regression in R.
For embryo experiments, 8–10 blastocysts were collected immediately or cultured for 2h in KSOM with 5μg/ml actinomycin D. RNA was extracted using the PicoPure RNA Extraction Kit. Embryo RT-qPCR data was normalized to time 0 using Actb as a reference gene.
Luciferase reporters of RNA stability.
The region surrounding the identified m6A site of Mycn mRNA (wildtype sequence or A-to-C mutation) was cloned into the pmirGLO Dual-Luciferase miRNA Target Expression Vector (Promega). Vector (500ng) was transfected in ESCs in a 6-well plate with lipofectamine 2000 and cells were lysed after 48h. Firefly luciferase signal was measured with a luminometer and normalized to Renilla luciferase activity, using Dual-Glo® Luciferase Assay System.
Nascent transcription assays in ESCs.
To assess global transcriptional output, cells were treated with 1mM 5-ethynyl uridine (EU) for 45min, collected by trypsinization and prepared following the Click-iT™ RNA Alexa Fluor 488 Imaging Kit (Thermo Fisher) instructions. Data were collected by flow cytometry using the Beckman Coulter Gallios and analyzed using Kaluza. Fluorescence values were plotted as median fluorescence intensity (MFI) per sample, relative to control Mettl3+/+ cells.
For nascent RNA capture, EU incubation was performed in ESCs as above. Cells were collected by trypsinization, counted, and 2×10⁵ were used to extract RNA. Biotinylated nascent RNA was captured according to protocols within the Click-iT Nascent RNA Capture Kit (Invitrogen) and used in RT-qPCR.
Embryo immunofluorescence.
Ex vivo paused embryos were labeled with 1mM EU for 45 min for nascent transcription and fixed in 4% paraformaldehyde for 15 min. Permeabilization was done with 0.5% Triton X-100 in PBS + 5% FBS for 15 min. After blocking in PBS + 2.5% BSA + 5% donkey serum for 1h, embryos were incubated overnight at 4°C with primary antibodies (Mettl3 Abcam ab195352 1/200; N-Myc Cell Signaling Technology D1V2A 1/200). EU fluorescence coupling followed manufacturer’s instructions for Click-iT™ RNA Alexa Fluor 488 Imaging Kit. Embryos were incubated with fluorescence-conjugated secondary antibodies for 1h at room temperature, stained with DAPI in fresh blocking, washed, and transferred to M2 media (~5μl). Images were captured using a Leica DMI 6000 Spinning Disc Confocal microscope, and embryos were genotyped. Quantification was performed in ImageJ, with 10 image planes stacked by “average intensity” projection, repeated 4 times (40 planes used per embryo in total). Nuclei were quantified using the ROI Manager, and background values were subtracted. Values were normalized to the average of Mettl3TCP+/+ embryos within each litter to avoid batch effects.
Statistics and reproducibility.
Statistical analyses were performed in GraphPad Prism v9.3.1 or R v4.0.3. Data are presented as mean ± SD or SEM, except where otherwise indicated. Data distribution was assumed to be normal, but this was not formally tested. Box plots present center lines as medians, with box limits as upper and lower quartiles and whiskers as 1.5×IQR. Two-tailed Student’s t-test and one- or two-way ANOVA with Dunnett’s multiple comparison tests were used when normal distribution could be assumed. Time series were modeled by linear regression on log2-transformed y values, with P-values extracted from the interaction between time and the categorical variable of interest. GSEA was performed with fGSEA in R, with the adjusted P-value as indicated. Correlation was measured by ρ Spearman’s rank correlation coefficient.
All replicates for in vitro data are derived from independent experiments, with a subpopulation of parental cells allocated randomly to control or treatment without specific randomization methods. All replicates for in vivo data are derived from at least 3 embryos per genotype and 2 separate litters. No randomization was required for design of in vivo experiments, as embryos were harvested, cultured and treated together and only later identified by Mettl3 genotype. No statistical methods were used to pre-determine sample sizes, but our sample sizes are similar to those reported in previous publications5,57,60. Data collection and analysis were not performed blind to the conditions of the experiments. Two samples were excluded from the SLAM-seq analysis due to abnormally low sequencing depth.
Reporting Summary.
Further information on research design is available in the Nature Research Reporting Summary linked to this article.
Data availability.
Sequencing data have been deposited on the NCBI Gene Expression Omnibus repository (GEO, http://ncbi.nlm.nih.gov/geo) under accession number GSE202848. Mass spectrometry data have been deposited on the Metabolights database (https://www.ebi.ac.uk/metabolights) under the identifier MTBLS8041. Published RNA-seq and ChIP-seq data used in this study are available under the accession numbers E-MTAB-2958 (early mouse embryos), E-MTAB-3386 (Myc/Mycn DKO ESCs), and GSE11431 (N-Myc ChIP). Examples of FACS gating have been deposited on the Figshare repository (10.6084/m9.figshare.23551986). Mouse and human reference genomes (mm10 and hg19) were downloaded from UCSC browser (https://genome.ucsc.edu/). Source data are provided with this study. All other data supporting the findings of this study are available from the corresponding author on reasonable request.
Code availability.
Code supporting this study are available at a dedicated Github repository [https://github.com/EvelyneCollignon/Mettl3_pausing], and on Zenodo [https://doi.org/10.5281/zenodo.8068381].
Extended Data
Extended Data Figure 1. Dissection of paused pluripotency in Mettl3−/− models.
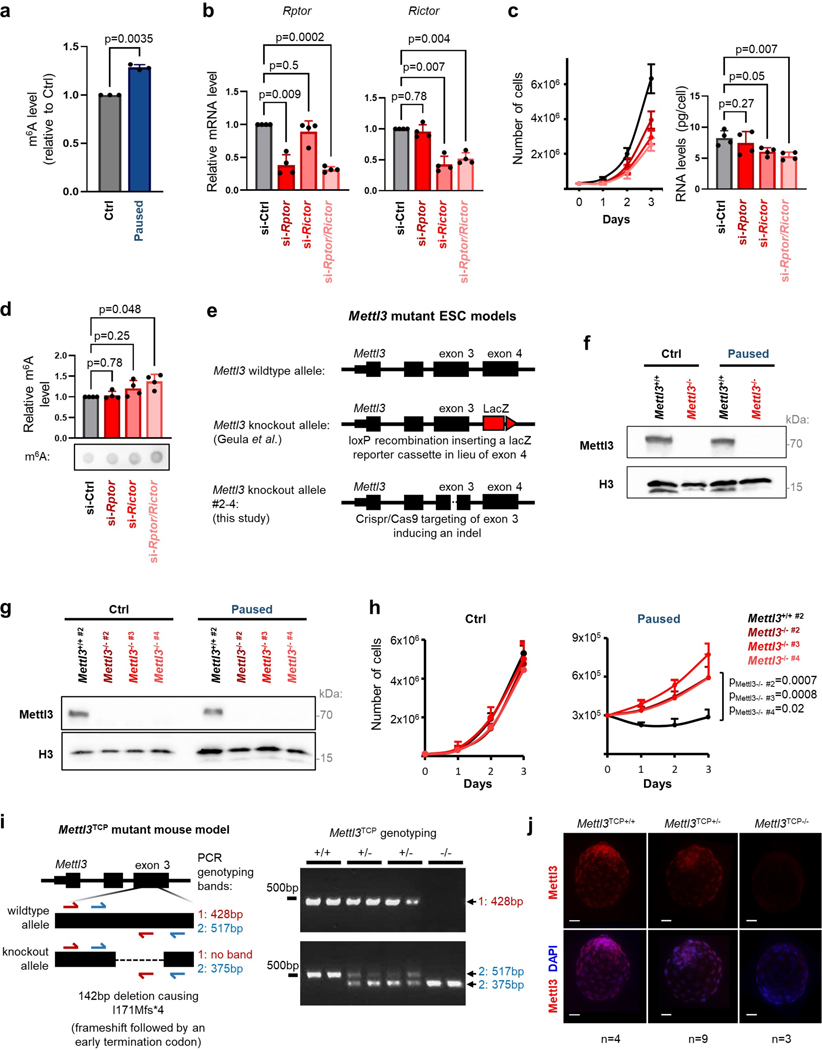
a. m6A increase in paused ESCs was validated in an independent mass spectrometry experiment. Levels relative to control (Ctrl) for each replicate are shown (n=3 biological replicates). b. Validation of Rptor and Rictor knockdown by RT-qPCR in paused ESCs grown in FBS/LIF/2i (n=4 biological replicates). c. mTOR inhibition by Rptor and Rictor knockdown induces a paused phenotype with reduced cell proliferation and total RNA levels (n=4 biological replicates). d. Dot blot showing an increase in m6A levels in ESCs upon knockdown of Rptor and Rictor. Levels of m6A are normalized to RNA loading control (methylene blue staining, n=4 biological replicates). e. Design of Mettl3−/− ESCs models used in this study. f. Validation of Mettl3−/− ESCs, in control and pausing conditions, by western blot (representative of 3 biological replicates). g. Validation of Mettl3−/− #2–4 ESCs, in control and pausing conditions, by western blot (representative of 2 biological replicates). h. Mettl3−/− #2–4 ESCs also fail to suppress proliferation in paused conditions (n=3 biological replicates). i. Mettl3-knockout mutant model in mice (Mettl3TCP−/−) and genotyping by PCR (left). Example of PCR genotyping of embryos resulting from Mettl3TCP+/− crossing, representative of all genotyping performed in this study [n(Mettl3TCP+/+) = 87, n(Mettl3TCP+/+) = 132, n(Mettl3TCP+/+) = 46]. +/+: wildtype, +/−: heterozygous, −/−: knockout. j. Validation of Mettl3TCP−/− in embryos by immunofluorescence. Representative staining images are shown. Number of embryos (n) as indicated. Scale bars = 30 μm.
Data are mean ± SD (a-d) or mean ± SEM (h). P-values (as indicated on figure) by one-way ANOVA with Dunnett’s multiple comparison tests (a-c), two-tailed ratio paired Student’s t-tests (d), and linear regression test with interaction (h).
Extended Data Figure 2. Paused Mettl3−/− ESCs acquire a distinct gene expression profile.
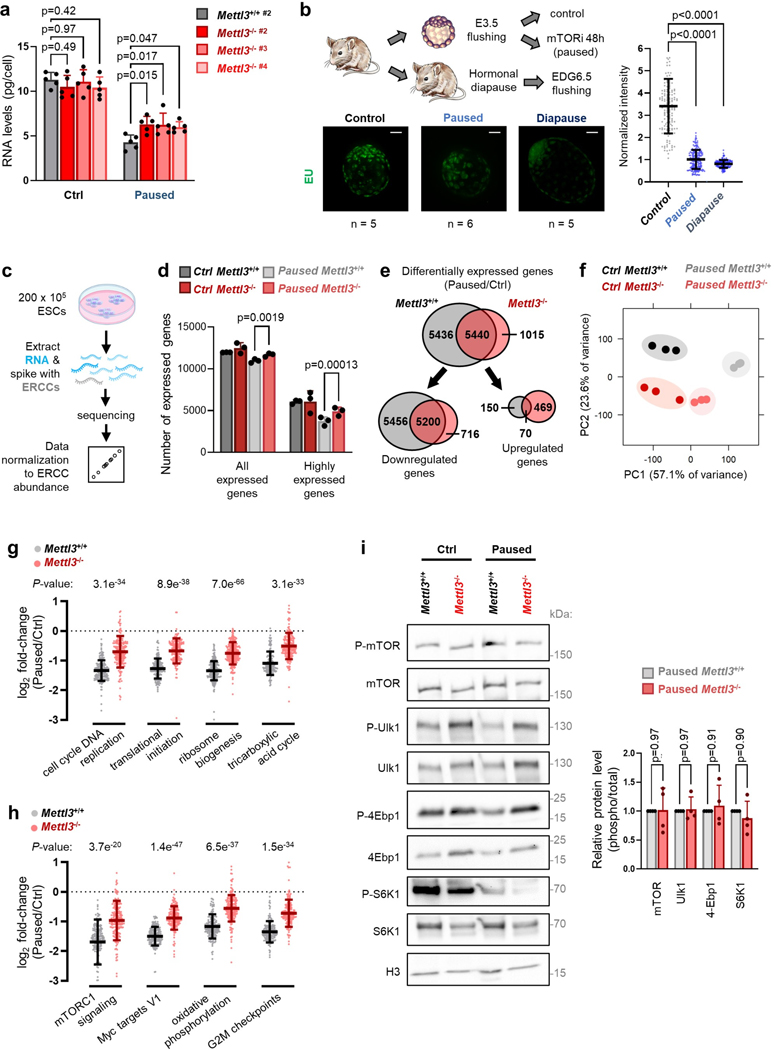
a. Quantification of total RNA per cell in Mettl3+/+ #2 and Mettl3−/− #2–4 ESCs, in control and paused conditions. Data are mean ± SD, n=5 biological replicates. b. Decrease in nascent RNA per cell, as measured by EU incorporation with nuclear signal quantification, in wildtype ex vivo paused or hormonally diapaused blastocysts, compared to control E3.5 embryos. Number of embryos (n) as indicated. Scale bars = 30 μm. c. Strategy for RNA-seq with cell number-normalization using ERCC spike-in RNAs. d. Quantification of the number of expressed genes in Mettl3+/+ and Mettl3−/− ESCs, in control and paused conditions. Expressed genes are further defined as having high expression (log2 normalized reads > 5, n=3 biological replicates). e. Number of differentially expressed genes (fold-change > 1.5 and adjusted P < 0.05) upon pausing, in Mettl3+/+ and Mettl3−/− ESCs. f. PCA plot for all expressed genes across all samples, showing across PC1 that Mettl3+/+ ESCs acquire a more divergent expression profile upon pausing than Mettl3−/− ESCs, relative to respective control condition. g-h. Gene expression changes (log2 fold-changes) of gene sets selected from the “GO biological processes” (g) and “hallmarks” (h) collections, showing incomplete downregulation in paused Mettl3−/− ESCs. i. Western blot of total and phosphorylated mTOR, and of the downstream targets of mTORC1 (Ulk1, 4Ebp1 and S6K1) (left, representative of 4 biological replicates). Quantification of phosphorylated levels, normalized to total levels, show no significant change in paused ESCs between Mettl3+/+ and Mettl3−/− (right).
Data are mean ± SD (b, d, g-i). P-values (as indicated on figure) by two-way ANOVA with Dunnett’s multiple comparison tests (a, i), one-way ANOVA with Dunnett’s multiple comparison tests (b), two-tailed unpaired Student’s t-tests (d, g-h).
Extended Data Figure 3. Mapping m6A distribution in the transcriptome of paused ESCs.
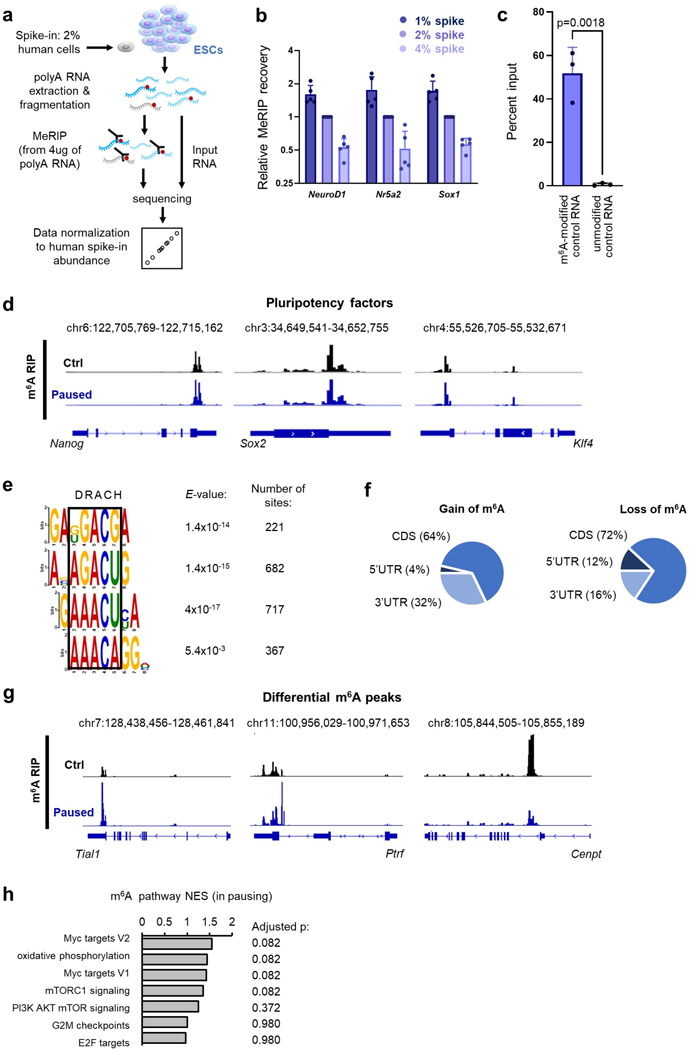
a. Strategy for MeRIP-seq in ESCs with cell number-normalization (CNN) using human cell spiking. b. Validation of the CNN strategy for the MeRIP-seq. By mixing different ratios of human cells to ESCs (1, 2 or 4%), we simulated global changes in methylation. Spiking normalization allows capture of these differences, as shown here by MeRIP-qPCR for 3 methylated mRNAs (NeuroD1, Nr5a2, Sox1). Data are mean ± SD, n=5 biological replicates with levels relative to 2% spike in each replicate. c. The specificity of the m6A capture was tested by spiking poly(A) RNA from ESCs with exogenous RNAs before performing MeRIP-qPCR. Data are mean ± SD, n=3 biological replicates. P-values (as indicated on figure) by two-tailed unpaired Student’s t-tests. d. Examples of gene track views of MeRIP-seq, for mRNAs of pluripotency factors previously shown to be methylated in ESCs. e. Motif analysis performed with DREME in a 100bp window surrounding MeRIP peak summits identifies several motifs corresponding to the consensus “DRACH” m6A motif (where D=A, G or U; H=A, C or U). f. Distribution of differential m6A peaks, according to the type of structural element within the transcript. g. Examples of gene track views of MeRIP-seq, for mRNAs with significant hypermethylation (Tial1, Ptrf) or hypomethylation (Cenpt) in pausing of ESCs. h. GSEA of m6A changes in paused ESCs relative to control ESCs, using the “hallmarks” collection. No single pathway is significantly enriched based on m6A changes (representative pathways are shown). P-values (as indicated on figure) by two-sided pre-ranked gene set enrichment analysis with Benjamini-Hochberg FDR correction.
Extended Data Figure 4. Mapping the chromatin distribution of Mettl3 in paused ESCs.
a. m6A machinery (writers Mettl3, Mettl14 and Wtap; and erasers Fto and Alkbh5) in control (Ctrl) and paused ESCs by western blot in whole cell extracts (representative of 3 biological replicates). b. Increase of Mettl3 levels in chromatin extracts upon induction of paused pluripotency, measured by cell number-normalized (CNN) western blot (representative of 3 biological replicates). c. Strategy for Mettl3 ChIP-seq in ESCs with CNN approach using human cell spiking. d. Heatmap of the top 5000 most variable Mettl3 peaks by ChIP-seq across all samples, showing higher levels in paused ESCs (n=2 biological replicates per group). e. Density plot of the average levels of Mettl3 binding in the TSS of all genes by ChIP-seq, separated by expression and methylation status, in control and paused ESCs. Mettl3 binding is highest in the TSS of expressed genes with a methylated transcript, and in paused ESCs. Number of genes (n) as indicated. Data as mean normalized Mettl3 level (n=2 biological replicates per group). f. Examples of gene track views showing increased average levels (fold-change > 1.5) of m6A and Mettl3, by MeRIP-seq and Mettl3 ChIP-seq, respectively.
Extended Data Figure 5. Capturing Mettl3-dependent changes in RNA stability in paused ESCs.
a. Strategy for RNA stability analysis based on intronic and exonic reads. b-c. Examples of genes with different (Slc16a1, Six4) and similar (Mtor, Gapdh) intronic and exonic mRNA fold-changes between Mettl3−/− and Mettl3+/+ ESCs based on RNA-seq data (b) and validation of stability changes by actinomycin D stability assay (c). N=3 biological replicates, t1/2: half-life. d. Linear regression of log2 total conversion counts (relative to time 0h), as measured by SLAM-seq, showing an increase in transcriptome stability in paused Mettl3−/− ESCs. e. Changes in RNA expression in paused Mettl3−/− ESCs based on RNA-seq data (fold-change > 1.5) are associated with changes in RNA half-life in paused Mettl3−/− ESCs.
Data are mean ± SD (b) or mean ± SEM (c). P-values (as indicated on figure) by two-tailed paired Student’s t-tests (b), linear regression test with interaction (c) and one-way ANOVA (e). Boxes in the box plots define the interquartile range (IQR) split by the median, with whiskers extending to the most extreme values within 1.5 × IQR beyond the box.
Extended Data Figure 6. Screening for candidate anti-pausing factors.
a. Quantification of the number of expressed genes in Mettl3+/+ and Mettl3−/− ESCs based on intronic RNA-seq, in control and paused conditions. Expressed genes are further defined as having high expression (log2 normalized reads > 5, n=3 biological replicates). b. Heatmap of gene expression based on intronic reads for all genes expressed in Mettl3+/+ or Mettl3−/− ESCs (left) with average expression per sample (right, scored as median z-scores of all genes), showing defective hypotranscription in paused Mettl3−/− ESCs. c. Identification of putative anti-pausing factors kept in check by m6A methylation and thereby destabilization of their transcript in paused pluripotency, based on RNA-seq, MeRIP-seq and SLAM-seq data in ESCs (see Methods for details). d. Expression levels (log2 cpm) of the Myc factors in diapaused embryos (left, data from Boroviak et al.) and paused ESCs (right). Horizontal bars represent the mean, with 3 biological replicates per group, except for diapaused embryos which has 2 replicates. e. mTOR inhibition by dual knockdown of Rptor and Rictor reduces Mycn expression measured by RT-qPCR in ESCs in FBS/LIF/2i medium (n=4 biological replicates).
Data are mean ± SD (a, b, e). P-values (as indicated on figure) by two-way ANOVA with Tukey’s multiple comparisons test (a), two-tailed Student’s t-tests (b), and one-way ANOVA with Dunnett’s multiple comparison tests (e).
Extended Data Figure 7. Regulation of Myc family members and downstream targets by Mettl3 in paused pluripotency.
a. Quantification of N-Myc protein levels, showing increased expression in Mettl3−/− ESCs, as shown in Fig. 5c. N=4 biological replicates. b. Representative western blot of N-Myc protein levels, showing increased expression in Mettl3−/− #2–4 ESCs. N=2 biological replicates. c. Increased expression of N-Myc in Mettl3−/− ESCs grown in FBS/LIF/2i (compared to Mettl3+/+ ESCs) measured by RT-qPCR (n=3 biological replicates). Levels are normalized to control Mettl3+/+ ESCs grown in FBS/LIF, as shown in Fig. 5b. d. Mycn expression in Mettl3−/− ESCs is restored to levels comparable to Mettl3+/+ ESCs by transfecting a catalytically active form of Mettl3, and not its inactive mutant form (RT-qPCR, n=4 biological replicates). e. Validation of Mycn knockdown by RT-qPCR in paused ESCs grown in FBS/LIF (left) or FBS/LIF/2i (right). f-g. Blocking of Myc signaling by Mycn knockdown (e, in FBS/LIF/2i) or chemical inhibitor 10058-F4 (f, in FBS/LIF) partially restores the pausing phenotype in paused Mettl3−/− ESCs in terms of cell proliferation (left, n=3 biological replicates) and total RNA levels per cell (right, n=4 and 5 biological replicates). h. Treatment with 10058-F4 partially restores the expression of Myc target genes in paused Mettl3−/− ESCs (RT-qPCR, n=5 biological replicates).
Data are mean ± SD (a, c-h), or mean ± SEM (g left). P-values (as indicated on figure) by two-tailed unpaired Student’s t-tests (a, d, f), by two-way ANOVA with Tukey’s multiple comparisons test (c) or Dunnett’s multiple comparison tests (d-e, h), one-way ANOVA with Dunnett’s multiple comparison tests (f-g).
Extended Data Figure 8. m6A-dependent regulation of Mycn mRNA stability.
a. Knockout of Ythdf2 and triple knockout of Ythdf1–3 (TKO) phenocopy the knockout of Mettl3 in paused ESCs, with increased total RNA levels per cell (left, n=4 biological replicates) and proliferation (right, n=4 biological replicates) compared to wildtype (WT) ESCs. b. Increased expression of N-Myc in paused Ythdf2−/− and TKO ESCs measured by RT-qPCR (n=4 biological replicates, relative to paused WT). c. Validation of m6A changes in Mettl3+/+ and Mettl3−/− ESCs by m6A-qPCR (n=6 biological replicates). d. Mettl3 and Ythdf2 binding of the Mycn transcript, measured by RIP-qPCR in 3 biological replicates. NeuroD1 and Sox2 were used as positive controls, and Actb and Gapdh were used as negative controls. e-f. Mycn is the only Myc family member regulated at the RNA stability level by Mettl3, as evidenced by analysis of exonic and intronic mRNA fold-changes (left, n=3 biological replicates per group) and SLAM-seq analysis of RNA half-life (right, with half-lives derived from 2 independent time courses). g. Nascent RNA capture by EU incorporation shows minimal changes in nascent transcription for Myc factors in Mettl3−/− ESCs (n=5 biological replicates). h. Increased Mycn mRNA stability in paused Ythdf2−/− ESCs compared to paused Mettl3+/+ ESCs, as measured by an actinomycin D stability assay (n=3 biological replicates). t1/2: half-life.
Data are mean ± SD (a-e, g) or mean ± SEM (h). P-values (as indicated on figure) by one-way ANOVA with Dunnett’s multiple comparison tests (a-c), two-tailed Student’s t-tests (d-e), two-way ANOVA with Dunnett’s multiple comparison tests (g), and linear regression test with interaction (h).
Extended Data Figure 9. Targeted m6A demethylation controls expression of Mycn in paused ESCs.
a. Model of lentiviral dCasRx epitranscriptomic editor with the m6A demethylase ALKBH5 and single guide RNA. b. Validation of the expression of the dCasRx-ALKBH5 fusion by western blot in parental (non-infected) ESCs, infected ESCs, and 2 infected clones. Clone 5 was used for all experiments (representative of 2 biological replicates). c. Guide RNAs (gRNAs) transfected for non-targeting control and Mycn-targeting conditions. d. Changes in m6A using the dCasRx-ALKBH5 editor in paused ESCs. Guides #2 and #3 significantly reduce m6A in Mycn transcripts, as measured by m6A-qPCR, and were selected for all subsequent experiments. N=7 biological replicates. NT: non-targeting. e. Dot blot showing that the global increase of m6A in paused ESCs is not affected by the dCasRx-ALKBH5 editor, with Mettl3−/− ESCs as negative control. Representative of 3 biological replicates. MB: methylene blue. f. Quantification of N-Myc protein levels, showing increased expression with the dCasRx-ALKBH5 editor targeting Mycn in paused ESCs, with representative blot shown in Fig. 6e. N=3 biological replicates. g. Demethylation of Mycn increases the total RNA levels per cell in paused ESCs (n=6 biological replicates).
Data are mean ± SD (d, f-g) and P-values (as indicated on figure) by one-way ANOVA with Dunnett’s multiple comparison tests (d, f-g).
Extended Data Figure 10. Transcriptional changes by RNA-seq upon m6A demethylation of Mycn in paused ESCs.
a. Mycn expression is increased following targeting with the m6A demethylase ALKBH5 based on exonic reads, but not intronic reads, which is consistent with post-transcriptional regulation (n=4 biological replicates per condition). b. A global increase in transcripts levels is measured following Mycn mRNA demethylation using both exonic and intronic reads, which is consistent with globally elevated nascent transcription. c. Representative pathways of the GSEA of gene expression changes upon demethylation of Mycn mRNA in paused ESCs using the “hallmarks” collection. d-e. Genes upregulated upon demethylation of Mycn mRNA are enriched for N-Myc targets, as identified in ESCs by ChIP by Chen et al38. GSEA using a random set of 100 N-Myc targets (c). Venn diagram showing a significant overlap between genes upregulated in paused Mettl3−/− ESCs, genes upregulated following Mycn demethylation, and N-Myc ChIP targets.
Data are mean ± SD (a). P-values (as indicated on figure) by two-way ANOVA with Dunnett’s multiple comparison tests (a), two-sided pre-ranked gene set enrichment analysis with Benjamini-Hochberg FDR correction (c, d), and one-sided simulation using hypergeometric distributions (e).
Supplementary Material
Supplementary Table 1: Differential expression in paused ESCs with Mettl3 KO from RNA-seq data. N = 3 biological replicates per group.
Supplementary Table 2: Gene Set Enrichment Analysis using RNA-seq data. Expression data presented in Supplementary Table 1 (n = 3 biological replicates per group).
Supplementary Table 3: Differential methylation analysis from MeRIP-seq data. N = 3 biological replicates per group.
Supplementary Table 4: RNA decay analysis from SLAM-seq data. Half-lives were measured using 4 time points, with samples collected over 2 independent experiments.
Supplementary Table 5: Top 100 ranked m6A anti-pausing candidates in paused pluripotency.
Supplementary Table 6: Differential expression with Mycn mRNA demethylation in paused ESCs from RNA-seq data. N = 4 biological replicates per group.
Supplementary Table 7: List of primers and antibodies.
Acknowledgments
We thank members of the Santos Lab, D. Schramek, A. Bulut-Karslioglu, T. Macrae, J. Jeschke and F. Fuks for feedback on the manuscript. We are grateful to the Hanna lab for providing cells, members of the UCSF Center for Advanced Technology and the LTRI Sequencing Core for next-generation sequencing, the LTRI Flow Cytometry Facilities, A. Bulut-Karslioglu and S. Biechele for advice on diapause, M. Percharde and T. Macrae for bioinformatics guidance. The authors wish to acknowledge the contribution of the TCP Transgenic Core for providing timed pregnant animals and the TCP Animal Resources for colony management. E.C. was supported by a fellowship from the Belgian American Educational Foundation Inc. P.A.L. is funded by the US National Institutes of Health (NIH, GM58843). This work was supported by grant R01GM113014 from the NIH, a Canada 150 Research Chair in Developmental Epigenetics, the Great Gulf Homes Charitable Foundation, and Project Grants 165935 and 178094 from the Canadian Institutes of Health Research (to M.R.-S.).
Footnotes
Competing Interests
The authors declare no competing interests.
References
- 1.Renfree MB & Fenelon JC The enigma of embryonic diapause. Development 144, 3199–3210 (2017). [DOI] [PubMed] [Google Scholar]
- 2.van der Weijden VA & Bulut-Karslioglu A. Molecular Regulation of Paused Pluripotency in Early Mammalian Embryos and Stem Cells. Front Cell Dev Biol 9, 2039 (2021). [DOI] [PMC free article] [PubMed] [Google Scholar]
- 3.Fenelon JC & Renfree MB The history of the discovery of embryonic diapause in mammals. Biology of Reproduction Preprint at 10.1093/biolre/ioy112 (2018). [DOI] [PubMed] [Google Scholar]
- 4.Boroviak T. et al. Lineage-Specific Profiling Delineates the Emergence and Progression of Naive Pluripotency in Mammalian Embryogenesis. Dev Cell 35, 366–382 (2015). [DOI] [PMC free article] [PubMed] [Google Scholar]
- 5.Bulut-Karslioglu A. et al. Inhibition of mTOR induces a paused pluripotent state. Nature 540, 119–123 (2016). [DOI] [PMC free article] [PubMed] [Google Scholar]
- 6.Bulut-Karslioglu A. et al. The Transcriptionally Permissive Chromatin State of Embryonic Stem Cells Is Acutely Tuned to Translational Output. Cell Stem Cell (2018) doi: 10.1016/j.stem.2018.02.004. [DOI] [PMC free article] [PubMed] [Google Scholar]
- 7.Scognamiglio R. et al. Myc Depletion Induces a Pluripotent Dormant State Mimicking Diapause. Cell 164, 668–680 (2016). [DOI] [PMC free article] [PubMed] [Google Scholar]
- 8.Jiang X. et al. The role of m6A modification in the biological functions and diseases. Signal Transduct Target Ther 6, (2021). [DOI] [PMC free article] [PubMed] [Google Scholar]
- 9.Wang P, Doxtader KA & Nam Y. Structural Basis for Cooperative Function of Mettl3 and Mettl14 Methyltransferases. Mol Cell 63, 306–317 (2016). [DOI] [PMC free article] [PubMed] [Google Scholar]
- 10.Dominissini D. et al. Topology of the human and mouse m6A RNA methylomes revealed by m6A-seq. Nature 485, 201–206 (2012). [DOI] [PubMed] [Google Scholar]
- 11.Batista PJ et al. m6A RNA Modification Controls Cell Fate Transition in Mammalian Embryonic Stem Cells. Cell Stem Cell 15, 707–719 (2014). [DOI] [PMC free article] [PubMed] [Google Scholar]
- 12.Geula S. et al. Stem cells. m6A mRNA methylation facilitates resolution of naïve pluripotency toward differentiation. Science (1979) 347, 1002–6 (2015). [DOI] [PubMed] [Google Scholar]
- 13.Wang Y. et al. N6-methyladenosine modification destabilizes developmental regulators in embryonic stem cells. Nat Cell Biol 16, 191–8 (2014). [DOI] [PMC free article] [PubMed] [Google Scholar]
- 14.Lasman L. et al. Context-dependent compensation between functional Ythdf m6A reader proteins. Genes Dev 34, 1373–1391 (2020). [DOI] [PMC free article] [PubMed] [Google Scholar]
- 15.Liu J. et al. N 6-methyladenosine of chromosome-associated regulatory RNA regulates chromatin state and transcription. Science (1979) 367, 580–586 (2020). [DOI] [PMC free article] [PubMed] [Google Scholar]
- 16.Chelmicki T. et al. m 6 A RNA methylation regulates the fate of endogenous retroviruses. Nature 591, 312–316 (2021). [DOI] [PubMed] [Google Scholar]
- 17.Wei J. et al. FTO mediates LINE1 m6A demethylation and chromatin regulation in mESCs and mouse development. Science (1979) 376, 968–973 (2022). [DOI] [PMC free article] [PubMed] [Google Scholar]
- 18.Xu W. et al. METTL3 regulates heterochromatin in mouse embryonic stem cells. Nature 591, 317–321 (2021). [DOI] [PubMed] [Google Scholar]
- 19.Percharde M, Bulut-Karslioglu A. & Ramalho-Santos M. Hypertranscription in Development, Stem Cells, and Regeneration. Developmental Cell Preprint at 10.1016/j.devcel.2016.11.010 (2017). [DOI] [PMC free article] [PubMed] [Google Scholar]
- 20.Hussein AM et al. Metabolic Control over mTOR-Dependent Diapause-like State. Dev Cell 52, 236–250 (2020). [DOI] [PMC free article] [PubMed] [Google Scholar]
- 21.Sousa MI, Correia B, Rodrigues AS & Ramalho-Santos J. Metabolic characterization of a paused-like pluripotent state. Biochim Biophys Acta Gen Subj 1864, (2020). [DOI] [PubMed] [Google Scholar]
- 22.Sorci M. et al. METTL3 regulates WTAP protein homeostasis. Cell Death Dis 9, 796 (2018). [DOI] [PMC free article] [PubMed] [Google Scholar]
- 23.Barbieri I. et al. Promoter-bound METTL3 maintains myeloid leukaemia by m6A-dependent translation control. Nature 552, 126–131 (2017). [DOI] [PMC free article] [PubMed] [Google Scholar]
- 24.Bertero A. et al. The SMAD2/3 interactome reveals that TGFβ controls m6A mRNA methylation in pluripotency. Nature 555, 256–259 (2018). [DOI] [PMC free article] [PubMed] [Google Scholar]
- 25.Zhou KI et al. Regulation of Co-transcriptional Pre-mRNA Splicing by m6A through the Low-Complexity Protein hnRNPG. Mol Cell 76, 70–81.e9 (2019). [DOI] [PMC free article] [PubMed] [Google Scholar]
- 26.Meyer KD 5′ UTR m6A Promotes Cap-Independent Translation. Cell 163, 999–1010 (2015). [DOI] [PMC free article] [PubMed] [Google Scholar]
- 27.Wang Xiao, Lu Zhike, Gomez Adrian, Hon Gary C., Yue Yanan, Han Dali, Fu Ye, Parisien Marc, Dai Qing, Jia Guifang, Ren Bing, Pan Tao, and C. H. m6A-dependent regulation of messenger RNA stability. Nature 505, 1–20 (2014). [DOI] [PMC free article] [PubMed] [Google Scholar]
- 28.Gaidatzis D, Burger L, Florescu M. & Stadler MB Analysis of intronic and exonic reads in RNA-seq data characterizes transcriptional and post-transcriptional regulation. Nat Biotechnol 33, 722–729 (2015). [DOI] [PubMed] [Google Scholar]
- 29.Kim J, Chu J, Shen X, Wang J. & Orkin SH An extended transcriptional network for pluripotency of embryonic stem cells. Cell 132, 1049–1061 (2008). [DOI] [PMC free article] [PubMed] [Google Scholar]
- 30.Kress TR, Sabò A. & Amati B. MYC: connecting selective transcriptional control to global RNA production. Nat Rev Cancer 15, 593–607 (2015). [DOI] [PubMed] [Google Scholar]
- 31.Percharde M, Wong P. & Ramalho-Santos M. Global Hypertranscription in the Mouse Embryonic Germline. Cell Rep 19, 1987–1996 (2017). [DOI] [PMC free article] [PubMed] [Google Scholar]
- 32.Wang X. et al. N 6-methyladenosine-dependent regulation of messenger RNA stability. Nature 505, 117–120 (2014). [DOI] [PMC free article] [PubMed] [Google Scholar]
- 33.Wang X. et al. N6-methyladenosine modulates messenger RNA translation efficiency. Cell 161, 1388–1399 (2015). [DOI] [PMC free article] [PubMed] [Google Scholar]
- 34.Xiao W. et al. Nuclear m6A Reader YTHDC1 Regulates mRNA Splicing. Mol Cell 61, 507–519 (2016). [DOI] [PubMed] [Google Scholar]
- 35.Roundtree IA, Evans ME, Pan T. & He C. Dynamic RNA Modifications in Gene Expression Regulation. Cell 169, 1187–1200 (2017). [DOI] [PMC free article] [PubMed] [Google Scholar]
- 36.Batista PJ et al. M6A RNA modification controls cell fate transition in mammalian embryonic stem cells. Cell Stem Cell 15, 707–719 (2014). [DOI] [PMC free article] [PubMed] [Google Scholar]
- 37.Xia Z. et al. Epitranscriptomic editing of the RNA N6-methyladenosine modification by dCasRx conjugated methyltransferase and demethylase. Nucleic Acids Res 49, 7361–7374 (2021). [DOI] [PMC free article] [PubMed] [Google Scholar]
- 38.Chen X. et al. Integration of External Signaling Pathways with the Core Transcriptional Network in Embryonic Stem Cells. Cell 133, 1106–1117 (2008). [DOI] [PubMed] [Google Scholar]
- 39.Zhao BS M6 A-dependent maternal mRNA clearance facilitates zebrafish maternal-to-zygotic transition. Nature 542, 475–478 (2017). [DOI] [PMC free article] [PubMed] [Google Scholar]
- 40.Aguilo F. et al. Coordination of m6A mRNA Methylation and Gene Transcription by ZFP217 Regulates Pluripotency and Reprogramming. Cell Stem Cell 17, 689–704 (2015). [DOI] [PMC free article] [PubMed] [Google Scholar]
- 41.He B. et al. Blastocyst activation engenders transcriptome reprogram affecting X-chromosome reactivation and inflammatory trigger of implantation. Proc Natl Acad Sci U S A 116, 16621–16630 (2019). [DOI] [PMC free article] [PubMed] [Google Scholar]
- 42.Huang H. et al. Histone H3 trimethylation at lysine 36 guides m6A RNA modification co-transcriptionally. Nature 567, 414–419 (2019). [DOI] [PMC free article] [PubMed] [Google Scholar]
- 43.Sun HL et al. Stabilization of ERK-Phosphorylated METTL3 by USP5 Increases m6A Methylation. Mol Cell 80, 633–647.e7 (2020). [DOI] [PMC free article] [PubMed] [Google Scholar]
- 44.Schöller E. et al. Interactions, localization, and phosphorylation of the m6A generating METTL3–METTL14–WTAP complex. RNA 24, 499–512 (2018). [DOI] [PMC free article] [PubMed] [Google Scholar]
- 45.Laplante M. & Sabatini DM mTOR signaling in growth control and disease. Cell 149, 274–293 (2012). [DOI] [PMC free article] [PubMed] [Google Scholar]
- 46.Zhang P. et al. mTOR is necessary for proper satellite cell activity and skeletal muscle regeneration. Biochem Biophys Res Commun 463, 102–108 (2015). [DOI] [PMC free article] [PubMed] [Google Scholar]
- 47.Hu JKH et al. An FAK-YAP-mTOR Signaling Axis Regulates Stem Cell-Based Tissue Renewal in Mice. Cell Stem Cell 21, 91–106.e6 (2017). [DOI] [PMC free article] [PubMed] [Google Scholar]
- 48.Rehman SK et al. Colorectal Cancer Cells Enter a Diapause-like DTP State to Survive Chemotherapy. Cell 184, 226–242.e21 (2021). [DOI] [PMC free article] [PubMed] [Google Scholar]
- 49.Dhimolea E. et al. An Embryonic Diapause-like Adaptation with Suppressed Myc Activity Enables Tumor Treatment Persistence. Cancer Cell 39, 240–256.e11 (2021). [DOI] [PMC free article] [PubMed] [Google Scholar]
- 50.Liu Y, Azizian NG, Sullivan DK & Li Y. mTOR inhibition attenuates chemosensitivity through the induction of chemotherapy resistant persisters. Nat Commun 13, (2022). [DOI] [PMC free article] [PubMed] [Google Scholar]
- 51.Huang Y. et al. Small-Molecule Targeting of Oncogenic FTO Demethylase in Acute Myeloid Leukemia. Cancer Cell 35, 677–691.e10 (2019). [DOI] [PMC free article] [PubMed] [Google Scholar]
- 52.Yankova E. Small-molecule inhibition of METTL3 as a strategy against myeloid leukaemia. Nature 593, 597–601 (2021). [DOI] [PMC free article] [PubMed] [Google Scholar]
- 53.Jeschke J. et al. Downregulation of the FTO m6A RNA demethylase promotes EMT-mediated progression of epithelial tumors and sensitivity to Wnt inhibitors. Nat Cancer 2, 611–628 (2021). [DOI] [PMC free article] [PubMed] [Google Scholar]
Methods-only references
- 54.Nichols J, Evans EP & Smith AG Establishment of germ-line-competent embryonic stem (ES) cells using Differentiation Inhibiting Activity. Development 110, (1990). [DOI] [PubMed] [Google Scholar]
- 55.Handyside AH, O’Neill GT, Jones M. & Hooper ML Use of BRL-conditioned medium in combination with feeder layers to isolate a diploid embryonal stem cell line. Rouxs Arch Dev Biol 198, 48–56 (1989). [DOI] [PubMed] [Google Scholar]
- 56.Ran FA et al. Genome engineering using the CRISPR-Cas9 system. Nat Protoc 8, 2281–2308 (2013). [DOI] [PMC free article] [PubMed] [Google Scholar]
- 57.Macrae TA & Ramalho-Santos M. The deubiquitinase Usp9x regulates PRC2-mediated chromatin reprogramming during mouse development. Nat Commun 12, 1–15 (2021). [DOI] [PMC free article] [PubMed] [Google Scholar]
- 58.Ross R, Cao X, Yu N. & Limbach PA Sequence mapping of transfer RNA chemical modifications by liquid chromatography tandem mass spectrometry. Methods 107, 73–78 (2016). [DOI] [PMC free article] [PubMed] [Google Scholar]
- 59.Delatte B. et al. Transcriptome-wide distribution and function of RNA hydroxymethylcytosine. Science (1979) 351, 282–285 (2016). [DOI] [PubMed] [Google Scholar]
- 60.DiTroia SP et al. Maternal Vitamin C regulates reprogramming of DNA methylation and germline development. Nature 573, 271–275 (2019). [DOI] [PMC free article] [PubMed] [Google Scholar]
- 61.Tang Y. et al. m6A-Atlas: a comprehensive knowledgebase for unraveling the N6-methyladenosine (m6A) epitranscriptome. Nucleic Acids Res 49, D134–D143 (2021). [DOI] [PMC free article] [PubMed] [Google Scholar]
- 62.Castellanos-Rubio A. et al. A novel RT-QPCR-based assay for the relative quantification of residue specific m6A RNA methylation. Sci Rep 9, 1–7 (2019). [DOI] [PMC free article] [PubMed] [Google Scholar]
- 63.Olazagoitia-Garmendia A. & Castellanos-Rubio A. Relative Quantification of Residue-Specific m6A RNA Methylation Using m6A-RT-QPCR. Methods in Molecular Biology 2298, 185–195 (2021). [DOI] [PubMed] [Google Scholar]
- 64.Neumann T. et al. Quantification of experimentally induced nucleotide conversions in high-throughput sequencing datasets. BMC Bioinformatics 20, 1–16 (2019). [DOI] [PMC free article] [PubMed] [Google Scholar]
- 65.DI Tommaso P. et al. Nextflow enables reproducible computational workflows. Nat Biotechnol 35, 316–319 (2017). [DOI] [PubMed] [Google Scholar]
- 66.Ewels PA et al. The nf-core framework for community-curated bioinformatics pipelines. Nat Biotechnol 38, 276–278 (2020). [DOI] [PubMed] [Google Scholar]
- 67.Kurtzer GM, Sochat V. & Bauer MW Singularity: Scientific containers for mobility of compute. PLoS One 12, e0177459 (2017). [DOI] [PMC free article] [PubMed] [Google Scholar]
- 68.Sadowski HB & Gilman MZ Cell-free activation of a DNA-binding protein by epidermal growth factor. Nature 362, 79–83 (1993). [DOI] [PubMed] [Google Scholar]
- 69.Méndez J. et al. Human origin recognition complex large subunit is degraded by ubiquitin-mediated proteolysis after initiation of DNA replication. Mol Cell 9, 481–491 (2002). [DOI] [PubMed] [Google Scholar]
Associated Data
This section collects any data citations, data availability statements, or supplementary materials included in this article.
Supplementary Materials
Supplementary Table 1: Differential expression in paused ESCs with Mettl3 KO from RNA-seq data. N = 3 biological replicates per group.
Supplementary Table 2: Gene Set Enrichment Analysis using RNA-seq data. Expression data presented in Supplementary Table 1 (n = 3 biological replicates per group).
Supplementary Table 3: Differential methylation analysis from MeRIP-seq data. N = 3 biological replicates per group.
Supplementary Table 4: RNA decay analysis from SLAM-seq data. Half-lives were measured using 4 time points, with samples collected over 2 independent experiments.
Supplementary Table 5: Top 100 ranked m6A anti-pausing candidates in paused pluripotency.
Supplementary Table 6: Differential expression with Mycn mRNA demethylation in paused ESCs from RNA-seq data. N = 4 biological replicates per group.
Supplementary Table 7: List of primers and antibodies.
Data Availability Statement
Sequencing data have been deposited on the NCBI Gene Expression Omnibus repository (GEO, http://ncbi.nlm.nih.gov/geo) under accession number GSE202848. Mass spectrometry data have been deposited on the Metabolights database (https://www.ebi.ac.uk/metabolights) under the identifier MTBLS8041. Published RNA-seq and ChIP-seq data used in this study are available under the accession numbers E-MTAB-2958 (early mouse embryos), E-MTAB-3386 (Myc/Mycn DKO ESCs), and GSE11431 (N-Myc ChIP). Examples of FACS gating have been deposited on the Figshare repository (10.6084/m9.figshare.23551986). Mouse and human reference genomes (mm10 and hg19) were downloaded from UCSC browser (https://genome.ucsc.edu/). Source data are provided with this study. All other data supporting the findings of this study are available from the corresponding author on reasonable request.


