Abstract
Background
Primary nephrotic syndrome (PNS) is a common glomerular disease in children. Dysbiosis of gut microbiota acts as a cause of Treg abnormalities. However, the intestinal metabolic impact of PNS with children remains poorly understood. This study aims to investigate the dynamic changes of gut microbiota and it’s metabolism in children with PNS.
Methods
Fecal and peripheral blood samples were separately collected from patients with initial diagnosis of PNS (PNS_In group), recurrence of PNS (PNS_Re group), and healthy controls (HCs group). The fecal samples were subjected to the microbiome and metabolome by the multi-omics analysis. Additionally, the peripheral blood samples were collected and associated inflammatory indicators were determined.
Results
We found that in PNS_In group, lipopolysaccharide (LPS), pro-inflammatory interleukin (IL)-6, IL-17A, IL-23p19, and IL-1β were significantly increased compared with those in HCs group. However, these abnormalities were dramatically reversed in PNS_Re group treated with prednisone acetate. Moreover, the crucial Treg/Th17 axis in PNS inflammation was also proved to be discriminated between PNS and HCs. Gut microbial dysbiosis was identified in PNS_In and PNS_Re patients. At the genus level, compared to HCs group, the abundance of Faecalibacterium notably changed in PNS_In and PNS_Re groups, showing negatively correlated with inflammatory factors. Moreover, the fecal metabolome of PNS_In and PNS_Re remarkably altered with the major impacts in the metabolism of phenylalanine, ABC transporters, arginine and proline.
Conclusion
The dynamic changes of gut microbiota and associated metabolites are closely correlated with initial period and recurrence of PNS in children via probably regulating inflammatory Th17/Treg axis, which may potentially provide novel targets for the control of the disease.
Clinical trial number
Not applicable.
Supplementary Information
The online version contains supplementary material available at 10.1186/s12866-024-03667-w.
Keywords: PNS, Immune inflammation, Treg/Th17, Gut microbiota, Metabolome, Faecalibacterium
Introduction
Primary nephrotic syndrome (PNS) characterized by massive proteinuria, hypoalbuminemia, edema, and hyperlipidemia, represents a common glomerular disease, accounting for more than 90% of nephrotic syndrome in children [1, 2]. It is reported that the incidence of PNS is approximately 2–7/100,000 in children and the prevalence rate is about 16/100,000 [3]. A large amount of albumin loss in the urine leads to infection, thromboembolism, cardiovascular disease, hypovolemic crisis, anemia, and acute kidney failure [4]. At present, the treatments of PNS in children are limited to glucocorticoids and immunosuppressants. However, long-term administration of glucocorticoids and immunosuppressants may induce multiple adverse reactions in children, such as cushingoid symptoms, obesity, growth retardation, and bone marrow suppression [4]. Although most children respond well to steroids within 4 weeks, the majority of them will relapse and about half of children have a recurrence or develop steroid dependence [5]. Therefore, there is an urgent need to seek safe and effective intervention strategies for children with PNS.
PNS in children is mainly believed in associated with immune dysfunction including lymphocytes [6, 7]. The main manifestations are the abnormal number/functions of T lymphocytes and the imbalance of the proportion of each subset [8]. A biased T helper 17 (Th17)/regulatory T cells (Tregs) axis in patients with PNS is thought to be closely correlated with remission and resistance [9, 10]. Tregs are reduced in children with PNS and recovered after remission [11, 12]. Under homeostatic conditions, the mucosal immune system establishes a state of tolerance against the gut microbiota [13–17]. The immune cells in this tolerogenic response include regulatory T (Treg) cells [13, 18–20]. However, microbial dysbiosis or aberrant immune activation can disrupt tolerance and trigger chronic inflammatory conditions [13, 21], and dysbiosis of gut microbiota acts as a cause of Treg abnormalities in idiopathic nephrotic syndrome [2, 12]. However, the intestinal metabolic impact of PNS with children remains poorly understood. Therefore, in order to address the aforementioned issues, we collected fecal samples from patients with initial diagnosis of PNS and patients with recurrent of PNS, as well as from healthy individuals. This study was designed to investigate the alterations in gut microbiota and metabolism in clinical PNS patients, as well as the relationship between immune inflammatory signature and gut microbiota.
Materials and methods
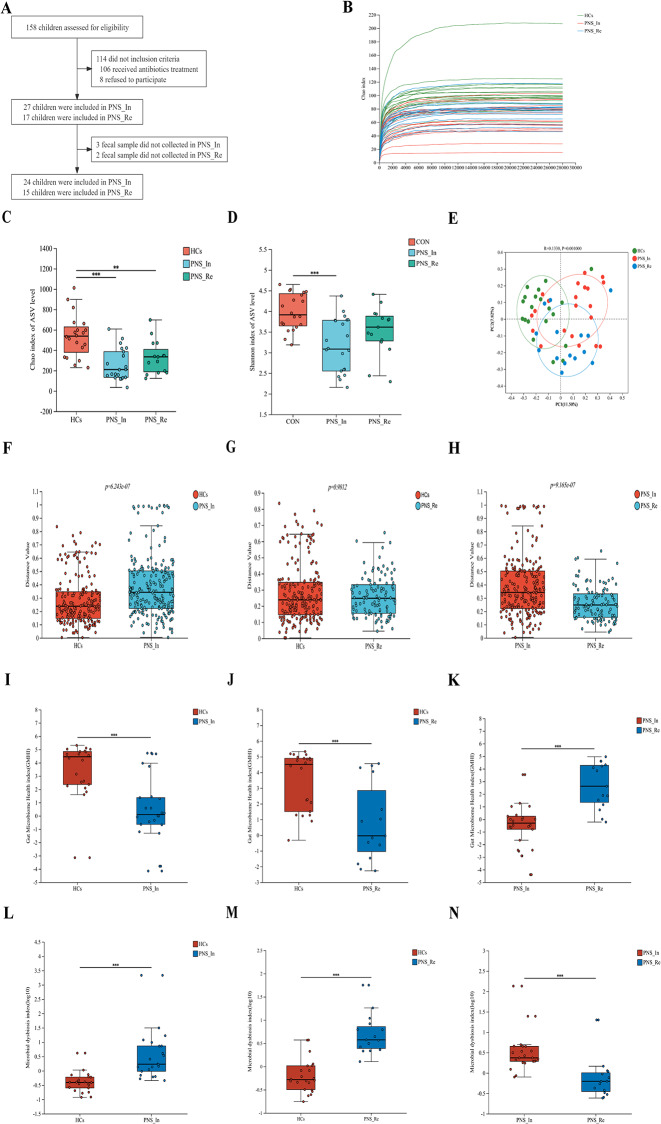
Patients with initial diagnosis of PNS (PNS_In, n = 24) and patients with recurrence of PNS (PNS_Re, n = 15) were recruited from Pediatrics Department of Ningxia Medical University General Hospital (Ningxia, China) between Oct 2022 and January 2024 (Fig. 1A). A control group of healthy individuals (HCs, n = 20) were recruited from the medical examination center of the same hospital. All participants were living in Ningxia, China. Healthy volunteers had normal similar habits and no history of PNS or antibiotic use (last 2 weeks). All participants were informed of the study objectives and methods and signed the Informed Consent Form. The present study involving human participants were reviewed and approved by Institutional Ethics Board of Ningxia Medical University. (ethics approval number KYLL-2022-0595).
Fig. 1.
Comparison of the intestinal bacterial structure among the HCs, PNS_In and PNS_Re groups. (A) The flow diagram of PNS children enrollment. (B) Rarefaction plot. (C) Alpha diversity Chao index of AVS level. (D) Alpha diversity Shannon index of AVS level. (E) PcoA analysis. (F to H) Analysis of Beta diversity between groups. (I to K) Gut microbiome health index at the species level. (L to N) Microbial dysbiosis index at the species level. Data were expressed as mean ± SD. *P < 0.05, **P < 0.01, ***P < 0.001, ****P < 0.0001
Patients inclusion criteria
According to the 2016 guidelines of the Nephrology Group of the Pediatric Branch of the Chinese Medical Association, the patients (PNS_In group) was defined by 24-hour urine protein ≥ 50 mg/kg or urine albumin-to-creatinine ratio (ACR) ≥ 2.0 mg/mg, urinary protein qualitative were positive for three times within a week (+++~++++), serum protein levels below 25 g/L, serum protein levels ≤ 5.7mmol/L and different degrees of edema, and defined as the patients (PNS_Re group) whose 24-hour urine protein ≥ 50 mg/kg or urine albumin-to-creatinine ratio (ACR) ≥ 2.0 mg/mg, urinary protein qualitative changes from negative to positive (+++~++++) in three consecutive days.
Exclusion criteria
Subjects complicated with gastroenteritis or mother major digestive system diseases or tumor in the past 3 months were excluded. Subjects had a disease of severe cardiopulmonary dysfunction were excluded. Besides, subjects had received antibiotic, prebiotic, or probiotic in a period of 2 weeks prior to recruiting were excluded.
Routine blood test
All children with primary nephropathy underwent the following routine blood tests. In brief, 3 mL of fasting venous blood was withdrawn from the patients. Serum was separated by means of centrifugation (subsequent to the collection of specimens, the specimen was subjected to centrifugation in a high-speed cryogenic centrifuge with a rotation speed of 3,000 r/min for a period of 10 min, with a centrifugal radius of 10 cm). The test was conducted using a XN-9000 fully automated blood analyser (Nippon Hyson Mecom, Inc.) and the accompanying reagents in accordance with the instructions provided in the manual and the standard norms. The indicators included neutrophil (NEU), white blood cell (WBC) and platelet (PLT) counts. The instrument utilized in this procedure is the Shenzhen Myriad BC-6800pius, and the methodology employed is the resistive counting method within the instrument’s regular channel. Prior to the commencement of the experiments, the instrument was calibrated and in-house quality control was conducted to ensure the accuracy and precision of the results. The same process was employed to confirm the correctness of the reagents. The typical reference ranges for white blood cell count, absolute neutrophil count and platelet count were 4.8–11.3 × 10⁶/µL, 1.2-7.0 × 10⁶/µL and 150–579 × 10⁶/µL, respectively.
Biochemical tests
All children with primary nephropathy underwent the following biochemical tests. In brief, plasma was obtained by centrifuging 3–5 mL of peripheral fasting venous blood in a TD3WS centrifuge (Hunan Maida Instrument Co., Ltd.). The relevant biochemical indexes were then measured on a SIEMENSADVIAXPT fully automatic biochemical analyzer. The test kits were purchased from Ningbo Meikang Bio-Technology Co. The serum was then analysed for aspartate aminotransferase (AST), alanine aminotransferase (ALT), serum urea (UREA), creatinine (Scr), albumin (ALB), total cholesterol (TC), triglyceride (TG), micro-albumin urine (MAU), 24 h urine protein. Prior to the commencement of the experiments, the instrument was calibrated and in-house quality control was conducted to ensure the accuracy and precision of the results. The same process was employed to confirm the correctness of the reagents. The typical reference ranges for AST, ALT, UREA, Scr, ALB, TC, TG, MAU and 24 h urine protein were 0.0–50.0 U/L, 0.0–35.0 U/L, 2.50-7.00 mmol/L, 24.9–69.7µmol/L, 35–55 mmol/L, 0.00-5.18 mmol/L, 0.00-1.70 mmol/L, 0.00–30.00 mg/L and 20–130 mg/24 h, respectively.
Immunoglobulin quantification
All children with primary nephropathy underwent the following immunoglobulin quantification. In brief, the plasma was obtained by centrifuging 3–5 mL of peripheral fasting venous blood in a TD3WS centrifuge (Hunan Maida Instrument Co., Ltd.). The plasma was separated and tested using a BNII fully automatic plasma protein analyser and original reagents and calibrators. Quantitative determination of Immunoglobulins A, G, M, complement C3 and complement C4 were quantified by transmission immunoturbidimetric assay. Prior to the commencement of the experiments, the instrument was calibrated and in-house quality control was conducted to ensure the accuracy and precision of the results. The same process was employed to confirm the correctness of the reagents. The typical reference ranges for immunoglobulins A, G, M, complement C3 and complement C4 were 0.52–2.74 g/L, 6.7–15.3 g/L, 0.49–2.40 g/L, 0.9–1.8 g/L and 0.1–0.4 g/L, respectively.
Enzymelinked immunosorbent assay (ELISA)
Peripheral plasma specimens from children of three groups were collected to determine the concentration of inflammatory cytokines including IL-1β, IL-6, IL-10, IL-17 A and IL-23 A by using ELISA kits (Proteintech, Wuhan, China) according to the manufacturer’s instructions. Optical density at a wavelength of 450 nm was measured with an automatic microplate reader (Thermo Fisher Science Inc, USA).
Flow cytometry analysis
Peripheral blood mononuclear cells (PBMCs) suspension was prepared as described below. The peripheral blood was collected in an anticoagulant tube containing EDTA, centrifuged at 600×g, 4 ℃ for 10 min, and then the plasma was isolated and frozen at -80 ℃. The remaining blood cell containing liquid was transferred to the centrifuge tube and diluted in RPMI 1640 medium in a 1:1 ratio, and mixed upside down or with a pipette. In a 15 mL centrifuge tube, 3 mL of lymphocyte was added first, then diluted blood was carefully added along the wall of the tube, centrifuged at 600×g, 4 ℃ for 25 min. Discarded the yellow liquid in the upper layer and absorbed the white membrane in the middle layer, known as the mononuclear cells. The obtained mononuclear cells were washed with 5 mL RPMI 1640, centrifuged at 400×g for 5 min, and the supernatant was discarded. Finally, the cell concentration was adjusted to 1 × 10⁶ cells/mL for subsequent measurement.
Flow cytometry was used to detect the percentages of Treg and Th17 cells in peripheral blood. For Treg cell staining, CD4-FITC (eBioscience, 11-0049-42, USA) was used for surface labeling and Bioscience™ Foxp3/ Transcription Factor Staining Buffer Set (Thermo Fisher, USA) was elicited to fix and penetrate the cells. After that, the transcription factor forkhead box p3 (Foxp3)-PE (eBioscience, 12-4776-42, USA) was added for intracellular labeling, and incubated at 4 ℃ for 30 min in the dark. For Th17 cell staining, cells were stimulated at 37 ℃ for 1 h using a 500× cell stimulation cocktail (Thermo Fisher, USA), followed by cell staining, including CD4-FITC (eBioscience, 11-0049-42, USA) and IL-17 A-PE (eBioscience, 12-7178-42, USA), incubated at 4 °C in the dark for 30 min. Finally, prepared samples were measured and analyzed by Beckman Cyto FLEX flow cytometer (Beckman Bioscience, USA).
Determination of lipopolysaccharide (LPS) level
The Limulus amebocyte lysate kit (Xiamen Bioendo Technology Co., Ltd., EC80545, Xiamen, China) was used to detect LPS level in the peripheral blood of children with PNS and HCs groups according to the manufacturer’s instructions. Initially, the endotoxin standard solution was prepared according to the instructions. 100 µL of plasma and bacterial endotoxin test water were added into endotoxin-free test tube respectively. Bacterial endotoxin test water was used as a negative control, and endotoxin standard solution was used as a positive control. At the initial time point, 100 µL of the Limulus amebocyte lysate agent was added to each tube and incubated at 37 °C for 8 min. Then, 100 µL of chromogenic substrate was added to each tube and incubated at 37 °C for 6 min. After the incubation, 500 µL of azo reagent 1, azo reagent 2, azo reagent 3 were separately added in turn and allowed to stand for 5 min. The optical density was measured at 545 nm using a microplate reader (Termo Scientifc, Waltham, USA).
Sample collection
Qualified stool samples were seprarately collected in sterile frozen tubes by subjects and were transported immediately to the laboratory where they were stored at -80 ℃ for further testing. Routine clinical parameter tests were performed in the clinical laboratories of Ningxia Medical University General Hospital.
Gut microbiota analysis
There were 24 children in PNS_In, 15 children in PNS_Re and 20 children in HCs, were enrolled to collect fresh feces in sterile tube and immediately stored at -80 ℃ until DNA was extraction.
16 S rRNA gene sequencing
Total microbial genomic DNA was extracted from faeces samples using MagAtrract PowerSoil Pro DNA Kit (Qiagen, Hilden, Germany) according to manufacturer’s instructions. The quality and concentration of DNA were determined by 1.0% agarose gel electrophoresis and a NanoDrop® ND-2000 spectrophotometer (Thermo Scientific Inc., USA) and kept at − 80 ℃ prior to further use. The hypervariable region V3-V4 of the bacterial 16 S rRNA gene were amplified with primer pairs 338 F (5′-ACTCCTACGGGAGGCAGCAG-3′) and 806R (5′-GGACTACHVGGGTWTCTAAT-3′) by an ABI GeneAmp® 9700 PCR thermocycler (ABI, CA, USA). The PCR mixture including 4 µL5 × Fast Pfu buffer, 2 µL 2.5 mm dNTPs, 0.8 µL Forward Primer (5 µm), 0.8 µl Reverse Primer (5 µm), 0.4 µL Fast Pfu Polymerase, 0.2 µL BSA, 10 ng of template DNA, and ddH2O reached to a final volume of 20 µL. PCR amplification cycling conditions were as follows: initial denaturation at 95 ℃ for 3 min, followed by 30 cycles of denaturing at 95 ℃ for 30 s, annealing at 55 ℃ for 30 s and extension at 72 ℃ for 45 s, and single extension at 72 ℃ for 10 min, and ending at 10 ℃. All samples were amplified in triplicate. The PCR product was extracted from 2% agarose gel and purified, then quantified using Quantus™ Fluorometer (Promega, USA). Purified amplicons were pooled in equimolar amounts and paired-end sequenced on an Illumina PE250 platform (Illumina, San Diego, USA) according to the standard protocols by Majorbio Bio-Pharm Technology Co. Ltd. (Shanghai, China).
After demultiplexing, the resulting sequences were filtered with fastp (0.19.6) and merged with FLASH ( v1.2.11). Then the high-quality sequences were denoised using DADA2 plugin in the Qiime2 (version 2020.2) pipeline with recommended parameters, which obtains single nucleotide resolution based on error profiles within samples. DADA2 denoised sequences are usually called amplicon sequence variants (ASVs). To minimize the effects of sequencing depth on alpha and beta diversity measure, the number of sequence from each sample was rarefied to 20,000, which still yielded an average Good’s coverage of 97.90%. Taxonomic assignment of ASVs was performed using the Naive bayes consensus taxonomy classifier implemented in Qiime2 and the SILVA 16 S rRNA database (v138). The metagenomic function was predicted by PICRUSt2 (Phylogenetic Investigation of Communities by Reconstruction of Unobserved States) based on ASV representative sequences. PICRUSt2 is a software containing a series of tools as follows. HMMER was used to aligns ASV representative sequences with reference sequences. EPA-NG and Gappa were used to put ASV representative sequences into a reference tree. The castor was used to normalize the 16 S gene copies. MinPath was used to predict gene family profiles, and locate into the gene pathways. Entire analysis process was according to protocols of PICRUSt2.
Untargeted fecal metabolomics analysis
The LC analysis was performed on a Vanquish UHPLC System (Thermo Fisher Scientific, USA). Chromatography was carried out with an ACQUITY UPLC ® HSS T3 (2.1 × 100 mm, 1.8 µm) (Waters, Milford, MA, USA). The column was maintained at 40 ℃. The flow rate and injection volume were set at 0.3 mL/min and 2 µL, respectively. For LC-ESI (+) -MS analysis, the mobile phases consisted of (B2) 0.1% formic acid in acetonitrile (v/v) and (A2) 0.1% formic acid in water (v/v). Separation was conducted under the following gradient: 0 ~ 1 min, 8% B2;1 ~ 8 min, 8%~98% B2; 8 ~ 10 min, 98% B2;10 ~ 10.1 min, 98%~8% B2;10.1 ~ 12 min, 8% B2. For LC-ESI (-)-MS analysis, the analytes was carried out with (B3) acetonitrile and (A3) ammonium formate (5 mm). Separation was conducted under the following gradient: 0 ~ 1 min, 8% B3;1 ~ 8 min, 8%~98% B3; 8 ~ 10 min, 98% B3;10 ~ 10.1 min, 98%~8% B3;10.1 ~ 12 min, 8% B3.
Mass spectrometric detection of metabolites was performed on Orbitrap Exploris 120 (Thermo Fisher Scientific, USA) with ESI ion source. Simultaneous MS1 and MS/MS (Full MS-ddMS2 mode, data-dependent MS/MS) acquisition was used. The parameters were as follows: sheath gas pressure, 40 arb; aux gas flow, 10 arb; spray voltage, 3.50 kV and − 2.50 kV for ESI(+) and ESI(-), respectively; capillary temperature, 325 ℃; MS1 range, m/z 100–1000; MS1 resolving power, 60,000 FWHM; number of data dependant scans per cycle, 4; MS/MS resolving power, 15,000 FWHM; normalized collision energy, 30%; dynamic exclusion time, automatic.
Statistical analysis
Graphpad prism version 8.0.2 (GraphPad Software Inc., La Jolla, CA, USA) and the statistical package for the social sciences (SPSS) 22.0 software (IBM Inc., Armonk, NY, USA) were used for statistical analyses. One-way analysis of variance was used to compare the mean values of variables among groups. After that, Tukey’s post hoc test was used to determine the significance of pairwise comparison of mean values between groups. In addition, the expression correlation was analyzed by Spearman correlation coefficient assay. P < 0.05 was considered statistically significant.
Results
Patients with PNS display dysbiosis of microbiota composition
All participants, including patients and volunteers, resided in Ningxia, China. The clinical parameters of the three groups were shown in Table 1. Compared to the PNS_Re group, allergic diseases and breastfeeding time of PNS_In children were significantly increased (P < 0.05 and P < 0.05), proteinuria elimination time was markedly decreased (P < 0.0001), and other factors showed no significant difference (P > 0.05). Compared to the HCs group, allergic diseases of PNS_In children were noticeably increased (P < 0.001) and breastfeeding time of PNS_Re children were significantly decreased (P < 0.01) and other factors showed no difference (P > 0.05).
Table 1.
Clinical basic characteristics and biochemical indexes of participants in three groups
| Parameters | HCs (n = 20) | PNS_In (n = 27) | PNS_Re (n = 17) |
|---|---|---|---|
| Age (Years) | 7.56 (3.4, 13.5) | 5.69 (1.3, 14) | 7.57 (1.7, 12.8) |
| Gender (Male/Female) | 11/9 | 16/11 | 8/9 |
| Mode of birth (Vaginal delivery/ Cesarean delivery) | 15/5 | 21/6 | 14/3 |
| Weight (kg) | 28.25 ± 15.54 | 22.71 ± 10.72 | 27.94 ± 12.67 |
| Breastfeeding time (Month) | 12.300 ± 5.667 | 11.410 ± 5.514* | 6.588 ± 3.842‡‡ |
| Allergic diseases (Yes/NO) | 6/14 | 22/5* ††† | 8/9 |
|
Type of disease (Simple nephropathy/ Nephritis nephropathy) |
- | 19/8 | 10/7 |
| WBC (×106/µL) | - | 10.21 ± 3.934 | 11.43 ± 8.708 |
| NEUT (×106/µL) | - | 4.178 ± 1.938 | 7.020 ± 7.629 |
| PLT (×106/µL) | - | 424.9 ± 156.5 | 402.2 ± 129.8 |
| FIB (g/L) | - | 5.029 ± 0.750 | 5.101 ± 2.365 |
| IgA (g/L) | - | 1.178 ± 0.659 | 1.326 ± 0.858 |
| IgG (g/L) | - | 2.294 ± 1.536 | 2.161 ± 1.992 |
| IgM (g/L) | - | 1.507 ± 0.607 | 1.725 ± 1.144 |
| C3 (g/L) | - | 1.295 ± 0.184 | 1.371 ± 0.578 |
| C4 (g/L) | - | 0.313 ± 0.091 | 0.324 ± 0.148 |
| ALB (g/L) | - | 18.030 ± 2.132 | 19.460 ± 5.397 |
| TC (mmol/L) | - | 8.732 ± 1.574 | 9.008 ± 2.973 |
| TG (mmol/L) | - | 2.459 ± 1.121 | 2.294 ± 1.020 |
| SCr (µmol/L) | - | 33.820 ± 8.625 | 40.280 ± 15.590 |
| 24 h urine protein (mg/kg.d) | - | 161.6 ± 83.84 | 143.1 ± 69.82 |
| MAU (mg/L) | - | 6490.64 ± 6010.21 | 5784.81 ± 11658.76 |
| Proteinuria elimination time (days) | - | 10.00 ± 2.602*** | 20.06 ± 6.240 |
| AST (U/L) | - | 35.89 ± 8.47 | 39.93 ± 31.34 |
| ALT (U/L) | - | 20.24 ± 7.24 | 24.48 ± 12.65 |
proteinuria elimination time (after the first hormone treatment) (*PNS_In VS PNS_Re, *P < 0.05, **P < 0.01, ***P < 0.001; †PNS_In VS HCs, †P < 0.05, ††P < 0.01, †††P < 0.001; ‡PNS_Re VS HCs, ‡P < 0.05, ‡‡P < 0.01)
In recent years, accumulating studies have confirmed that gut microbiota has an important impact on the occurrence and development of kidney diseases through the gut-kidney axis [12, 22–25]. Thus, we detected fecal samples in different groups by 16 S rRNA sequencing. Here, alpha diversity was first analyzed. Rarefaction curve showed that the sequencing depth of samples among different samples was consistent and the sequencing data was reasonable. (Fig. 1B). Compared with the HCs group, the Chao index of AVS level of PNS_In and PNS_Re were markedly decreased (P < 0.001, P < 0.01) (Fig. 1C), and the Shannon index of AVS level of PNS_In was significantly decreased (P < 0.001) (Fig. 1D). PCoA were used to analyze the overall composition of the bacterial community and a cluster represented a group. We found that there were significant differences in bacterial communities among the PNS_In, PNS_Re and the HCs group (R = 0.133, P < 0.001) (Fig. 1E). β-diversity among the three groups was evaluated using beta diversity distance, showing a clear difference in the distribution of the groups. Compared to the HCs and PNS_Re group, β-diversity in the PNS_In group significantly increased(P < 0.0001, P < 0.0001) (Fig. 1F and G), compared to the HCs group, PNS_Re group exerted no significant difference (P > 0.05) (Fig. 1H). Moreover, gut microbiome health index (GMHI) was realized by comparing the relative abundance of two groups of microbial species associated with homeostasis conditions. We found that compared to the HCs group, gut microbiome health index in PNS_In and PNS_Re group exerted significant decrease (P < 0.001, P < 0.001) (Fig. 1I and J), compared to the PNS_In group, PNS_Re group noticeably increased (P < 0.05) (Fig. 1K). Microbial dysbiosis index (MDI) concerning the degree of microbial ecological dysbiosis displayed a significant difference between HCs and PNS_In group (P < 0.001) (Fig. 1L), HCs and PNS_Re group (P < 0.001) (Fig. 1M), or PNS_In and PNS_Re (P < 0.05) (Fig. 1N).
Faecalibacterium is closely correlated to the patients with PNS
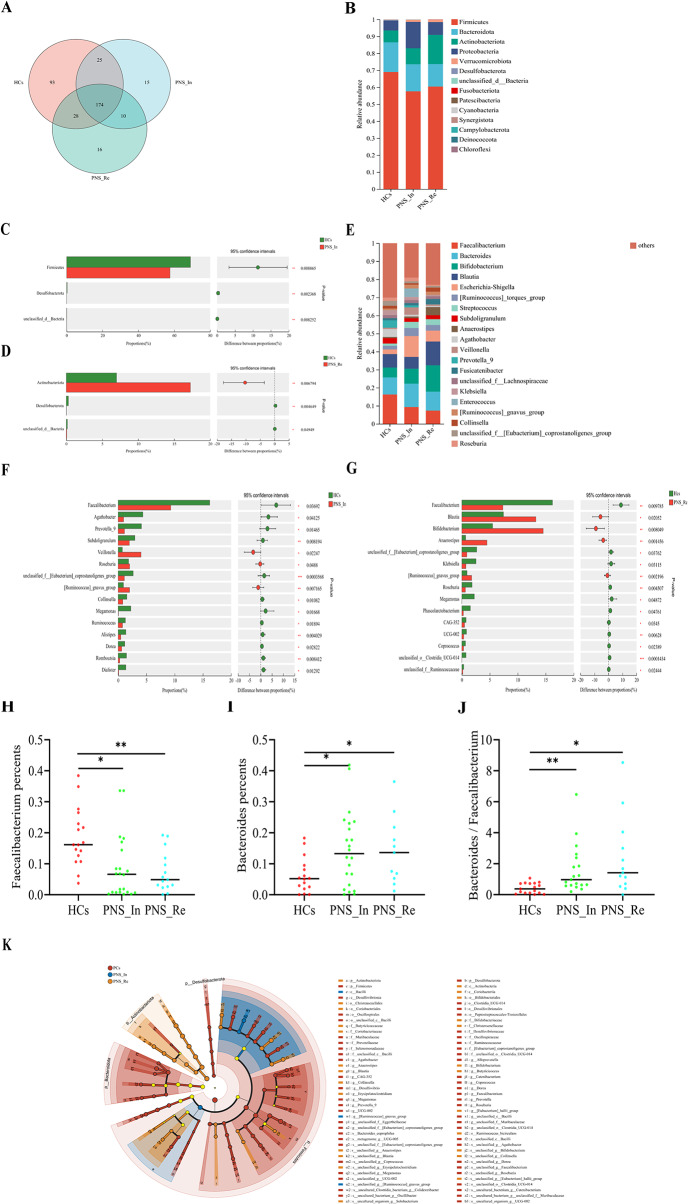
In order to further understand the gut microbial community in children PNS, we performed 16 S rRNA sequencing and analysis. First of all, the Venn diagram analysis showed that the number of genus shared by the 3 groups was 361, and the number of genus unique to the HCs, PNS_In and PNS_Re group, was 93, 15 and 16, respectively (Fig. 2A). Next, we studied the abundance changes of intestinal fora in different groups at the phylum. The results showed that compared to the HCs group, Firmicutes and Desulfobacterota were decreased in the PNS_In children (All P < 0.01) (Fig. 2B and C), Desulfobacterota was decreased in PNS_Re group (P < 0.01) (Fig. 2D), but Actinobacteriota was increased (P < 0.01) (Fig. 2D). Intriguingly, Faecalibacterium were dominantly different among diverse groups (Fig. 2E). The proportion of Faecalibacterium either in the PNS_In or PNS_Re group was separately lower than that in the HCs group (P < 0.05, P < 0.01) (Fig. 2F to H). However, at the genus level, the proportion of Bacteroidetes in the PNS group, included primary and relapse groups, was separately higher than that in the HCs group (P < 0.05, P < 0.05) (Fig. 2I) and the ratio of Bacteroidetes to Faecalibacterium also increased signifcantly (P < 0.05, P < 0.05) (Fig. 2J). In addition, LEfSe used to identify essential differences in bacterial abundance (phylum to species level) between the PNS_In, PNS_Re and HCs groups. Only taxa with a significant LDA threshold value > 4 were shown. LefSe revealed that the PNS patients also exhibited significant reductions in the abundance of health-promoting fora, such as Firmicutes phylum and Enterococcaceae class. Conversely, Bacilli class were more enriched in PNS_In patients than in HCs, and Actinobacteriota phylum, Christensenellales and Coriobacteriales order were a vital indicators in PNS_Re group. Furthermore, Faecalibacterium, belonged to the Clostridiaceae family, Firmicutes phylum, played a very important role in PNS patients (Fig. 2K). Taken together, patients with PNS had a close association with the dysbiosis of gut microbiota, especially including a major imapct on weakened Faecalibacterium proportion.
Fig. 2.
The abundance changes of gut microbiota in the HCs, PNS_In and PNS_Re group. (A) Venn diagram. (B) Bar diagrams presented the relative abundance on phylum level. (C, D) Wilcoxon rank-sum test bar plot of abundance community on phylum level. (E) Bar diagrams presented the relative abundance on genus level. (F, G) Wilcoxon rank-sum test bar plot of abundance community on phylum level. (H) Abundance community of Faecalibacterium on genus level. (I) Abundance community of Bacteroidetes on genus level. (J) Ratio of Bacteroidetes to Faecalibacterium on genus level. (K) The result of LEfSe analysis. Data were expressed as mean ± SD. *P < 0.05, **P < 0.01, ***P < 0.001
Immunological imbalance and inflammation are occured in children with PNS
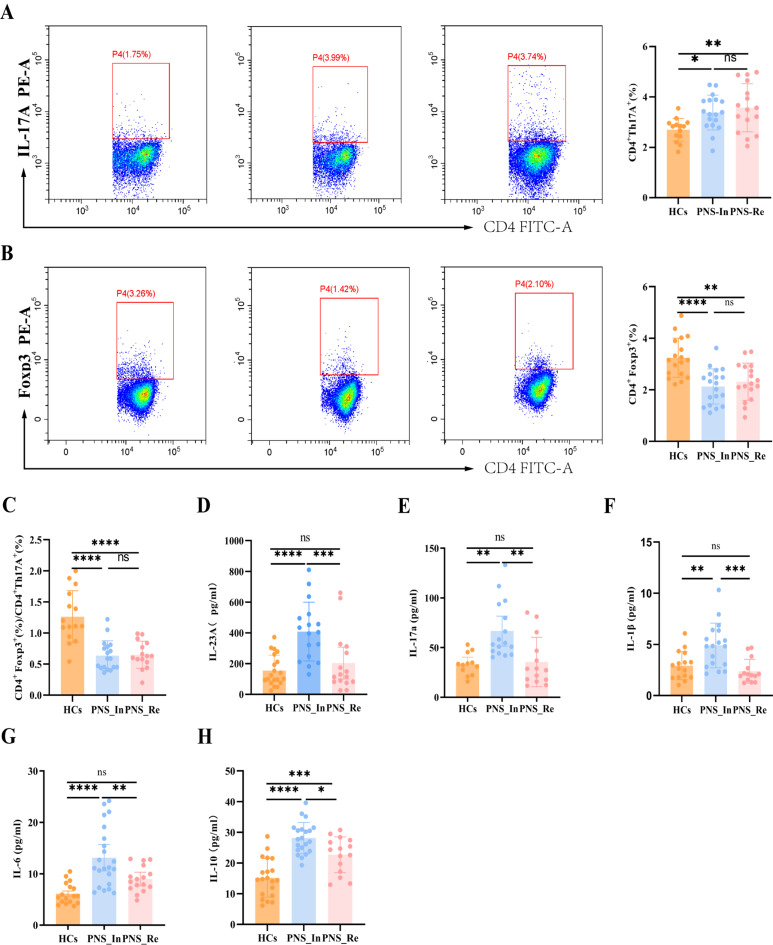
At present, the pathogenesis of PNS is poorly understood. It is generally believed that immune abnormalities are the initial factors, and inflammatory response plays an important role in the occurrence and development of PNS [13, 14]. In order to further evaluate the role of Th17/Tregs inflammation regulation axis in PNS, we used flow cytometry to detect Treg cells and Th17 cells in peripheral blood lymphocytes. Importantly, we found that the expression of CD4+IL-17 A+ cells in PNS_In and PNS_Re groups were significantly increased (P < 0.05, P < 0.001) (Fig. 3A), while the expression of CD4+Foxp3+ cells displayed remarkably decreased (P < 0.0001, P < 0.01) (Fig. 3B). Meanwhile, we found that compared to the HCs group, the ratio of the expression of Treg cells and Th17 cells was notably decreased (all P < 0.0001) (Fig. 3C). The above revealed an imbalance of Tregs/Th17 axis in children with PNS.
Fig. 3.
Immunological imbalance and inflammation in children with PNS. (A) Flow cytometry analysis was used to separately determine the proportions of Th17 cells, (B) Treg cells, (C) ratio of Treg/Th17, as well as the concentrations of (D) IL-23 A in plasma, (E) IL-17 A, (F) IL-1β, (G) IL-6, and (H) IL-10. Data were expressed as mean ± SD. *P < 0.05, **P < 0.01, ***P < 0.001, ****P < 0.0001
Moreover, we further identified pro-inflammatory cytokines in children with PNS. The results exhibited that compared to HCs group, the levels of pro-inflammatory IL-23p, IL-17 A, IL-1β and IL-6 in peripheral blood of the PNS_In group were worsened (P < 0.0001, P < 0.01, P < 0.01 and P < 0.0001), but the PNS_Re group exerted no difference (Fig. 3D to G). The above situation was probably related to take glucocorticoids in children with PNS_Re group. It was even more interesting that the levels of anti-inflammatory IL-10 in the PNS_In and PNS_Re groups were outstandingly increased compared to HCs group (P < 0.0001, P < 0.001) (Fig. 3H).
Correlation analyses among relative abundance of Faecalibacterium and inflammation, Tregs/Th17 axis, and other clinical indicators
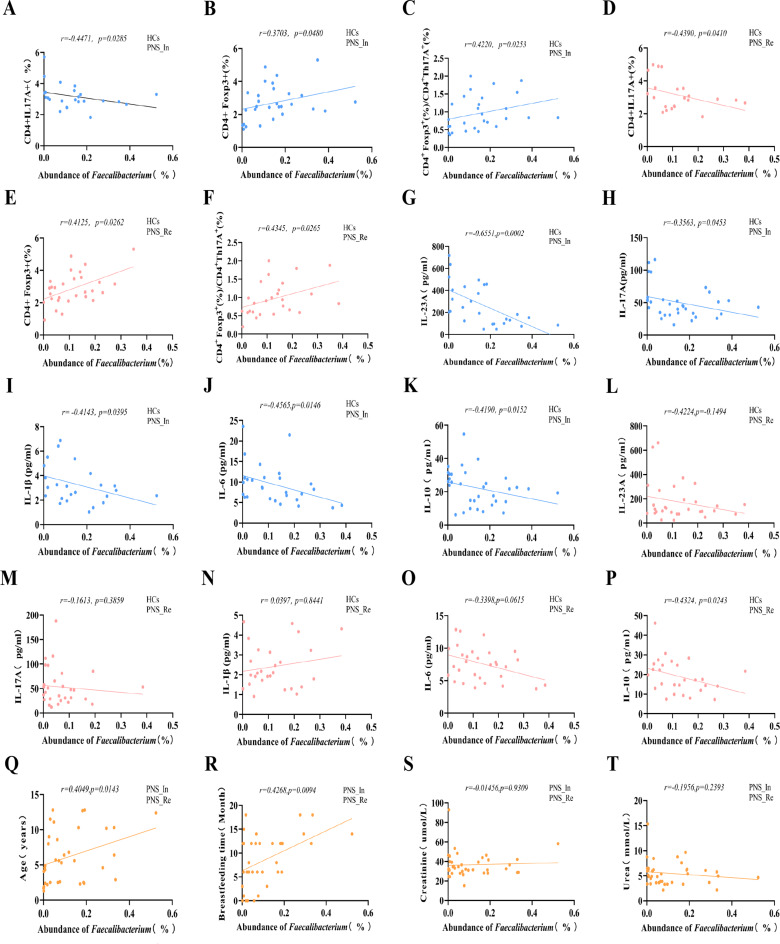
To evaluate the relationship among abundance of the most differential bacteria Faecalibacterium, inflammation and important clinical indicators in PNS, we performed a correlation analysis. We found that the abundance of differential candidate Faecalibacterium in genus level of gut microbiota was negatively correlated with the proportion of Th17 cells in the peripheral blood lymphocytes (r = − 0.4471, P < 0.05) (Fig. 4A), but positively correlated with the proportion of Treg cells and the ratio of Tregs/Th17 (r = 0.3703, P < 0.05 and r = 0.4220, P < 0.05) (Fig. 4B and C). Intriguingly, in the PNS_Re and HCs children, the abundance Faecalibacterium was negatively correlated with the proportion of Th17 cells (r = − 0.4390, P < 0.05) (Fig. 4D), but positively correlated with the proportion of Treg cells and the ratio of Tregs/Th17 (r = 0.4125, P < 0.05 and r = 0.4345, P < 0.05) (Fig. 4E and F).
Fig. 4.
Correlation analyses among relative abundance of Faecalibacterium, inflammatory indicators and clinical parameters. (A) To evaluate the relationship between abundance of Faecalibacterium and proportions of Th17 cells, (B) proportion of Treg cells and (C) the ratio of Tregs/Th17 in PNS_In and HCs children, (D) proportions of Th17 cells, (E) proportion of Treg cells and (F) the ratio of Tregs/Th17 in the PNS_Re and HCs children, the concentrations of IL-23 A (G), IL-17 A (H), IL-1β (I), IL-6 (J) and IL-10 (K) in the PNS_In and HCs children, the concentrations of IL-23 A (L), IL-17 A (M), IL-1β (N), IL-6 (O) and IL-10 (P) in the PNS_Re and HCs children, (Q) Age, (R) Breastfeeding time, (S) Creatinine and (T) Urea in PNS group children
Next, we investigated the relationship between plasma inflammatory cytokines and abundance of Faecalibacterium. Our study showed that in the PNS_In and HCs children, the abundance of Faecalibacterium in gut microbial genus level was negatively correlated with the concentrations of IL-23 A, IL-17 A, IL-1β, IL-6 and IL-10 in plasma (r = − 0.6551, P < 0.001; r = − 0.3563, P < 0.05; r = − 0.4143, P < 0.05,r = − 0.4565, P < 0.05 and r = − 0.4190, P < 0.05) (Fig. 4G to K). Meanwhile, in the PNS_In and HCs children, the correlation between the abundance of Faecalibacterium and the concentrations of IL-23 A, IL-17 A, IL-1β and IL-6 were not statistically significant (r = − 0.4224, P > 0.05; r = − 0.1613, P > 0.05; r = 0.0397, P > 0.05 and r = − 0.3398, P > 0.05) (Fig. 4L to O), however, negatively correlated with the concentrations of IL-10 (r = − 0.4324, P < 0.05) (Fig. 4P).
Furthermore, we found the abundance of Faecalibacterium in gut microbial genus level were positively correlated with age and breastfeeding time in the PNS_In and HCs children (r = 0.4049, P < 0.05 and r = 0.4268, P < 0.01 ) (Fig. 4Q, and R), but had no correlation with creatinine and urea (r = 0.4049, P < 0.05 and r = 0.4268, P < 0.01) (Fig. 4S and T).
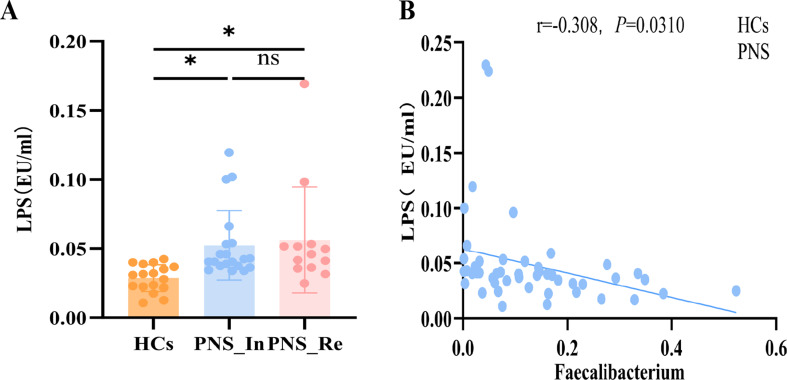
Finally, LPS derived from gut pathogenic bacteria plays a vital role in the promotion of inflammation in mice with PNS [26]. Thus, the level of LPS in the plasma was measured and found that compared to the HCs group, LPS in children with PNS_In or PNS_Re was respectively increased (P < 0.05, P < 0.05) (Fig. 5A), suggesting that microbial dysbiosis induced the endotoxinemia may contribute to the occurance and development of children PNS. Furthermore, there was negative correlation between LPS and Faecalibacterium (Fig. 5B).
Fig. 5.
Lipopolysaccharide (LPS) level in children with PNS. (A) LPS level in diverse groups. (B) Correlation analyses between relative abundance of Faecalibacterium and LPS. Data were expressed as mean ± SD. *P < 0.05, **P < 0.01, ***P <0.0001
Collectively, these results indicated that there was a closely complicated correlation among gut microbiome such as Faecalibacterium, inflammatory indicators, and PNS clinical parameters.
Evaluation of fecal metabolites reveals alterations in the gut metabolome in PNS children by MS1 analysis
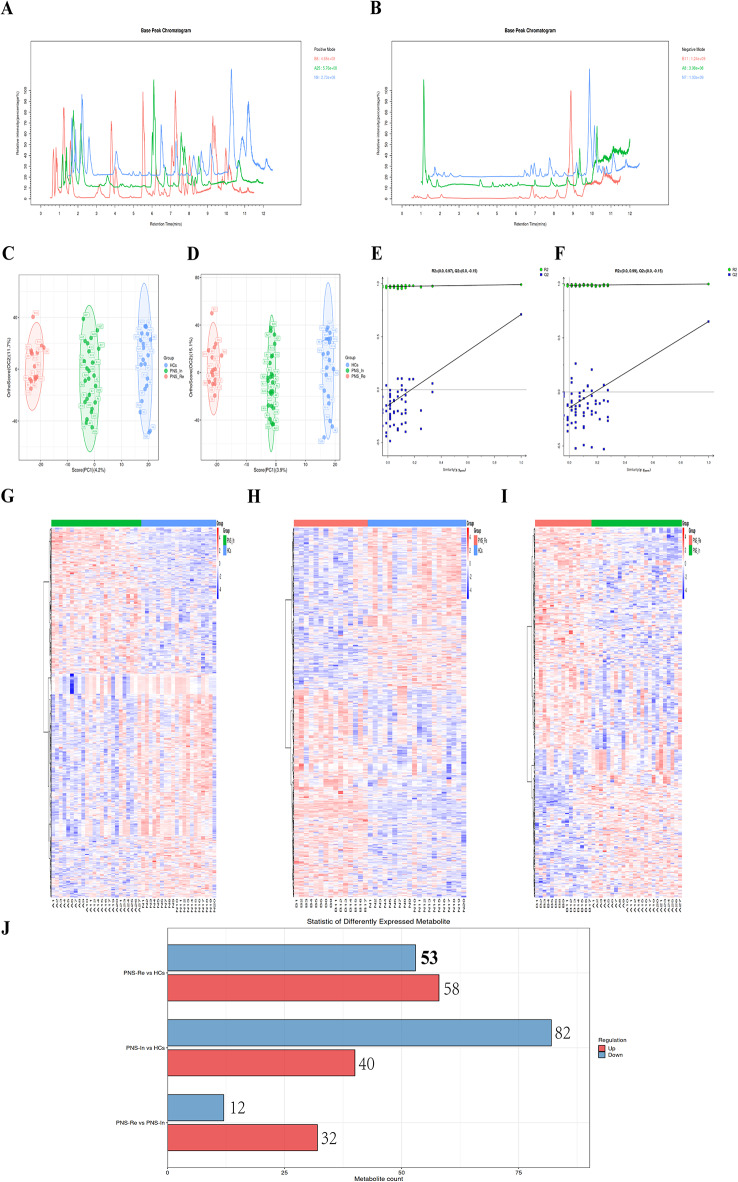
The fecal samples were analyzed 7651 peaks using the LC-ESI (+) -MS analytical technique, and 7642 peaks using the LC-ESI (-) -MS analysis were identified for further analysis (Fig. 6A and B). The OPLS-DA analysis showed a distinct separation in the distribution of sample metabolites among three groups (Fig. 6C and D). Metabolites which VIP > 1 in OPLS-DA and P value < 0.05 in student’s t-test were regarded as differential expressed metabolites (DEMs).
Fig. 6.
MS analysis of differential substances in diverse groups. (A) Comparison among HCs, PNS_In and PNS_Re groups, Base peak chromatogram (BPC) using the LC-ESI (+) -MS analysis. (B) Comparison among HCs, PNS_In and PNS_Re groups, Base peak chromatogram (BPC) using the LC-ESI (-) -MS analysis. (C) The OPLS-DA analysis among three groups using the LC-ESI (+) -MS analysis. (D) The OPLS-DA analysis among three groups using the LC-ESI (-) -MS analysis. (E) The OPLS-DA permutation test diagram among three groups using the LC-ESI (+) -MS analysis. (F) The OPLS-DA permutation test diagram among three groups using the LC-ESI (-) -MS analysis. (G) Heatmaps of the differentially altered metabolites between PNS_In and HCs using the MS1 analysis, (H) between PNS_Re and HCs, or (I) between PNS_Re and PNS_In group. (J) The number of differential metabolites between each two groups using the MS-MS analysis
The horizontal axis represents the similarity between the sample’s true grouping and 100 random groupings, and the vertical axis represents the model evaluation parameters. The points Q2 and R2 in the upper right corner represent the model evaluation parameters for the true grouping. When both Q2 and R2 points are below the original Q2 and R2 points in the upper right, indicating that the model is reliable (Fig. 6E and F).
Heatmaps of the differentially altered metabolites in the gut using LC-ESI (+) -MS analysis of differential substances showed a distinct separation in the distribution of sample metabolites between PNS_In and HCs group (Fig. 6G), PNS_Re and HCs group (Fig. 6H) and PNS_In and PNS_Re group (Fig. 6I).
Moreover, using the Bar diagram in positive ion mode for MS/MS analysis, the number of differential substances shared by the 3 groups was 634. Compared to HCs group, the number of up-regulation and down-regulation in the PNS_In and PNS_Re group was 58, 53, 40 and 82, respectively (Fig. 6J). In summary, significant differences in the gut metabolome of PNS children were exhibited in initial and reoccurance stages of the disease.
DA score is chosen as the index to describe the relative abundance of metabolism pathways between two groups
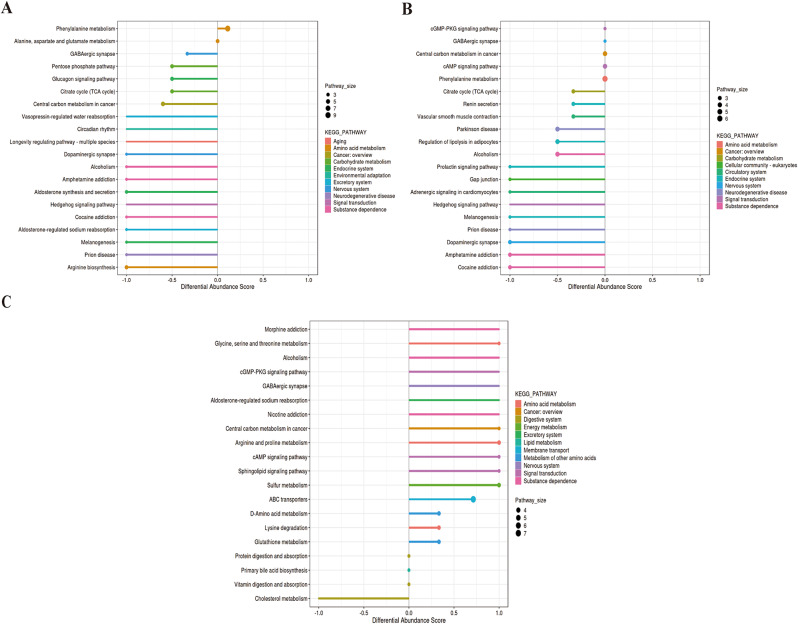
These differential metabolites were assigned to different metabolic pathways according to KEGG (Kyoto Encyclopedia of Genes and Genomes) pathway database. Differential abundance (DA) score was used to describe the change situation of metabolism pathways. The metabolic pathways between PNS_In and HCs groups were analyzed. These pathways included amino acid metabolism (phenylalanine metabolism, alanine, aspartate and glutamate metabolism and arginine biosynthesis), carbohydrate metabolism (pentose phosphate pathway and citrate cycle (TCA cycle)), endocrine system (glucagon signaling pathway, aldosterone synthesis and secretion and melanogenesis), environmental adaptation (including circadian rhythm), excretory system (vasopressin-regulated water reabsorption and aldosterone-regulated sodium reabsorption), neurodegenerative disease (prion disease), signal transduction (hedgehog signaling pathway) and substance dependence (alcoholism, amphetamine addiction and cocaine addiction) (Fig. 7A). Metabolic differential pathways between PNS_Re and HCs included amino acid metabolism (phenylalanine metabolism), carbohydrate metabolism (citrate cycle (TCA cycle)), cellular community-eukaryoteslipid (gap junction), circulatory system (vascular smooth muscle contraction and adrenergic signaling in cardiomyocytes), endocrine system (renin secretion, regulation of lipolysis in adipocytes, prolactin signaling pathway and melanogenesis), nervous system (GABAergic synapse and dopaminergic synapse), neurodegenerative disease (parkinson disease and prion disease), signal transduction (cGMP-PKG signaling pathway, cAMP signaling pathway and hedgehog signaling pathway), and substance dependence (alcoholism, amphetamine addiction and cocaine addiction) (Fig. 7B). However, metabolic pathways between PNS_Re and PNS_In included amino acid metabolism (glycine, serine and threonine metabolism, arginine and proline metabolism and lysine degradation), digestive system (protein digestion and absorption, vitamin digestion and absorption and cholesterol metabolism), energy system (sulfur metabolism), excretory system (aldosterone-regulated sodium reabsorption), lipid metabolism (primary bile acid biosynthesis), membrane transport (ABC transporters), metabolism of other amino acids (D-Amino acid metabolism and cholesterol metabolism), nervous system (GABAergic synapse), signal transduction (cGMP-PKG signaling pathway, cAMP signaling pathway and sphingolipid signaling pathway), and substance dependence (morphine addiction, alcoholism and nicotine addiction) (Fig. 7C).
Fig. 7.
The status of metabolism in three groups. (A) DA score was chosen as the index to describe the relative abundance of metabolism pathways between PNS_In and HCs group, (B) between PNS_Re and HCs group, (C) between PNS_Re and PNS_In group
Phenylalanine metabolism plays an important role in the gut metabolome in children with PNS
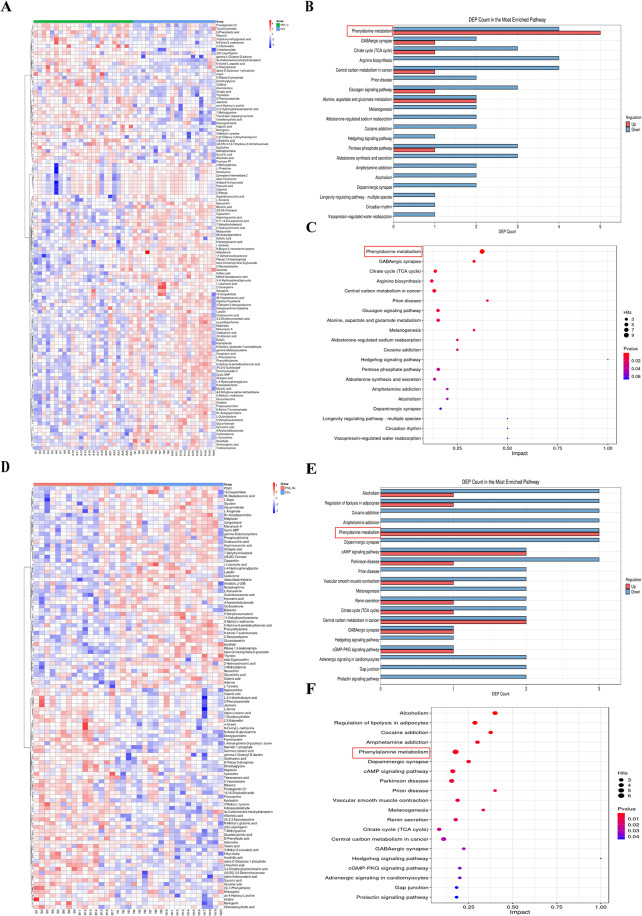
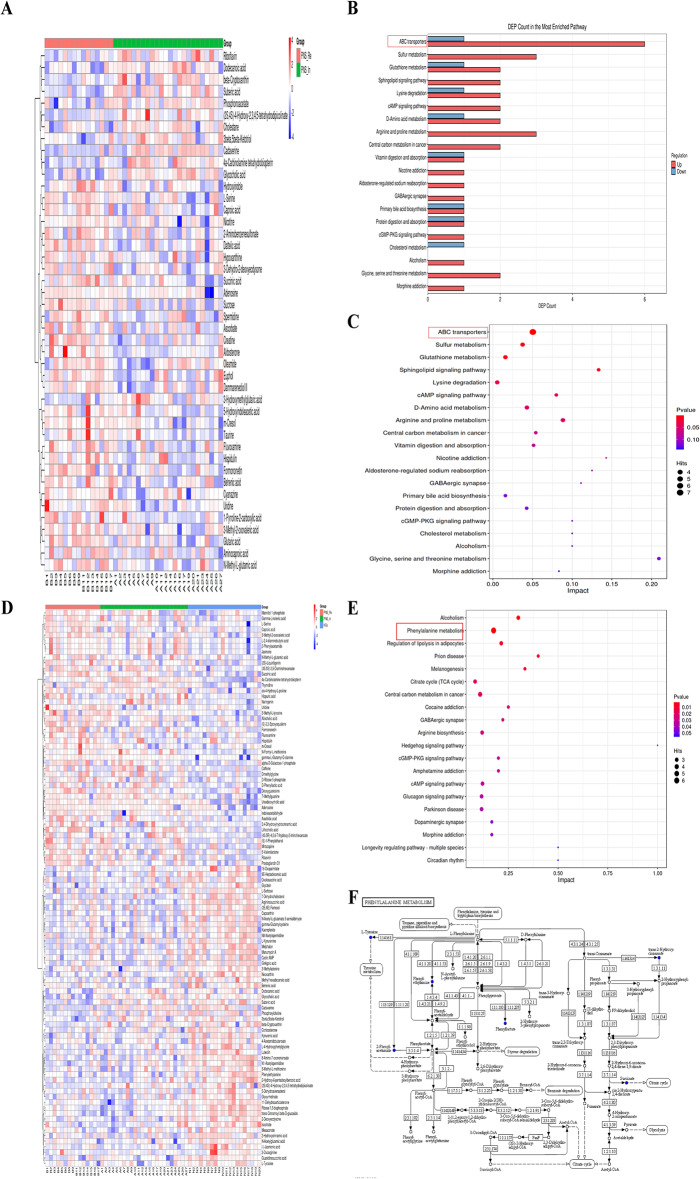
The heatmap indicated a significant difference in fecal metabolic patterns between PNS_In and HCs group (Fig. 8A). The number of specific metabolites change in the pathways was shown in Fig. 8B. Between PNS_In group and HCs group, in phenylalanine metabolism, upHits was 5 DEMs and downHits was 4 DEMs; in GABAergic synapse, upHits was 2 DEMs and downHits was 1 DEMs. As depicted in Fig. 8C, the majority of pathways exhibited down-regulation in the PNS_In group in comparison with the HCs. Notably, the phenylalanine metabolism displayed a significant statistical difference, while GABAergic synapse and citrate cycle (TCA cycle) were significantly decreased.
Fig. 8.
The relative abundance of metabolism pathways between each two groups. (A) The heatmap of 122 DEMs between PNS_In and HCs group. (B) The bar chart of the number of specific metabolites change in the pathways between PNS_In and HCs group. (C) Bubble plots presented the differential metabolism pathways between PNS_In and HCs group. (D) The heatmap of 111 DEMs between PNS_Re and HCs group. (E) The bar chart of the number of specific metabolites change in the pathways between PNS_Re and HCs group. (F) Bubble plots of specific metabolites change in the pathways between PNS_Re and HCs group
Similarly, the heatmap showed notable differences in fecal metabolic patterns between PNS_Re and HCs group (Fig. 8D). In PNS_Re group, upHits and downHits of phenylalanine metabolism were the same 3 DEMs; and in regulation of lipolysis in adipocytes, upHits was 1 DEMs and downHits was 3 DEMs, when compared to HCs group (Fig. 8E). In PNS_Re group, there was a significant distinction in phenylalanine metabolism, while regulations of lipolysis in adipocytes, cocaine addiction and amphetamine addiction were significantly decreased (Fig. 8F).
The heatmap manifested differences in fecal metabolic patterns between PNS_Re and PNS_In group (Fig. 9A). However, in ABC transporters, upHits was 6 DEMs and downHits was 1 DEMs. In arginine and proline metabolism, upHits and downHits showed same 3 DEMs between PNS_In and PNS_Re (Fig. 9B). ABC transporters and arginine and proline metabolism were distinguished between PNS_In and PNS_Re groups (Fig. 9C).
Fig. 9.
The relative abundance of metabolism pathways among three groups. (A) The heatmap of 44 DEMs between PNS_Re and PNS_In groups. (B) The bar chart of the number of specific metabolites change in the pathways between PNS_Re and PNS_In groups. (C) Bubble plots presented the differential metabolism pathways between PNS_Re and PNS_In groups. (D) The heatmap of 100 DEMs among three groups. (E) The bar chart of the number of specific metabolites change in the pathways among three groups. (F) Phenylalanine metabolism-Homo sapiens (human)
Similarly, the heatmap of 100 DEMs revealed significant differences in fecal metabolic patterns among three groups (Fig. 9D). The statistically significant difference among the three groups were the phenylalanine metabolism, regulation of lipolysis in adipocytes and prion disease. (Fig. 9E). In conclusion, phenylalanine metabolism played an important role in the gut metabolome in children with PNS. As depicted in Fig. 9F, the majority of phenylalanine metabolism-Homo sapiens (human) exhibited.
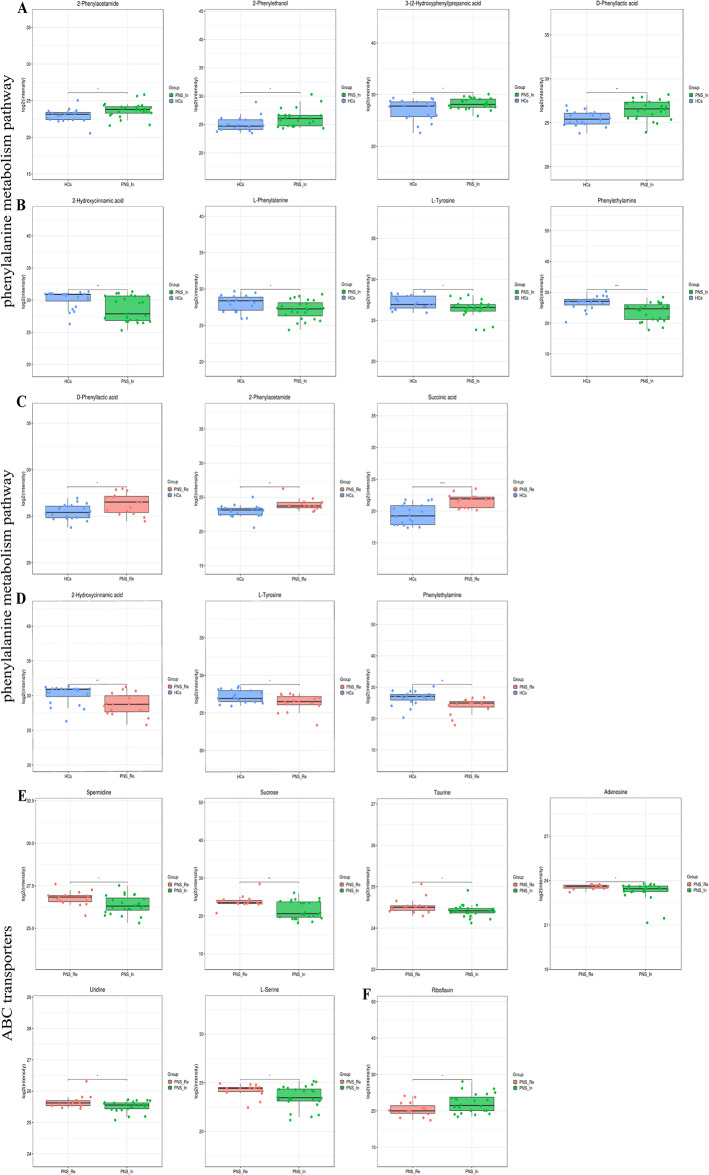
The differential metabolites between PNS_In and HCs in the phenylalanine metabolism included 2-phenylethanol, 2-phenylacetamide, D-phenyllactic acid and 3-(2-hydroxyphenyl) propanoic acid were increased (Fig. 10A), whereas L-phenylalanine, L-tyrosine, 2-hydroxycinnamic acid and phenylethylamine were decreased (Fig. 10B). Compared to HCs, differential substances in PNS_Re groups, including D-phenyllactic acid, 2-phenylacetamide and succinic acid were remarkably elevated (Fig. 10C), but L-Tyrosine, 2-hydroxycinnamic acid and phenylethylamine pesented a reduction (Fig. 10D). Between PNS_In and PNS_Re groups, different items in ABC transporters including L-serine, sucrose, adenosine, taurine, uridine and spermidine were diminished (Fig. 10E) and riboflavin raised (Fig. 10F).
Fig. 10.
The differential metabolites between groups in the phenylalanine metabolism and ABC transporters pathway (red = PNS_Re, green = PNS_In, blue = HCs). (A, B) Boxplot summaries of the peak intensities of the phenylalanine metabolism between PNS_In and HCs. (C, D) Boxplot summaries of the peak intensities of the phenylalanine metabolism between PNS_Re and HCs. (E, F) Boxplot summaries of the peak intensities of the ABC transporters between PNS_Re and PNS_In. Data were expressed as mean ± SD. *P < 0.05, **P < 0.01, ***P <0.0001
Discussion
Akin to an anaerobic bioreactor, the colorectum harbors an enormous diversity of microbiota, which are capable of producing an extraordinarily wide range of small molecules (i.e., short chain fatty acids) that influence many vital pathways associated with energy homeostasis, nutritional intake, and immune balance [27]. The results of this study indicate that compared to healthy children, both PNS_In and PNS_Re patients have obvious changes in gut microbiota and fecal metabolites. Meanwhile, the differential gut microbiota between HCs and PNS patients have a close relationship with immune balance.
The most important period of establishment and development of the gut microbiota is the first year after birth. Taxonomic diversity is relatively low at birth but increases over time [28]. In childhood (2–5 years), the gut microbiota composition becomes more stable with multiple members of Firmicutes and Bacteroidetes including those with butyrate-producing capacity [29]. The preadolescent gut microbiota (7–12 years) was also found to be enriched in functions potentially involved in ongoing development, such as folate and vitamin B12 synthesis [30]. Regarding the adolescent microbiota (11–18 years), the abundances of the genera Clostridium and Bifidobacterium were significantly higher relative to adults [31]. The results of our study firstly found that the abundance of Faecalibacterium also increased with early age in children with PNS.
Breast-fed infants exhibit an overgrowth of Actinobacteria and an inhibition of Firmicutes and Proteobacteria. Breast milk includes oligosaccharides that can be metabolized effectively by these bacterial species, resulting in an increase in short-chain fatty acids (SCFAs), which directs the immune system to increase the expression of immunoglobulin G. However, formulafed infants exhibit increase of Clostiridia, Streptococci, Bacteroides and Enterbacteria [32, 33]. But, in our study, with the period of breast-fed increased, the abundance of Faecalibacterium also decreased in children with PNS. This may be due to the current economic growth and insufficient breast milk, leading to numerous infants were be fed mixed formula.
Few previous studies reported that gut microbiota dysbiosis was observed in individuals with both PNS_In or PNS_Re and HCs groups. A study found that Firmicutes, Proteobacteria, Bacteroidetes and Actinobacteria dominated in the gut microbiota, but the increased relative abundance after initial therapy was observed in Deinococcus Thermus and Acidobacteria [25, 26]. Moreover, the increase in the ratio of Firmicutes/Bacteroidetes in the PNS group was a feature identified with gut dysbiosis, which was closely related to kidney injury [34]. Interestingly, we found that Faecalibacterium and Bacteroidetes were dominant in different groups and the increase in the ratio of Bacteroidetes/Faecalibacterium in the PNS group, which was consistent with previous studies. Faecalibacterium can regulate Treg/Th17 by inhibiting HDAC 1 and 3 through the metabolite butyrate [35, 36], which affected the renal immune-inflammatory response in children with PNS.
At the phylum level, the INS adult patients [37] showed increases of Fusobacteria and Proteobacteria, but a reduction of Firmicutes compared to the HC group. At the genus level, Megamonas, Megasphaera, Akkermansia, as well as the butyrate-producing bacteria including Lachnospira, Roseburia, and Fusobacterium exhibited more abundant in the HC group than those in the CKD or INS group. Compared with the HC group, Parabacteroides was increased in CKD or INS patients. These results were partially consistent with our findings, which may be attributed to the different ages and pathology of the disease. The main pathology of nephrotic syndrome in adults was membranous nephropathy, whereas in children was the minimal change nephrotic syndrome .
Furthermore, this study showed, at the genus level, the proportion of Bacteroidetes and Lachnoanaerobaculum in the PNS_In group were higher than HCs. But the proportion of Bifidobacterium was lower in PNS_In group (Supplementary Fig. 1). Interestingly, He et al. [37] showed that microbial diversity in the gut was reduced in adult patients with INS. Acidobacteria, Negativicutes, Selenomonadales, Veillonellaceae, Clostridiaceae, Dialister, Rombousia, Ruminiclostridium, Lachnospira, Alloprevotella, Clostridium sensu stricto, Megamonas, and Phascolarctobacterium were significantly reduced, while Pasteurellales, Parabacteroides, Bilophila, Enterococcus, Eubacterium ventriosum, and Lachnoclostridium were markedly increased in patients with INS. The results showed that the proportion of the butyrate-producing bacteria was significantly reduced. Meanwhile, Wang et al. [38] supposed that the reduction of fecal concentration of butyrate could partially explain the modification of the differentiation and induction of regulatory T cells. It was even more interesting that Faecalibacterium Prausnitzii attenuated chronic kidney disease (CKD) via Butyrate-Renal GPR43 Axis [34], which was consistent with our study that the proportion of Faecalibacterium in the PNS_In and PNS_Re group was separately lower than in the HCs group.
At present, the pathogenesis of PNS remains poorly understood. It is generally believed that immune abnormalities are the initial factors, and inflammatory response plays an important role in the occurrence and development of PNS [13, 14]. LPS is a highly inflammatory component of the cell wall of Gram-negative bacteria, which is the causal relationship between gut microbiota and systemic low-grade inflammation [39]. Under physiological condition, Th17/Tregs are in a state of dynamic immune balance. When the abnormality, Th17/Tregs imbalance can cause a series of inflammatory immune responses to damage [9, 12, 40]. Studies have shown that Foxp3+ Treg cells in children with PNS are down-regulated, and the expression of IL-23p19, IL-17, IL-6, and IL-1β exert increased [9]. Butyric acid can significantly enhance the acetylation of histone 3 in the promoter of Foxp3 site and the conserved non-coding sequence region which is a key marker of Treg, suggesting that butyric acid plays an important role in the induction of Treg cell differentiation [41, 42]. Our study also confirmed the down-regulation of Treg cells and the up regulation of Th17 cells in PNS_In, importantly, both of which were decreased in PNS_Re compared to HCs groups. In addition, our study observed aggravated pro-inflammatory factors including IL-23p19, IL-17 A, IL-6 and IL-β, but all of which were restored in PNS_Re groups. This situation may be related to the anti-inflammatory effect of prednisone acetate, which affected inflammatory factors in plasma without an impact on Th17 and Treg lymphocytes. In particular, the anti-inflammatory factor IL-10 of PNS groups was significantly increased, which may be that the the body produced an increase in the anti-inflammatory response.
The role of metabolites of gut microbiota remains largely unknown in the pathogenesis of PNS. There is evidence to suggest that histidine possessed both antioxidant and anti-inflammatory properties, and that a decrease in levels may contribute to the risk of various metabolic syndromes [43]. Phenylalanine metabolism, beta-alanine metabolism, arginine and proline metabolism, and purine metabolism were different between CKD and HCs groups. Phenylalanine metabolism was proposed as a key pathway associated with HUA to induce CKD. 4-hydroxycinnamic acid involved in phenylalanine metabolism was reduced in CKD with hyperuricemia (HUA) patients (CKD-H group) compared to CKD without HUA patients (CKD-N group). 4-Hydroxycinnamic acid has anti-inflammatory and immunomodulatory properties [44]. The reduction in 4-hydroxycinnamic acid indicated that patients with both CKD and HUA were at a higher risk of developing inflammation [45]. Interestingly, we found a decrease in 2-hydroxycinnamic acid of phenylalanine metabolism in PNS_In and PNS_Re groups, of which 4-hydroxycinnamic acid (HCs mean: 6459645.07, PNS_In mean: 3361731.64, PNS_Re mean: 3143626.07) was a isomer. In parallel, the phenylalanine metabolism displayed a significant statistical difference in PNS_In and PNS_Re groups.
In addition, the ABC transporters were crucial pathway associated with PNS to induce recurrence. Dysbiosis of gut microbiota leads to increased production of existing as well as new uraemic solutes and toxins. Absorption, distribution, metabolism and excretion of many of these compounds are mediated by a complex network of SLC, ABC transporters and DMEs. Consequently, dynamic changes occur in transporter-mediated and DME-mediated small-molecule remote communication between the gut microbiota and the failing kidney [46]. Therefore, gut dysbiosis exasperated kidney damage in children with PNS by affecting the ABC pathway that influenced PNS recurrence. Furthermore, Marzocco et al. [47] showed that the oral administration of sodium propionate could indirectly contribute to the protective effect against renal failure through the improvement of intestinal barrier function and the reduction of local and systemic inflammation. Interestingly, Daisuke Mikami et al. examined the effect of administration of propionate on renal function as well as changes in the pathology of adenine-induced CKD in a murine model [48]. Their results suggested that propionate significantly mitigated the increase in serum Cr and BUN in a murine model of adenine-induced CKD. Propionate also inhibited the expression of adenine-induced pro-inflammatory factors (TNF-α, IL-1β, MCP-1, IL-6), and was dependent on FFA2 and FFA3 as receptors for SCFAs to exert protective effects. Finally, in this study, we only explored the role of Faecalibacterium in attenuating chronic kidney disease (CKD) through the butyrate-renal GPR43 axis, the role of additional propionate- FFA2/FFA3-renal axis needs to be further investigated.
There are several limitations of this study. Firstly, the sample size of each group may not be large enough to avoid coincidences, which was need more experiments for validation. Secondly, age and gender were not matched across the different groups, which may have influenced systemic metabolism.
Conclusion
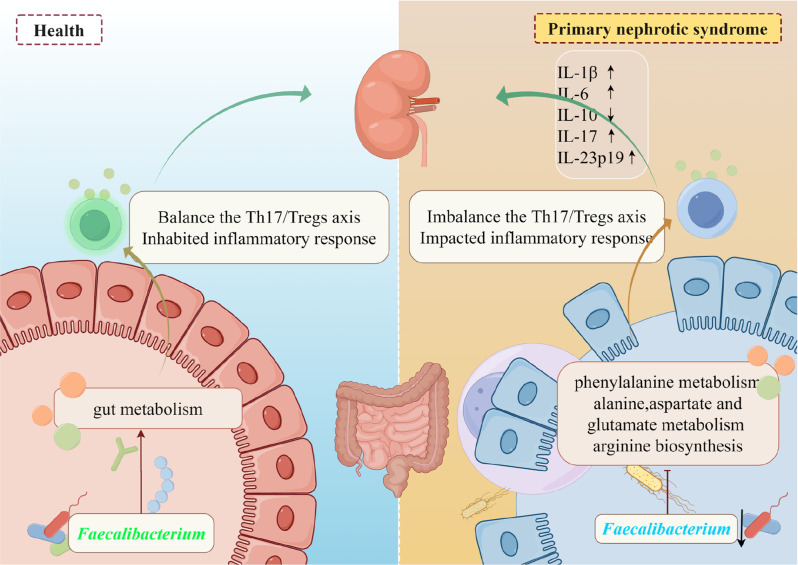
The gut microbiota of children with PNS are quite different from healthy children. The abundance of Faecalibacteriums in PNS is significantly decreased. In children with PNS, Th17/Tregs imbalance leads to an immune inflammatory response, which may be associated with a reduction in the intestinal probiotic Faecalibacteriums. As for metabolism, phenylalanine metabolism is different from HCs and PNS patients. Glycine, serine and threonine metabolism, arginine and proline metabolism exerted notable alterations between initial and recurrence (Fig. 11). Additionally, the ABC transporters play crucial in associated with PNS for leading to the recurrence. Thus, the dynamic influence of gut microbiota and associated metabolites may contribute to the occurance and development of PNS in children, which may potentially serve a novel strategy for the control of the disease.
Fig. 11.
The dynamic changes of gut microbiota and associated metabolites are closely correlated with PNS in children via probably regulating inflammatory Th17/Treg axis
Electronic supplementary material
Below is the link to the electronic supplementary material.
Acknowledgements
We would like to thank the support from Center of Research Equipment Management, General Hospital of Ningxia Medical University.
Abbreviations
- PNS
Primary Nephrotic Syndrome
- LPS
Lipopolysaccharide
- Tregs
regulatory T cells
- Th17
T helper cell 17
- ASVs
Amplicon Sequence Variants
- CKD
Chronic Kidney Disease
Author contributions
All authors have approved the final version of the manuscript prior to submission. MXL and LT are joint frst authors. MXL: methodology, data curation, formal analysis, writing–original draft, funding acquisition. WH, MJH, ZXX1: methodology, formal analysis, writing–original draft. LT, LCX, GHQ, ZDD, MJB: resources, investigation, data curation, writing–review & editing. GYM: resources, investigation, data curation. ZXX2: methodology, formal analysis, data curation, funding acquisition, writing–review & editing. LJ, LYY: formal analysis and investigation. LYW: project administration, conceptualization, supervision, writing–review & editing. MYY, LYJ, SR, WT: project administration, formal analysis, writing–review & editing. MXL and LT contributed equally to this work. (ZXX1:Xiaoxia Zhang; ZXX2: Xiaoxu Zhang).
Funding
This work was supported by the Ningxia Natural Science Foundation, China (2023AAC03550), the Ningxia Gut Homeostasis and Chronic Disease Prevention and Treatment Scientifc and Technological Innovation Team, China (Grant No.2022BSB03112), the Key Research and Development Program of Ningxia, China (Grant No. 2023BEG02011), the Scientifc Research Project on Health System in Ningxia Autonomous Region, China (2023-NWKYP-043), the Research Project of Ningxia Medical University, China (XM2022046), Program of Ningxia Science and Technology Leading Talent (2023GKLRLX17).
Data availability
Data availability statement The datasets presented in this study can be found in online repositories. Accession number(s): NCBI, PRJNA1150770.
Declarations
Ethics approval and consent to participate
This study was performed according to the principles of the Declaration of Helsinki. This study involving human participants were reviewed and approved by Institutional Ethics Board of Ningxia Medical University. (ethics approval number KYLL-2022-0595). All participants were informed of the study objectives and methods, signed the Informed Consent Form.
Consent for publication
Informed consent was obtained from all participants’ parents involved in the study.
Competing interests
The authors declare no competing interests.
Footnotes
Publisher’s note
Springer Nature remains neutral with regard to jurisdictional claims in published maps and institutional affiliations.
Xiaolong Ma and Ting Li contributed equally to this work.
Contributor Information
Xiaoxia Zhang, Email: zxx1216@163.com.
Jinhai Ma, Email: makhcn@163.com.
Hao Wang, Email: wanghaograduate@126.com.
References
- 1.Yamaguchi T, Tsuji S, Akagawa S, Akagawa Y, Kino J, Yamanouchi S et al. Clinical significance of Probiotics for children with idiopathic nephrotic syndrome. Nutrients. 2021;13(2). [DOI] [PMC free article] [PubMed]
- 2.Tsuji S, Kaneko K. The long and winding road to the etiology of idiopathic nephrotic syndrome in children: focusing on abnormalities in the gut microbiota. Pediatr Int. 2021;63(9):1011–9. [DOI] [PubMed] [Google Scholar]
- 3.Eddy AA, Symons JM. Nephrotic syndrome in childhood. Lancet. 2003;362(9384):629–39. [DOI] [PubMed] [Google Scholar]
- 4.Park SJ, Shin JI. Complications of nephrotic syndrome. Korean J Pediatr. 2011;54(8). [DOI] [PMC free article] [PubMed]
- 5.Noone DG, Iijima K, Parekh R. Idiopathic nephrotic syndrome in children. Lancet. 2018;392(10141):61–74. [DOI] [PubMed] [Google Scholar]
- 6.Zheng Y, Hou L, Wang X-L, Zhao C-G, Du Y. A review of nephrotic syndrome and atopic diseases in children. Translational Androl Urol. 2021;10(1):475–82. [DOI] [PMC free article] [PubMed] [Google Scholar]
- 7.Kim SH, Park SJ, Han KH, Kronbichler A, Saleem MA, Oh J et al. Pathogenesis of minimal change nephrotic syndrome: an immunological concept. Korean J Pediatr. 2016;59(5). [DOI] [PMC free article] [PubMed]
- 8.Li C, Wu N, Huang J, Gong Y, Wang H, Liu Y, et al. Change of circulating lymphocyte subsets is related to disease activity and secondary infection in children with primary nephrotic syndrome—a retrospective study. Translational Pediatr. 2022;11(12):1949–61. [DOI] [PMC free article] [PubMed] [Google Scholar]
- 9.Shao XS, Yang XQ, Zhao XD, Li Q, Xie YY, Wang XG, et al. The prevalence of Th17 cells and FOXP3 regulate T cells (Treg) in children with primary nephrotic syndrome. Pediatr Nephrol. 2009;24(9):1683–90. [DOI] [PubMed] [Google Scholar]
- 10.Prasad N, Yadav B, Tripathy D, Rai M, Nath M, Sharma RK et al. Regulatory and effector T cells changes in remission and resistant state of childhood nephrotic syndrome. Indian J Nephrol. 2014;24(6). [DOI] [PMC free article] [PubMed]
- 11.Tsuji S, Kimata T, Yamanouchi S, Kitao T, Kino J, Suruda C, Kaneko K. Regulatory T cells and CTLA-4 in idiopathic nephrotic syndrome. Pediatr Int. 2017;59(5):643–6. [DOI] [PubMed] [Google Scholar]
- 12.Tsuji S, Akagawa S, Akagawa Y, Yamaguchi T, Kino J, Yamanouchi S, et al. Idiopathic nephrotic syndrome in children: role of regulatory T cells and gut microbiota. Pediatr Res. 2020;89(5):1185–91. [DOI] [PubMed] [Google Scholar]
- 13.Lane JC, Kaskel FJ. Pediatric Nephrotic Syndrome: from the simple to the Complex. Semin Nephrol. 2009;29(4):389–98. [DOI] [PubMed] [Google Scholar]
- 14.Camici M. The nephrotic syndrome is an immunoinflammatory disorder. Med Hypotheses. 2007;68(4):900–5. [DOI] [PubMed] [Google Scholar]
- 15.Harrison OJ, Powrie FM. Regulatory T cells and immune tolerance in the intestine. Cold Spring Harb Perspect Biol. 2013;5(7). [DOI] [PMC free article] [PubMed]
- 16.Hooper LV, Macpherson AJ. Immune adaptations that maintain homeostasis with the intestinal microbiota. Nat Rev Immunol. 2010;10(3):159–69. [DOI] [PubMed] [Google Scholar]
- 17.Artis D. Epithelial-cell recognition of commensal bacteria and maintenance of immune homeostasis in the gut. Nat Rev Immunol. 2008;8(6):411–20. [DOI] [PubMed] [Google Scholar]
- 18.Barnes MJ, Powrie F. Regulatory T cells reinforce intestinal homeostasis. Immunity. 2009;31(3):401–11. [DOI] [PubMed] [Google Scholar]
- 19.Sonnenberg GF, Artis D. Innate lymphoid cell interactions with microbiota: implications for intestinal health and disease. Immunity. 2012;37(4):601–10. [DOI] [PMC free article] [PubMed] [Google Scholar]
- 20.Akagbosu B, Tayyebi Z, Shibu G, Paucar Iza YA, Deep D, Parisotto YF, et al. Novel antigen-presenting cell imparts T(reg)-dependent tolerance to gut microbiota. Nature. 2022;610(7933):752–60. [DOI] [PMC free article] [PubMed] [Google Scholar]
- 21.Kedmi R, Najar TA, Mesa KR, Grayson A, Kroehling L, Hao Y, et al. Publisher correction: a RORγt(+) cell instructs gut microbiota-specific T(reg) cell differentiation. Nature. 2022;610(7931):E7. [DOI] [PubMed] [Google Scholar]
- 22.Lyu M, Suzuki H, Kang L, Gaspal F, Zhou W, Goc J, et al. ILC3s select microbiota-specific regulatory T cells to establish tolerance in the gut. Nature. 2022;610(7933):744–51. [DOI] [PMC free article] [PubMed] [Google Scholar]
- 23.Maloy KJ, Powrie F. Intestinal homeostasis and its breakdown in inflammatory bowel disease. Nature. 2011;474(7351):298–306. [DOI] [PubMed] [Google Scholar]
- 24.Tsuji S, Suruda C, Hashiyada M, Kimata T, Yamanouchi S, Kitao T, et al. Gut microbiota dysbiosis in children with relapsing idiopathic nephrotic syndrome. Am J Nephrol. 2018;47(3):164–70. [DOI] [PubMed] [Google Scholar]
- 25.Kang Y, Feng D, Law HK-w, Qu W, Wu Y, Zhu G-h. Huang W-y. compositional alterations of gut microbiota in children with primary nephrotic syndrome after initial therapy. BMC Nephrol. 2019;20(1). [DOI] [PMC free article] [PubMed]
- 26.Li T, Ma X, Wang T, Tian W, Liu J, Shen W et al. Clostridium butyricum inhibits the inflammation in children with primary nephrotic syndrome by regulating Th17/Tregs balance via gut-kidney axis. BMC Microbiol. 2024;24(1). [DOI] [PMC free article] [PubMed]
- 27.Hu J, Zhong X, Yan J, Zhou D, Qin D, Xiao X, et al. High-throughput sequencing analysis of intestinal flora changes in ESRD and CKD patients. BMC Nephrol. 2020;21(1):12. [DOI] [PMC free article] [PubMed] [Google Scholar]
- 28.Schanche M, Avershina E, Dotterud C, Øien T, Storrø O, Johnsen R, Rudi K. High-resolution analyses of overlap in the Microbiota between mothers and their children. Curr Microbiol. 2015;71(2):283–90. [DOI] [PubMed] [Google Scholar]
- 29.Fouhy F, Watkins C, Hill CJ, O’Shea CA, Nagle B, Dempsey EM, et al. Perinatal factors affect the gut microbiota up to four years after birth. Nat Commun. 2019;10(1):1517. [DOI] [PMC free article] [PubMed] [Google Scholar]
- 30.Hollister EB, Riehle K, Luna RA, Weidler EM, Rubio-Gonzales M, Mistretta TA, et al. Structure and function of the healthy pre-adolescent pediatric gut microbiome. Microbiome. 2015;3:36. [DOI] [PMC free article] [PubMed] [Google Scholar]
- 31.Agans R, Rigsbee L, Kenche H, Michail S, Khamis HJ, Paliy O. Distal gut microbiota of adolescent children is different from that of adults. FEMS Microbiol Ecol. 2011;77(2):404–12. [DOI] [PMC free article] [PubMed] [Google Scholar]
- 32.Azad MB, Konya T, Maughan H, Guttman DS, Field CJ, Chari RS, et al. Gut microbiota of healthy Canadian infants: profiles by mode of delivery and infant diet at 4 months. CMAJ. 2013;185(5):385–94. [DOI] [PMC free article] [PubMed] [Google Scholar]
- 33.Lee SA, Lim JY, Kim BS, Cho SJ, Kim NY, Kim OB, Kim Y. Comparison of the gut microbiota profile in breast-fed and formula-fed Korean infants using pyrosequencing. Nutr Res Pract. 2015;9(3):242–8. [DOI] [PMC free article] [PubMed] [Google Scholar]
- 34.Li HB, Xu ML, Xu XD, Tang YY, Jiang HL, Li L, et al. Faecalibacterium prausnitzii attenuates CKD via Butyrate-Renal GPR43 Axis. Circ Res. 2022;131(9):e120–34. [DOI] [PMC free article] [PubMed] [Google Scholar]
- 35.Zhou L, Zhang M, Wang Y, Dorfman RG, Liu H, Yu T, et al. Faecalibacterium prausnitzii produces butyrate to maintain Th17/Treg Balance and to ameliorate colorectal colitis by inhibiting histone deacetylase 1. Inflamm Bowel Dis. 2018;24(9):1926–40. [DOI] [PubMed] [Google Scholar]
- 36.Zhang M, Zhou L, Wang Y, Dorfman RG, Tang D, Xu L, et al. Faecalibacterium prausnitzii produces butyrate to decrease c-Myc-related metabolism and Th17 differentiation by inhibiting histone deacetylase 3. Int Immunol. 2019;31(8):499–514. [DOI] [PubMed] [Google Scholar]
- 37.He H, Lin M, You L, Chen T, Liang Z, Li D, et al. Gut Microbiota Profile in Adult patients with idiopathic nephrotic syndrome. Biomed Res Int. 2021;2021:8854969. [DOI] [PMC free article] [PubMed] [Google Scholar]
- 38.Wang C, Qu W, Chen Q, Huang WY, Kang Y, Shen J. Primary nephrotic syndrome relapse within 1 year after glucocorticoid therapy in children is associated with gut microbiota composition at syndrome onset. Nephrol Dial Transpl. 2023;38(9):1969–80. [DOI] [PubMed] [Google Scholar]
- 39.Burcelin R, Garidou L, Pomié C. Immuno-Microbiota cross and talk: the new paradigm of metabolic diseases. Semin Immunol. 2012;24(1):67–74. [DOI] [PubMed] [Google Scholar]
- 40.Wang L, Li Q, Wang L, Li C, Yang H, Wang X, Tao H. The role of Th17/IL-17 in the pathogenesis of primary nephrotic syndrome in children. Kidney Blood Press Res. 2013;37(4–5):332–45. [DOI] [PubMed] [Google Scholar]
- 41.Chen Z, Wang M, Yang S, Shi J, Ji T, Ding W et al. Butyric acid protects against renal ischemia–reperfusion Injury by adjusting the Treg/Th17 balance via HO-1/p-STAT3 signaling. Front Cell Dev Biology. 2021;9. [DOI] [PMC free article] [PubMed]
- 42.Furusawa Y, Obata Y, Fukuda S, Endo TA, Nakato G, Takahashi D, et al. Commensal microbe-derived butyrate induces the differentiation of colonic regulatory T cells. Nature. 2013;504(7480):446–50. [DOI] [PubMed] [Google Scholar]
- 43.Holeček M. Histidine in Health and Disease: metabolism, physiological importance, and use as a supplement. Nutrients. 2020;12(3). [DOI] [PMC free article] [PubMed]
- 44.Tan Y, Wang L, Gao J, Ma J, Yu H, Zhang Y, et al. Multiomics Integrative Analysis for discovering the potential mechanism of Dioscin against Hyperuricemia mice. J Proteome Res. 2021;20(1):645–60. [DOI] [PubMed] [Google Scholar]
- 45.Li L, Li J, Cao H, Wang Q, Zhou Z, Zhao H, Kuang H. Determination of metabolic phenotype and potential biomarkers in the liver of heroin addicted mice with hepatotoxicity. Life Sci. 2021;287:120103. [DOI] [PubMed] [Google Scholar]
- 46.Nigam SK, Bush KT. Uraemic syndrome of chronic kidney disease: altered remote sensing and signalling. Nat Rev Nephrol. 2019;15(5):301–16. [DOI] [PMC free article] [PubMed] [Google Scholar]
- 47.Marzocco S, Fazeli G, Di Micco L, Autore G, Adesso S, Dal Piaz F, et al. Supplementation of short-chain fatty acid, Sodium Propionate, in patients on maintenance hemodialysis: Beneficial effects on inflammatory parameters and gut-derived uremic toxins, a pilot study (PLAN study). J Clin Med. 2018;7(10):315. [DOI] [PMC free article] [PubMed] [Google Scholar]
- 48.Mikami D, Kobayashi M, Uwada J, Yazawa T, Kamiyama K, Nishimori K, et al. Short-chain fatty acid mitigates adenine-induced chronic kidney disease via FFA2 and FFA3 pathways. Biochim Biophys Acta Mol Cell Biol Lipids. 2020;1865(6):158666. [DOI] [PubMed] [Google Scholar]
Associated Data
This section collects any data citations, data availability statements, or supplementary materials included in this article.
Supplementary Materials
Data Availability Statement
Data availability statement The datasets presented in this study can be found in online repositories. Accession number(s): NCBI, PRJNA1150770.


