

Abstract
The association of gut microbial features with type 2 diabetes (T2D) has been inconsistent due in part to the complexity of this disease and variation in study design. Even in cases where individual microbial species have been associated with T2D, almost no cases have attributed mechanisms to these associations based on specific microbial strains. We conducted a comprehensive study of the T2D microbiome, analyzing 8,117 shotgun metagenomes from ten cohorts of individuals with T2D, prediabetes, and normoglycemic status in the US, Europe, Israel, and China. Dysbiosis in 19 phylogenetically diverse species was associated with T2D (false discovery rate <0.10), e.g., enriched Clostridium bolteae and depleted Butyrivibrio crossotus. These microorganisms also contributed to community-level functional changes potentially underlying T2D pathogenesis, e.g., perturbations in glucose metabolism. Our study revealed within-species phylogenetic diversity for strains of 27 species that explained inter-individual differences in T2D risk, such as Eubacterium rectale. In some cases, these were explained by strain-specific gene carriage, including loci involved in various mechanisms of horizontal gene transfer and novel biological processes underlying metabolic risk, e.g., quorum sensing. In summary, our study provides robust cross-cohort microbial signatures in a strain-resolved manner and offers new mechanistic insights into T2D.
Introduction
Type 2 diabetes (T2D) affects approximately 537 million individuals globally1. It is characterized by a gradual decline in β-cell mass and function, often accompanied by low-grade systemic inflammation and insulin resistance2. In the last two decades, the gut microbiome has been increasingly recognized as a metabolically active “organ” situated at the crossroads of host genetics and environmental factors3. While human studies have identified diverse microbial signatures of T2D4–11, the existing findings are mostly inconsistent, partly due to small study populations and variations in design and analytic approaches across different studies. In addition, early studies failed to adjust adequately for major risk factors of T2D and confounders, such as metformin use and adiposity, limiting the validity of the observed associations while contributing to the variation4. Therefore, studies in a large population that standardized data processing and analysis are needed to elucidate the potential mechanisms by which gut microbes and their corresponding molecular activities contribute to the pathology of T2D.
Previous studies have linked the microbial community structure and specific species to metabolic risk factors12,13 and T2D4–11. However, pathogenic mechanisms are potentially strain-specific, meaning that specific microbial strains are causally linked to disease outcomes or that microbial functional processes responsible for host disease development are carried out by a subset of strains within a microbial species. A classic example of radically different microbial physiology among closely related strains is Escherichia coli, which includes strains ranging from benign (e.g., strain K12) to pathogenic (e.g., enterohemorrhagic E. coli O157:H7) to probiotic (e.g., strain Nissle 1917)14. Understanding strain-specific mechanisms is particularly important for T2D, a condition with a strong dietary and inflammatory basis, as the host diet and immune system are crucial selective pressure factors in shaping within-species variation in the gut microbes15. However, a high unmet need exists for a comprehensive survey of subspecific microbial features and strain-specific functions in T2D to gain in-depth mechanistic insights.
Here, we present a meta-analysis of 8,117 metagenomes from ten cohorts that included individuals with T2D, prediabetes, and normoglycemic status in the US, Europe, Israel, and China from our newly established Microbiome and Cardiometabolic Disease Consortium (MicroCardio). We first conducted uniform bioinformatic reprocessing and batch effect correction of raw metagenomic sequencing data and harmonized the diagnoses of diabetes and prediabetes endpoints across the different cohorts. Next, we identified specific gut microbial species and functions, i.e., the enzymes and pathways encoded by microbes, that were differentially abundant between cases and controls [false discovery rate (FDR)<0.10]. Finally, to gain deeper insights into the implications of within-species phylogenetic diversity and strain-specific carriage of functional genes in T2D, we applied a series of strain-resolved analysis methods. Our study, adopting a function-focused and strain-resolved approach, represents the most comprehensive investigation of T2D microbiome to date in an ethnically and geographically diverse population.
Results
Data harmonization in a global population
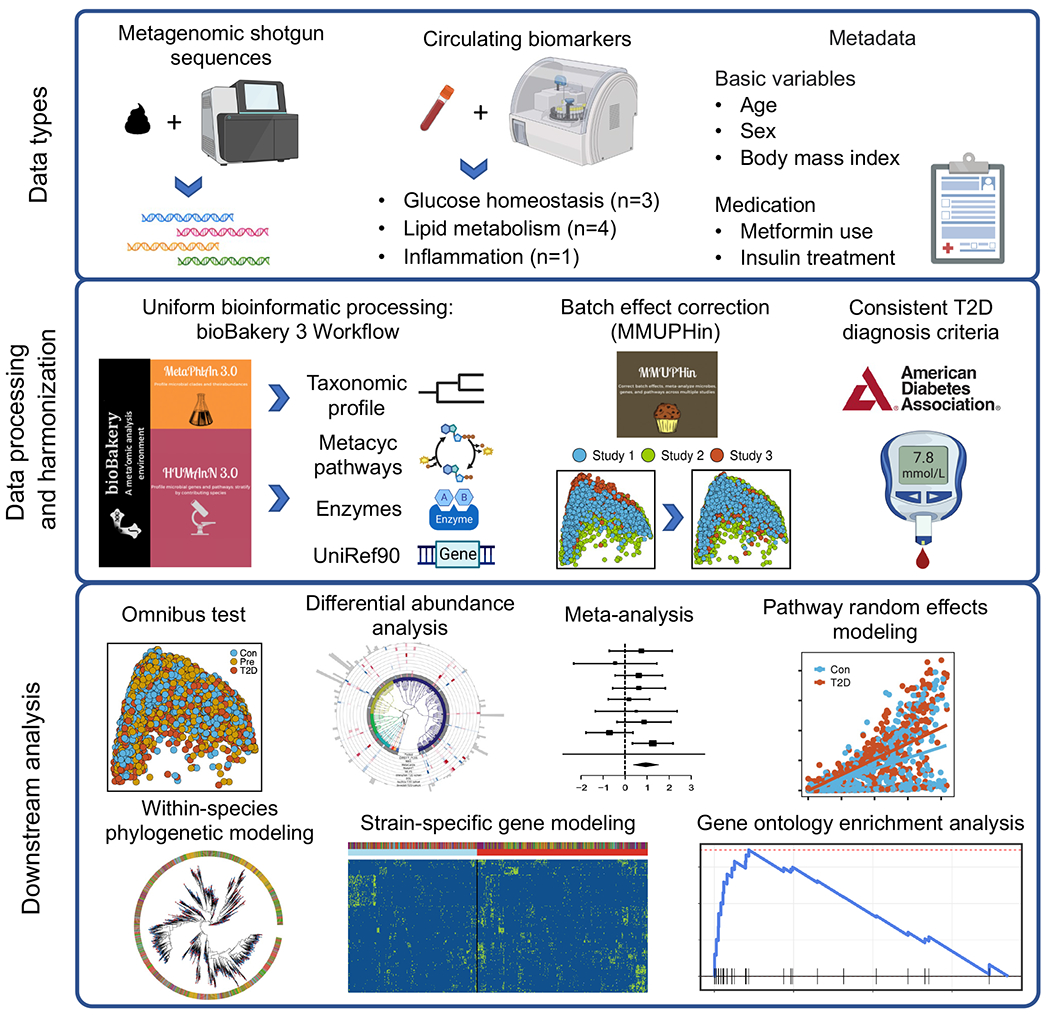
We uniformly processed sequence and phenotypic data from ten cohorts in the US, Israel, Sweden, Finland, Denmark, Germany, France, and China, including four databases generated de novo and six published datasets5,6,10,11,16 (Fig. 1a, Extended Data Fig. 1 and Supplementary Table 1). Our final dataset consisted of 8,117 metagenomes from 1,851 T2D patients, 2,770 participants with prediabetes, and 2,277 normoglycemic participants (two cohorts included repeated microbiome sampling, see Methods), including both females and males (females: 54.4%) with wide ranges in age [mean= 57.9 years; standard deviation (SD)= 10.7 years] and body mass index (BMI, mean= 28.6 kg/m2; SD= 5.8 kg/m2, Fig. 1a, Extended Data Fig. 1, and Supplementary Table 1). We harmonized the case-control status using the diagnosis criteria of the American Diabetes Association2 based on fasting plasma glucose, 2-hour oral glucose tolerance tests, hemoglobin A1C, and medication uses (Methods), major risk factors of T2D, e.g., BMI, and metabolic and inflammatory laboratory tests in blood samples, e.g., high-sensitivity C-reactive protein (hs-CRP), across cohorts. Using the bioBakery 3.0 workflows17, we generated taxonomic and functional profiles (biochemical pathways and enzymes) based on sequencing data. Among the identified microbial species, 30.9% were present in all the included cohorts (“universal species”), 52.9% existed in two to nine cohorts (“overlapping species”), and 16.2% were unique to one specific cohort (“singular species,” Fig. 1b). As anticipated, the majority of variation in the gut microbiome was driven by a tradeoff between Bacteroidetes versus Firmicutes phyla (Fig. 1c). More details of population distributions of microbial features are in Supplementary Text. We applied the MMUPHin workflow18, which reduced the variance explained by batch effects, as quantified by permutational multivariate analysis of variance (PERMANOVA), from 8.4% to 4.0% while retaining biologically meaningful inter-individual variation (Extended Data Fig. 2). Furthermore, we took a conservative meta-analysis approach, i.e., to conduct separate analyses within each cohort and pool the summary statistics across all cohorts, in the downstream analyses to further adjust for potential batch effects.
Fig 1: Overview of microbial community structure as associated with type 2 diabetes.
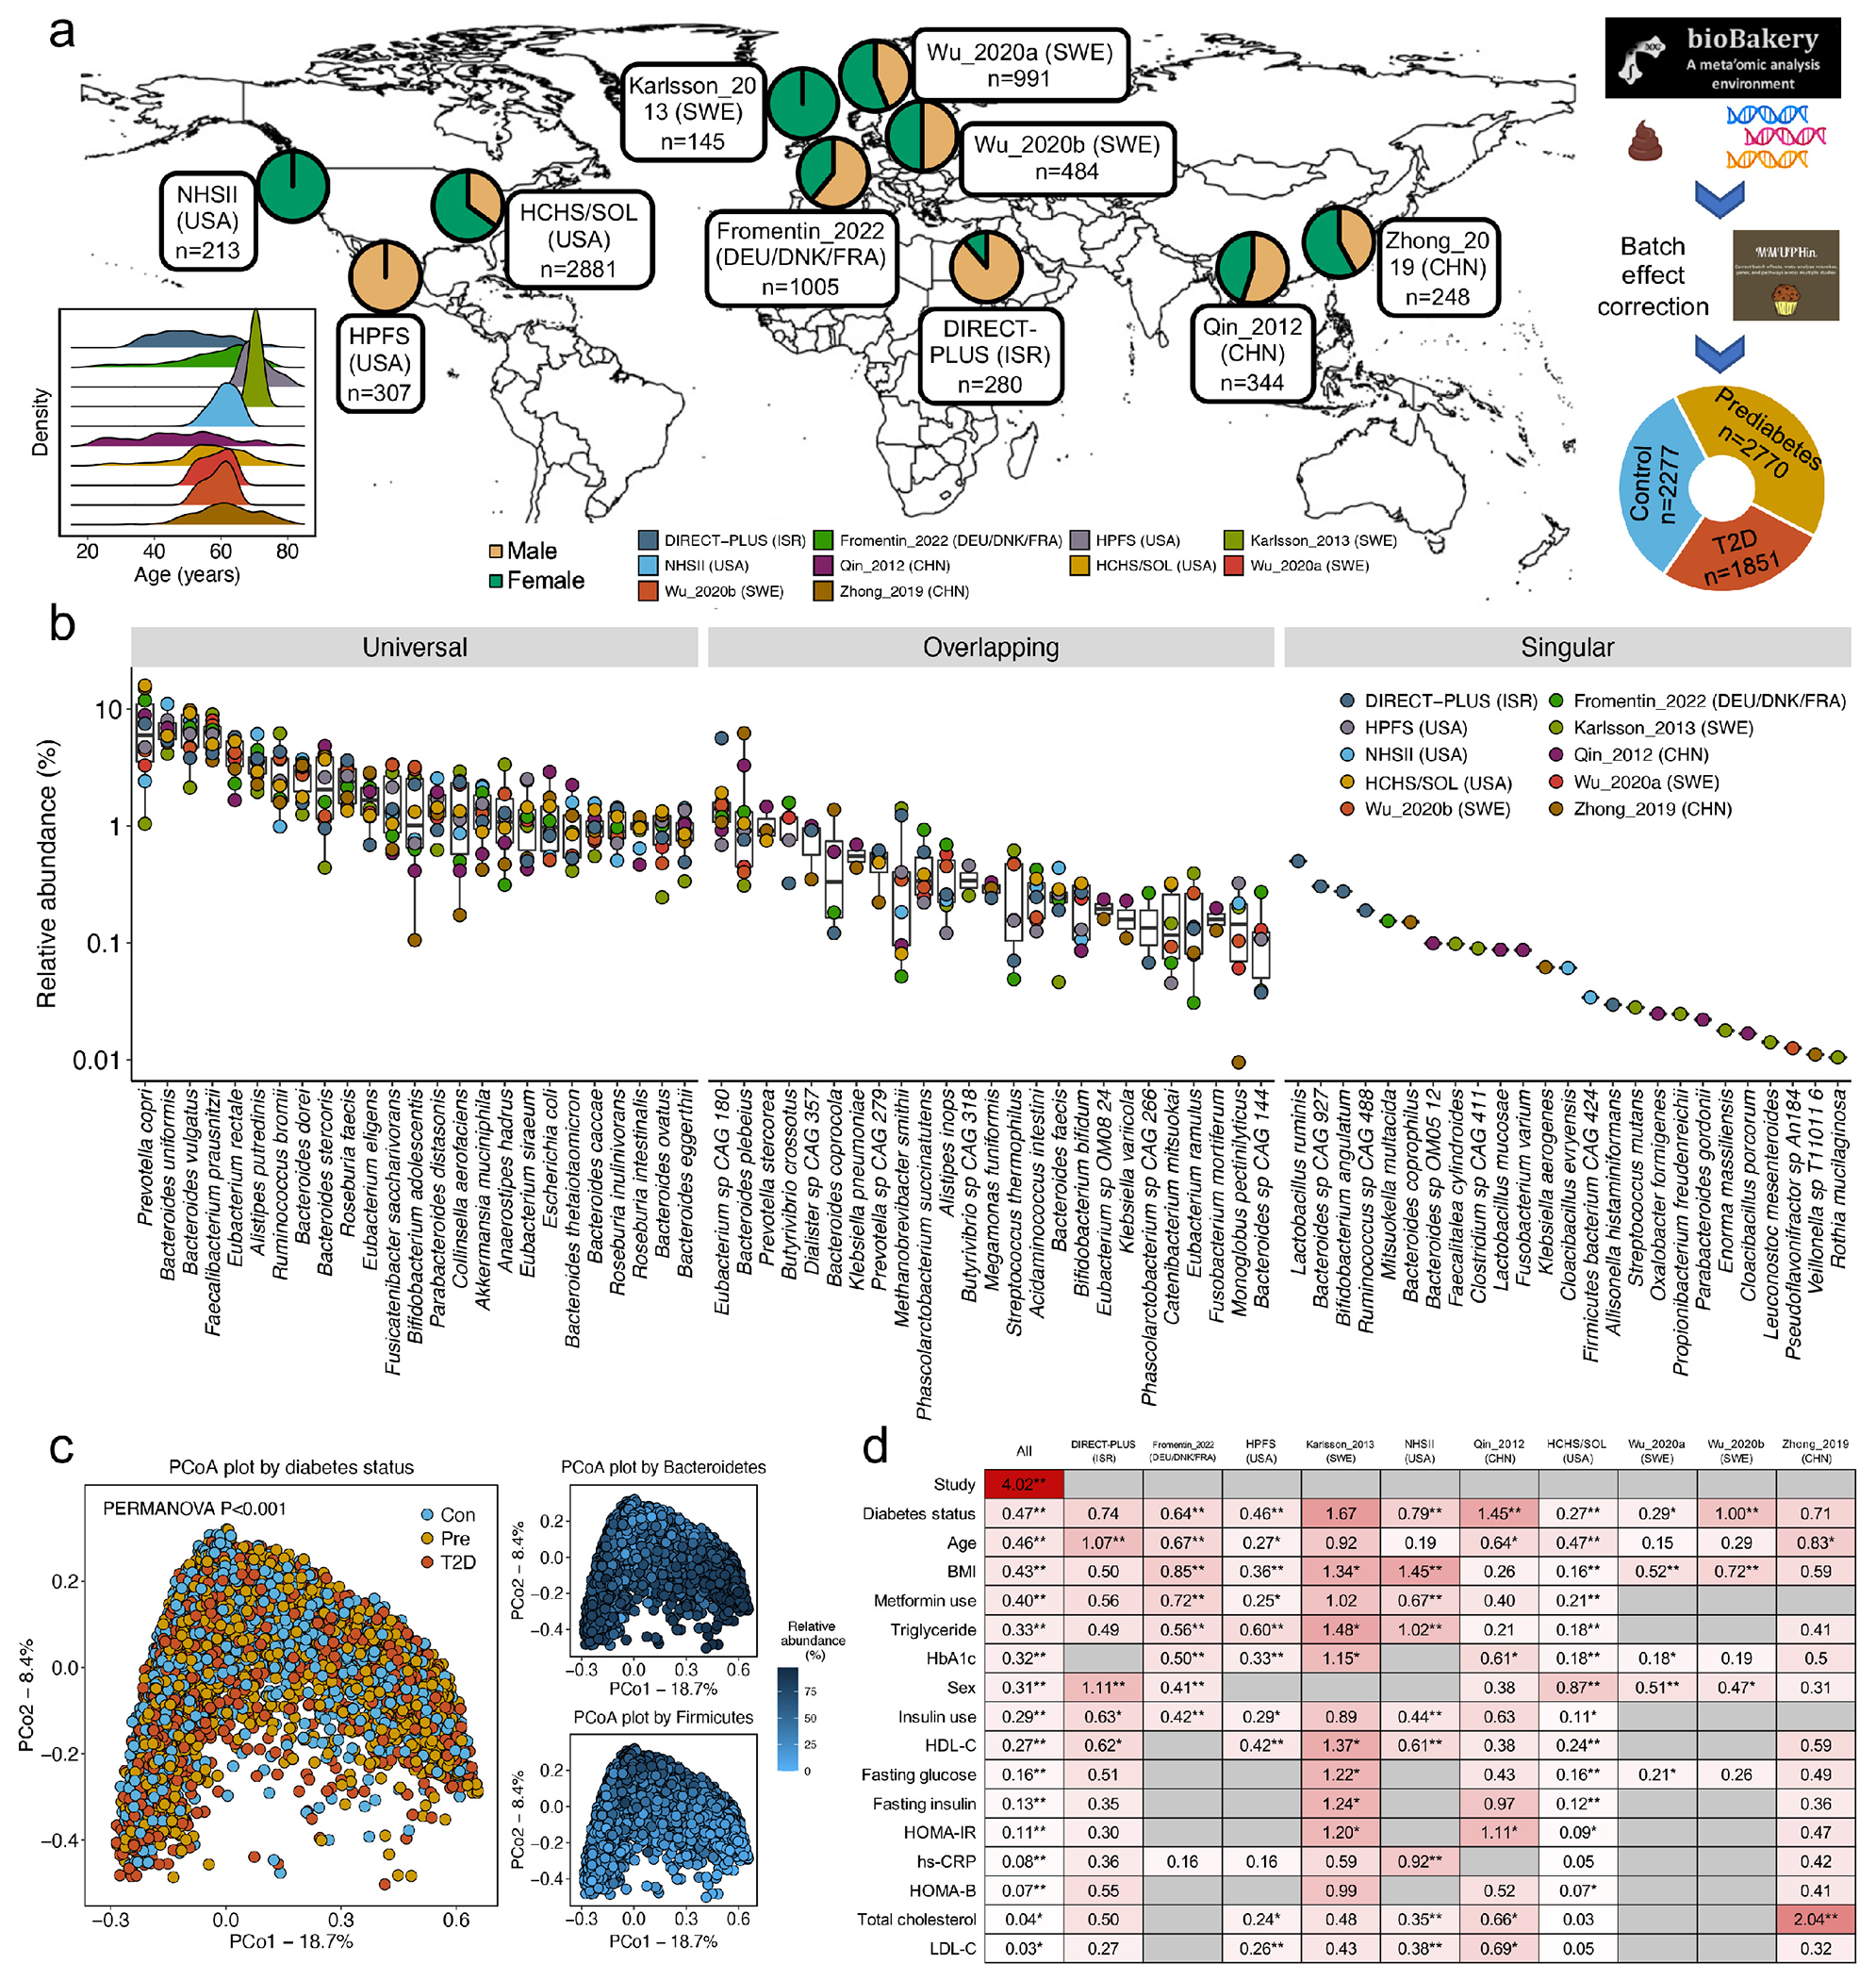
(a) To study the gut microbiome in type 2 diabetes (T2D), we assembled a shotgun metagenomic dataset from ten cohorts spanning eight countries. The dataset comprised 8,117 metagenomes from 1,851 T2D patients, 2,770 individuals with prediabetes, and 2,277 normoglycemic controls from our newly established Microbiome and Cardiometabolic Disease Consortium (MicroCardio). The study population included females and males (females: 54.4%) spanning a wide range of ages (mean =57.9 years) and body mass index (mean =28.6 kg/m2), and diverse racial/ethnic subgroups such as Asians, Whites, and Latin American-born US Hispanic immigrants. We applied the bioBakery 3.0 workflows17 to process sequencing data for uniform taxonomic and functional profiling and the MMUPHin framework18 to correct batch effects. This panel was created with BioRender.com. (b) Mean relative abundance for top 25 universal (present in all ten cohorts), overlapping (present in at least two cohorts), and singular (found in only one cohort) species by cohort. The centers of the boxplot show medians with boxes indicating their interquartile ranges (IQRs) and upper and lower whiskers indicating 1.5 times the IQR from above the upper quartile and below the lower quartile, respectively. (c) Principal coordinate analysis (PCoA) revealed a significant association between the configuration of the microbiome and T2D and an expected trade-off between Bacteroidetes and Firmicutes phyla. PCoA was based on species-level Bray-Curtis dissimilarity. (d) Proportions of variation in taxonomy explained by the study effects, T2D status, covariables, and circulating biomarkers as quantified by permutational multivariate analysis of variance (PERMANOVA with 999 permutations) based on species-level Bray-Curtis dissimilarity. Data on metformin use were unavailable in the three studies (Wu_2020a, Wu_2020b, and Zhong_2019) because they only enrolled newly-diagnosed, treatment-naïve participants with T2D and prediabetes. All the statistical tests were two-sided. An asterisk sign indicates P <0.05, and two asterisk signs indicate P <0.01. Abbreviations: BMI, body mass index; Con, control; HbA1c, hemoglobin A1c; HDL-C, high-density lipoprotein cholesterol; hs-CRP, high-sensitivity C-reactive protein; HOMA-B, homeostasis model assessment of β-cell function; HOMA-IR, homeostasis model assessment of insulin resistance; LDL-C, low-density lipoprotein cholesterol; Pre, prediabetes; T2D, type 2 diabetes.
Microbial configuration and species and type 2 diabetes
We first assessed the association between the overall microbiome configuration and T2D status. Although case-control status was not a major driver of overall structural variation of the microbiome (Fig. 1c), PERMANOVA revealed that its association was significant with respect to taxonomy [percentage of variance explained (R2) =0.47%; P <0.001], biochemical pathways (R2 =0.47%; P <0.001), and enzymatic profiles (R2 =0.30%; P <0.001). In addition, T2D status accounted for the largest proportion of variation in the microbiome composition (0.47%) among T2D status, covariables, and circulating biomarkers (Fig. 1d, Details of PERMANOVA results are in Supplementary Text).
To identify harmonized species-level signatures, we employed regression models in MaAsLin219 to identify microbial features with different distributions across T2D status in each cohort and pooled the effect estimates from the models across cohorts using meta-analysis18,20 (Methods). Our primary model classified case-control status as T2D, prediabetes, or normoglycemic controls ordinally (Extended Data Fig. 3a). Secondarily, we modeled the case-control status as a binary variable (T2D or normoglycemic controls) in a subpopulation that excluded individuals with prediabetes (Extended Data Fig. 3b). Our meta-analysis identified 19 phylogenetically diverse species significantly associated with T2D (FDR <0.10), independent of age, sex, BMI, and metformin use, after correcting for multiple hypothesis testing (which we refer to as “biomarker species,” Fig. 2a and 2b). Among the 19 biomarker species, five were associated with T2D, and 14 were associated with both prediabetes and T2D. We included meta-analyzed and cohort-specific results for all microbial species analyzed in Supplementary Tables 2 and 3. Of note, 14 of these species were identified by our study, as compared with previous metagenomic studies of T2D, while five species were reported previously, including three T2D-enriched species, Clostridium citroniae21, Clostridium bolteae4,6,10,21 and Escherichia coli6, and two T2D-depleted species, Coprococcus eutactus10 and Turicibacter sanguinis11. Most biomarker species demonstrated a consistent upward or downward trend in their abundance across normoglycemic controls, individuals with prediabetes, and T2D patients (Fig. 2c), as indicated by their significant slopes from the ordinal models (Fig. 2a).
Fig. 2: Cross-cohort microbial signatures of type 2 diabetes.
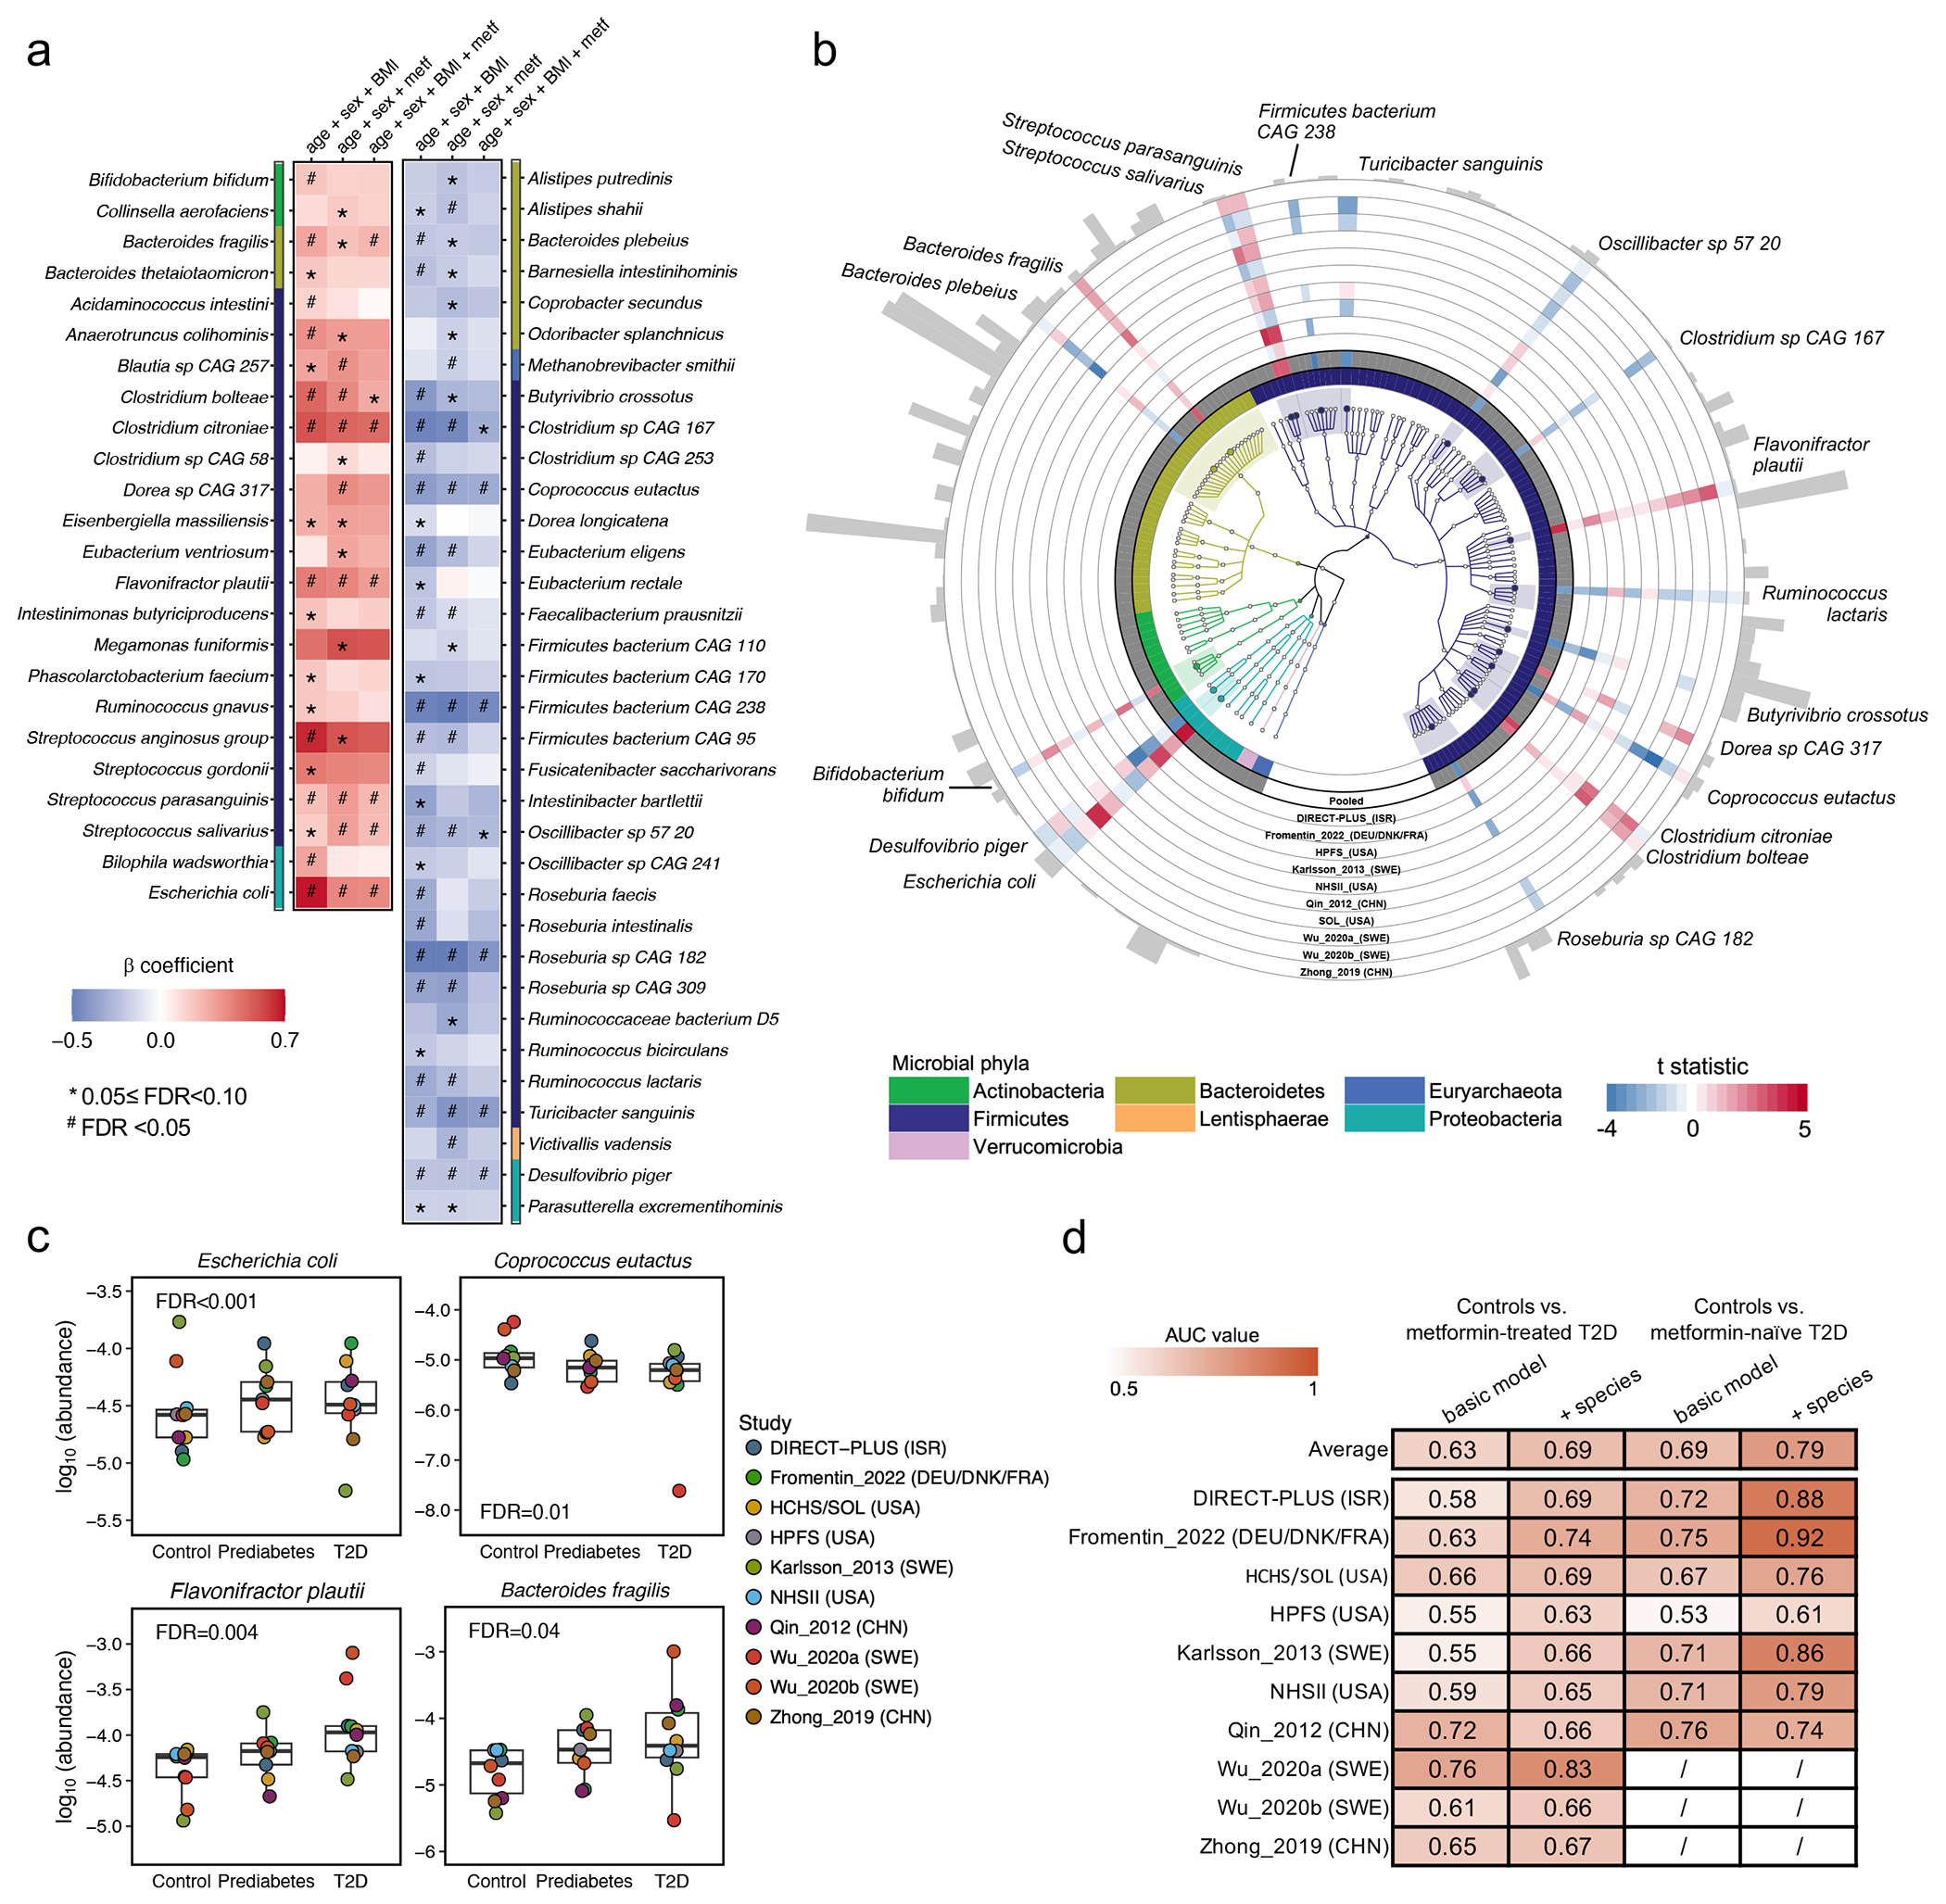
(a) Meta-analyzed associations of microbial species with type 2 diabetes (T2D) based on 8,117 metagenomes from 1,851 T2D patients, 2,770 individuals with prediabetes, and 2,277 normoglycemic controls. The blue-to-red gradient represents the magnitude and direction of the associations quantified by linear mixed models that include disease status as an ordinal variable (normoglycemic controls, prediabetes, or T2D) and adjust for age, sex, body mass index (BMI), and metformin use (metf). For multiple comparison correction, we controlled the false discovery rate (FDR) with a target rate of 0.10. Asterisk signs indicate 0.05 ≤ FDR <0.10, and octothorpe signs indicate FDR <0.05. (b) Phylogenetically diverse microbial species significantly associated with T2D. The blue-to-red gradient represents the associations between microbial species and T2D phenotype. The colors of the innermost ring and phylogenetic trees differentiate major phyla. The heights of the outermost bars are in proportion to the mean relative abundance of microbial species. We presented significant results from both the ordinal and binary models adjusting for the aforementioned covariables (FDR <0.10, Methods). (c) Select dose-response associations between microbial species and T2D status. The centers of the boxplots show medians of cohort-specific mean relative abundance with boxes indicating their inter-quartile ranges (IQRs) and upper and lower whiskers indicating 1.5 times the IQR from above the upper quartile and below the lower quartile, respectively. The statistical models, the approach for multiple comparison correction, and the sample size were the same as those in (a). All the statistical tests in (a), (b), and (c) were two-sided. (d) The inclusion of microbial species improved the performance of random forest models in classifying metformin-treated or -naïve T2D vs. controls. The values are the area under the receiver operating characteristic curve (AUC) obtained by applying the model trained on all but the cohort of the corresponding row and validated in the cohort of that row. The basic model included age, sex, and BMI, while the other further included microbial species. The AUC values in metformin users are unavailable in Wu_2020a, Wu_2020b, and Zhong_2019 because they only enrolled treatment-naïve participants.
We identified two Streptococcus spp., common residents of the oral cavity, enriched in individuals with T2D, suggesting a potential translocation of oral microbes to the gut, indicative of a pro-inflammatory state22,23. In addition, we found that Bacteroides fragilis, a species that produces immunogenic fragilysin24, was enriched in T2D cases. In contrast, another Bacteroides species, Bacteroides plebeius, was depleted mainly in non-white T2D patients. This is consistent with the recent revelation of B. plebeius’s phenotypic difference from other Bacteroides spp. and its subsequent reassignment to the Phocaeicola genus25. Additional T2D-depleted species included butyrate-producing bacteria and primary degraders of plant-derived polysaccharides, such as Oscillibacter sp. 57_20, C. eutactus, Ruminococcus lactaris, and Butyrivibrio crossotus. We found an increased abundance of T. sanguinis in normoglycemic controls, corroborating previous reports of its link with low metabolic risk mediated through modifying host bile acid and lipid metabolisms26,27.
Next, we determined the extent to which the inclusion of microbial species improved the classification of T2D status using the random forest (RF) model and tested models by a leave-one-data-set-out procedure28. In the RF models classifying metformin-naïve T2D vs. normoglycemic controls, we found a moderate improvement in the areas under the curve (AUCs) from the basic model that included age, sex, and BMI (average AUC =0.63) to the model that additionally included microbial species (average AUC =0.69, Fig. 2d). The models classifying metformin-treated T2D vs. controls yielded an average AUC of 0.69 in the basic model and an average AUC of 0.79 in the model that further included microbial species.
We confirmed that metformin use strongly confounded the association between microbes and T2D4,29,30 in this international population, while further adjustments for insulin use and BMI only modestly altered the strength of the associations (Extended Data Fig. 3a–d). We found different microbial compositions between metformin-treated vs. -naïve T2D patients (PERMANOVA P <0.001, Extended Data Fig. 4a) and attenuated associations for many microbial species after further adjustment for metformin use (Fig. 2a). In a subsequent analysis, we identified 10 microbial signatures of metformin, i.e., those associated with metformin use in T2D cases only (Extended Data Fig. 4b). We confirmed that our modeling approach effectively addressed the confounding by metformin use by demonstrating a high correlation (Spearman correlation coefficient =0.95; Extended Data Fig. 4c) between the beta coefficients of species-T2D associations from the primary analysis and those calculated from a sensitivity analysis excluding metformin-treated T2D patients.
To address the concern that the identified microbial signatures may have partially captured long-term diabetic status and its comorbidities, we undertook two sensitivity analyses, including a prospective analysis that leveraged incident T2D cases in the Hispanic Community Health Study / Study of Latinos (HCHS/SOL) and an analysis on insulin-naïve T2D cases. Both sensitivity analyses yielded associations that were largely consistent with those from the primary analyses (Extended Data Fig. 5; details of the sensitivity analyses are in Supplementary Text). Furthermore, we observed a significant dose-response of the abundance of the microbial signature across normoglycemic controls, prediabetes, and T2D (Fig. 2a), adding further weight to the evidence for the microbial biomarkers of T2D. Collectively, these analyses suggested that the identified microbial features were unlikely to reflect the long duration of T2D or its comorbidities.
Community-level microbial functions and type 2 diabetes
We next investigated whether community-level microbial functional features, including biochemical pathways31 and enzymes, were associated with T2D (FDR <0.10). We included meta-analyzed and cohort-specific results for all functional features analyzed in Supplementary Tables 4 and 5. The most prominent finding was community-level microbial functions indicating glucose dysregulation, manifested by intertwined relationships among insulin resistance, glycolysis, and glucose uptake, in T2D patients (Fig. 3a–c). We observed higher abundance of functions involved in bacterial cellular metabolism favoring glycolysis in T2D patients, e.g., glycolysis (from glucose 6-phosphate) pathway (GLYCOLYSIS-PWY), and their constituent enzymes, e.g., glyceraldehyde-3-phosphate dehydrogenase (EC 1.2.1.12). In addition, we found an enrichment of the super-pathway of methylglyoxal degradation (METHGLYUT-PWY) and its constituent enzymes in T2D patients, suggesting a higher demand for detoxifying methylglyoxal, a by-product of upregulated glycolysis. Furthermore, genes encoding pitrilysin, an enzyme with insulin-degrading capability32, had a high abundance in T2D patients (Supplementary Table 5). Lastly, the functions for the biosynthesis of saturated fatty acids that potentially contribute to insulin resistance33, e.g., pathways of fatty acid elongation-saturated (FASYN-ELONG-PWY) and palmitate biosynthesis II (PWY-5971) and long-chain-fatty-acid—CoA ligase (EC 6.2.1.3), were found to be enriched in T2D patients. Consistent with a previous report9, the microbial functions involved in glucose homeostasis were dominantly encoded by E. coli and a group of Bacteroides spp.
Fig. 3: Diverse microbial processes involved in the pathogenesis of type 2 diabetes.
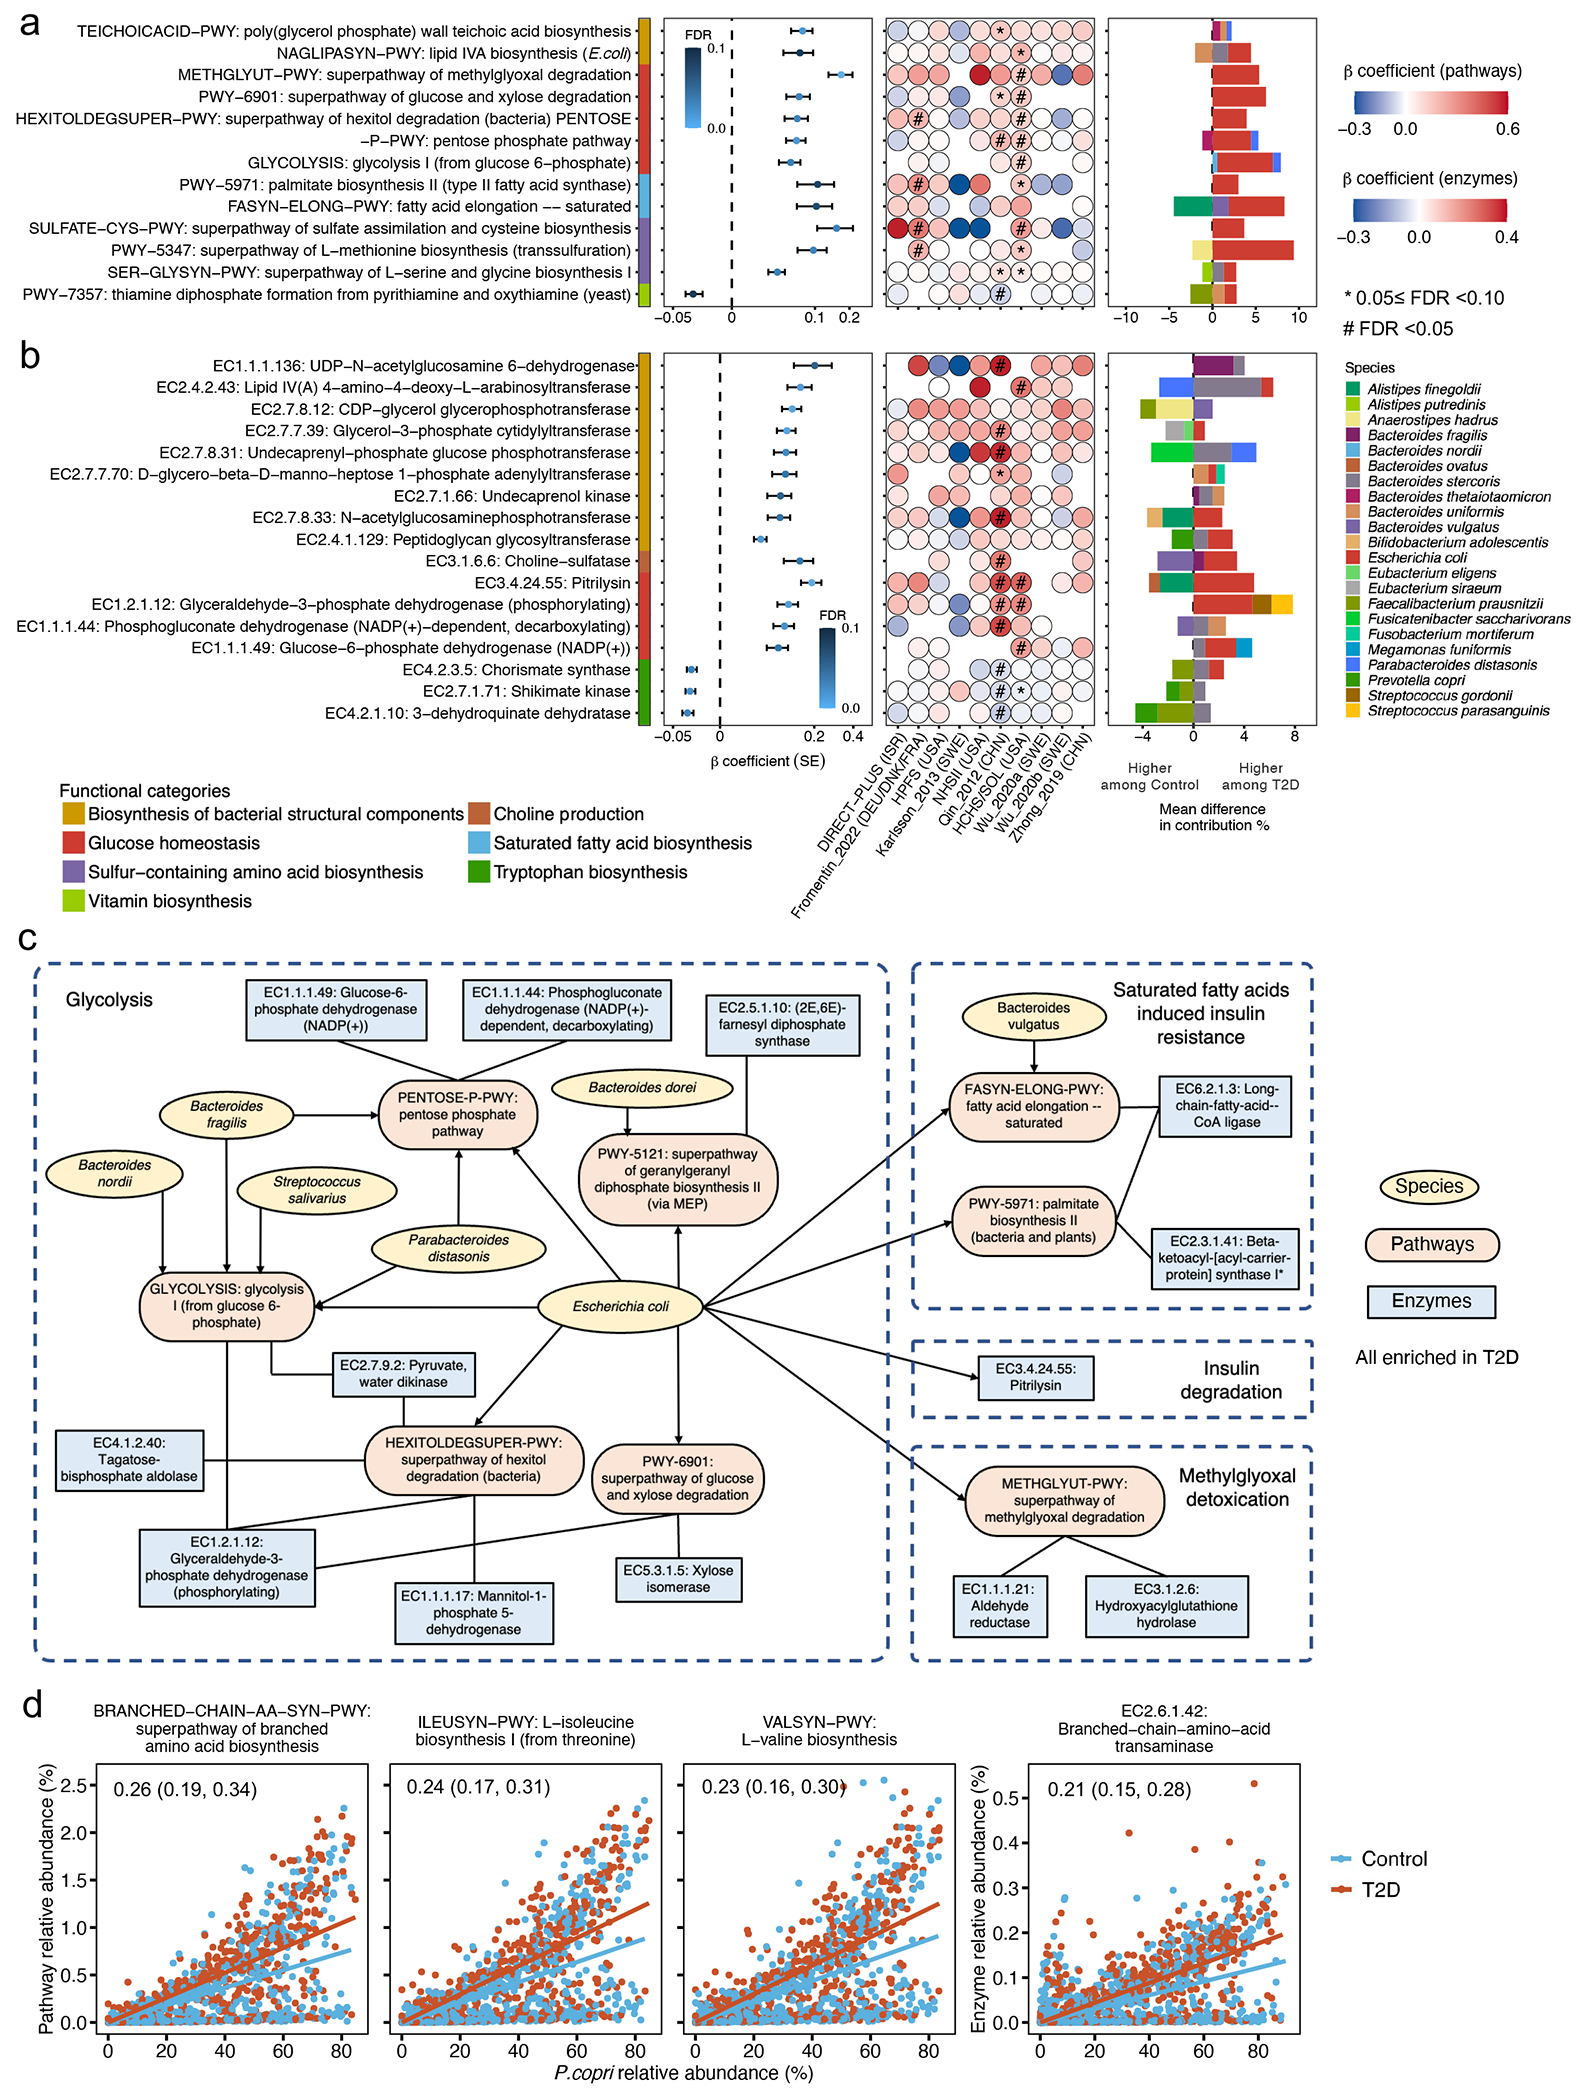
Meta-analyzed associations comparing diabetes versus normoglycemic controls of (a) microbial functions (as MetaCyc pathways) and (b) enzymes (as Enzyme Commission numbers) involved in glucose homeostasis, sulfur metabolism, and the biosynthesis of bacterial structural components, B vitamins, and essential amino acids with type 2 diabetes (T2D). A total of 8,117 metagenomes from 1,851 T2D patients, 2,770 individuals with prediabetes, and 2,277 normoglycemic controls were included in the analyses. Beta coefficients were derived from multivariable-adjusted linear mixed models (Methods) that included the T2D status as the independent variable and the microbial pathway or enzyme abundance as the dependent variable. Missing circles indicate features not measured in that cohort. All the results were corrected for multiple hypothesis testing by controlling the false discovery rate (FDR) using the Benjamini-Hochberg method with a target rate of 0.10. Asterisk signs indicate 0.05 ≤ FDR <0.10, and octothorpe signs indicate FDR <0.05. (c) A network of microbial features depicts intertwined relationships among insulin resistance, glycolysis, and glucose uptake in T2D. The network included curated MetaCyc pathways and enzymes significantly associated with T2D (FDR <0.10) and the species that encoded these microbial functions. (d) Prevotella copri strains in T2D patients are more likely to carry pathways and enzymes for branched-chain amino acid biosynthesis. The blue and red lines, fitted by linear regression in participants with T2D and control participants separately, represent the associations between the relative abundance of P. copri and the relative abundance of a given pathway or enzyme encoded by P. copri. The numeric values in the top left corner are posterior differences and 98% posterior intervals of differences in log-transformed pathway abundance between case-control status, as determined by mixed effects models in Anpan (ANalysis of microbial Phylogenies And geNes, see Methods). This model allows us to identify microbial functions encoded by P. copri that are differentially abundant between T2D cases vs. controls while controlling for its species-level abundance and covariables.
Our other major findings included upregulated biosynthesis of immunomodulatory bacterial structural components in T2D patients. We found that two pathways upstream to the productions of highly pro-inflammatory lipopolysaccharides (LPS) and teichoic acids (TAs), namely lipid IVA biosynthesis (NAGLIPASYN-PWY) and poly (glycerol phosphate) wall teichoic acid biosynthesis (TEICHOICACID-PWY), were enriched in T2D patients. This was also true for individual enzymes involved in the biosynthesis of LPS and TAs, such as peptidoglycan glycosyltransferase (EC 2.4.1.129) and lipid IVA 4-amino-4-deoxy-L-arabinosyltransferase (EC 2.4.2.43, Fig. 3b). Positive associations between the abundance of enzymes participating in the LPS precursor biosynthesis, including N-acetylglucosaminephosphotransferase (EC 2.7.8.33) and Lipid IVA 4-amino-4-deoxy-L-arabinosyltransferase (EC 2.4.2.43), and circulating hs-CRP levels, further supported their immunogenicity (Extended Data Fig. 6b and Supplementary Table 7). Corroborating with a previous report that membrane components of Bacteroides were particularly immunogenic34, a diverse group of Bacteroides spp. encoded these pathways and enzymes.
Subclades of Prevotella copri and type 2 diabetes
Previous studies from our group and others linked P. copri to metabolic risk13,35,36 and postulated that the disease-causing potential of P. copri was subclade-dependent and population-specific37–39. We, therefore, sought to determine whether the association between P. copri and T2D varied across its subclades with different functional potentials. We first applied the pathway-specific random effects model in Anpan (ANalysis of microbial Phylogenies And geNes, see Methods) to identify functions encoded by P. copri that were differentially abundant between T2D patients vs. controls while controlling for its species-level abundance. We found that P. copri in T2D patients was more likely to carry biosynthetic functions of branched-chain amino acids (BCAAs), a group of diabetogenic metabolites40. These functions included the super-pathway of BCAA biosynthesis (BRANCHED-CHAIN-AA-SYN-PWY), L-valine biosynthesis (VALSYN-PWY), L-isoleucine biosynthesis I (ILEUSYN-PWY, Fig. 3d), and a multifunctional enzyme that carries out the final step in BCAA biosynthesis (EC 2.6.1.42: Branched-chain amino acid aminotransferase).
Because of the known discrete sub-species structure of P. copri. we profiled its four subclades based on the published reference pan-genomes37 (Extended Data Fig. 7a). As expected, P. copri in non-Hispanic White participants in Europe and the US was dominated by Clade A, while a co-presence of all clades was nearly only observed in Chinese, Israeli, and US Hispanic populations (Extended Data Fig. 7a). We then tested whether the carriage of BCAA biosynthetic functions differed across the subclades and found that the abundance of the functions was significantly lower in P. copri dominated by Clade A, compared to P. copri with a co-presence of all clades (Extended Data Fig. 7b). However, we found that the unregulated BCAA biosynthesis in T2D patients was unique to P. copri Clade A and not detected in other P. copri subclades (Extended Data Fig. 7c). Taken together, we provided evidence that the BCAA biosynthetic capacity of P. copri is subclade and population-dependent, which would be otherwise undetected in the taxonomy-focused or community-level microbial function analysis.
Within-species phylogenetic divergence and type 2 diabetes
Next, we employed Anpan’s phylogenetic generalized linear mixed models (PGLMMs, Methods) to assess the extent to which within-species phylogeny accounted for inter-individual heterogeneity in T2D risk (Supplementary Table 8). We observed that within-species phylogenetic divergence was associated with inter-individual differences in T2D risk for 27 species (Fig. 4a). Several of these genetic structures were consistent with previous analyses41,42, while others were identified for the first time. As expected, many of the species contained subspecies that were specific to host geographical origins (Extended Data Fig. 8), aligning with the “isolation by distance” hypothesis proposing that co-dispersal of hosts and microbes contributes to the genetic stratification of species43. Due to this, to ensure the association between the within-species phylogenetic structure and T2D risk is not confounded by ethno-geography, we included the cohort membership as a covariable in subsequent models.
Fig. 4: Within-species phylogenetic divergence explains subpopulation-specific and individualized associations between microbial species and type 2 diabetes risk.
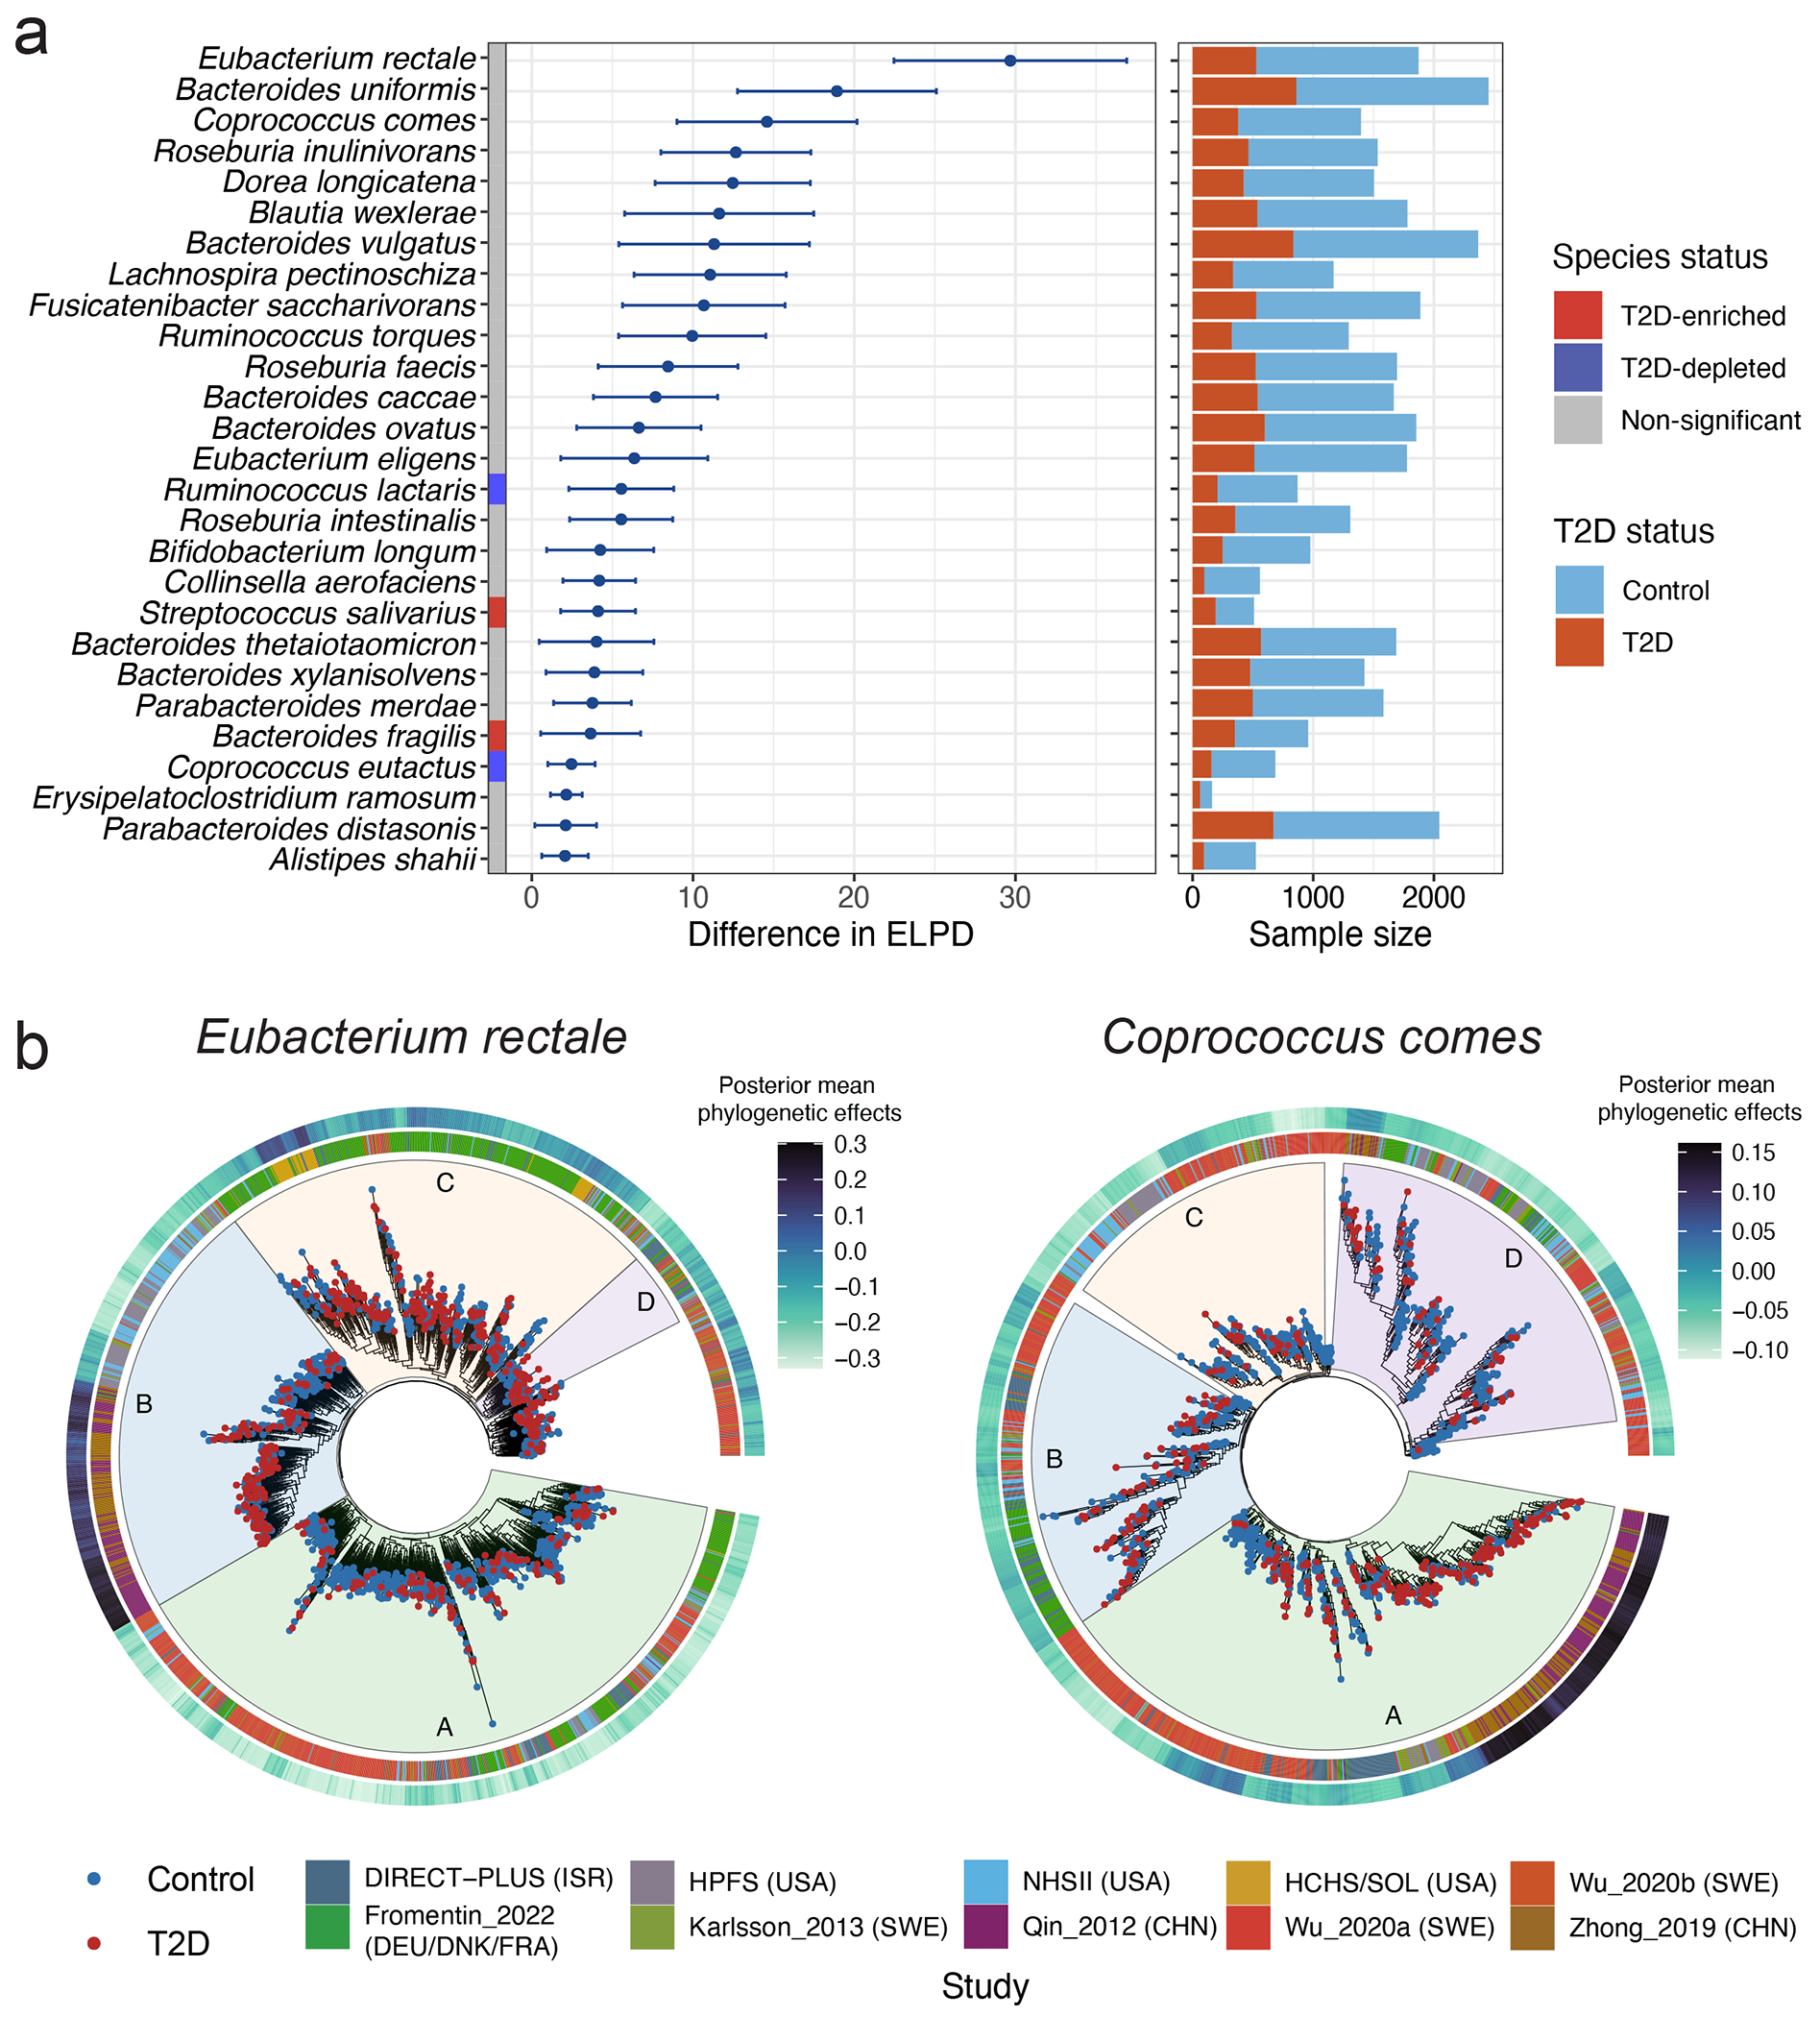
(a) Within each of the 27 species, the phylogenetic generalized linear mixed model (PGLMM) in Anpan (ANalysis of microbial Phylogenies And geNes, see Methods) identifies subclades with varying associations with type 2 diabetes (T2D). The left-hand side summarizes the associations between within-species phylogeny and T2D. The centers of the error bars represent the differences in expected log point-wise predictive density (ΔELPD) between two generalized linear mixed models with and without incorporating within-species phylogeny as a random effect (Methods), and the error bars represent the standard errors of ΔEPLD. Species included in this figure are those with a ΔEPLD greater than 2. Both models are adjusted for age, sex, body mass index, metformin use, and cohort membership as fixed effects. Anpan generates within-species phylogenetic trees by randomly splitting the edges based on the Euclidean similarity matrix derived from clustered sets of protein sequences (UniRef90 gene families). The right-hand side presents the sample sizes of T2D patients and normoglycemic controls after adaptive filtering to remove metagenomes where the species of interest was absent or insufficiently covered by sequencing (Supplementary Table 8 and Methods). (b) Phylogenetic trees of two select species show divergent associations between subclades and T2D within each species. The inner rings denote the cohort membership of each metagenome. The outer rings present the posterior mean of the phylogenetic effect of each phylogenetic tree leaf (metagenome) estimated by PGLMMs, with darker colors indicating a higher likelihood of subclade effects on the risk of T2D (Methods). We annotate different subclades using sectors with different colors and letters. The sample sizes in this analysis vary across species after the adaptive filtering in Anpan (Methods) and are available in Supplementary Table 8.
Within E. rectale, we observed strong associations between strains from Southern China and T2D in subclade B, which is predominantly composed of strains from Chinese and US white participants. Subclade C, containing strains from diverse geographical origins, showed strong associations of a strain from the US Hispanic population and another from the Northern European populations with T2D (Fig. 4b). The subspecies structure of Coprococcus comes has not been well studied. Our phylogenetic analysis grouped C. comes strains into four discrete subspecies clades. In its subclade A that consisted of strains from China, Israel, and Sweden, two strains from Sweden and Eastern China exhibited significant associations with T2D (Fig. 4b). While many clusters of strains that were found to be strongly associated with T2D could be attributed to specific ethnic and/or geographic groups, we also identified exceptions. For example, both a Blautia wexlerae strain detectable in all the participating cohorts, as well as another strain from US Hispanic, Israeli, and Swedish populations, showed strong associations with T2D (Extended Data Fig. 8). These findings provide evidence that microbe-induced T2D risk can derive from both population-specific and population-agnostic microbial genetics. None of the species showing strong subclade effects were T2D biomarker species, suggesting that analyses at the species level only would have overlooked critical microbe-T2D associations.
Strain-specific functional variations and type 2 diabetes
Complementary to the within-species phylogenetic analysis, we leveraged the UniRef90 data to identify gene families associated with T2D within each species using the gene association model in Anpan (Supplementary Table 9 and Methods). Of note, among all the species with genes differentially distributed between cases and controls, only E. coli was a biomarker species; all other species were not biomarker species. This indicates that critical strain-specific functions may have been overlooked by solely focusing on species-level taxonomic features and community-level functions.
Taking E. coli as an example, several detected clusters of strains contain genetic markers of the species’ known subtypes44 (Fig. 5b). Notably, we revealed the presence of gene families that encode specific virulence factors of pathogenic E. coli subtypes, including adhesins, invasins, and toxins, within the T2D-enriched clusters. The T2D-enriched Block 5 (Fig. 5b), comprising strains from Chinese and Swedish populations, were enriched by gene families involved in various horizontal gene transfer (HGT) mechanisms, such as mobile genetic elements (MGEs), phages, conjugation, and genetic rearrangement, suggesting a potential acquisition of advantageous traits and virulence factors by E. coli strains through HGT45,46. Specifically, two virulence-related gene families were identified: one associated with plasmid virulence (UniRef90_A0A376NZ25) in enteroaggregative E. coli (EAEC), known for inducing inflammatory responses and mucosal toxicity47, and another that contains genes encoding a lipopolysaccharide biosynthesis protein (UniRef90_A0A3E1VFS6) linked to heightened inflammatory responses at mucosal and peripheral levels48. In T2D-enriched Block 3, we observed enrichment in gene families that contain genes encoding a rearrangement hotspot element (rhsA; UniRef90_A0A377DDJ9), their associated YD-peptide repeat (UniRef90_A0A376MP41) and vgrG (UniRef90_A0A377LHH4) proteins, as well as Ail/Lom family proteins (UniRef90_A0A2G9A1M3). rhsA encodes immunity proteins delivered into targeted eukaryotic prey cells through a VgrG-dependent process in enterohemorrhagic E. coli (EHEC)49, while Ail/Lom family proteins serve virulence functions in EAEC50. Blocks 1 and 4, enriched in T2D patients from Chinese and US Hispanic populations, contained gene families encoding specific adherence factors of pathogenic E. coli, including a putative adhesin (UniRef90_A0A2Y0X8H8) and a fimbrial protein (UniRef90_A0A1Y4J7A6). The sole T2D-depleted cluster (Block 2) from diverse geographic origins contained various gene families associated with microbial response to environmental stress. These genes likely confer the strains with adaptive advantages, such as evasion from harmful environments and optimization of nutrient utilization51.
Fig. 5: Strain-specific gene carriage and biochemistry contribute to the pathogenesis of type 2 diabetes.
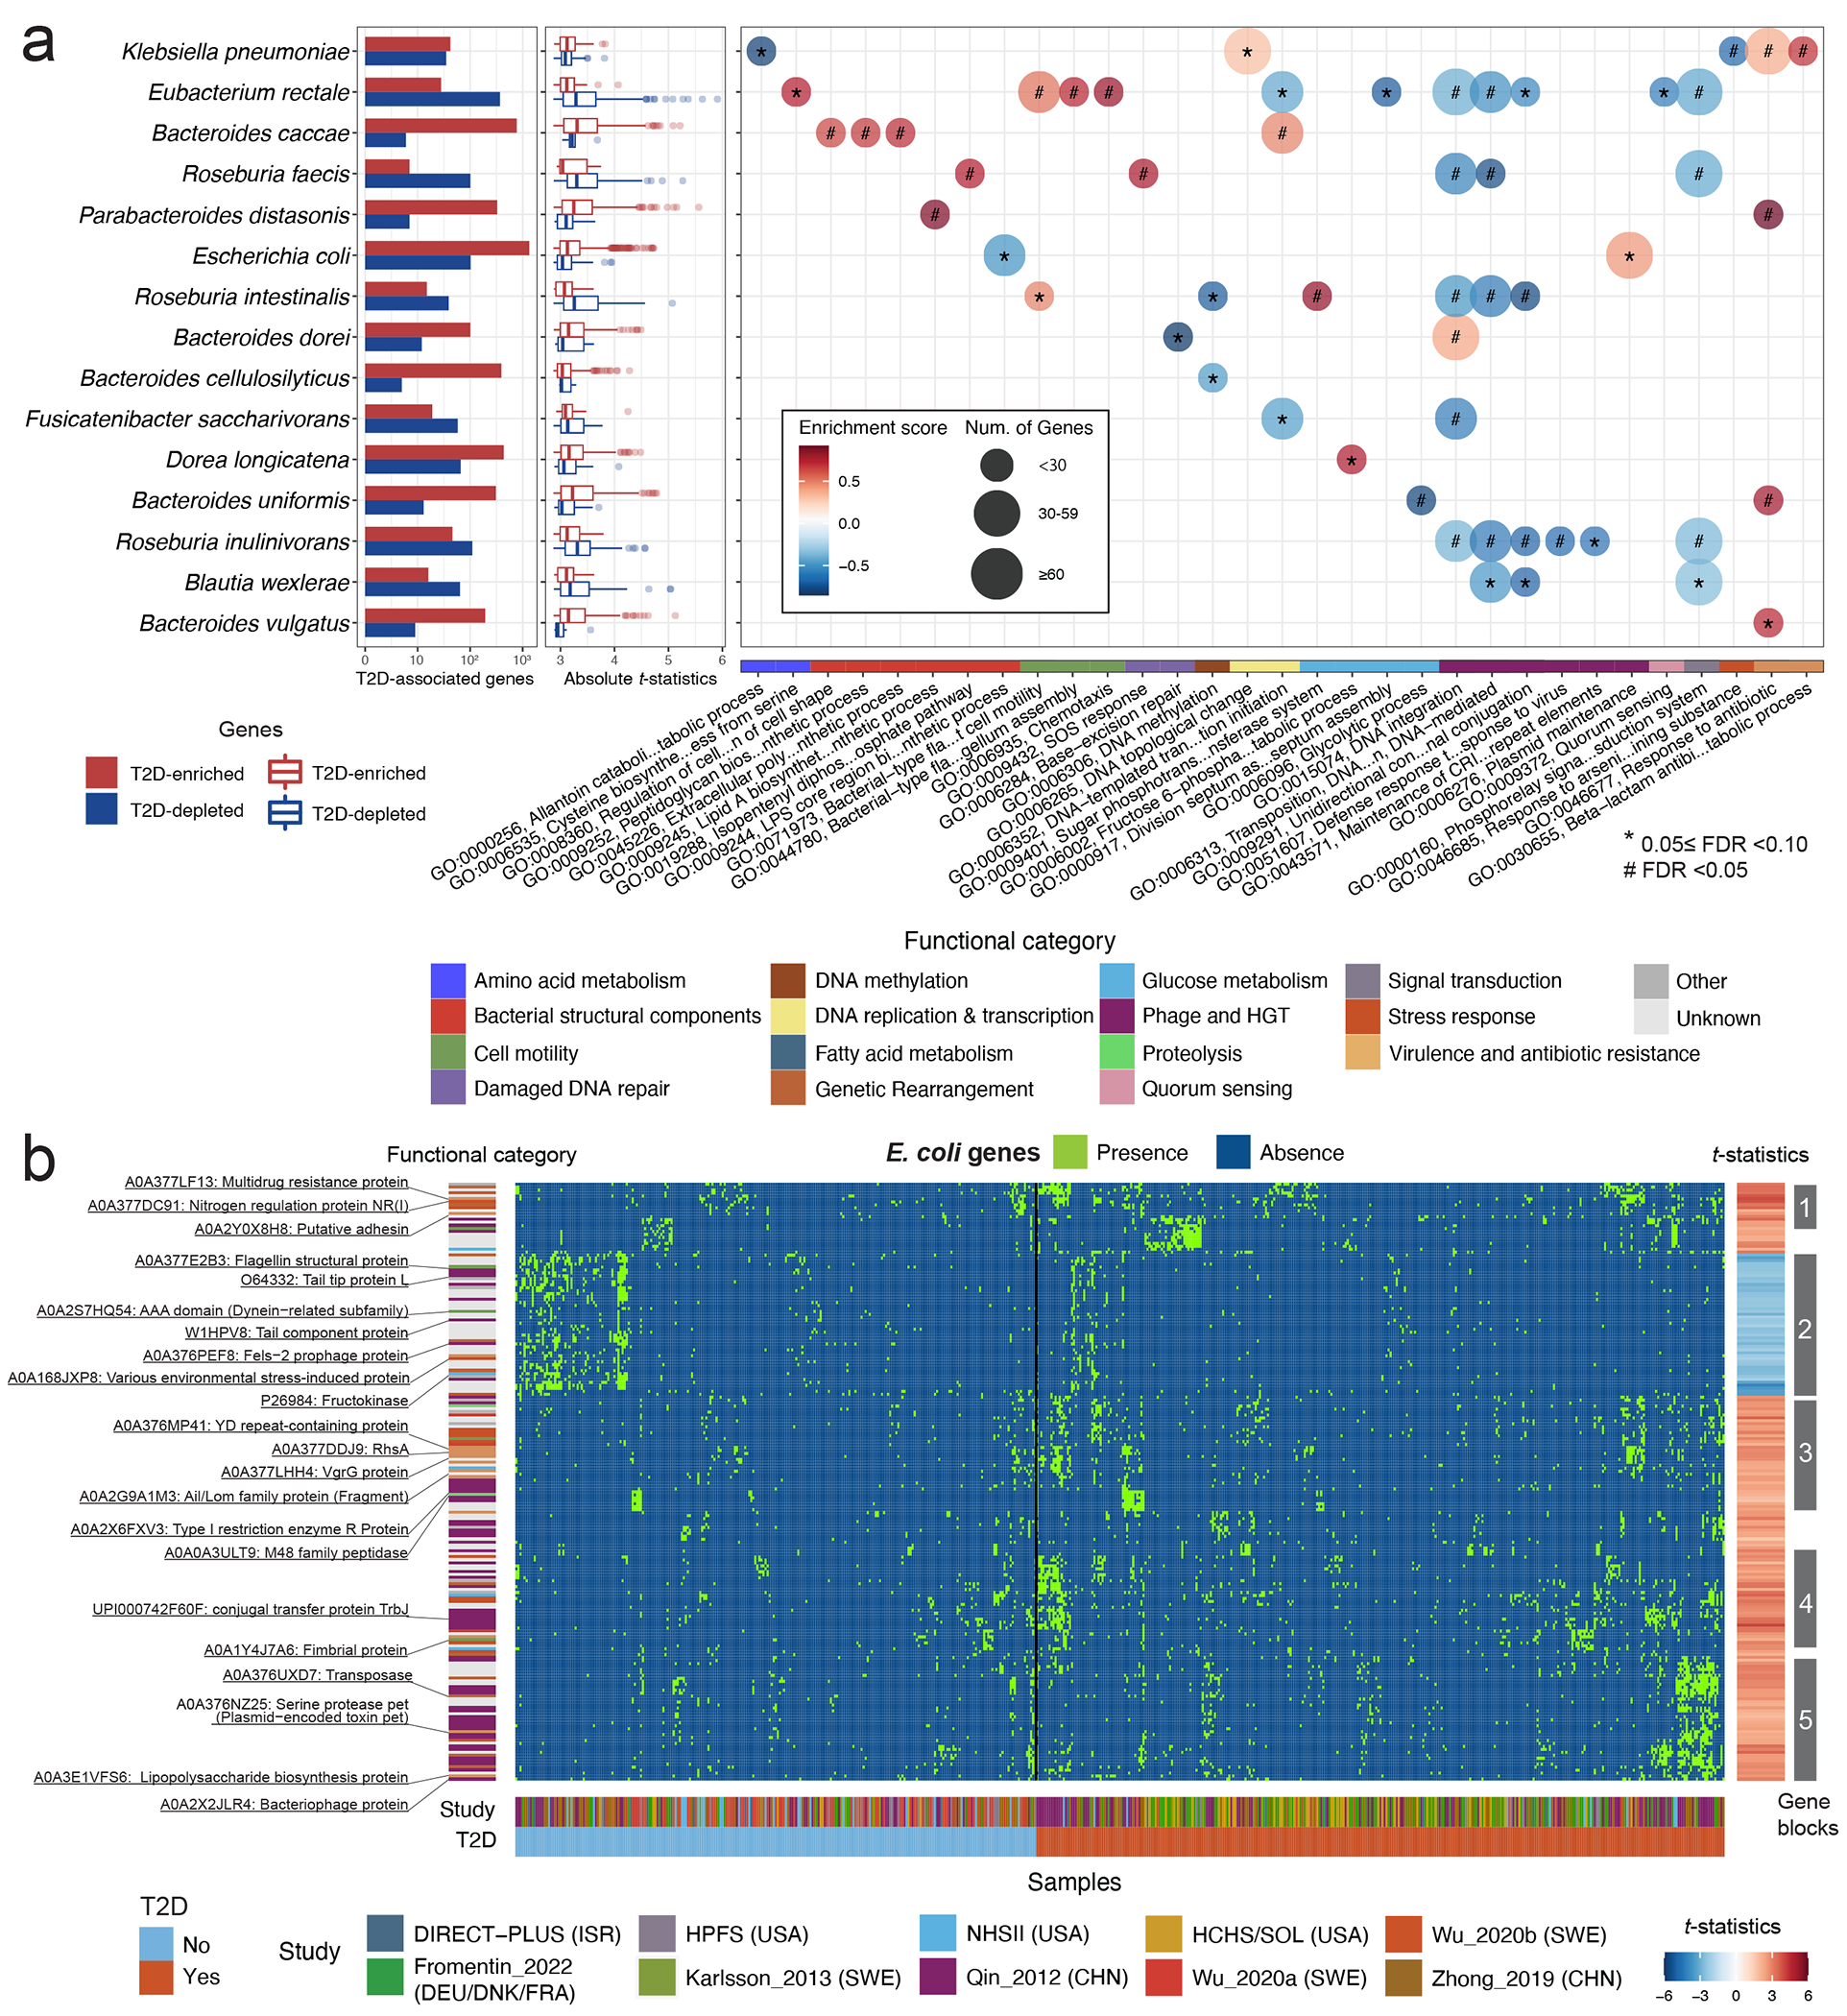
(a) Many differentially distributed UniRef90 gene families (clustered sets of protein sequences) provide functional explanations for the varying associations of subspecies with type 2 diabetes (T2D). The bar plots show the number of UniRef90 gene families significantly associated with T2D post-adaptive filtering. The boxplot presents the distributions of effect sizes (t-statistics) of UniRef90 gene families positively (red) and inversely (blue) associated with T2D within each species. The centers of boxes show medians of t-statistics with boxes indicating their inter-quartile ranges (IQRs), and upper and lower whiskers The right panel shows the results of gene-set enrichment analyses based on gene ontology (GO) terms and t-statistics from the gene association model in Anpan using 1,000 permutations. The bubble plot presents the enrichment scores and size of GO terms. GO terms with a positive normalized enrichment score (NES) contained UniRef90 gene families upregulated in T2D patients. GO terms with a negative NES contained UniRef90 gene families downregulated in T2D patients. All the results were corrected for multiple hypothesis testing by controlling the false discovery rate (FDR) using the Benjamini-Hochberg method with a target rate of 0.10. Asterisk signs indicate 0.05 ≤ FDR <0.10, and octothorpe signs indicate FDR <0.05. (b) UniRef90 gene family profiles indicate metagenomically detected strains for E. coli. The heatmap shows the genes significantly associated with T2D, with each column representing a metagenome and each row representing a UniRef90 gene family. The colors indicate the presence (green) or absence (blue) of a UniRef90 gene family in a metagenome. The heatmap on the right-hand side presents the t-statistics of an association between a UniRef90 gene family and T2D derived from the gene association model in Anpan. The red color signifies gene families enriched in T2D, while the blue color indicates gene families that are depleted in T2D. The sample sizes in the gene association model vary across species after the adaptive filtering in Anpan (Methods) and are available in Supplementary Table 8.
To extend this characterization of strain-specific biological processes across species, we performed a gene set enrichment analysis based on the gene association model results (Fig. 5a, Extended Data Fig. 9, and Supplementary Table 10; Methods). A total of 31 GO terms were associated with T2D (FDR <0.10). Extending our findings in E. coli, GO terms related to HGT explained the strain-level diversity in multiple species. Among T2D patients, the enriched GO terms encompassed biological processes related to glycolysis, biosynthesis of bacterial structural components, and those crucial for survival in adverse conditions, as well as virulence factor and antibiotic resistance genes. Additionally, taking E. rectale as an example, we found genes involved in flagellum-dependent cell motility and chemotaxis were more prevalent in T2D patients, indicating strain-specific adaptations to oxidative stress and inflammation in the gut52,53, while the GO term of quorum sensing was enriched in normoglycemic controls, suggesting survival advantages of the strains54.
Discussion
Over the last decade, a compelling body of evidence on the gut microbiome and T2D has emerged, generating significant interest in the potential of the microbiome for clinical applications in understanding, preventing, and treating T2D. However, the literature has been inconsistent and often focused on high-level community composition, potentially impeding deeper functional insights and translational efforts. To overcome these challenges, we undertook what we believe is, to date, the largest and most demographically diverse comparison of well-characterized human subjects. Our study assessed overall microbial community structure, specific microbial taxonomic and functional features, and strain-specific functions in an international collection of population-based microbiome studies of participants with T2D, prediabetes, and normoglycemic status within the MicroCardio Consortium. Our cross-cohort meta-analysis identified phylogenetically diverse, species-level microbial features of T2D, of which a vast majority are newly identified. In addition, community-level functional shifts encompassing diverse pathways to T2D were observed, such as upregulated biosynthesis of immunogenic bacterial structural components, perturbations in glycolysis, and downregulated butyrate fermentation (see Supplementary Text for further discussion).
Importantly, our strain-resolved analyses showed within-species heterogeneity in microbe-T2D associations and identified strain-specific functions that explained the heterogeneity, such as those related to HGT, BCAA biosynthesis, and functions conferring fitness advantages in a gut environment with oxidative stress and inflammation. While animal models have provided multiple lines of evidence for the causal role of strain-specific functionality in metabolic conditions55, previous microbiome studies in T2D have not examined strain-level diversity. This is largely due to a prior lack of reliable strain identification methodologies combined with statistical approaches taking advantage of them. Our study revealed differences in specific genes carried by a species in T2D patients compared to their normoglycemic counterparts. Many of the identified functional elements, such as those related to phages, HGT, and MGEs, belong to processes leading to within-species variation, i.e., mutations and gene flow, consistent with the established knowledge on the introduction of genetic variability into otherwise identical lineages of clonal daughter cells of microorganisms15. Furthermore, through HGT, microbes can acquire new traits that contribute to gut microbial evolution, conferring new phenotypes like virulence, symbiosis, and competitive fitness, which may give rise to strains with varying associations with T2D.
Our study has several strengths, including a large and diverse study population and uniform processing and analysis methodologies, and approaches to microbiome strain epidemiology. However, it is observational in nature, a limitation shared by many such microbiome investigations. Despite adjusting for major confounders in our statistical models, we were unable to control for covariates such as diet, physical activity, smoking, or medications other than metformin and insulin. In addition, despite applying batch correction and meta-analysis to minimize the batch effects, we cannot eliminate their influence due to the inconsistent methods of sample collection, DNA processing, and DNA sequencing used across cohorts. Another limitation is our lack of subtyping of T2D and prediabetes based on the phenotypic and pathologic heterogeneity inherent to the conditions. Furthermore, while we identified microbial genes that are implicated in adaptive responses to environmental selective pressures and horizontal gene transfer are associated with T2D risk and account for strain-level functional variation, our study did not directly measure the magnitude of selective pressure or horizontal gene transfer in a specified environment. Last, although our study included multiple independent populations and presented cohort-specific results that show reproducibility across the populations, the absence of additional replication cohorts limits our ability to test the generalizability of our findings further.
While our study does not establish causal linkages and should be interpreted as hypothesis-generating, it offers the most comprehensive evidence to date of the gut microbiome’s involvement in the pathogenesis of T2D from the population study perspective. These results lay the groundwork for future mechanistic studies. Additionally, we provide a more nuanced understanding of the biology and pathogenicity of microorganisms by studying the genetic makeup and characteristics of microbial strains, bringing us one step closer to causality. Our findings provide evidence for the gut microbiome’s potential functional role in the pathogenesis of T2D, underscoring the identification of taxonomic and functional biomarkers for future diagnostic applications. Furthermore, our examination of strain-specific functional genes builds upon prior mechanistic research in preclinical models, and we hope it will facilitate future investigations aimed at precisely characterizing the role of gut microorganisms in the development of T2D.
Methods
Ethics statement
This study included de-identified data from participants who had consented to the use of their anonymized information for research purposes. Approval for these study protocols was granted by the Institutional Review Boards. The study protocols of the Health Professionals Follow-Up Study (HPFS) and the Nurses’ Health Study II (NHSII) were approved by the institutional review boards of Brigham and Women’s Hospital and the Harvard T.H. Chan School of Public Health (IRB protocol no. HSPH 22067-102 and IRB protocol no. 1999P001636/BWH). The Soroka Medical Center Medical Ethics Board and Institutional Review Board (IRB protocol no. 0280-16-SOR) and the institutional review boards of Brigham and Women’s Hospital (IRB protocol no. 2021P002635) approved the study protocol of the DIRECT-PLUS Study. The Institutional Review Boards of Albert Einstein College of Medicine (IRB protocol no. 2013-2702) approved the study protocols of the Hispanic Community Health Study/Study of Latinos (HCHS/SOL). Ethical approval for Fromentin_2022 (MetaCardis Study) was obtained from the Ethics Committee CPP Ile-de France, the Ethical Committees of the Capital Region of Denmark, and the Ethics Committee at the Medical Faculty at the University of Leipzig. The protocol of Karlsson_2013 was approved by the ethics committee at Sahlgrenska University Hospital. The study protocol of Qin_2012 (Shenzhen Cohort) was approved by the Ethical Committee for Clinical Research from the Peking University Shenzhen Hospital, Shenzhen Second People’s Hospital, and the Medical Research Center of Guangdong General Hospital. The study protocol of Wu_2020 was approved by the Ethics Review Board in Gothenburg. The study protocol of Zhong_2019 was approved by the Institutional Review Board of BGI-Shenzhen and the ethical review committee of the Suzhou Centre for Disease Control and Prevention.
Description of Participating Cohorts
Health Professionals Follow-Up Study (HPFS).
HPFS is an ongoing prospective cohort study of 51,529 US male health professionals initiated in 1986. The participants’ diet, lifestyle, and health-related information were collected at baseline and updated biennially. The HPFS microbiome sub-study comprised 307 males aged 45 to 80 years free from coronary heart disease, stroke, cancer, or major neurological disease. The participants provided up to two pairs of self-collected stool samples from 2011 to 2013.
Nurses’ Health Study II (NHSII).
NHSII is an ongoing prospective cohort study that enrolled 116,429 female registered nurses in 1989. The cohort collected participants’ information on diet, lifestyles, and medication use, ascertained diseases at baseline, and updated the information biennially using mailed questionnaires. The NHSII Mind Body Study enrolled 213 participants free from coronary heart disease, stroke, cancer, or major neurological disease and shared the same study design and protocols for assays with the HPFS microbiome sub-study. All the participants provided up to two pairs of self-collected stool samples from 2013 to 2014.
DIRECT-PLUS.
The DIRECT-PLUS Study was an 18-month randomized controlled trial that tested the effects of Mediterranean dietary patterns on cardiometabolic risk56. This study only included metagenomes measured from the fecal samples collected before the interventions to rule out the possibility that intensive dietary interventions distorted the gut microbiome and T2D associations. In 2017, the DIRECT-PLUS Study enrolled 294 females and males who met the eligibility criteria. These criteria consisted of being over the age of 30 with either abdominal obesity or dyslipidemia. In addition, participants who used antibiotics two months before the fecal sample collection were excluded from the microbiome study.
Hispanic Community Health Study/Study of Latinos (HCHS/SOL).
HCHS/SOL is a prospective, population-based cohort that recruited 16,415 Hispanic/Latino males and females aged 18 to 74 between 2008 and 2011. HCHS/SOL recruited participants with diverse national origins, including Cuban, Dominican, Puerto Rican, Mexican, and Central and South American, from randomly selected households near the four field centers across the US. The HCHS/SOL Gut Origins of Latino Diabetes (GOLD) ancillary study was conducted between 2016 and 2018 and enrolled 3,057 participants from the HCHS/SOL cohort, and the enrollment coincided with the second in-person visit period conducted between 2014 and 2017.
Fromentin_202216 (MetaCardis).
We included publicly available sequence and phenotypic data from this study. MetaCardis enrolled ischemic heart disease patients and control participants without cardiovascular disease aged 18-75 years in Denmark, France, and Germany between 2013 and 2015. We restricted our analysis to 1,005 males and females in the control group to circumvent the confounding due to ischemic heart disease in the associations between the gut microbiome and T2D. The exclusion criteria of MetaCardis included 1) antibiotic use in the past three months, 2) history of abdominal cancer, 3) intestinal resection except for appendectomy and inflammatory or infectious diseases, including hepatitis B, hepatitis C or HIV, 4) history of organ transplantation, 5) receipt of immunosuppressants, 6) estimated glomerular filtration rate <50 ml/min/1.73 m2, or 7) drug or alcohol addiction.
Karlsson_20135.
Our study included publicly available sequence and phenotypic data from this study. This study included 145 females aged 70 years in 2009 with T2D, prediabetes, and normoglycemic status from a cohort of 2,595 females in Gothenburg, Sweden. The exclusion criteria included chronic inflammatory disease, antibiotic treatments during the preceding three months, and type 1 diabetes. This study collected data on disease histories, medication use, and smoking habits and performed anthropometric measurements.
Qin_20126 (Shenzhen Cohort).
We included the publicly available sequence data from this study and obtained additional data on biomarkers and medication use from the authors. The Shenzhen Cohort recruited 368 female and male individuals with a mean age of 50 years with T2D, prediabetes, and normoglycemic status in Shenzhen, China. Participants who received antibiotic treatment within two months before sample collection were excluded from this study.
Wu_202010.
Our study included sequence data stored at a public repository. The original authors transferred phenotypic and biomarker data to us. This study included two cohorts that recruited random sample populations of males and females aged 50-64 years from the Gothenburg area, Sweden. The first cohort comprised 1,046 participants, and the second comprised 484 participants. The second cohort was a subset of the Swedish Cardiopulmonary Bioimage Study-Gothenburg cohort. Both cohorts included newly diagnosed, diabetes-treatment naïve T2D and prediabetes cases and normoglycemic controls. The exclusion criteria included 1) known diabetes, 2) inflammatory diseases, such as Crohn’s disease, ulcerative colitis, and rheumatic diseases, 3) treatment with steroids or immunomodulatory drugs, 4) cancer (unless relapse-free for the preceding five years), 5) cognitive dysfunction, 6) treatment for infectious diseases and antibiotic use in the past three months. In addition, participants who did not understand Swedish and were born outside Sweden were excluded.
Zhong_201911 (Suzhou Cohort).
Our study included sequence data stored at a public repository, and additional data on biomarkers and medication use in the Suzhou Cohort were obtained from the authors. The Suzhou Cohort recruited community-dwelling males and females (mean age =62 years) in Suzhou, including 97 normoglycemic participants, 80 prediabetes participants, and 77 T2D patients. All the participants with prediabetes and T2D were newly diagnosed and treatment-naïve. Additional enrollment criteria include 1) age 40 or older; 2) free of cardiovascular disease, severe renal disease, cancer, type 1 or monogenic diabetes, and other autoimmune diseases; and 3) no antibiotic use during the past two months. This study conducted physical examinations to collect data on height, weight, blood pressure, and waist and hip circumference and administered questionnaires that inquired about demographics, medication history, family history, and lifestyles.
Fecal sample collection, sample handling, and shotgun metagenomic sequencing HPFS and NHSII.
Both cohorts collected the first pair of stool samples from two consecutive bowel movements, with a time interval of 24-72 hours between them. The second pair of samples were collected roughly six months following the first collection. Details on stool sample collection and immediate ex-situ conservation of metagenomic components, laboratory handling, and paired-end shotgun sequencing of DNA can be found in our previous publications35. Briefly, each participant preserved each bowel movement in a container with RNAlater. The collected stool samples were shipped overnight to the Broad Institute of MIT and Harvard and then stored in freezers at −80 °C until DNA extraction. To eliminate the excess of RNAlater, we centrifuged stool aliquots at maximum speed and added 110 μl of Tris-EDTA buffer with Proteinase K (Qiagen) and lysozyme (Sigma-Aldrich) (15 mg ml−1) to the pellet with incubation on a laboratory shaker for 10 min. Mechanical lysis was performed by adding a 1.2 ml RLT buffer with 2-mercaptoethanol (Qiagen) and 1 ml of 0.1 mm glass beads (BioSpec Products). Subsequently, the mixture was subjected to bead beating for 3 min. The debris was removed by centrifugation, and the supernatant was used in Qiagen AllPrep spin columns (Qiagen). A NanoDrop 1000 (Thermo Fisher Scientific) was employed to determine the DNA concentration, quality, and purity. We used the Nextera XT DNA Library Preparation Kit for library preparation. The metagenomic shotgun sequencing was performed using the Illumina HiSeq platform.
DIRECT-PLUS.
Stool samples were obtained at the study site, immediately frozen to −20 °C for 1-3 days, and subsequently transferred to −80 °C in preparation for DNA extraction. The sample processing and shotgun metagenomic sequencing were performed at Alkek Center for Metagenomics and Microbiome Research, Baylor College of Medicine, Houston, TX, USA. DNA extraction was performed using Qiagen DNeasy PowerSoil Pro Kit from fecal samples. Libraries were constructed using Illumina DNA Prep, with each sample being assigned a unique barcode using kit-appropriate Unique Dual Index adapter sets. Completed libraries were QC’d using a combination of PicoGreen (Thermo), Qubit (Invitrogen), Fragment Analyzer (Agilent), and Tapestation (Agilent) to assess concentration and fragment size distribution. Shotgun sequencing of pooled libraries was performed via the Illumina NovaSeq platform using the 2x150 bp paired-end protocol. Raw sequences were demultiplexed and processed using BBDuk to quality trim, remove Illumina adapters, and filter out PhiX reads. Trimmed FASTQ files were then mapped to a combined PhiX (standard Illumina spike in) and host reference genome database using BBMap to identify and remove host/PhiX reads.
HCHS/SOL.
This study used a self-collection kit to collect stool samples (ABC Medical Enterprises, Inc., Rochester, MN). All the stool samples were shipped to Albert Einstein College of Medicine, aliquoted into 1 ml tubes, and frozen at −80 °C after collection. The sample handling and shotgun sequencing conducted by the Knight laboratory at the University of California San Diego was published before57. Briefly, DNA was extracted from fecal samples following the Earth Microbiome Project protocol. Input DNA was quantified in a 384-well plate using a PicoGreen fluorescence assay (ThermoFisher, Inc.) and normalized to 1 ng using an Echo 550 acoustic liquid-handling robot (Labcyte, Inc.). Enzyme mixes for fragmentation, end repair, and A-tailing, ligation, and PCR were added using a Mosquito HV micropipetting robot (TTP Labtech). Fragmentation was carried out at 37°C for 20 min, followed by end-repair and A-tailing at 65°C for 30 min. Sequencing adapters and barcode indices were introduced in two steps by following the iTru adapter protocol. Universal “stub” adapter molecules and ligase mix were applied to the end-repaired DNA using the Mosquito HV robot. The ligation was performed at 20°C for one hour. Unligated adapters and adapter dimers were eliminated using AMPure XP magnetic beads and a BlueCat purification robot (BlueCat Bio). Next, individual i7 and i5 were added to the adapter-ligated samples using the Echo 550 robot. Eluted bead-washed ligated samples are then added to the PCR master mix and PCR amplified for 15 cycles. The amplified and indexed libraries are purified again using magnetic beads and the BlueCat robot, resuspended in water, and transferred to a 384-well plate using the Mosquito HTS liquid-handling robot for library quantitation, sequencing, and storage. Samples are then normalized using a PicoGreen fluorescence assay before being prepared for sequencing on the Illumina NovaSeq platform.
Fromentin 2022.
Fecal samples were collected by participants at home and immediately stored at −20 °C. These samples were transported on dry ice and subsequently frozen at −80°C within 4-24 hours after arrival at the biobanks. DNA was extracted following the IHMS guidelines (SOP 07 V2 H)58. Metagenomic sequencing was performed using the ion proton technology (Thermo Fisher Scientific), resulting in 23.3 ± 4.0 million (mean ± s.d.) single-end short reads with an on-average length of 150 bases.
Karlsson 2013.
Fecal samples were collected at the participants’ homes, shipped to the laboratory one day after the collection, and stored at −80 °C until DNA extraction. The extraction of DNA followed the method in Salonen et al.59. DNA concentration was determined using a Nanodrop instrument (Thermo Scientific), and the DNA quality was evaluated by agarose gel electrophoresis. All samples were sequenced on the Illumina HiSeq2000 instrument at GATC Biotech. Up to 10 samples were pooled together in a single lane for sequencing. Libraries were prepared with a targeted fragment length of around 300 bp. Paired-end reads were then generated with 100 bp in both the forward and reverse directions.
Qin 2012.
Fresh fecal samples were collected at the participants’ homes, immediately frozen in a home freezer for less than 24 hours, shipped to the lab, and stored at −80°C until DNA extraction. A frozen aliquot (200 mg) of each fecal sample was reconstituted in a solution consisting of 250 μl of guanidine thiocyanate, 0.1 M Tris (pH 7.5), and 40 μl of 10% N-lauroyl sarcosine. DNA was extracted using the method described in Courtois et al.60. DNA concentration and molecular weight were assessed by utilizing a nanodrop instrument (Thermo Scientific) and agarose gel electrophoresis. Libraries were prepared with an insert size of 350 bp for each sample. The shotgun sequencing was performed using Illumina GAIIx and HiSeq 2000. Paired-end reads were generated with 75-90 bp in the forward and reverse directions. From the raw reads, adaptor contamination and those of low quality were removed, and the remaining reads were filtered to exclude human host DNA, using the human genome reference (hg18) as a reference.
Wu 2020.
This study collected stool samples at the participants’ homes and stored them at room temperature for a maximum of 36 hours before storage at −80°C. The extraction of DNA followed the method in Deschasaux et al.61. Shotgun metagenomic sequencing was performed on an Illumina HiSeq 4000 instrument (150 bp; paired-end) at GATC Biotech.
Zhong 2019.
The Suzhou Cohort collected stool samples in 2 ml fecal containers, immediately shipped the samples to the laboratory on dry ice and stored them at −80 °C until DNA extraction. The stool DNA was extracted following the MetaHIT protocol60. The DNA concentration was estimated by Qubit (Invitrogen). This study generated single-strand circular DNA libraries following the method described in Fang et al.62 and performed shotgun metagenomic sequencing using the BGISEQ-500 platform.
Measurements of circulating biomarkers
HPFS and NHSII.
HPFS and NHSII collected two fasting blood samples during the same period as fecal samples collection. Participants were asked to fast for 12 hours before the blood collection. Hemoglobin A1c (HbA1c) was measured by turbidimetric immunoinhibition using packed red cells (Roche Diagnostics), which is a standard approved by the US National Glycohemoglobin Standardization Program and FDA for clinical use. High-sensitive C-reactive protein (hs-CRP) concentrations were determined using an immunoturbidimetric high-sensitivity assay using reagents and calibrators from Denka Seiken (Niigata, Japan) with assay day-to-day variability between 1 and 2%. TC, HDL-c, and TG were measured using standard methods with reagents from Roche Diagnostics (Indianapolis, IN) and Genzyme (Cambridge, MA). LDL-c was calculated using the Friedewald equation.
DIRECT-PLUS.
Blood samples were collected after a 12-hour fast, centrifuged, and stored at −80°C pending analysis. Serum TC, HDL-c, LDL-c, and TG were determined enzymatically with a Cobas-6000 automatic analyzer (Roche). Plasma concentrations of hs-CRP were measured by ELISA (DiaMed). Plasma glucose levels were measured using the Roche GLUC3 (hexokinase method). Plasma insulin levels were quantified with an enzyme immunometric assay (Immulite automated analyzer, Diagnostic Products). All the assays were performed at the University of Leipzig, Germany.
HCHS/SOL.
Participants fasted for at least 8 hours and refrained from smoking before the blood sample collection in the morning. The Central Laboratory of HCHS/SOL at the University of Minnesota Advanced Research and Diagnostic Laboratory in Minneapolis, MN, performed the assays on the blood specimens. Fasting insulin was measured using two commercial immunoassays (ELISA, Mercodia AB, Uppsala, Sweden; and sandwich immunoassay on a Roche Elecsys 2010 Analyzer, Roche Diagnostics, Indianapolis, IN). Hs-CRP was measured by using an immunoturbidimetric method (Roche Diagnostics). Serum TC was measured using a cholesterol oxidase enzymatic method, and HDL-c was measured using a direct magnesium/dextran sulfate method. Plasma glucose was measured using a hexokinase enzymatic method (Roche Diagnostics). LDL-c was calculated using the Friedewald equation. HbA1c was measured using a Tosoh G7 Automated HPLC Analyzer (Tosoh Bioscience). After the initial venipuncture, those without self-reported diabetes and/or not taking antihyperglycemic medications and/or fasting plasma glucose (FPG) ≤ 8.4 mmol/L underwent a standard 75 g two-hour oral glucose tolerance test (OGTT) and 2-hour-post oral load plasma glucose was measured.
Fromentin 2022.
Blood was collected in the morning after an overnight fast. Plasma and serum samples were stored at the clinical centers at −80°C until assays. Standard enzymatic methods were employed to measure fasting plasma glucose, TC, HDL-c, TG, and HbA1c. LDL-c was measured enzymatically for German participants or by the Friedwald equation for French and Danish participants. Hs-CRP was measured using an Image Automatic Immunoassay System (Beckman Coulter).
Karlsson 2013.
The participants were asked to fast overnight, avoid heavy physical activity during the previous day, and avoid smoking during the morning before the test. Serum and plasma were frozen in aliquots at −70 °C within four hours after blood sample collection. Fasting capillary blood glucose was measured immediately using the modified glucose dehydrogenase reaction (Hemocue AB, Ängelholm, Sweden). TC, HDL-c, and TG were determined by established methods. LDL-c was calculated using the Friedewald equation. HbA1c was determined with high-pressure liquid chromatography on a Mono S HR 5/5 column (Amersham Biosciences, Piscataway, NJ, USA, and Pharmacia, Uppsala, Sweden). Plasma insulin was assayed using a 1235 AutoDELFIA automatic immunoassay system with a two-step time-resolved fluorometric assay (Kit No. B080-101).
Qin 2012.
This study collected fasting blood samples following the protocol recommended by WHO in a hospital in Shenzhen, China. Fasting blood glucose, serum insulin, HbA1c, TG, TC, HDL-c, and LDL-c were determined using standard methods.
Wu 2020.
Participants went through a screening examination that included a fasting blood collection and a 2-hour 75-g OGTT. The participants were asked to fast overnight, avoid heavy physical activity during the previous day and in the morning, and avoid smoking in the morning. Blood glucose was measured with the glucose dehydrogenase technique (Hemocue, Glucose 201 DM, Hemocue AB, Ängelholm, Sweden). Fasting plasma insulin level was measured using Human Insulin ELISA Kit (Mercodia AB). HbA1c, TG, TC, HDL-c, and LDL-c were determined using standard methods.
Zhong 2019.
The participants fasted overnight before the blood sample collection. Plasma and serum samples were stored at −80°C before assays. This study also performed a 2-hour 75-g OGTT. FPG, plasma insulin, C-peptide, HbA1c, leptin, adiponectin, TG, TC, HDL-c, and LDL-c were measured using standard methods at a clinical laboratory in Nanjing, China.
Harmonization of the diagnosis of type 2 diabetes, biomarkers, and covariables
Based on the recommendations by the American Diabetes Association2, we harmonized the diagnosis of T2D using the following criteria:
T2D diagnosis self-reported by participants, confirmed by physician review of medical records or documented in medical records
Or
Use of antidiabetic medications (metformin not included) self-reported by participants or documented in medical records
Or
FPG ≥126 mg/dL (7.0 mmol/L)
Or
2-hour plasma glucose ≥200 mg/dL (11.1 mmol/L) during 75-g OGTT
Or
-
HbA1c ≥6.5% (48 mmol/mol)
We harmonized the diagnosis of prediabetes using the following criteria:
FPG from 100 mg/dL (5.6 mmol/L) to 125 mg/dL (6.9 mmol/L)
Or
2-hour plasma glucose during 75-g OGTT from 140 mg/dL (7.8 mmol/L) to 199 mg/dL (11.0 mmol/L)
Or
HbA1c from 5.7 to 6.4% (39 to 47 mmol/mol)
We included all normoglycemic participants with microbiome measurements from our de novo datasets. We calculated indices for insulin sensitivity, the homeostasis model assessment of insulin resistance (HOMA-IR), and β-cell function, the homeostasis model assessment of β-cell function (HOMA-B) based on fasting insulin and glucose levels using the formulas from Matthews et al.63. Body mass index was calculated as weight in kilograms divided by the square of the height in meters. Metformin and insulin were either self-reported by the participants or documented in medical records. For studies that did not report medication uses, we obtained the data from the authors.
Sequence processing and taxonomic and functional profiling
We processed the sequence data from every participating cohort and generated taxonomic and functional profiles by applying the bioBakery 3 meta’omics workflow17. In brief, sequence reads were passed through the KneadData v0.7.0 quality control pipeline (http://huttenhower.sph.harvard.edu/kneaddata) with default parameters to filter out low-quality read bases and reads of human origin. Taxonomic profiling was performed using MetaPhlAn 3.0 (http://huttenhower.sph.harvard.edu/metaphlan3). The species-specific database of markers was built using 99,237 reference genomes representing 16,797 species. We performed functional profiling by applying HUMAnN 3.0.0 (http://huttenhower.sph.harvard.edu/humann3). Briefly, for each sample, taxonomic profiling is used to identify detectable organisms. Reads are recruited to sample-specific pangenomes, including all gene families in detected microbes, using Bowtie264. Unmapped reads are aligned against UniRef9065 using DIAMOND translated search66. Hits are counted per gene family and normalized for length and alignment quality. For calculating abundances from reads that map to more than one reference sequence, search hits are weighted by significance (alignment quality, gene length, and gene coverage). UniRef90 abundances from both the nucleotide and protein levels were then i) mapped to level 4 Enzyme Commission (EC) nomenclature and ii) combined into structured pathways from MetaCyc67. We used the MinPath68 and gap-filling options in HUMAnN 3. Our taxonomic and functional profiling resulted in 944 microbial species, 549 MetaCyc pathways, 2,873 ECs, and 775,402 UniRef90 gene families before quality control in the combined dataset.
To profile Prevotella copri subclades, we built the pangenome of subclades of P. copri from Tett et al.37 and used them to identify subclade-specific marker genes for MetaPhlAn profiling. The pangenomes were built by categorizing the coding sequences into UniRef90 clusters when a 90% amino acid identity match was found within the UniRef dataset or by de novo clustering all remaining sequences at 90% amino acid identity following the Uniclust90 criteria69. From the resulting UniRef90 and Uniclust90 gene families, we subsequently identified core gene families and then unique marker genes for each subclade. MetaPhlAn taxonomic profiling used these markers to detect the presence of a subclade in metagenomes based on the detection via read mapping of a sufficient fraction of marker genes (default 20%) and quantifies their relative abundance based on the within-sample-normalized average coverage estimations.
Batch effect correction
We corrected batch and study effects in the metagenomic data using a method from the MMUPHin workflow18 specifically designed for zero-inflated microbiome sequencing profiles (MMUPHin_Correct). In addition, the method can differentiate between technical effects (batch, study) vs. covariates of biological interest. This method extended the batch correction method based on linear models for gene expression data70 by adding a binary zero-count indicator. Metagenomic data as the read count was modeled with respect to both batch and study variables and biologically relevant covariates, including T2D status. The batch-specific location and scale parameters were modeled with normal and inverse-gamma priors, respectively. Hyperparameters were estimated with empirical Bayes estimators. Per-sample feature counts were then re-normalized to keep sample read depth unchanged post-correction. We quantified the percentages of the total variation in the gut microbiome community explained by batch and study effects before and after the correction using the permutational multivariate analysis of variance (PERMANOVA; n=999 permutations), as implemented by the ‘adonis’ function in the R package vegan. In addition, we performed principal coordinates analyses (PCoA) to visualize the study effect on the microbial community structure based on Bray-Curtis dissimilarity metrics calculated from species-level microbiome data using the vegdist package.
Statistical Analyses
To determine variability in the relative abundance of taxonomy and functional features, we calculated the Bray-Curtis (BC) dissimilarity metric for each sample. We applied PERMANOVA to quantify the percentage of variance in each data type of microbial communities explained by T2D, plasma biomarkers, and covariables based on the BC dissimilarity metric using the adonis function in the R package vegan. Notably, this study included two cohorts with repeated measurements of the gut microbiome from fecal samples longitudinally collected at different times, NHSII and HPFS.
In the microbial feature association analysis, we first performed quality controls for taxonomic and functional features before including them in the subsequent analyses. For a microbial species or a MetaCyc pathway to qualify for downstream analyses, it needed to be present in at least 10% of samples with that feature detectable at a minimum relative abundance of 0.0002. The criterion for ECs was that at least 10% of samples with that feature were detectable at a minimum relative abundance of 0.00002. In addition, we removed functional features with high correlations with others by taking the most abundant feature from each cluster as its representative. Because we were more interested in community-level shifts in microbial features, we applied “dominance filtering,” i.e., to remove functional features primarily encoded by a single species (details of the filtering are in Supplementary Text). Furthermore, we removed taxonomic and functional features present in only one participating cohort. This analysis included a total of 187 species, 199 MetaCyc pathways, and 1092 enzymes that passed quality control criteria and were present in at least two (for species) or three (for MetaCyc pathways and enzymes) participating cohorts.
To identify microbial features significantly associated with T2D across the ten cohorts after batch effect correction, we built a differential abundance model while controlling for covariates using the ‘lm_meta’ function in the MMUPHin package. To account for the repeated measurement design, we employed linear mixed models in the analyses to identify taxonomic and functional features of T2D. Specifically, MMUPHin lm_meta first employs the linear mixed effects modeling with the R package MaAsLin2 to perform per-feature tests within individual cohorts19. The models adjusted for covariables as fixed effects and included participants’ identifiers as random effects if a cohort repeatedly assayed the microbiome. The rationale of a meta-analysis approach is described in Supplementary Text. In the models, we treated T2D status as an ordinal variable (normoglycemic controls, prediabetes, or T2D); the P-values and beta coefficients generated from this model indicate the significance and effect estimates of examining whether the abundance of a species changes across different T2D statuses in a dose-response manner. In addition, we modeled T2D status as a binary variable (normoglycemic controls or T2D) within a subset of the study population that excluded individuals with prediabetes. MMUPHin then performed a meta-analysis, i.e., to synthesize beta coefficients and standard errors from each individual cohort, that accounts for potential study differences and identifies consistent signals. Subsequently, the results were corrected for multiple hypothesis testing by controlling the false discovery rate (FDR) using the Benjamini-Hochberg method with a target rate of 0.10.
To examine whether the inclusion of gut microbial features improved the classification between T2D and controls, we employed the MetAML package71, utilizing the random forest algorithm implemented in Scikit-Learn v.0.19.0. To mitigate potential biases from metformin use, we separately assessed classification performance for metformin-treated and -naïve T2D cases. The evaluation of classification performance involved two models: a basic model incorporating age, sex, and BMI, and a second model that additionally integrated species-level taxonomic relative abundance profiles. The quantification of classification performance was calculated using the area under the receiver operating characteristic curve (AUC). We performed a leave-one-data-set-out analysis28 in which each dataset, in turn, was set aside for cross-study validation. The random forest classifiers were trained on nine datasets combined and validated on the left-out dataset for each dataset in turn. More details of the random forest model are in Supplementary Text.
We applied the pathway random effects model to identify pathways that differed substantially in abundance between groups of a phenotype within a species while accounting for the correlation between pathway and species abundance. The model formula is:
We log-transformed and discarded zero values of the abundance of a pathway before modeling. The relationship between species abundance and pathway abundance is measured globally using data from all pathways in the species. We set pathway-specific intercepts and slopes by including them as random effects and partially pooled the intercepts and slopes across pathways. The model was fit with Stan and used standard random effects model syntax in R package lme4. We used three criteria to define the “hit” pathways: 1) the 98% posterior intervals on the pathway: group effect excludes zero, 2) the absolute posterior mean exceeds 0.20 (i.e., a 1.58-fold increase or decrease), and 3) the estimated relationship between species abundance and pathway abundance is positive.
We used Anpan (ANalysis of microbial Phylognies And geNes, https://huttenhower.sph.harvard.edu/anpan) to conduct the subspecies (strain) level analyses. All the analyses were based on the abundance of UniRef90 gene families within a species in all the included samples profiled by the HUMAnN3 v3.0.0. We performed adaptive filtering to remove metagenomes where the species of interest was absent or insufficiently covered by sequencing before statistical analysis. The filtering strategy utilized the overall gene profile of each species in each sample to classify the species as “well covered” or “poorly covered” in that sample. The classification applied the k-means algorithm based on the distributions of two statistics for each species-sample combination: the number of non-zero observations and the median log abundance of the non-zero measurements.
We fit phylogenetic generalized linear mixed models (PGLMMs) in Anpan to quantify the effect of within-species heterogeneity in the association between subclades or strains and T2D using the probabilistic programming language in Stan72. First, Anpan calculates the Euclidean distance between samples based on the gene presence/absence matrices in each species after dimension reduction by principal components analysis. Second, phylogenetic trees were generated using the neighbor-joining function in the R packages ape73 and ggtree (v3.4.4). Third, using the phylogenetic trees as inputs, we fit PGLMMs with the T2D status as the dependent variable and the phylogeny as the independent variable, with age, sex, BMI, study, and metformin use as covariates. The empirical prior values for the covariate coefficients were set as follows: 0.1 for age, 0.2 for sex, 0.167 for BMI, 0.2 for study, and 0.3 for metformin use.
PGLMMs include a phylogenetic term as a sample-specific random effect. The values in the phylogenetic term follow a pre-specified correlation structure derived from the phylogenetic tree. The spread of the phylogenetic terms is characterized by a noise parameter that quantifies the contribution of the tree to the model fit. We built two models, one with and the other without incorporating within-species phylogeny and used Stan to estimate the parameter values and leave-one-out expected log pointwise predictive density (ELPD74), a model comparison criterion akin to the Akaike Information Criterion) to determine if adding the phylogenetic information improves model fit. Phylogenies of species linked to the T2D were identified based on the criterion of the difference in ELPD (ΔELPD) ≥ 4 and ΔELPD - 2×standard error (SE) of ΔELPD > 0.
To assess the relationship between the presence of a uniref90 gene family and T2D, we fit generalized linear models with T2D as the dependent variable and the gene presence and covariables as the independent variables in Anpan:
In the analysis and visualization of E. coli strain-specific gene carriage, we calculated the effect estimate (β coefficient) for the term of gene presence and included a uniref90 gene family with an absolute value of its effect estimate ≥1.2. We clustered the samples, stratified by their case-control status, using the complete linkage method by the hclust function in the R package stats.
To further characterize strain-specific biological processes, we performed a gene ontology (GO) term enrichment analysis using the gene set enrichment analysis methods based on the gene association model results. We adopted the definition of “informative GO terms” in the previous studies75 to curate a list of GO terms as input in the enrichment analysis. A GO term was defined as an “informative” term if it contains more than 20 genes and all its child terms contain less than 20 genes. The enrichment analysis utilized the ranking of UniRef90 gene families, which was based on the t-statistics from the gene association models. Enrichment scores were calculated using the fgsea R package against curated GO terms using 1,000 permutations. We identified significant GO terms within each species based on the criterion that the GO term had significantly enriched genes (q <0.10). The visualization of the results was generated using fgsea (v1.22.0) and ggplot2 (v3.3.6). More details of this analysis are in Supplementary Text.
Extended Data
Extended Data Fig. 1: Workflow.
We adjusted for the study effect by adopting a conservative meta-analysis approach in the downstream analyses. Our analyses examined the overall microbial community structure, specific microbial taxonomic and functional features, strain-specific biochemical pathways, and within-species phylogeny and gene families in a cross-cohort meta-analysis framework. This figure was created with BioRender.com.
Extended Data Fig. 2: Principal coordinate analysis of all samples using species-level Bray-Curtis dissimilarity colored by cohorts before and after correcting batch and study effects.
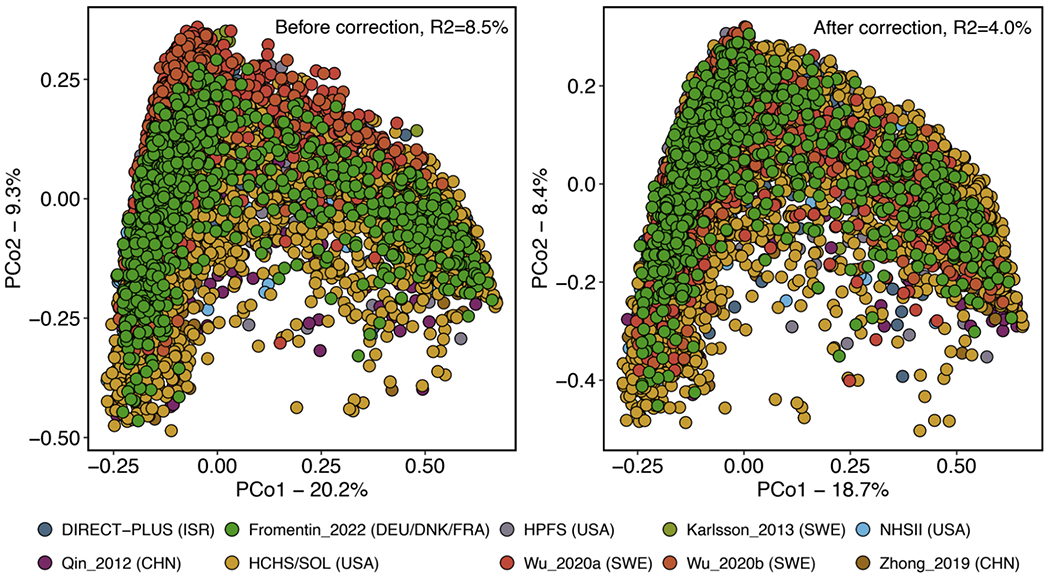
R2 values are calculated from permutational multivariate analysis of variance (PERMANOVA, n = 999 permutations) and indicate the variance attributable to study and batch effects.
Extended Data Fig. 3: Comparisons in associations between microbial species and type 2 diabetes (T2D) across different statistical models.
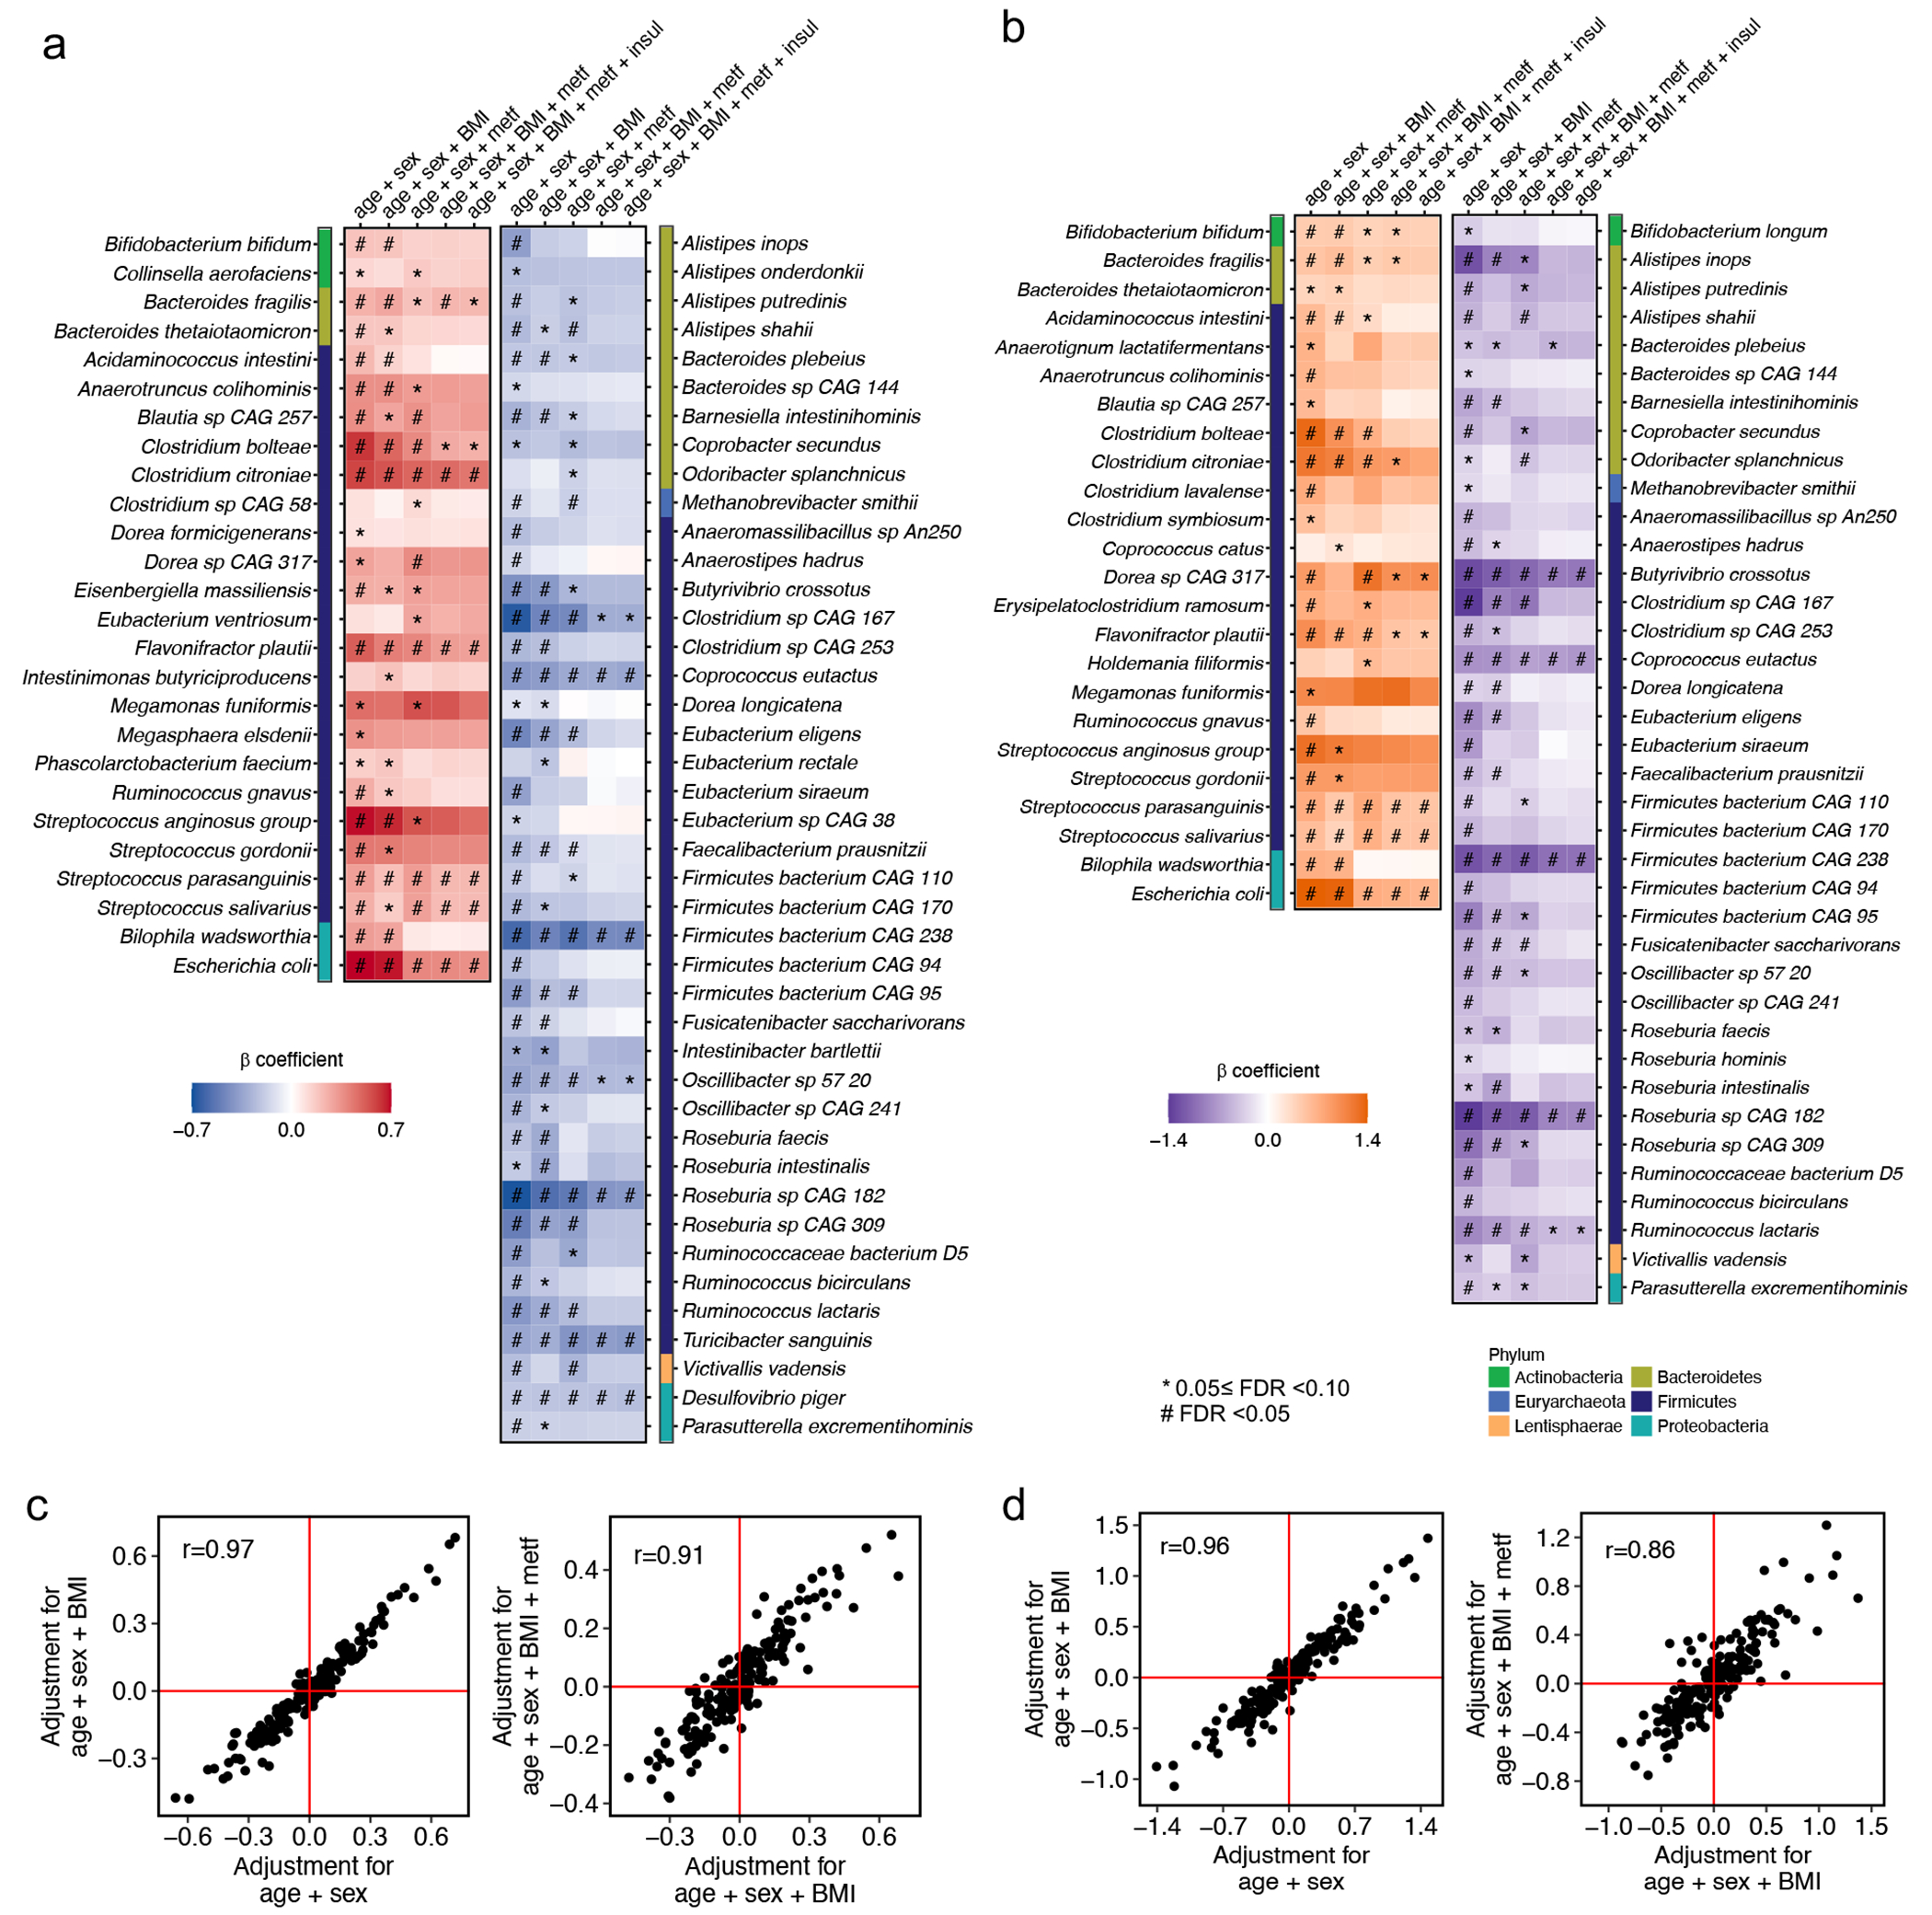
Meta-analyzed associations of individual microbial species with T2D phenotype from the ordinal (a) and binary (b) models. The ordinal model modeled the disease status as an ordinal variable (T2D, prediabetes, or controls) and used data from all the participants. The binary model modeled the disease status as a binary variable (T2D or controls) and used data from T2D patients and normoglycemic controls. The blue-to-red and purple-to-orange gradients represent the magnitude and direction of the associations as quantified by meta-analyzed beta coefficients from linear mixed models adjusted for age, sex, and body mass index (BMI) and further adjusted for metformin use in MaAsLin2. All the results were corrected for multiple hypothesis testing by controlling the false discovery rate (FDR) using the Benjamini-Hochberg method with a target rate of 0.10. All models included each participant’s identifier as random effects and simultaneously adjusted for covariables. (c) Comparisons in associations between microbial species and T2D between multivariate MaAsLin2 models with and without further adjustment for BMI and metformin use from the ordinal model. (d) Comparisons in associations between microbial species and T2D between multivariate MaAsLin2 models with and without further adjustment for BMI and metformin use from the binary model. Dots in the scatter plots in (c) and (d) represent meta-analyzed beta coefficients from linear mixed models adjusted for covariables in MaAsLin2. All the statistical tests were two-sided. A total of 8,117 metagenomes from 1,851 T2D patients, 2,770 individuals with prediabetes, and 2,277 normoglycemic controls were included in the analyses in (a), (b), and (c). Abbreviations: BMI, body mass index; Con, control; metf, metformin use; insul, insulin use; T2D, type 2 diabetes.
Extended Data Fig. 4: Metformin has a direct impact on the gut microbiome composition and confounds the associations between microbial species and type 2 diabetes.
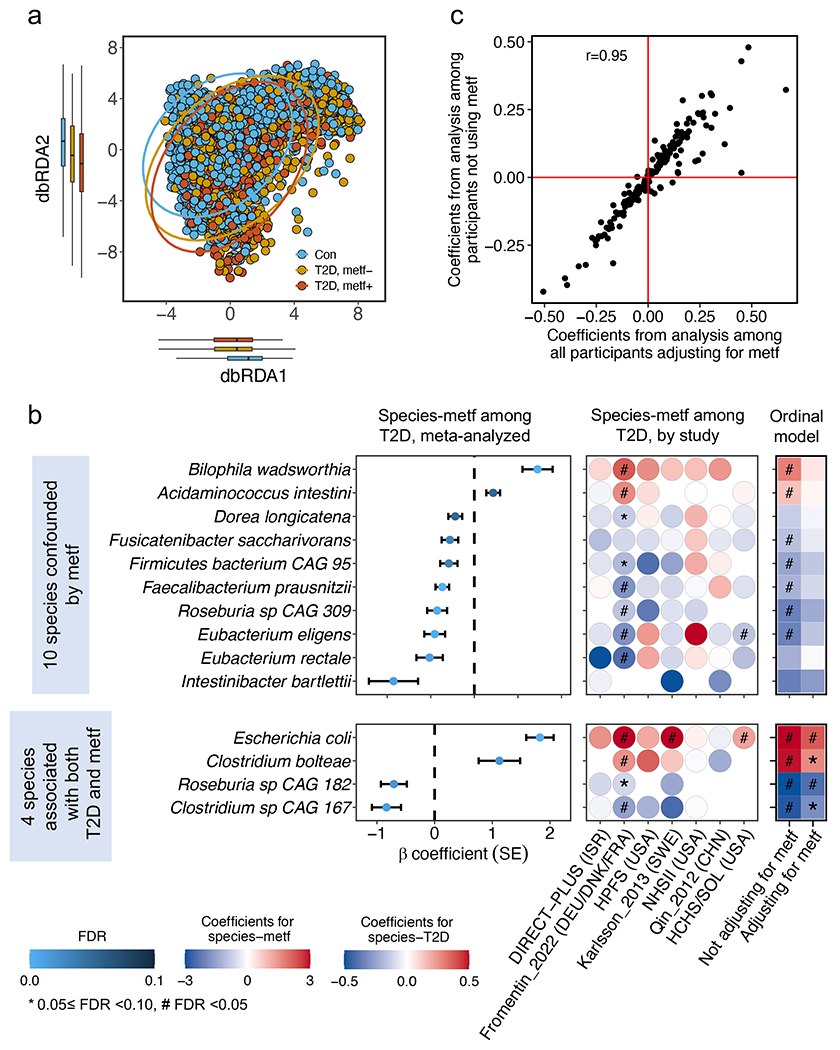
(a) Distance-based redundancy analysis (dbRDA) based on species-level Bray-Curtis dissimilarity colored by type 2 diabetes (T2D) and metformin use. The centers of the boxplot show medians with boxes indicating their inter-quartile ranges (IQRs) and upper and lower whiskers indicating 1.5 times the IQR from above the upper quartile and below the lower quartile, respectively. (b) Meta-analyzed and cohort-specific associations of microbial species with metformin use among T2D patients. We defined microbial signatures of metformin as those significantly associated with metformin use in T2D cases only but not associated with T2D after further adjusting for metformin use in all participants. We also identified 7 species associated with both metformin use and T2D. The centers of the error bars represent the β coefficients of the associations, and the error bars represent their standard errors. (c) Our modeling approach effectively accounted for the potential confounding effect of metformin use, as evidenced by the high correlation between the beta coefficients of species-T2D associations obtained in the primary analysis and those calculated in a sensitivity analysis excluding T2D patients treated with metformin. The beta coefficients in (b) and (c) represent the associations quantified by linear mixed models, adjusting for age, sex, body mass index, and metformin use where appropriate, in MaAsLin2. All the results were corrected for multiple hypothesis testing by controlling the false discovery rate (FDR) using the Benjamini-Hochberg method with a target rate of 0.10. All the analyses in (a), (b), and (c) were based on 5,114 metagenomes from 1,851 T2D patients and 2,277 normoglycemic controls. The statistical tests in (a) and (b) were two-sided. Abbreviations: Con, control; metf, metformin use; T2D, type 2 diabetes.
Extended Data Fig. 5: Sensitivity analyses demonstrate that identified microbial features of type 2 diabetes are unlikely to reflect the duration or comorbidities of this disease.
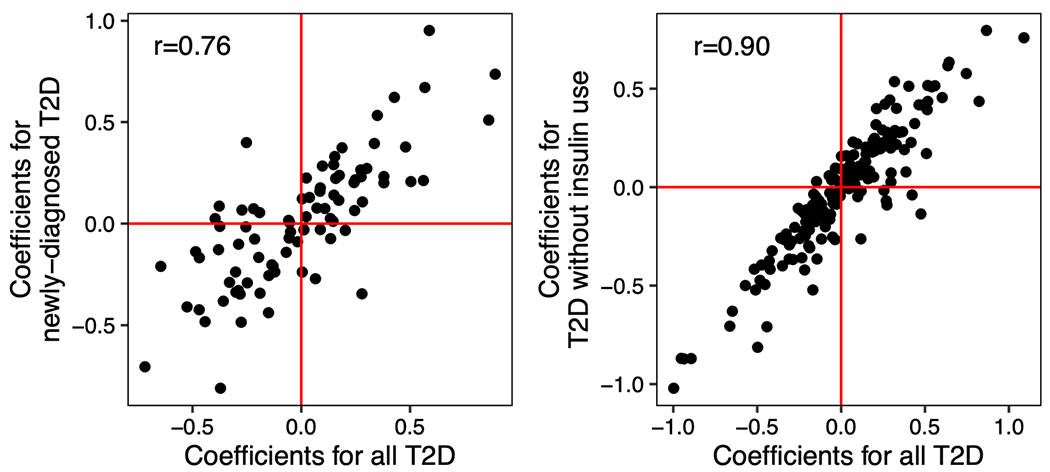
(a) Comparisons in associations between microbial species and T2D in one analysis that includes all study participants and the other that excludes individuals with prevalent T2D in the Hispanic Community Health Study/Study of Latinos. (b) Comparisons in associations between microbial species and T2D in one analysis that includes all study participants and the other analysis that excludes insulin-treated T2D patients. The dots represent the associations quantified by linear mixed models, adjusting for age, sex, body mass index, and metformin use in MaAsLin2. Abbreviation: T2D, type 2 diabetes.
Extended Data Fig. 6: Associations of microbial features with circulating metabolic and inflammation biomarkers.
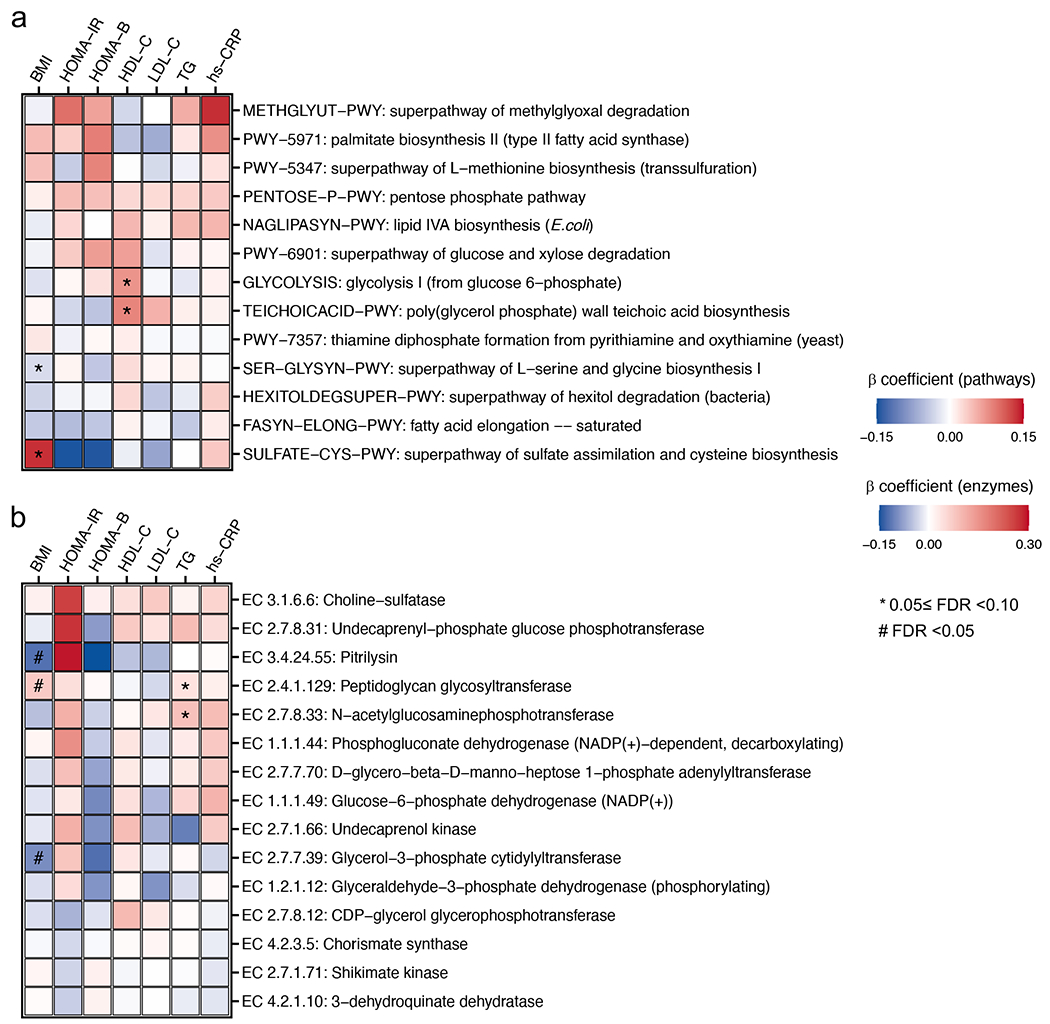
(a) Meta-analyzed associations of individual MetaCyc pathways with circulating biomarkers of metabolic risk. (b) Meta-analyzed associations of individual microbial enzymes with circulating biomarkers of metabolic risk. Only pathways and enzymes listed in Figure 3 were analyzed and presented in this figure. The blue-to-red gradients represent the magnitude and direction of the associations as quantified by meta-analyzed beta coefficients from linear mixed models adjusted for age, sex, body mass index, and metformin use in MaAsLin2. All the results were corrected for multiple hypothesis testing by controlling the false discovery rate (FDR) using the Benjamini-Hochberg method with a target rate of 0.10. Abbreviations: BMI, body mass index; HbA1c, hemoglobin A1c; HDL-C, high-density lipoprotein cholesterol; hs-CRP, high-sensitivity C-reactive protein; HOMA-B, homeostasis model assessment of β-cell function; HOMA-IR, homeostasis model assessment of insulin resistance; LDL-C, low-density lipoprotein cholesterol; TG, triglyceride.
Extended Data Fig. 7: Prevotella copri’s differential carriage of branched-chain amino acid biosynthesis function is explained by its discrete subclade structure.
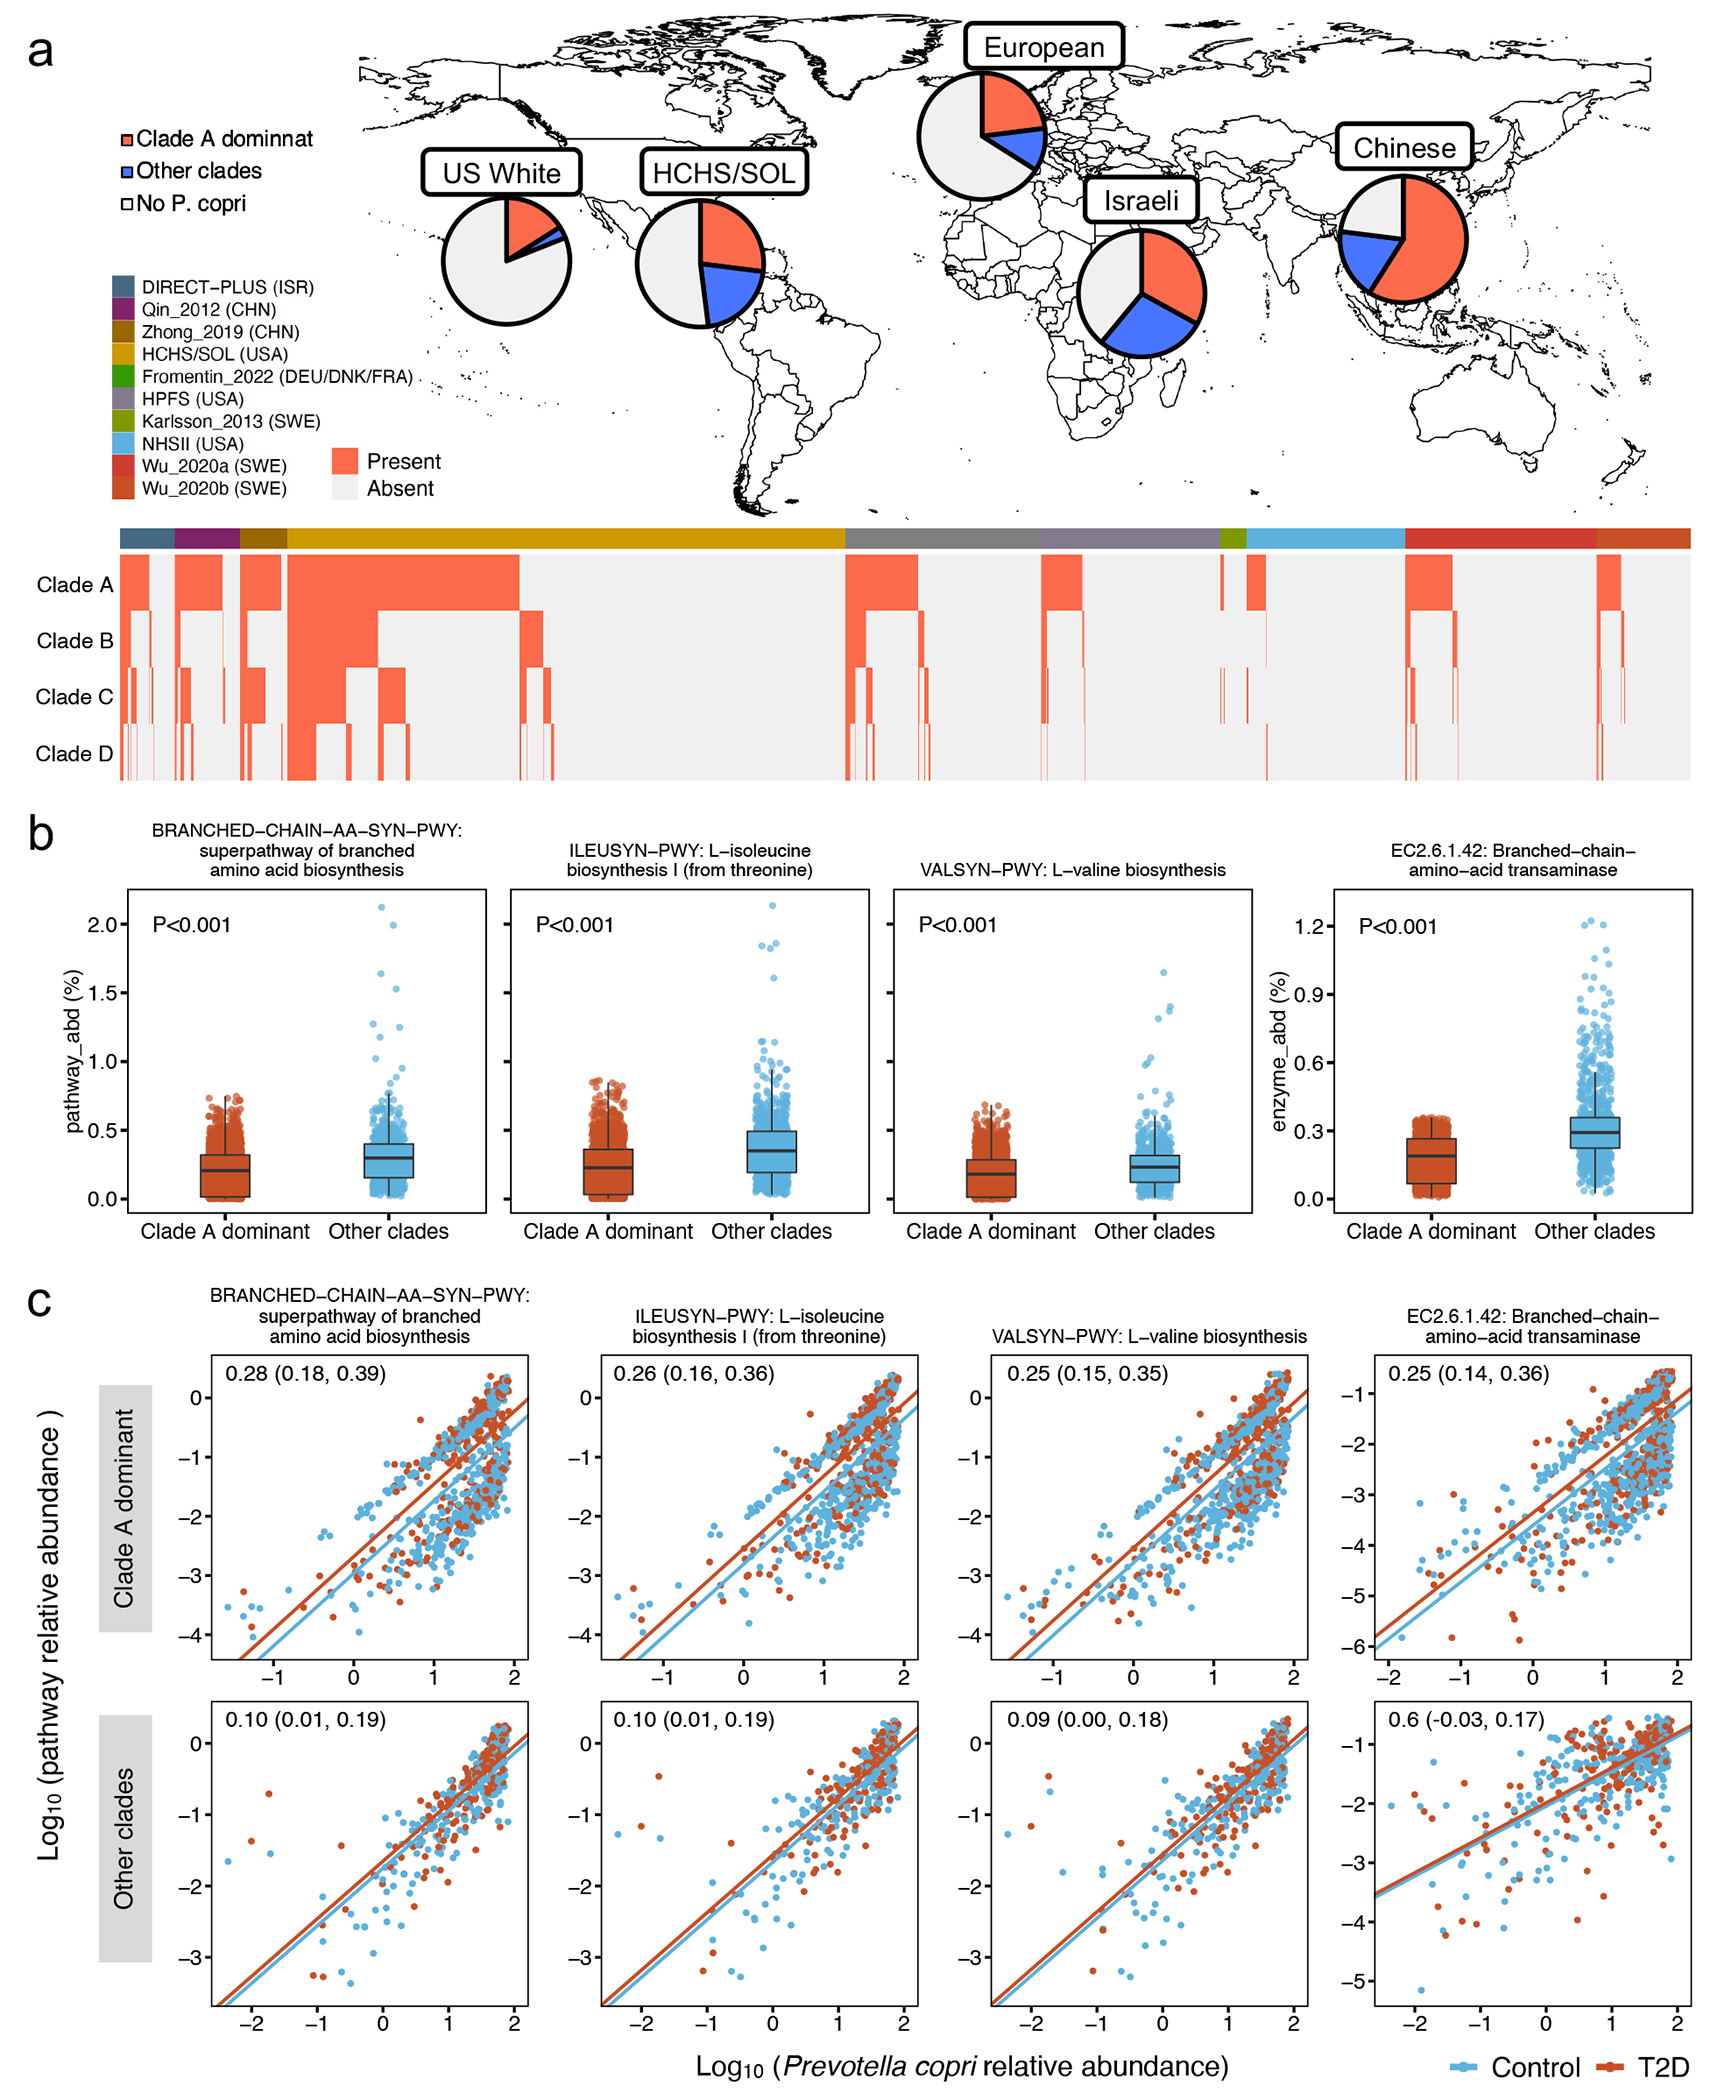
(a) Distribution of different P. copri subclades across geographic regions and studies. We applied MetaPhlAn taxonomic profiling based on P. copri subclade-specific marker genes to detect the presence of a subclade in metagenomes. (b) Comparisons in adjusted relative abundance of branched-chain amino acid (BCAA) biosynthesis pathways and enzyme encoded by P. copri subclades dominated by Clade A vs. other clades. The adjusted relative abundance of pathways and enzymes is estimated by Anpan (ANalysis of microbial Phylogenies And geNes)’s pathway random effects models (Methods) with simultaneous adjustment for age, sex, study, body mass index, metformin use, and the abundance of P. copri subclades. The centers of the boxplot show medians of adjusted relative abundance with boxes indicating their inter-quartile ranges (IQRs) and upper and lower whiskers indicating 1.5 times the IQR from above the upper quartile and below the lower quartile, respectively. P-values were generated from two-sided t-tests based on the adjusted relative abundance. (c) Clade A-dominant P. copri strains in T2D patients were more likely to retain pathways and enzymes of branched-chain amino acid biosynthesis compared to Clade A-dominant non-T2D controls. The blue and red lines, fitted by linear regression in participants with T2D and control participants separately, represent the associations between the log-transformed relative abundance of P. copri subclade and the log-transformed relative abundance of a given pathway or enzyme encoded by P. copri. The numeric values in the top left corner are posterior differences and 98% posterior intervals of differences in log-transformed pathway abundance between case-control status, as determined by mixed effects models Anpan (Methods). This model allows us to identify microbial functions encoded by a P. copri subclade that are differentially abundant between T2D cases vs. controls while controlling for its subclade-level abundance and covariables. All the analyses in (a), (b), and (c) were based on 5,114 metagenomes from 1,851 T2D patients and 2,277 normoglycemic controls.
Extended Data Fig. 8: Phylogenetic trees of select species show divergent associations between subclades and T2D within each species.
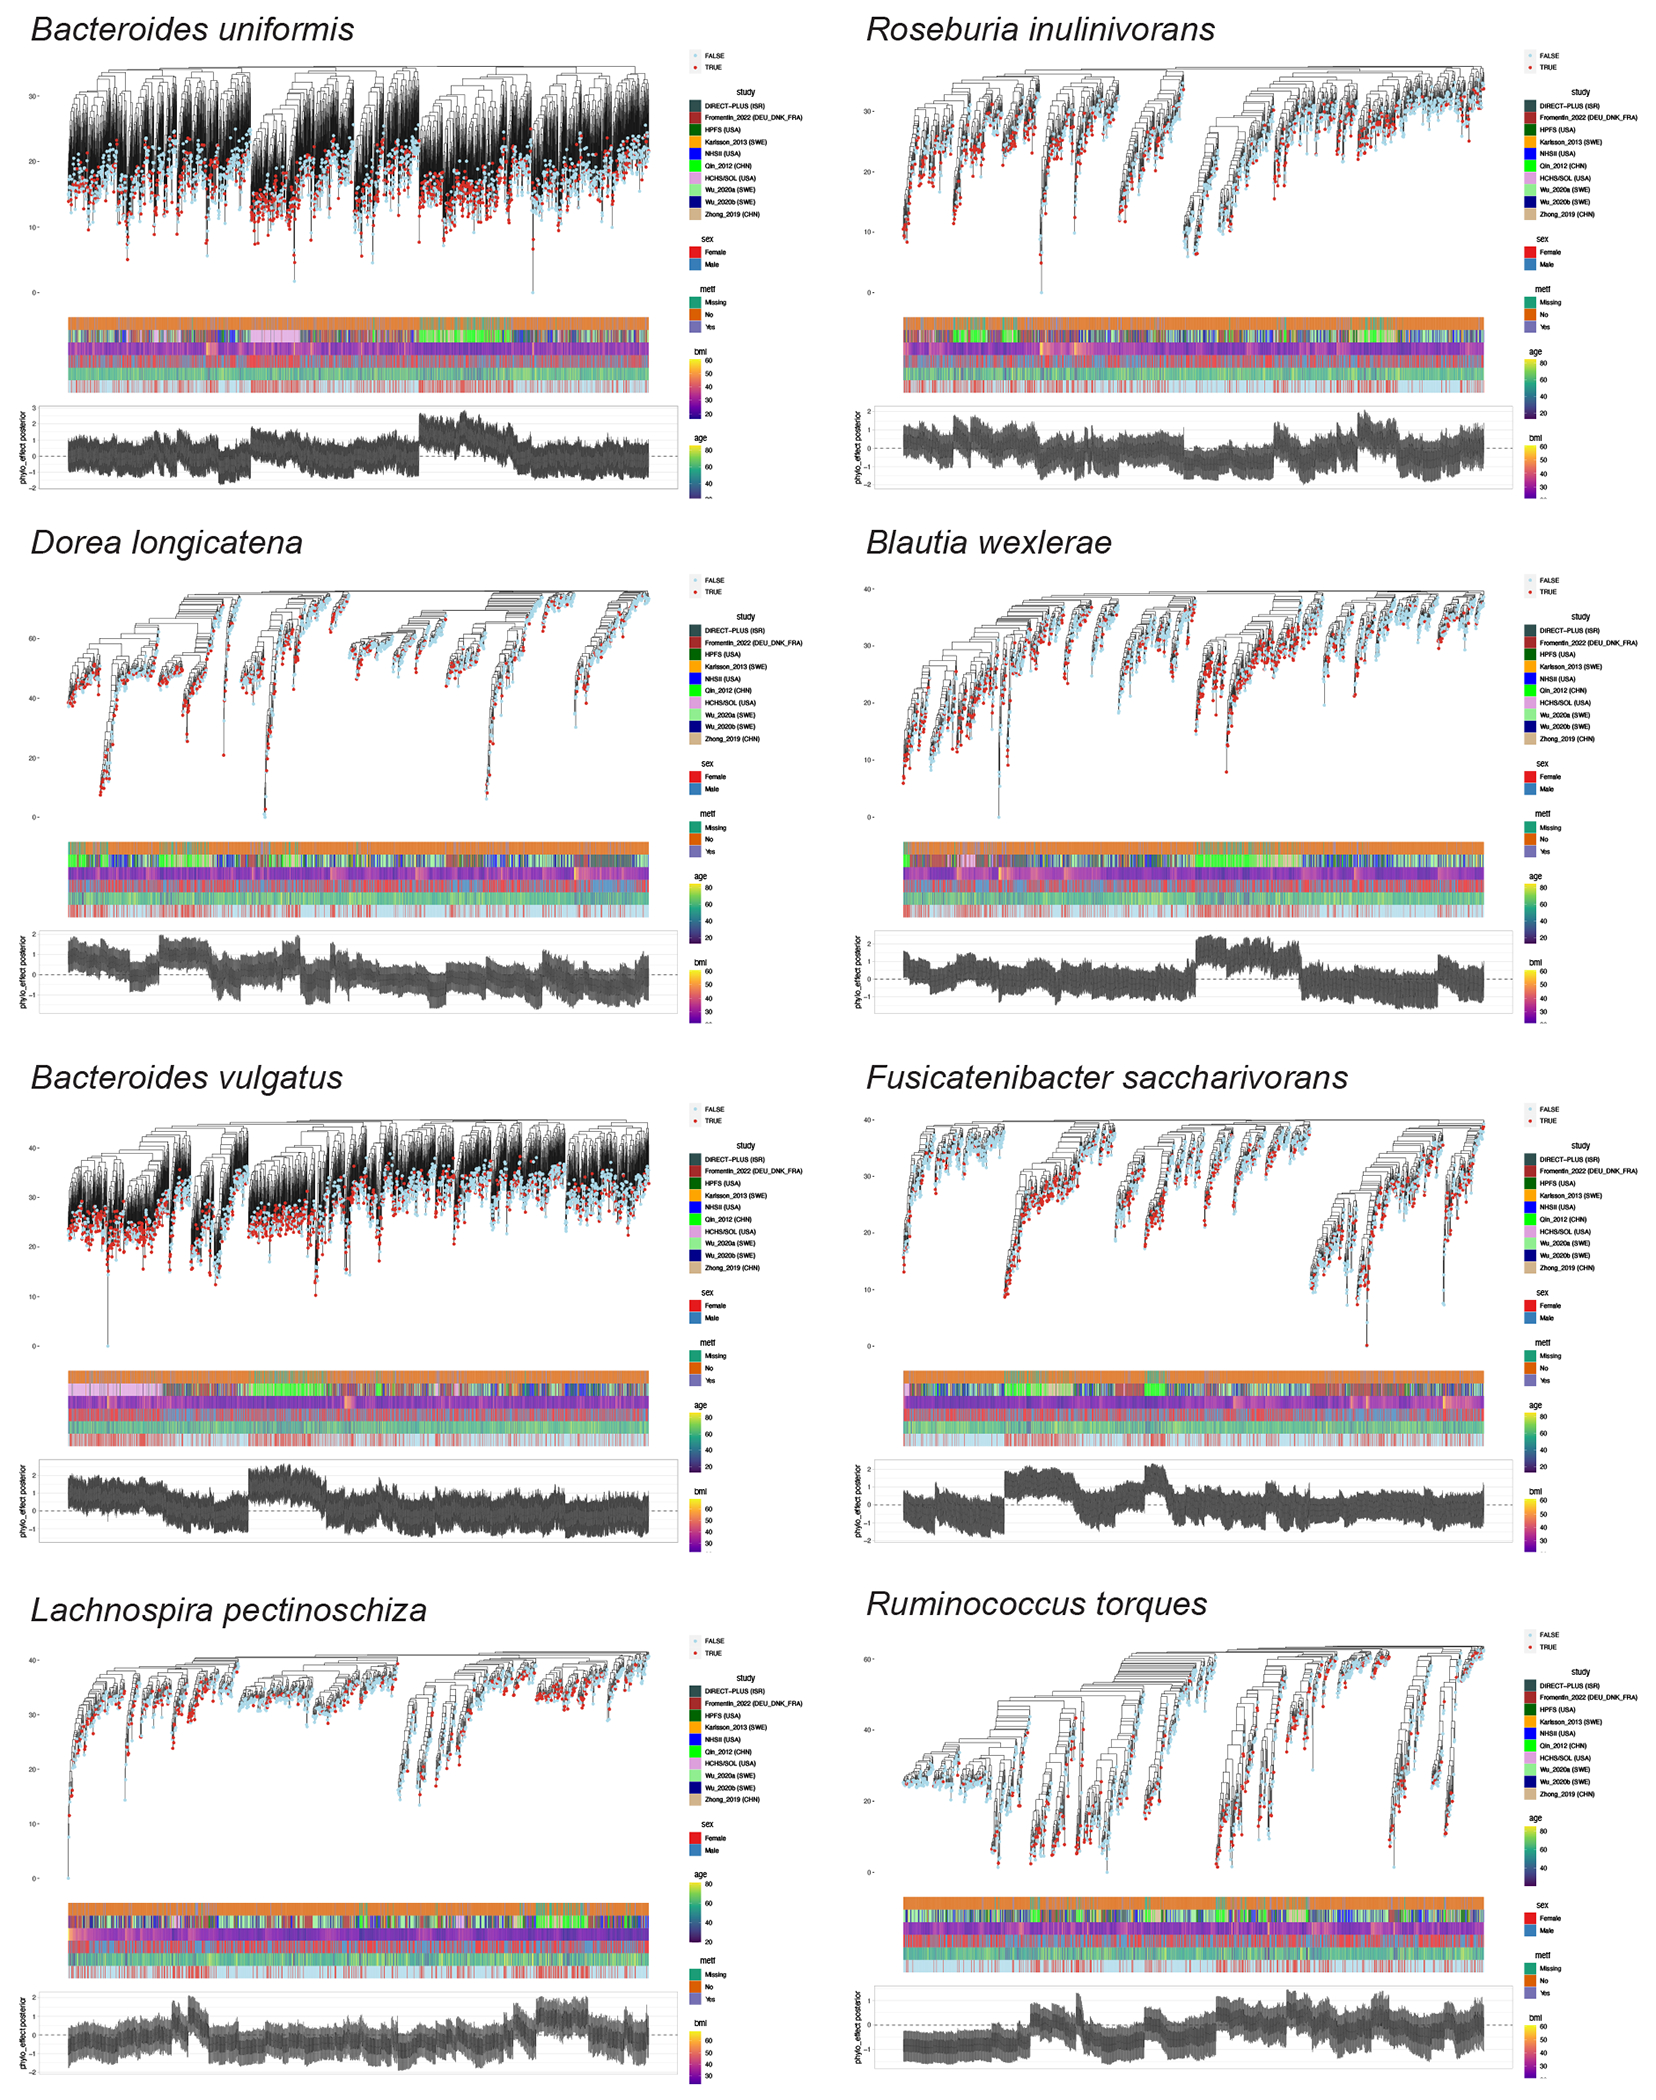
The annotation bars represent metformin use, study, BMI, sex, age, and T2D status, respectively. The boxplots in the bottom represent the posterior mean of the phylogenetic effect of each phylogenetic tree leaf (metagenome) estimated by the phylogenetic generalized linear mixed models (PGLMMs) in Anpan (ANalysis of microbial Phylogenies And geNes, see Methods) with whiskers representing the 95% credible intervals of the posterior means. By applying PGLMMs, we compared two generalized linear mixed models with and without incorporating within-species phylogeny as a random effect (Methods). Both models were adjusted for age, sex, body mass index, metformin use, and study membership as fixed effects. We generated within-species phylogenetic trees by randomly splitting the edges based on the Euclidean similarity matrix derived from clustered sets of protein sequences (UniRef90 gene families) after dimension reduction by principal components analysis.
Extended Data Fig. 9: Gene set enrichment analysis of gene ontology terms for biological process.
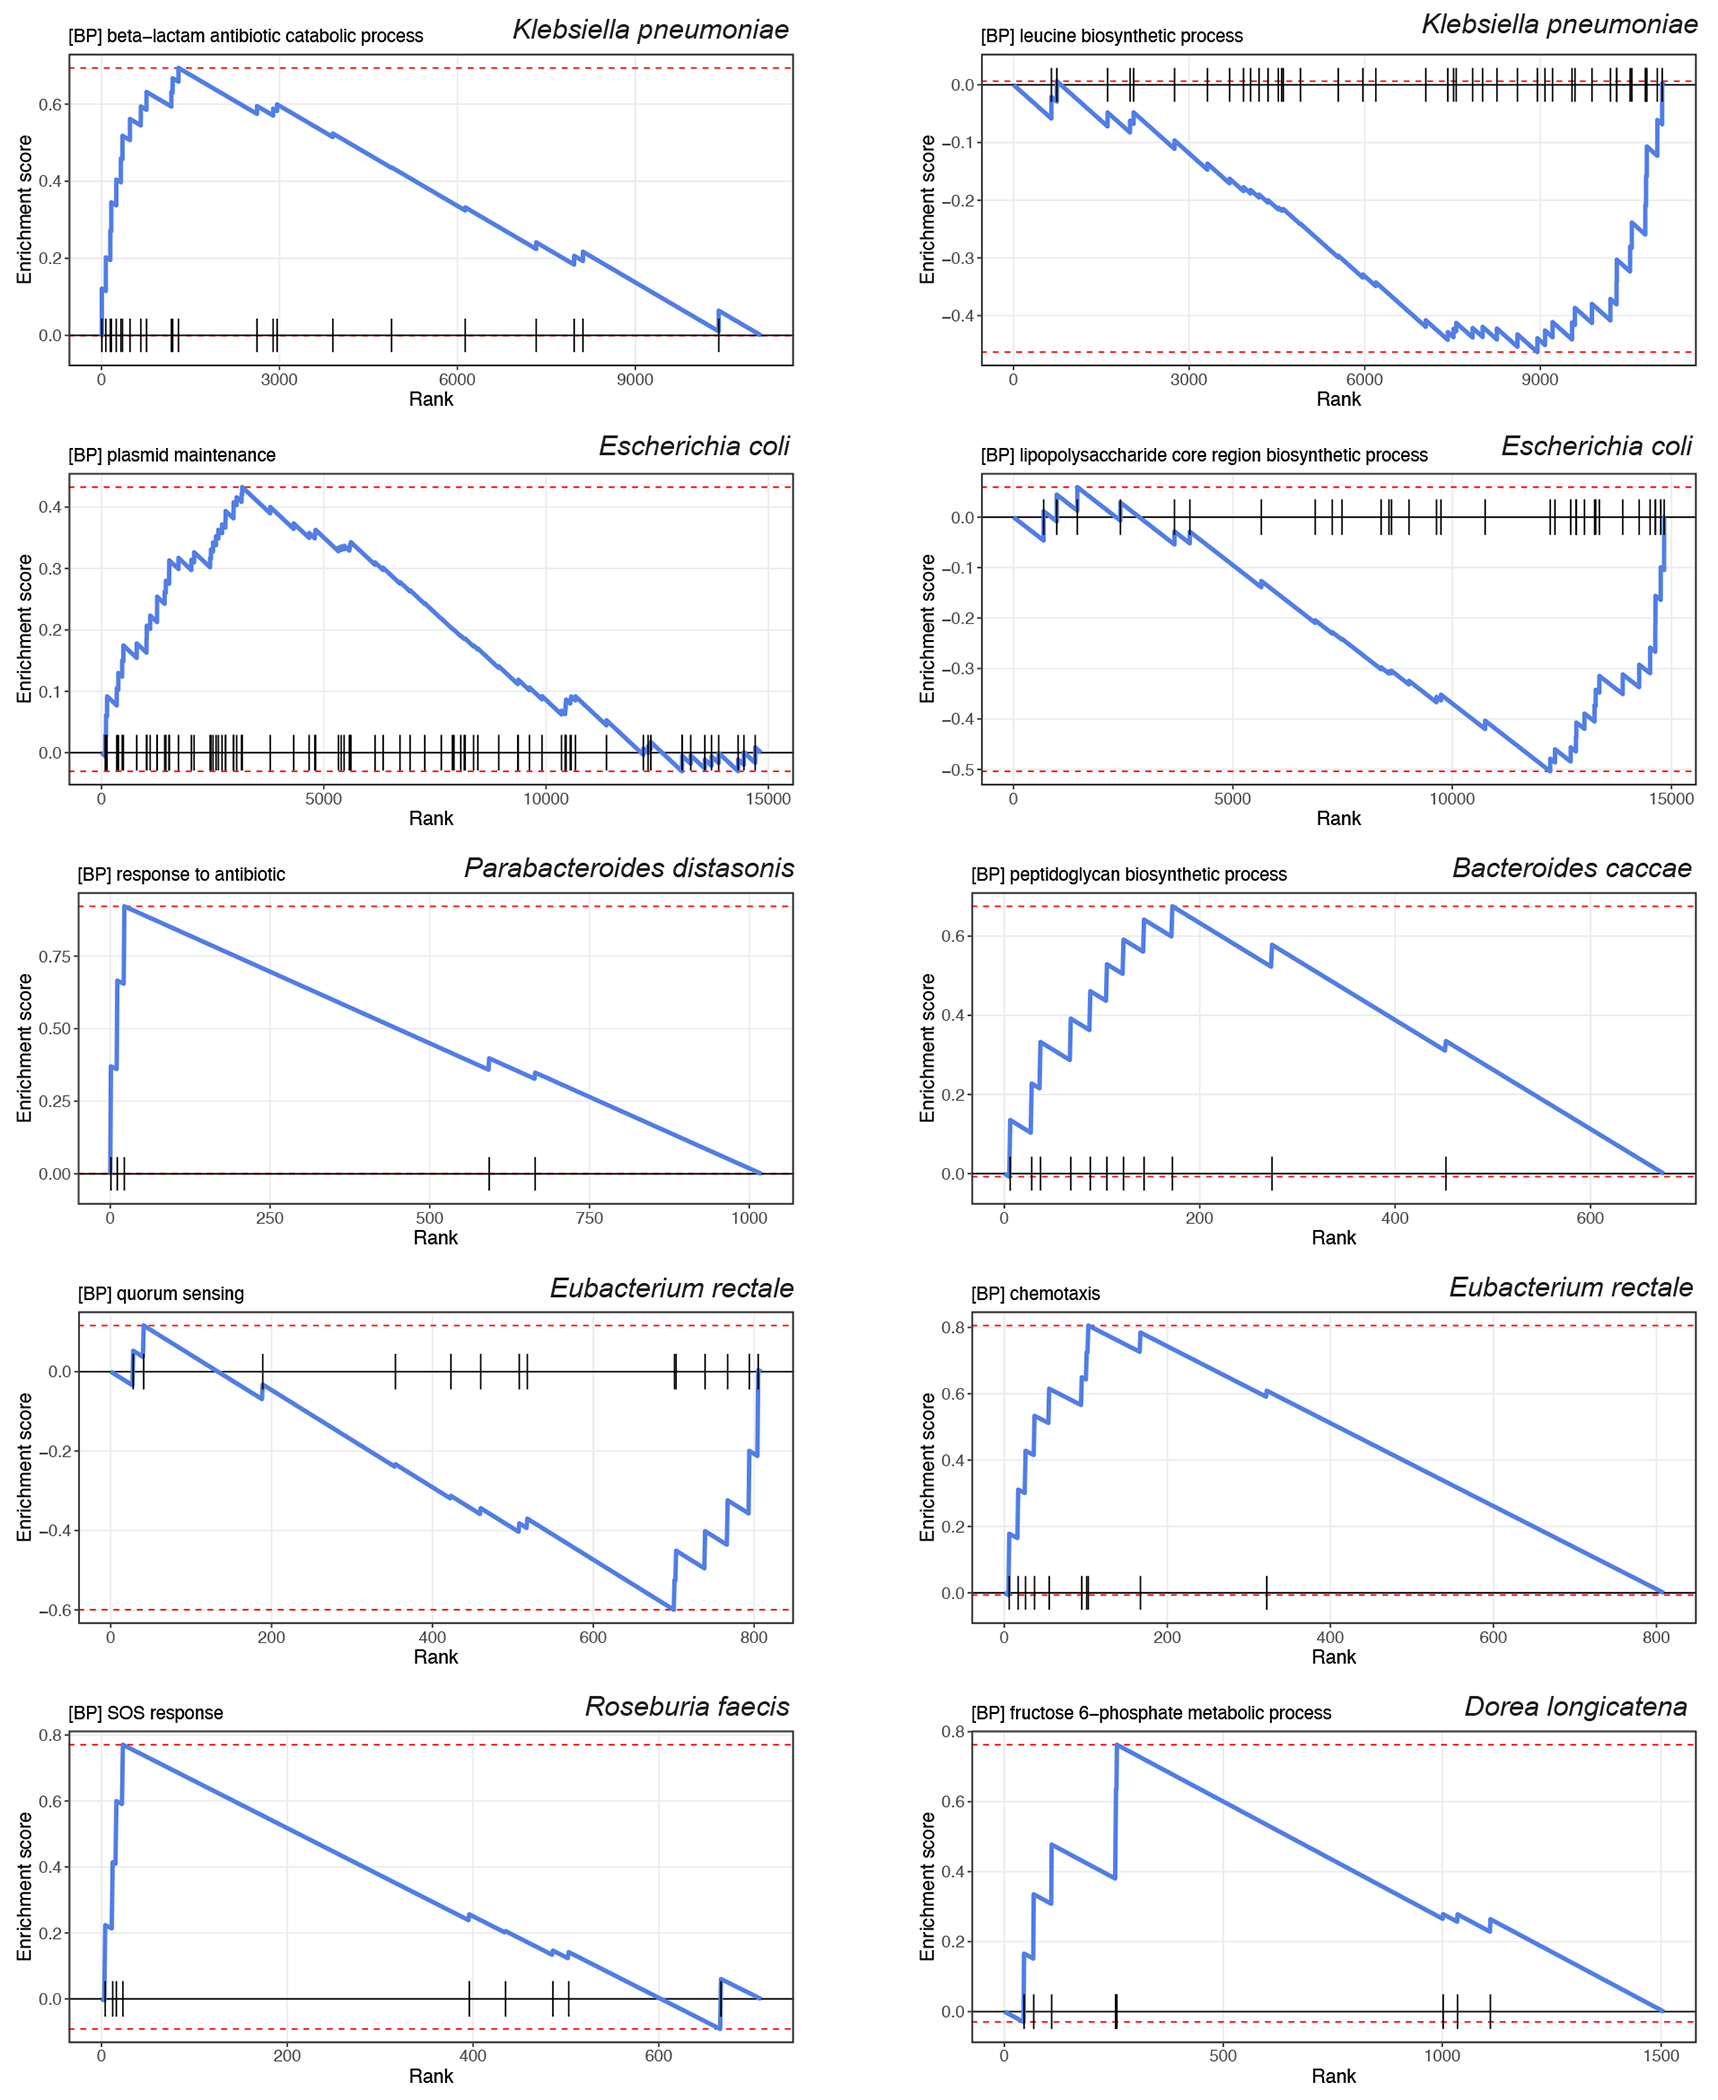
The line plots show the running enrichment score for the gene ontology (GO) term as the analysis “walks down” the ranked list. The vertical black lines on the X-axis show where members of the GO term appear in the ranked list of UniRef90 gene families.
Supplementary Material
Acknowledgments
We thank Dr. Kristine Dennis for coordinating the collection and transfer of the data. We also thank Drs. Fredrik Bäckhed, Karsten Kristiansen, Junhua Li, Huanzi Zhong, and Junjie Qin for sharing their data and helping with the data transfer. We are indebted to the participants in the Health Professionals Follow-up Study (HPFS) and Nurses’ Health Study II (NHSII) for their continuing outstanding level of cooperation and to the staff of the HPFS and NHSII for their valuable contributions. We thank the staff and participants of the Hispanic Community Health Study/Study of Latinos (HCHS/SOL) for their important contributions. We thank the DIRECT-PLUS Study participants for their valuable contributions. We thank Anat Yaskolka-Meir, Gal Tsaban, Alon Kaplan, Hila Zelica, Ilan Youngster, Kieran Tuohy, and Omry Koren for their contribution to the DIRECT-PLUS Study.
This work is funded by the National Institute of Diabetes and Digestive and Kidney Diseases (NIDDK; R00 DK119412 and Boston Nutrition Obesity Research Center Pilot & Feasibility Program grant supported by P30 DK046200 to D.D.W.; R24 DK110499 to D.H.), National Institute of Nursing Research (R01 NR01999 to D.D.W.), National Institute on Aging (R01 AG077489 to D.D.W.), and National Cancer Institute (NCI; R35 CA253185 to A.T.C.). Dr. Andrew T. Chan is an American Cancer Society Research Professor. Dr. Fenglei Wang is supported by the American Heart Association Postdoctoral Fellowship (Grant number: 897161 to F.W.). HPFS is supported by research grants U01 CA167552 (to W.C.W.) and R01 HL035464 (to E.B.R.) from the National Institutes of Health (NIH). The Men’s Lifestyle Validation Study in HPFS was supported by U01 CA152904 (to M.J.S. and E.B.R.) from NCI. The fecal sample collection and metagenomic data sequencing in HPFS were supported by the STARR Cancer Consortium Award (#I7-A714 to C.H.). NHSII was supported by U01 CA176726 from NIH and P01 CA055075 (to W.C.W.) from NCI. The fecal sample collection and metagenomic data sequencing in NHSII were supported by the R01 CA202704 (to A.T.C. and C.H.) from NCI.
The HCHS/SOL is a collaborative study supported by contracts from the National Heart, Lung, and Blood Institute (NHLBI) to the University of North Carolina (HHSN268201300001I/N01-HC-65233), University of Miami (HHSN268201300004I/N01-HC-65234), Albert Einstein College of Medicine (HHSN268201300002I/N01-HC-65235), University of Illinois at Chicago (HHSN268201300003I/N01-HC-65236 Northwestern Univ), and San Diego State University (HHSN268201300005I/N01-HC-65237). The following Institutes/Centers/Offices have contributed to the HCHS/SOL through a transfer of funds to the NHLBI: National Institute on Minority Health and Health Disparities (NIMHD), National Institute on Deafness and Other Communication Disorders, National Institute of Dental and Craniofacial Research, NIDDK, National Institute of Neurological Disorders and Stroke, NIH Institution-Office of Dietary Supplements. Additional funding for the “Gut Origins of Latino Diabetes” ancillary study to HCHS/SOL was provided by R01 MD011389 (to R.C.K., R.D.B, and R.K.) from the NIMHD and the Life Course Methodology Core at Albert Einstein College of Medicine and the New York Regional Center for Diabetes Translation Research (P30 DK111022-8786 and P30 DK111022) through funds from NIDDK. Additional funding for this work was provided by R01 HL060712 (to F.B.H. and Q.Q.) from NHLBI.
The DIRECT-PLUS Study was funded by grants from the Deutsche Forschungsgemeinschaft (DFG, German Research Foundation) Collaborative Research Center SFB1052 ‘Obesity Mechanisms’ (SFB-1052/B11 to I.S.); Israel Ministry of Health grant 87472511 (to I.S.); Israel Ministry of Science and Technology grant 3-13604 (to I.S.); California Walnuts Commission (to I.S.) and the CABALA_DIET&HEALTH Project which received funding from the European Union’s Horizon 2020 Program.
The funding source had no role in the design and conduct of the study; collection, management, analysis, and interpretation of the data; preparation, review, or approval of the manuscript; and the decision to submit the manuscript for publication. The content is solely the responsibility of the authors and does not necessarily represent the official views of the NIH.
The computations in this paper were run in part on the FASRC Cannon cluster supported by the FAS Division of Science Research Computing Group at Harvard University.
Footnotes
Code availability
This study mainly relies on open-source bioinformatic tools described in detail in Methods. The analysis-specific programs are publicly available through https://github.com/DW-Group/T2D_Microbiome_Meta-analysis.
Competing interests
C.H. is a member of the scientific advisory board for Zoe Nutrition, Empress Therapeutics, and Seres Therapeutics. The other authors declare no competing interests.
Data availability
The individual-level raw shotgun sequencing data and metadata have been deposited in the European Nucleotide Archive with accession codes PRJEB37249, PRJEB38742, PRJEB41311, and PRJEB46098 for the Fromentin_2022 (MetaCardis); the Sequence Read Archive (SRA) under accession code ERP002469 for Karlsson_2013; the NCBI Sequence Read Archive under accession numbers SRA045646 and SRA050230 for Qin_2012 (Shenzhen Cohort); the China NGDC Genome Sequence Archive: HRA000020 or EGA: EGAS00001004480 for Wu_2020; and the China Nucleotide Sequence Archive (CNSA) with the dataset identifier CNP0000175 for Zhong_2019 (Suzhou Cohort).
The shotgun metagenomic sequencing data from the Nurses’ Health Study II (NHSII) and Health Professionals Follow-Up Study (HPFS) are publicly available at BIOM-Mass Data Portal (https://biom-mass.org/; project names: HPFS and MBS). Due to the informed consent of the participants, all the individual-level phenotype data from NHSII and HPFS are available through a request for external collaboration and upon approval of a letter of intent and a research proposal. Details on how to request external collaborations with NHSII and HPFS can be found at https://nurseshealthstudy.org/researchers (Contact PI: Dr. A. Heather Eliassen, Email: nhahe@channing.harvard.edu) and https://sites.sph.harvard.edu/hpfs/for-collaborators/. (Contact PI: Dr. Lorelei Mucci, Email: lmucci@hsph.harvard.edu). The individual-level metadata in the Hispanic Community Health Study /Study of Latinos (HCHS/SOL) are archived at the National Institutes of Health repositories dbGap (study accession: phs000810.v2.p2) and BIOLINCC (accession number: HLB01141423a). Shotgun metagenomic sequencing data from the HCHS/SOL samples described in this study are deposited in QIITA (study ID: 11666). HCHS/SOL has established a process for the scientific community to apply for access to participant data and materials, with such requests reviewed by the project’s Steering Committee. These policies are described at https://sites.cscc.unc.edu/hchs/ (Contact HCHS/SOL through Email: HCHSAdministration@unc.edu). The DIRECT-PLUS Study recruited participants in Israel and was designed as a clinical trial. This study used only baseline, pre-randomization data from the DIRECT-PLUS Study for an observational analysis. Due to the informed consent of the participants, the individual-level deidentified metadata and metagenomic sequencing data in the DIRECT-PLUS Study will be available for general research purposes through a request to Dr. Iris Shai (Email: irish@bgu.ac.il) and Dr. Dong D. Wang (Email: dow471@mail.harvard.edu) after the manuscript publication.
All the source data for creating figures and extended data figures are available as supplementary information.
References
- 1.IDF Diabetes Atlas 2021. (https://diabetesatlas.org/atlas/tenth-edition/). [Google Scholar]
- 2.American Diabetes Association Professional Practice, C. 2. Classification and Diagnosis of Diabetes: Standards of Medical Care in Diabetes-2022. Diabetes Care 45, S17–S38 (2022). [DOI] [PubMed] [Google Scholar]
- 3.Canfora EE, Meex RCR, Venema K & Blaak EE Gut microbial metabolites in obesity, NAFLD and T2DM. Nat Rev Endocrinol 15, 261–273 (2019). [DOI] [PubMed] [Google Scholar]
- 4.Forslund K, et al. Disentangling type 2 diabetes and metformin treatment signatures in the human gut microbiota. Nature 528, 262–266 (2015). [DOI] [PMC free article] [PubMed] [Google Scholar]
- 5.Karlsson FH, et al. Gut metagenome in European women with normal, impaired and diabetic glucose control. Nature 498, 99–103 (2013). [DOI] [PubMed] [Google Scholar]
- 6.Qin J, et al. A metagenome-wide association study of gut microbiota in type 2 diabetes. Nature 490, 55–60 (2012). [DOI] [PubMed] [Google Scholar]
- 7.Reitmeier S, et al. Arrhythmic Gut Microbiome Signatures Predict Risk of Type 2 Diabetes. Cell Host Microbe 28, 258–272 e256 (2020). [DOI] [PubMed] [Google Scholar]
- 8.Sankaranarayanan K, et al. Gut Microbiome Diversity among Cheyenne and Arapaho Individuals from Western Oklahoma. Curr Biol 25, 3161–3169 (2015). [DOI] [PMC free article] [PubMed] [Google Scholar]
- 9.Thingholm LB, et al. Obese Individuals with and without Type 2 Diabetes Show Different Gut Microbial Functional Capacity and Composition. Cell Host Microbe 26, 252–264 e210 (2019). [DOI] [PMC free article] [PubMed] [Google Scholar]
- 10.Wu H, et al. The Gut Microbiota in Prediabetes and Diabetes: A Population-Based Cross-Sectional Study. Cell Metab 32, 379–390 e373 (2020). [DOI] [PubMed] [Google Scholar]
- 11.Zhong H, et al. Distinct gut metagenomics and metaproteomics signatures in prediabetics and treatment-naive type 2 diabetics. EBioMedicine 47, 373–383 (2019). [DOI] [PMC free article] [PubMed] [Google Scholar]
- 12.Sonnenburg JL & Bäckhed F Diet-microbiota interactions as moderators of human metabolism. Nature 535, 56–64 (2016). [DOI] [PMC free article] [PubMed] [Google Scholar]
- 13.Pedersen HK, et al. Human gut microbes impact host serum metabolome and insulin sensitivity. Nature 535, 376–381 (2016). [DOI] [PubMed] [Google Scholar]
- 14.Dobrindt U, Chowdary MG, Krumbholz G & Hacker J Genome dynamics and its impact on evolution of Escherichia coli. Med Microbiol Immunol 199, 145–154 (2010). [DOI] [PubMed] [Google Scholar]
- 15.Van Rossum T, Ferretti P, Maistrenko OM & Bork P Diversity within species: interpreting strains in microbiomes. Nat Rev Microbiol 18, 491–506 (2020). [DOI] [PMC free article] [PubMed] [Google Scholar]
- 16.Fromentin S, et al. Microbiome and metabolome features of the cardiometabolic disease spectrum. Nat Med 28, 303–314 (2022). [DOI] [PMC free article] [PubMed] [Google Scholar]
- 17.Beghini F, et al. Integrating taxonomic, functional, and strain-level profiling of diverse microbial communities with bioBakery 3. Elife 10(2021). [DOI] [PMC free article] [PubMed] [Google Scholar]
- 18.Ma S, et al. Population structure discovery in meta-analyzed microbial communities and inflammatory bowel disease using MMUPHin. Genome Biol 23, 208 (2022). [DOI] [PMC free article] [PubMed] [Google Scholar]
- 19.Mallick H, et al. Multivariable association discovery in population-scale meta-omics studies. PLoS Comput Biol 17, e1009442 (2021). [DOI] [PMC free article] [PubMed] [Google Scholar]
- 20.Thomas AM, et al. Metagenomic analysis of colorectal cancer datasets identifies cross-cohort microbial diagnostic signatures and a link with choline degradation. Nat Med 25, 667–678 (2019). [DOI] [PMC free article] [PubMed] [Google Scholar]
- 21.Ruuskanen MO, et al. Gut Microbiome Composition Is Predictive of Incident Type 2 Diabetes in a Population Cohort of 5,572 Finnish Adults. Diabetes Care 45, 811–818 (2022). [DOI] [PMC free article] [PubMed] [Google Scholar]
- 22.Atarashi K, et al. Ectopic colonization of oral bacteria in the intestine drives T(H)1 cell induction and inflammation. Science 358, 359–365 (2017). [DOI] [PMC free article] [PubMed] [Google Scholar]
- 23.Clooney AG, et al. Ranking microbiome variance in inflammatory bowel disease: a large longitudinal intercontinental study. Gut 70, 499–510 (2021). [DOI] [PMC free article] [PubMed] [Google Scholar]
- 24.Cohen-Poradosu R, McLoughlin RM, Lee JC & Kasper DL Bacteroides fragilis-stimulated interleukin-10 contains expanding disease. J Infect Dis 204, 363–371 (2011). [DOI] [PubMed] [Google Scholar]
- 25.Garcia-Lopez M, et al. Analysis of 1,000 Type-Strain Genomes Improves Taxonomic Classification of Bacteroidetes. Front Microbiol 10, 2083 (2019). [DOI] [PMC free article] [PubMed] [Google Scholar]
- 26.Petersen C, et al. T cell-mediated regulation of the microbiota protects against obesity. Science 365(2019). [DOI] [PMC free article] [PubMed] [Google Scholar]
- 27.Fung TC, et al. Intestinal serotonin and fluoxetine exposure modulate bacterial colonization in the gut. Nat Microbiol 4, 2064–2073 (2019). [DOI] [PMC free article] [PubMed] [Google Scholar]
- 28.Riester M, et al. Risk prediction for late-stage ovarian cancer by meta-analysis of 1525 patient samples. J Natl Cancer Inst 106(2014). [DOI] [PMC free article] [PubMed] [Google Scholar]
- 29.Wu H, et al. Metformin alters the gut microbiome of individuals with treatment-naive type 2 diabetes, contributing to the therapeutic effects of the drug. Nat Med 23, 850–858 (2017). [DOI] [PubMed] [Google Scholar]
- 30.Forslund SK, et al. Combinatorial, additive and dose-dependent drug-microbiome associations. Nature 600, 500–505 (2021). [DOI] [PubMed] [Google Scholar]
- 31.Caspi R, et al. The MetaCyc database of metabolic pathways and enzymes - a 2019 update. Nucleic Acids Res 48, D445–D453 (2020). [DOI] [PMC free article] [PubMed] [Google Scholar]
- 32.Anastasi A, Knight CG & Barrett AJ Characterization of the bacterial metalloendopeptidase pitrilysin by use of a continuous fluorescence assay. Biochem J 290 ( Pt 2), 601–607 (1993). [DOI] [PMC free article] [PubMed] [Google Scholar]
- 33.Roden M & Shulman GI The integrative biology of type 2 diabetes. Nature 576, 51–60 (2019). [DOI] [PubMed] [Google Scholar]
- 34.Vatanen T, et al. Variation in Microbiome LPS Immunogenicity Contributes to Autoimmunity in Humans. Cell 165, 842–853 (2016). [DOI] [PMC free article] [PubMed] [Google Scholar]
- 35.Wang DD, et al. The gut microbiome modulates the protective association between a Mediterranean diet and cardiometabolic disease risk. Nat Med 27, 333–343 (2021). [DOI] [PMC free article] [PubMed] [Google Scholar]
- 36.Wang DD, et al. The Gut Microbiome Modifies the Association Between a Mediterranean Diet and Diabetes in USA Hispanic/ Latino Population. J Clin Endocrinol Metab 107, e924–e934 (2022). [DOI] [PMC free article] [PubMed] [Google Scholar]
- 37.Tett A, et al. The Prevotella copri Complex Comprises Four Distinct Clades Underrepresented in Westernized Populations. Cell Host Microbe 26, 666–679 e667 (2019). [DOI] [PMC free article] [PubMed] [Google Scholar]
- 38.Truong DT, Tett A, Pasolli E, Huttenhower C & Segata N Microbial strain-level population structure and genetic diversity from metagenomes. Genome Res 27, 626–638 (2017). [DOI] [PMC free article] [PubMed] [Google Scholar]
- 39.Vangay P, et al. US Immigration Westernizes the Human Gut Microbiome. Cell 175, 962–972 e910 (2018). [DOI] [PMC free article] [PubMed] [Google Scholar]
- 40.Wang TJ, et al. Metabolite profiles and the risk of developing diabetes. Nat Med 17, 448–453 (2011). [DOI] [PMC free article] [PubMed] [Google Scholar]
- 41.Karcher N, et al. Analysis of 1321 Eubacterium rectale genomes from metagenomes uncovers complex phylogeographic population structure and subspecies functional adaptations. Genome Biol 21, 138 (2020). [DOI] [PMC free article] [PubMed] [Google Scholar]
- 42.Beghini F, et al. Large-scale comparative metagenomics of Blastocystis, a common member of the human gut microbiome. Isme j 11, 2848–2863 (2017). [DOI] [PMC free article] [PubMed] [Google Scholar]
- 43.Hildebrand F, et al. Dispersal strategies shape persistence and evolution of human gut bacteria. Cell Host Microbe 29, 1167–1176 e1169 (2021). [DOI] [PMC free article] [PubMed] [Google Scholar]
- 44.Kaper JB, Nataro JP & Mobley HL Pathogenic Escherichia coli. Nat Rev Microbiol 2, 123–140 (2004). [DOI] [PubMed] [Google Scholar]
- 45.Borodovich T, Shkoporov AN, Ross RP & Hill C Phage-mediated horizontal gene transfer and its implications for the human gut microbiome. Gastroenterol Rep (Oxf) 10, goac012 (2022). [DOI] [PMC free article] [PubMed] [Google Scholar]
- 46.Bobay LM, Traverse CC & Ochman H Impermanence of bacterial clones. Proc Natl Acad Sci U S A 112, 8893–8900 (2015). [DOI] [PMC free article] [PubMed] [Google Scholar]
- 47.Navarro-Garcia F & Elias WP Autotransporters and virulence of enteroaggregative E. coli. Gut Microbes 2, 13–24 (2011). [DOI] [PubMed] [Google Scholar]
- 48.Cani PD, et al. Metabolic endotoxemia initiates obesity and insulin resistance. Diabetes 56, 1761–1772 (2007). [DOI] [PubMed] [Google Scholar]
- 49.Vazquez-Lopez J & Navarro-Garcia F In silico Analyses of Core Proteins and Putative Effector and Immunity Proteins for T6SS in Enterohemorrhagic E. coli. Front Cell Infect Microbiol 10, 195 (2020). [DOI] [PMC free article] [PubMed] [Google Scholar]
- 50.Ahmed SA, et al. Genomic comparison of Escherichia coli O104:H4 isolates from 2009 and 2011 reveals plasmid, and prophage heterogeneity, including shiga toxin encoding phage stx2. PLoS One 7, e48228 (2012). [DOI] [PMC free article] [PubMed] [Google Scholar]
- 51.Sun H, et al. Regulation of flagellar motility and biosynthesis in enterohemorrhagic Escherichia coli O157:H7. Gut Microbes 14, 2110822 (2022). [DOI] [PMC free article] [PubMed] [Google Scholar]
- 52.Chaban B, Hughes HV & Beeby M The flagellum in bacterial pathogens: For motility and a whole lot more. Semin Cell Dev Biol 46, 91–103 (2015). [DOI] [PubMed] [Google Scholar]
- 53.Lux R & Shi W Chemotaxis-guided movements in bacteria. Crit Rev Oral Biol Med 15, 207–220 (2004). [DOI] [PubMed] [Google Scholar]
- 54.Ng WL & Bassler BL Bacterial quorum-sensing network architectures. Annu Rev Genet 43, 197–222 (2009). [DOI] [PMC free article] [PubMed] [Google Scholar]
- 55.Everard A, et al. Cross-talk between Akkermansia muciniphila and intestinal epithelium controls diet-induced obesity. Proc Natl Acad Sci U S A 110, 9066–9071 (2013). [DOI] [PMC free article] [PubMed] [Google Scholar]
- 56.Yaskolka Meir A, et al. Effect of green-Mediterranean diet on intrahepatic fat: the DIRECT PLUS randomised controlled trial. Gut 70, 2085–2095 (2021). [DOI] [PMC free article] [PubMed] [Google Scholar]
- 57.Hillmann B, et al. Evaluating the Information Content of Shallow Shotgun Metagenomics. mSystems 3(2018). [DOI] [PMC free article] [PubMed] [Google Scholar]
- 58.Dore J, Ehrlich SD, Levenez F, Pelletier E, Alberti A, Bertrand L, Bork P, Costea PI, Sunagawa S, Guarner F, Manichanh C, Santiago A, Zhao L, Shen J, Zhang C, Versalovic J, Luna RA, Petrosino J, Yang H, Li S, Wang J, Allen - Vercoe E, Gloor G, Singh B and IHMS Consortium. IHMS_SOP 05 V1: Standard operating procedure for fecal samples preserved in stabilizing solution self - collection, laboratory analysis handled within 24 hours to 7 days (24 hours < x ≤ 7 days). International Human Microbiome Standards. (2015). [Google Scholar]
- 59.Salonen A, et al. Comparative analysis of fecal DNA extraction methods with phylogenetic microarray: effective recovery of bacterial and archaeal DNA using mechanical cell lysis. J Microbiol Methods 81, 127–134 (2010). [DOI] [PubMed] [Google Scholar]
- 60.Courtois S, et al. Recombinant environmental libraries provide access to microbial diversity for drug discovery from natural products. Appl Environ Microbiol 69, 49–55 (2003). [DOI] [PMC free article] [PubMed] [Google Scholar]
- 61.Deschasaux M, et al. Depicting the composition of gut microbiota in a population with varied ethnic origins but shared geography. Nat Med 24, 1526–1531 (2018). [DOI] [PubMed] [Google Scholar]
- 62.Fang C, et al. Assessment of the cPAS-based BGISEQ-500 platform for metagenomic sequencing. Gigascience 7, 1–8 (2018). [DOI] [PMC free article] [PubMed] [Google Scholar]
- 63.Matthews DR, et al. Homeostasis model assessment: insulin resistance and beta-cell function from fasting plasma glucose and insulin concentrations in man. Diabetologia 28, 412–419 (1985). [DOI] [PubMed] [Google Scholar]
- 64.Langmead B & Salzberg SL Fast gapped-read alignment with Bowtie 2. Nat Methods 9, 357–359 (2012). [DOI] [PMC free article] [PubMed] [Google Scholar]
- 65.Suzek BE, Huang H, McGarvey P, Mazumder R & Wu CH UniRef: comprehensive and non-redundant UniProt reference clusters. Bioinformatics 23, 1282–1288 (2007). [DOI] [PubMed] [Google Scholar]
- 66.Buchfink B, Xie C & Huson DH Fast and sensitive protein alignment using DIAMOND. Nat Methods 12, 59–60 (2015). [DOI] [PubMed] [Google Scholar]
- 67.Caspi R, et al. The MetaCyc database of metabolic pathways and enzymes and the BioCyc collection of pathway/genome databases. Nucleic Acids Res 44, D471–480 (2016). [DOI] [PMC free article] [PubMed] [Google Scholar]
- 68.Ye Y & Doak TG A parsimony approach to biological pathway reconstruction/inference for genomes and metagenomes. PLoS Comput Biol 5, e1000465 (2009). [DOI] [PMC free article] [PubMed] [Google Scholar]
- 69.Mirdita M, et al. Uniclust databases of clustered and deeply annotated protein sequences and alignments. Nucleic Acids Res 45, D170–D176 (2017). [DOI] [PMC free article] [PubMed] [Google Scholar]
- 70.Johnson WE, Li C & Rabinovic A Adjusting batch effects in microarray expression data using empirical Bayes methods. Biostatistics 8, 118–127 (2007). [DOI] [PubMed] [Google Scholar]
- 71.Pasolli E, Truong DT, Malik F, Waldron L & Segata N Machine Learning Meta-analysis of Large Metagenomic Datasets: Tools and Biological Insights. PLoS Comput Biol 12, e1004977 (2016). [DOI] [PMC free article] [PubMed] [Google Scholar]
- 72.Carpenter B, et al. Stan: A Probabilistic Programming Language. J Stat Softw 76(2017). [DOI] [PMC free article] [PubMed] [Google Scholar]
- 73.Paradis E, Claude J & Strimmer K APE: Analyses of Phylogenetics and Evolution in R language. Bioinformatics 20, 289–290 (2004). [DOI] [PubMed] [Google Scholar]
- 74.Vehtari A, Gelman A & Gabry J Practical Bayesian model evaluation using leave-one-out cross-validation and WAIC. Statistics and Computing 27, 1413–1432 (2017). [Google Scholar]
- 75.Zhou X, Kao MC & Wong WH Transitive functional annotation by shortest-path analysis of gene expression data. Proc Natl Acad Sci U S A 99, 12783–12788 (2002). [DOI] [PMC free article] [PubMed] [Google Scholar]
Associated Data
This section collects any data citations, data availability statements, or supplementary materials included in this article.
Supplementary Materials
Data Availability Statement
The individual-level raw shotgun sequencing data and metadata have been deposited in the European Nucleotide Archive with accession codes PRJEB37249, PRJEB38742, PRJEB41311, and PRJEB46098 for the Fromentin_2022 (MetaCardis); the Sequence Read Archive (SRA) under accession code ERP002469 for Karlsson_2013; the NCBI Sequence Read Archive under accession numbers SRA045646 and SRA050230 for Qin_2012 (Shenzhen Cohort); the China NGDC Genome Sequence Archive: HRA000020 or EGA: EGAS00001004480 for Wu_2020; and the China Nucleotide Sequence Archive (CNSA) with the dataset identifier CNP0000175 for Zhong_2019 (Suzhou Cohort).
The shotgun metagenomic sequencing data from the Nurses’ Health Study II (NHSII) and Health Professionals Follow-Up Study (HPFS) are publicly available at BIOM-Mass Data Portal (https://biom-mass.org/; project names: HPFS and MBS). Due to the informed consent of the participants, all the individual-level phenotype data from NHSII and HPFS are available through a request for external collaboration and upon approval of a letter of intent and a research proposal. Details on how to request external collaborations with NHSII and HPFS can be found at https://nurseshealthstudy.org/researchers (Contact PI: Dr. A. Heather Eliassen, Email: nhahe@channing.harvard.edu) and https://sites.sph.harvard.edu/hpfs/for-collaborators/. (Contact PI: Dr. Lorelei Mucci, Email: lmucci@hsph.harvard.edu). The individual-level metadata in the Hispanic Community Health Study /Study of Latinos (HCHS/SOL) are archived at the National Institutes of Health repositories dbGap (study accession: phs000810.v2.p2) and BIOLINCC (accession number: HLB01141423a). Shotgun metagenomic sequencing data from the HCHS/SOL samples described in this study are deposited in QIITA (study ID: 11666). HCHS/SOL has established a process for the scientific community to apply for access to participant data and materials, with such requests reviewed by the project’s Steering Committee. These policies are described at https://sites.cscc.unc.edu/hchs/ (Contact HCHS/SOL through Email: HCHSAdministration@unc.edu). The DIRECT-PLUS Study recruited participants in Israel and was designed as a clinical trial. This study used only baseline, pre-randomization data from the DIRECT-PLUS Study for an observational analysis. Due to the informed consent of the participants, the individual-level deidentified metadata and metagenomic sequencing data in the DIRECT-PLUS Study will be available for general research purposes through a request to Dr. Iris Shai (Email: irish@bgu.ac.il) and Dr. Dong D. Wang (Email: dow471@mail.harvard.edu) after the manuscript publication.
All the source data for creating figures and extended data figures are available as supplementary information.