Abstract
Background
The incidence of alcohol‐associated cancers is higher within Asian populations having an increased prevalence of an inactivating mutation in aldehyde dehydrogenase 2 (ALDH2), a mitochondrial enzyme required for the clearance of acetaldehyde, a cytotoxic metabolite of ethanol. The role of alcohol consumption in promoting lung cancer is controversial, and little attention has been paid to the association between alcohol drinking and pulmonary ALDH2 expression.
Methods
We performed a comprehensive bioinformatic analysis of multi‐omics data available in public databases to elucidate the role of ALDH2 in lung adenocarcinoma (LUAD).
Results
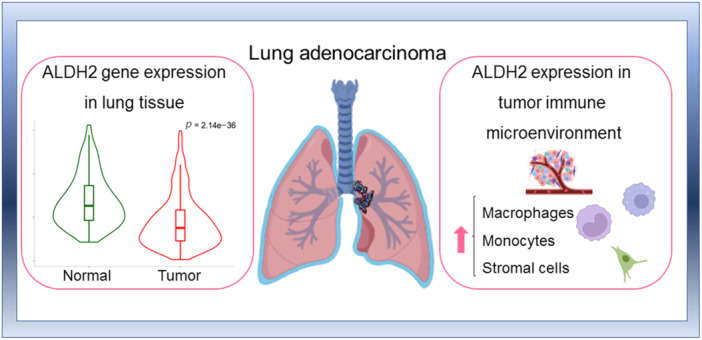
Transcriptional and proteomic data indicate a substantial pulmonary expression of ALDH2, which is functional for the metabolism of alcohol diffused from the bronchial circulation. ALDH2 expression is higher in healthy lung tissue than in LUAD and inhibits cell cycle, apoptosis, and epithelial–mesenchymal transition pathways. Moreover, low ALDH2 mRNA levels predict poor prognosis and low overall survival in LUAD patients. Interestingly, ALDH2 expression correlates with immune infiltration in LUAD.
Conclusions
A better understanding of the role of ALDH2 in lung tumor progression and immune infiltration might support its potential use as a prognostic marker and therapeutic target for improving immunotherapeutic response.
Keywords: acetaldehyde, alcohol, aldehyde dehydrogenase, ethanol metabolism, immunotherapy, lung adenocarcinoma, mitochondria, rs671 polymorphism (Glu504Lys) of aldehyde dehydrogenase 2
Mitochondrial aldehyde dehydrogenase 2 family member (ALDH2) expression is responsible for alcohol metabolism in the lungs. In lung adenocarcinoma (LUAD), low ALDH2 mRNA levels predict poor prognosis and low overall survival. ALDH2 expression correlates with immune infiltration in LUAD. ALDH2 may have potential as a prognostic marker and therapeutic target for improving immunotherapeutic response in LUAD.
Abbreviations
- ADH
alcohol dehydrogenase
- ALDH2
aldehyde dehydrogenase 2 family member
- ALDH2*2
rs671 polymorphism (Glu504Lys) of aldehyde dehydrogenase 2
- corGSEA
correlation‐based Gene Set Enrichment Analysis
- CYP2E1
cytochrome P450 2E1
- GEPIA
gene expression profiling interactive analysis platform
- GTEx
Genotype‐Tissue Expression project
- ICI
immune checkpoint inhibitor
- LDHD
lactate dehydrogenase D
- LUAD
lung adenocarcinoma
- LUSC
lung squamous cell carcinoma
- NSCLC
non‐small cell lung cancer
- PD‐1
programmed cell death protein 1
- PD‐L1
programmed cell death ligand 1
- TCGA
The Cancer Genome Atlas
- TIGIT
T cell immunoreceptor with Ig and ITIM domains
- TIME
tumor immune microenvironment
- ToPP
Tumor online Prognostic analyses Platform
- TPM
transcripts per million
- UALCAN
University of Alabama at Birmingham Cancer Data Analysis Portal
1. INTRODUCTION
Alcohol consumption increases the risk of several forms of cancer and accounts for more than 4% of new cancer cases worldwide [1]. Several mechanisms may sustain alcohol‐associated carcinogenesis, including the induction of oxidative and endoplasmic reticulum stress [2], depletion of folate [3], induction of stem cell damage [4], interference with retinoids and estrogen levels [5], alteration of the cell proliferation rate [6], and epigenetic changes [7]. However, increasing evidence points to acetaldehyde, a metabolite of ethanol, as one of the major determinants of alcohol's carcinogenic effect, mainly through the production of acetaldehyde‐derived DNA adducts [8, 9]. Sources of acetaldehyde may be natural, such as plants and fermented foods, as well as anthropogenic, including incomplete combustion of organic biomass and fuels, building products, furniture, cleaners, cosmetics, and glues [10]. The major lifestyle‐related risk factors increasing lung exposure to acetaldehyde are smoking and drinking alcoholic beverages [11]. Ingested ethanol is metabolized in the body by alcohol dehydrogenase (ADH), catalase, or cytochrome P450 2E1 (CYP2E1) to acetaldehyde, which is then further oxidized by aldehyde dehydrogenase 2 (ALDH2) to acetate. This process generates reactive oxygen species (ROS) that may induce DNA damage [12]. Moreover, acetaldehyde leads to the formation of DNA adducts, thus inhibiting DNA repair systems and interfering with DNA replication. Therefore, to prevent harmful effects, it is critical to detoxify aldehydes that may accumulate through endogenous metabolism and environmental exposure.
The family of aldehyde dehydrogenase enzymes is critical in the detoxification of endogenous and exogenous aldehyde substrates, in the biosynthesis of vital biomolecules, such as retinoic acid and folate, and in redox balance. Consequently, altered ALDH activity has been associated with increased vulnerability to different pathologies, including cancer [13]. Nineteen isoforms of ALDHs have been characterized in humans, showing different tissue and subcellular distributions and substrate specificity [14]. The mitochondrial enzyme ALDH2 is the most efficient isoform for converting toxic acetaldehyde to harmless acetate. In addition, ALDH2 detoxifies other aldehydes, such as 4‐hydroxynonenal, an endogenous product of lipid peroxidation, and methylglyoxal, a glycolysis metabolite, acting as a protector against oxidative stress [15] and advanced glycation end products formation [16].
Lung cancer is one of the most frequent tumors and the most common cause of cancer death, accounting for approximately one‐quarter of all cancer mortality worldwide [17]. Non‐small cell lung cancers (NSCLCs) have been traditionally classified as lung adenocarcinoma (LUAD), which is the prevalent form comprising 40% of lung cancers, and lung squamous cell carcinoma (LUSC). Nonetheless, increasing evidence suggests that LUAD and LUSC should be considered as distinct diseases at the molecular, pathological, and clinical levels [18]. Current therapeutic approaches mainly rely on surgical resection, chemotherapy, radiotherapy, and, more recently, immunotherapy. Progressive improvements in the molecular characterization of lung cancer have led to the development of novel diagnostic approaches and targeted therapies. Nonetheless, patients' 5‐year survival rates remain below 20%. Immune checkpoint inhibitor (ICI) therapy is an innovative therapeutic option for lung cancer, but only a fraction of the patients experience a favorable response to the treatment, possibly due to factors inherent to the tumor immune microenvironment (TIME). Consequently, the identification of suitable theranostic markers is of paramount importance for the accurate selection of patients who will benefit from ICI therapy [19]. Tobacco smoke is the major cause of lung cancer; specifically, acetaldehyde is one of the prominent carcinogens present in both tobacco smoke and electronic cigarette aerosols [20], which acts inducing DNA damage and inhibiting DNA repair [21]. Concurrent alcohol drinking synergistically further increases the risk for cancers in the upper digestive intestinal tract associated with tobacco smoke [22]. Although the sole role of alcohol consumption in lung cancer is controversial, alcoholic beverages are a well‐established source of carcinogens [23]. The lung epithelium is directly exposed to alcohol and its metabolites in the condensation of vapors derived from the bronchial circulation [24], oral cavity, and inhaled air, contributing to the pathophysiology of pulmonary diseases [25]. As a matter of fact, the determination of alcohol in the exhaled breath is implemented in law enforcement; endogenously produced acetaldehyde can also be determined in the breath after alcohol ingestion [26]; moreover, the assessment of aldehydes in breath has been considered as a convenient test for lung cancer [27]. The microbiota is an additional endogenous source of acetaldehyde. Human lungs are continuously exposed to the microbiome from inhaled air and the upper respiratory tract. Lungs approximately host a dynamic population of 2.2 × 10³ bacterial genomes per cm2, participating in shaping immune tolerance. The presence of colonizing bacteria with ADH activity in the lungs and oral cavity increases the risk of cancer development via the local production of acetaldehyde, which might be significantly elevated in the presence of reduced ALDH2 activity [28]. Moreover, even in the absence of ethanol consumption, exhaled breath may contain acetaldehyde produced through the fermentation of dietary fibers by gut Faecalibacteria [29].
ALDH2 is a hot topic of clinical research because the reduced activity of this mitochondrial homo‐tetrameric enzyme affects approximately 10% of the global population. ALDH2 dysfunction has been associated with various human disorders, including cardiovascular, neurodegenerative, and liver diseases, diabetes, Fanconi anemia, osteopenia, aging, and different types of cancers [30, 31, 32]. Accordingly, ALDH2 may be a promising therapeutic target in numerous diseases [33, 34]. However, relatively little attention has been paid so far to the association between alcohol consumption, pulmonary ALDH2 expression, and lung cancer. In the current study, we explore the potential role of ALDH2 as a theranostic marker for NSCLC.
2. MATERIALS AND METHODS
2.1. Expression analysis in healthy tissues
Tissue‐specific mRNA and protein expression levels of human ALDH2 were assessed using the European Molecular Biology Laboratory‐European Bioinformatics Institute (EMBL‐EBI) Expression Atlas platform (https://www.ebi.ac.uk/gxa/home). ALDH2 RNA expression was assessed in the RNA‐Seq mRNA baseline data set from the Genotype‐Tissue Expression (GTEx) Project [35]; ALDH2 protein expression was evaluated by querying the human proteome The PRoteomics IDEntifications (PRIDE) archive [36] and the EMBL‐EBI Expression Atlas platform.
2.2. Expression analysis in tumor tissues
The expression levels of ALDH2 in LUAD in comparison with normal samples were analyzed by the Gene Expression Profiling Interactive Analysis (GEPIA) platform (http://gepia.cancer-pku.cn/) [37] on gene expression data from The Cancer Genome Atlas (TCGA). ALDH2 protein expression in lung tumors with different tumor histology was determined by querying the Clinical Proteomic Tumor Analysis Consortium (CPTAC) database by the University of Alabama at Birmingham Cancer Data Analysis Portal (UALCAN) (https://ualcan.path.uab.edu/) [38]. ALDH2 expression analysis at different stages of LUAD was assessed using the GEPIA2 portal (http://gepia2.cancer-pku.cn/) and Gene Set Cancer Analysis (GSCA) platform (http://bioinfo.life.hust.edu.cn/GSCA/#/) [39].
2.3. Analysis of ALDH2 expression on cancer‐related pathways
The impact of ALDH2 mRNA expression on different well‐defined cancer‐related pathways was determined by the GSCA portal, which calculates the activation or inhibition of gene expression in pathway activity groups. The correlation between ALDH2 expression and onco‐suppressor genes expression in the TCGA LUAD cohort was investigated by evaluating the Spearman correlation using the GEPIA2 [37] and cBioPortal for Cancer Genomics (https://www.cbioportal.org/) [40], including mRNA data from 510 patients. Furthermore, the Correlation AnalyzeR web tool (https://gccri.bishop-lab.uthscsa.edu/shiny/correlation-analyzer/) [41] was employed to analyze the correlation between ALDH2 and selected biological pathways by correlation‐based Gene Set Enrichment Analysis (corGSEA).
2.4. Association of gene expression with TP53 mutation status
The association of ALDH2 expression with TP53 mutation status in LUAD was investigated using the UALCAN portal, which uses TP53 mutational status obtained from the TCGA whole‐exome sequencing data from the Genomic Data Commons portal. The samples with or without TP53 mutations were matched with TCGA RNA‐seq expression data.
2.5. Analysis of DNA methylation
Promoter methylation levels of ALDH2 were assessed using the UALCAN platform on DNA methylation and gene expression data from TCGA.
2.6. Survival analysis
Univariate survival analyses were performed to estimate the hazard ratios (HRs) with 95% confidence intervals (CIs) and Kaplan–Meier survival plots were generated using the Tumor online Prognostic analyses Platform (ToPP) (http://www.biostatistics.online/topp/index.php) [42], which collects multi‐omics and clinical data from TCGA, International Cancer Genome Consortium and the CPTAC project.
2.7. Analysis of ALDH2 expression at the single‐cell level
Expression of ALDH2 at the single‐cell level in normal pulmonary tissue was analyzed using the Human Protein Atlas (HPA) (https://www.proteinatlas.org/humanproteome/single+cell+type) [43] and the GTEx Portal (https://gtexportal.org/home/); analysis in the LUAD TIME was performed using the Tumor Immune Single‐cell Hub 2 (TISCH2) (http://tisch.comp-genomics.org/home/) on the publicly available scRNA‐seq data set from single‐cell transcriptomic analyses of cells isolated from NSCLC (NSCLC_GSE131907).
2.8. Analysis of ALDH2 expression and tumor–immune system interactions
The relations between tumor and immune system interactions were analyzed using the TISIDB (http://cis.hku.hk/TISIDB/index.php) [44] web portal. In particular, the relative abundance of tumor‐infiltrating lymphocytes (TILs), according to previously described immune‐related signatures of 28 TIL types [45], and ALDH2 expression in LUAD, was inferred by using gene set variation analysis based on gene expression profile.
3. RESULTS
3.1. ALDH2 is expressed in the healthy lungs
To investigate the potential role of ALDH2 as a therapeutic target in lung cancer, we explored the basal protein and mRNA expression levels in healthy lung tissue by employing the European Molecular Biology Laboratory‐European Bioinformatics Institute (EMBL‐EBI) Expression Atlas and the GTEx Project repository, respectively. Both proteomic and transcriptomic data in selected healthy human tissues indicate that ALDH2 is highly expressed in the liver and other tissues with prominent mitochondrial function, including the heart, kidney, and lungs (Figure 1a,b). Most of the ingested alcohol is normally metabolized in the liver, but also other tissues, including the gastrointestinal mucosa, spleen, and lungs, can metabolize ethanol [46]. Furthermore, ALDH2 is one of the most expressed ALDH isoforms in the lungs, where it detoxifies acetaldehyde absorbed from the bronchial circulation and inhaled from exogenous sources [47]. Expression of other members of the ALDH enzyme superfamily, including ALDH1A1 and ALDH3A1, is altered in lung cancer [48], but ALDH isozymes exhibit distinct substrate specificity and pathophysiology [14].
Figure 1.
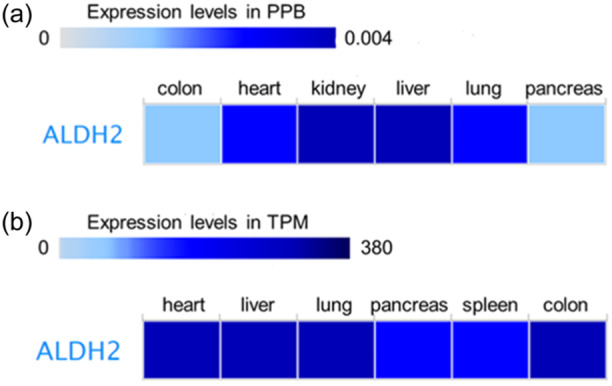
Tissue‐specific expression of ALDH2. ALDH2 expression levels analyzed by using the European Molecular Biology Laboratory‐European Bioinformatics Institute Expression Atlas platform. (a) Protein expression levels from the human proteome data set; (b) RNA expression levels from the Genotype‐Tissue Expression project data set. ALDH2, aldehyde dehydrogenase 2; PPB, parts per billion; TPM, transcripts per million.
3.2. ALDH2 expression is reduced in lung cancer
There is no consensus on the association between alcohol drinking and lung cancer [49]; nonetheless, the incidence of lung and alcohol‐associated cancers is higher in approximately 40% of the East Asian population, characterized by the prevalence of the ALDH2 inactivating polymorphism rs671 (ALDH2*2) [50, 51] that leads to acetaldehyde accumulation. Acetaldehyde, however, is not only a metabolite of ethanol but is also present in tobacco and e‐cigarette smoke; accordingly, smokers with the ALDH2*2 polymorphism have an increased risk of lung cancer [52, 53].
Transcriptional analysis of TCGA data and proteomic analysis of the CPTAC data indicate that ALDH2 expression in LUAD is lower than in normal lung tissue (Figure 2a,b) [54, 55, 56], regardless of tumor stage (Figure 3). Nevertheless, as shown in Figure 3, a significant albeit slight reduction in ALDH2 expression can be observed between Stages I and IV patients, suggesting that a lower level of the enzyme is indicative of a worse prognosis. Interestingly, ALDH2 mRNA expression is higher in LUAD non‐smoker patients than in smokers, who are subjected to increased acetaldehyde exposure (Figure S1).
Figure 2.
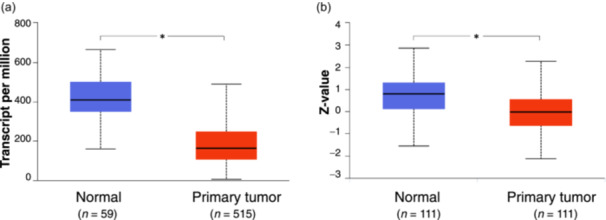
Gene expression profiling of ALDH2 in lung adenocarcinoma (LUAD). (a) The expression levels of ALDH2 in tumor tissues (red) and normal samples (blue) in gene expression data from The Cancer Genome Atlas. (b) Protein expression of ALDH2 in LUAD querying the Clinical Proteomic Tumor Analysis Consortium database. Analyses were performed by the University of Alabama at Birmingham Cancer Data Analysis Portal. The asterisk (*) indicates a statistically significant difference between the indicated groups (p ≤ 0.05). ALDH2, aldehyde dehydrogenase 2.
Figure 3.
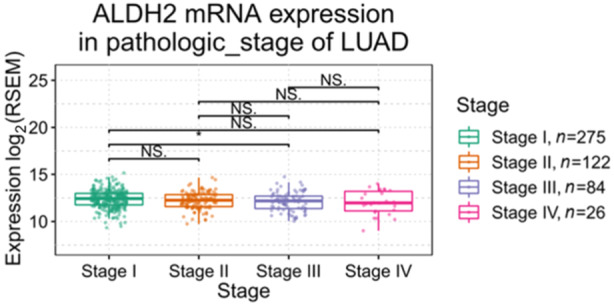
ALDH2 expression in different stages of lung adenocarcinoma (LUAD). The pathological stage plot created by using the Gene Set Cancer Analysis platform on TCGA data to compare ALDH2 expression in various stages of LUAD. TCGA, The Cancer Genome Atlas. The asterisk (*) indicates a statistically significant difference between the indicated groups (p ≤ 0.05). NS. indicates not significant.
Using the Expression and Pathway Activity section in the GSCA platform, we assessed the possible effects of altered ALDH2 mRNA expression on cancer‐related pathways in the TCGA LUAD data sets including 517 tumor and 59 normal samples. The analysis indicates that higher ALDH2 expression exerts potential inhibitory effects on cancer‐related activity associated with apoptosis, cell cycle, and epithelial–mesenchymal transition (EMT) pathways (Figure 4).
Figure 4.
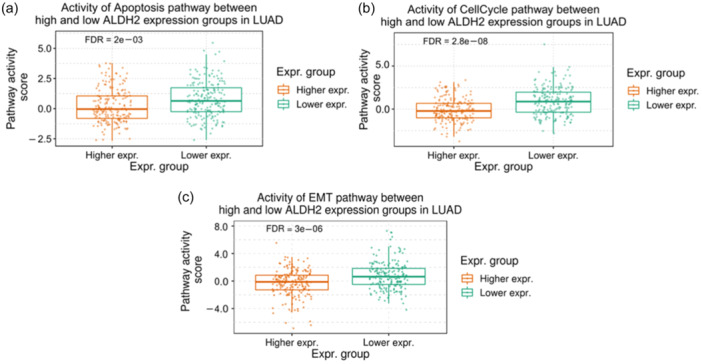
Differences of pathway activity between high and low ALDH2 mRNA expression. GSCA analysis of the effects of ALDH2 expression on the activity of (a) apoptosis, (b) cell cycle, and (c) epithelial–mesenchymal transition (EMT) pathways in LUAD. GSCA, Gene Set Cancer Analysis.
Collectively, these data suggest that the ALDH2 isoform might impact tumor‐suppressive pathways in LUAD.
3.3. ALDH2 expression is reduced in TP53‐mutant lung cancer compared to non‐mutant
Tumor suppressor protein TP53 dysregulation has been associated with many cancers, including lung cancer. Mutations in the TP53 gene generally give rise to increased stability and accumulation of the genetic product and occur in up to 46% of LUAD and 82% of LUSC patients; patients with TP53‐mutated NSCLC generally have worse prognoses and are resistant to current therapies [57]. Both alcohol drinking and cigarette smoking are associated with TP53 mutations in NSCLC [58]. To investigate a potential correlation between ALDH2 and TP53 status in lung cancer patients, we examined the level of expression of ALDH2 in the cohort of TP53‐mutated NSCLC. TP53 mutation status was obtained from the TCGA whole‐exome sequencing data and mutation annotation from VarScan2 was obtained from the National Cancer Institute Genomic Data Commons (CRDC) portal. Analysis of the relative expression of ALDH2 in normal healthy tissue or LUAD with different TP53 mutation statuses by the UALCAN platform indicates that ALDH2 expression in TP53‐mutant LUAD is lower than that in non‐TP53‐mutant tumors (Figure 5). Recently, several studies indicated that TP53 mutations are associated with improved survival in patients treated with immune checkpoint blockade therapy [59]. Therefore, it could be suggested that lower ALDH2 expression associated with TP53 mutations could be a useful predictive factor to identify LUAD patients who might benefit from ICI treatment.
Figure 5.
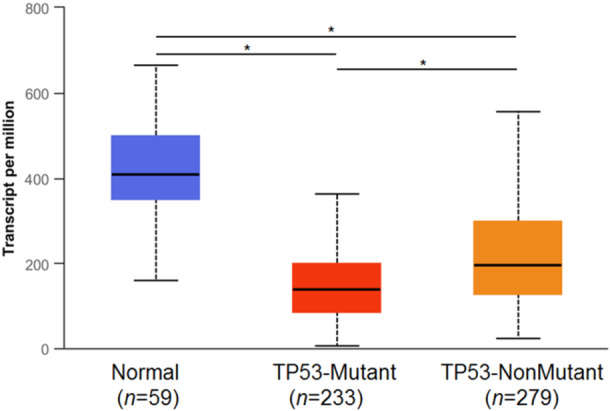
ALDH2 expression analysis in lung adenocarcinoma based on TP53 mutation status. The UALCAN platform was used to analyze the relative expression of ALDH2 in normal healthy tissue or lung cancers with different TP53 mutation statuses. The samples with/without TP53 mutation were matched with RNA‐seq TCGA data. TCGA, The Cancer Genome Atlas; UALCAN, University of Alabama at Birmingham Cancer Data Analysis Portal. *p ≤ 0.05.
3.4. ALDH2 promoter methylation is reduced in lung cancer
Global and gene‐specific promoter aberrant DNA methylation have been extensively described in lung cancer [60], and the transcriptional response may be context‐specific [61]. Recently, altered methylation pattern of ALDH2 has been described in different types of cancer [31, 56], including LUAD [54], where epigenetic silencing induced by methylation may facilitate bone metastasis [62]; reduced levels of ALDH2 DNA methylation have been observed in gastric tumors, but the impact on gene expression in the context of extremely low levels of DNA methylation has not been clearly determined [63]. On these bases, we verified the DNA methylation status in the ALDH2 promoter in LUAD in data sets from TCGA using the UALCAN platform (Figure 6). Differential ALDH2 DNA methylation patterns were detected in LUAD patients in comparison to healthy controls; even though the analysis of the beta value does not reflect a transition from hyper‐methylation to hypo‐methylation, a significant reduction in the methylation levels in the promoter of the ALDH2 gene was assessed in LUAD data sets.
Figure 6.
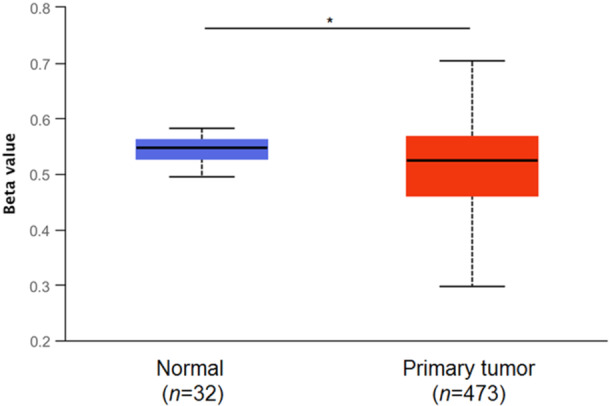
ALDH2 methylation analysis in lung adenocarcinoma. Promoter methylation levels of ALDH2 assessed using the UALCAN platform on TCGA samples; the beta value indicates the level of DNA methylation ranging from 0 (unmethylated) to 1 (fully methylated). Different beta value cutoffs have been considered to indicate hyper‐methylation [beta value: 0.70–0.50] or hypo‐methylation [Beta value: 0.30–0.25]. TCGA, The Cancer Genome Atlas; UALCAN, University of Alabama at Birmingham Cancer Data Analysis Portal. *p ≤ 0.05.
3.5. ALDH2 expression positively correlates with the onco‐suppressor genes selenium‐binding protein 1, folate receptor alpha, and lactate dehydrogenase D
Using the cBioPortal, we investigated the genes whose expression is correlated to ALDH2 in the TCGA Firehose Legacy LUAD cohort including mRNA data from 230 patients. Spearman correlation was utilized to evaluate the statistical significance. Interestingly, dysfunctional expression of the genes with higher correlation coefficients with ALDH2 expression has been previously associated with NSCLC. In particular, the genes with the highest positive correlation coefficients were: selenium‐binding protein 1 (SELENBP1) (Spearman's Rank correlation coefficient—ρ: 0.65) [64]; folate receptor alpha (FOLR1) (ρ: 0.57) [65]; lactate dehydrogenase D (LDHD) (ρ: 0.54) [66], while top 3 genes with higher negative correlation coefficients were: discs large homolog associated protein 5 (DLGAP5) (ρ: −0.56) [67]; anillin (ANLN) (ρ: −0.56) [68]; and cytoskeleton‐associated protein 2 like (CKAP2L) (ρ: −0.55) [69], as illustrated in Figure 7. Additional genes correlated with ALDH2 expression in LUAD are reported in Table S1.
Figure 7.
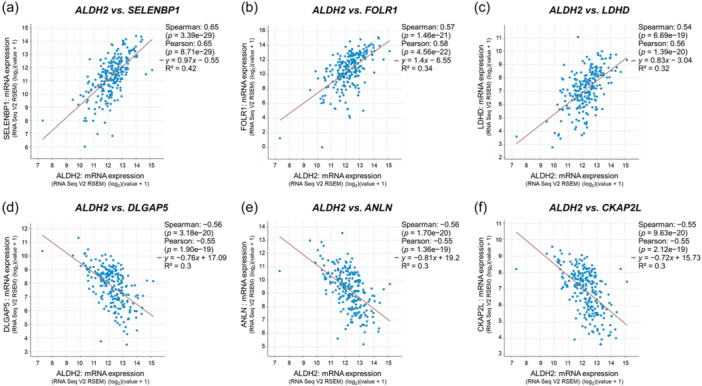
ALDH2 versus selected gene expression correlation analysis in LUAD. Analysis was performed using the cBioPortal for Cancer Genomics, TCGA Firehose Legacy LUAD data set. (a) SELENBP1: selenium‐binding protein 1; (b) FOLR1: folate receptor alpha; (c) LDHD: lactate dehydrogenase D; (d) DLGAP5: discs large homolog‐associated protein 5; (e) ANLN anillin; and (f) CKAP2L: cytoskeleton‐associated protein 2 like. LUAD, lung adenocarcinoma; TCGA, The Cancer Genome Atlas; TPM, transcripts per million reads.
Moreover, we used the Correlation AnalyzeR web tool (https://gccri.bishop-lab.uthscsa.edu/shiny/correlation-analyzer/) [41] to obtain co‐expression correlation for ALDH2 and selected biological pathways by corGSEA. Interestingly, top‐ranking pathways correlating with ALDH2 expression in lung cancer include the gene ontology (GO) terms antigen binding, humoral immune response mediated by circulating immunoglobulin, and regulation of humoral immune response (Figure S2) suggesting that ALDH2 might be involved in the modulation of immune response.
3.6. ALDH2 expression has a prognostic value in LUAD
We examined the significance of the survival difference in LUAD patients defined subgroups with different levels of ALDH2 expression. To assess patient prognosis, Kaplan–Meier survival plots were generated using ToPP. According to this analysis, higher ALDH2 expression is predictive of improved overall survival (OS) in LUAD patients; moreover, an increase in the proportion of patients diagnosed with stage I LUAD can be observed in the cohort of subjects with higher ALDH2 expression (Figure 8). Similar results were obtained assessing progression‐free interval (PFI), disease‐specific survival (DSS), disease‐free interval (DFI), and relapse‐free survival (RFS) (Figure S3).
Figure 8.
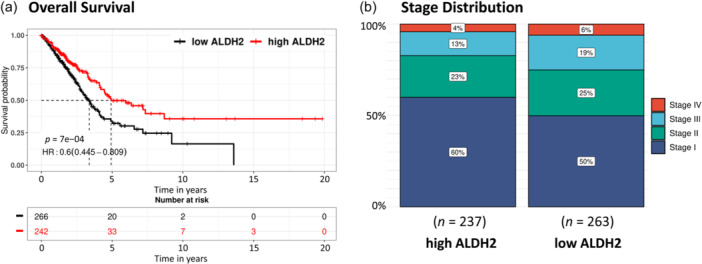
Prognostic value of ALDH2 in lung adenocarcinoma (LUAD). Higher ALDH2 expression is related to (a) increased overall survival and (b) increased number of patients at Stage I. Analysis was performed using ToPP on TCGA LUAD data. TCGA, The Cancer Genome Atlas; ToPP, Tumor online Prognostic analyses Platform.
3.7. ALDH2 expression and immune cell infiltration in LUAD tumor microenvironment
Analysis of the single‐cell expression data sets accessible through the HPA (Figure 9a) and the GTEx (not shown) portals indicate that in healthy lung tissue mainly alveolar epithelial cells and macrophages express ALDH2. Accordingly, ALDH2 is part of the “Monocytes—Inflammatory response cluster” identified by the HPA portal on the basis of RNA expression data across different tissues. We also analyzed ALDH2 expression in the TIME using the TISCH2 platform in the single‐cell transcriptomic NSCLC_GSE131907 data set. Within the LUAD TIME, the strongest ALDH2 expression is associated with the monocyte/macrophage compartment and to a lesser extent to cancer‐associated cells, alveolar, and endothelial cells (Figures 9b,c). These data are in accordance with single‐cell RNA‐Seq analysis performed in different cancer types, indicating that within the tumor microenvironment, ALDH2 expression is mostly enriched in macrophages, monocytes, and cancer‐associated fibroblasts [70, 71].
Figure 9.
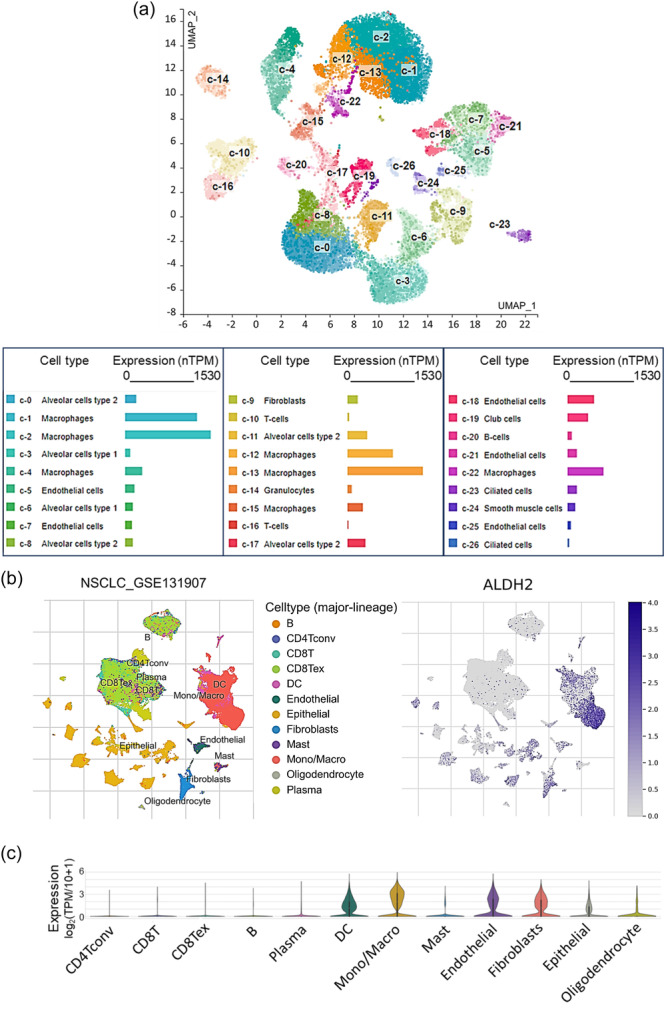
ALDH2 expression of at the single‐cell level in the tumor microenvironment. (a) Uniform manifold approximation and projection (UMAP) plot showing single‐cell RNA‐seq analysis in healthy lung tissue according to the HPA platform. Expression levels indicated in normalized transcripts per million (range 0–1550). (b) UMAP and (c) violin plots showing the distribution of ALDH2 expression in different cell types in the single‐cell transcriptomic non‐small cell lung cancer data set NSCLC_GSE131907. Analysis was performed with the TISCH2 platform.
To further explore the potential role of ALDH2 in modulating immune cell compartment, we assessed the correlation coefficient between ALDH2 expression and immune cell infiltration in the LUAD tumor microenvironment using the GSCA platform (Figure 10a). In particular, ALDH2 expression was positively correlated with mucosal‐associated invariant T (MAIT) (ρ: 0.48) and T helper 17 (Th17) (ρ: 0.25) cell scores; conversely, a negative correlation was determined with exhausted T cell (ρ: −0.32) and naturally occurring regulatory T cells (nTreg) (ρ: −0.50) (Figure 10a). Scatter plots in panels (b–e) in Figure 10 indicate the Spearman correlation between ALDH2 expression and MAIT, Th17, exhausted T cell, and nTreg, respectively.
Figure 10.
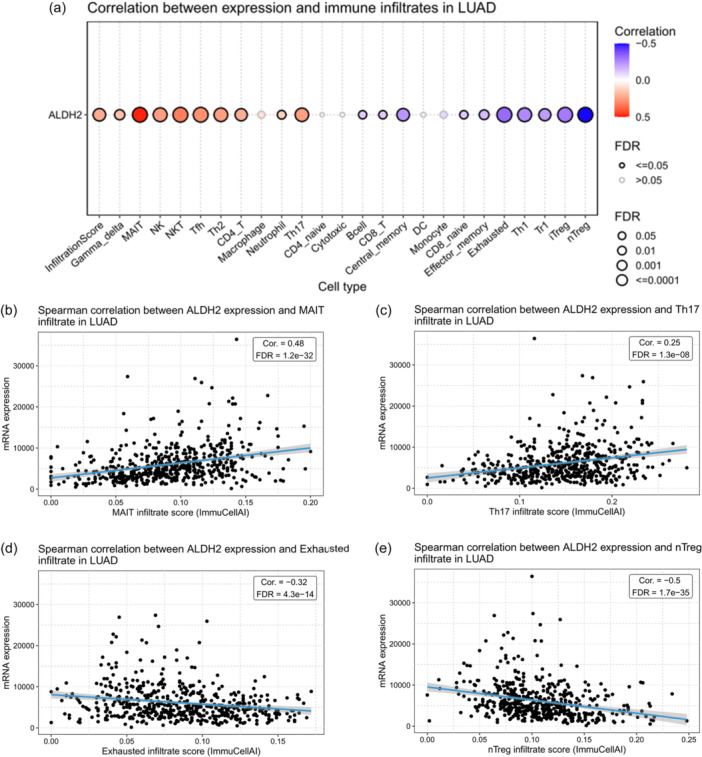
Correlation analysis between ALDH2 and immune infiltrate in lung adenocarcinoma. (a) Correlation between ALDH2 expression and immune cell infiltration in the tumor microenvironment of LUAD. The color indicated Spearman's correlation coefficient and the circle size represented the false discovery rate (FDR) value; the smaller the value, the larger the circle. Graphs showing the Spearman correlation between ALDH2 expression and infiltration scores of (b) mucosal‐associated invariant T (MAIT) cells, (c) T helper 17 (Th17) cells, (d) exhausted T cell, and (e) naturally occurring regulatory T (nTreg) cells. Analysis was performed using the GSCA platform. GSCA, Gene Set Cancer Analysis; LUAD, lung adenocarcinoma.
A recent study deeply investigated the role of ALDH2 in cancer [56], revealing a significant association between ALDH2 and several immune populations, including CD4+ T cells, CD8+ T cells, B cells, neutrophils, and macrophages, in different tumor types. This evidence strongly corroborates the prognostic role of ALDH2 in cancer, with a consistent correlation with the tumor immune microenvironment.
3.8. ALDH2 expression levels correlate with the expression of immune inhibitors and immune stimulators
Using the TISIDB platform, we assessed the correlation between ALDH2 expression in LUAD and the level of immune inhibitors by calculating the Spearman's correlation coefficients (Figure 11). The analysis revealed a significant inverse correlation between ALDH2 expression and the levels of major immune inhibitors such as cytotoxic T‐lymphocyte antigen 4 (CTLA‐4) (ρ: −0.11), indoleamine 2,3‐dioxygenase 1 (IDO1) (ρ: −0.13), lymphocyte‐activation gene 3 (LAG3) (ρ: −0.16), micro (PD‐1, PDCD1) (ρ: −0.15), programmed cell death ligand 1 (PD‐L1, CD274) (ρ: −0.29), and T cell immunoreceptor with Ig and ITIM domains (TIGIT) (ρ: −0.10) (Figures 11a,b) suggesting that LUAD patients with high ALDH2 expression might not be considered as appropriate candidates to receive ICI therapy. Moreover, using the TISIDB platform, we investigated the potential correlation between ALDH2 expression in LUAD and the levels of immune stimulators, major histocompatibility complex (MHC) molecules, chemokines, and chemokine receptors. Results are shown as representative heatmaps in Figure 11c–g, respectively.
Figure 11.
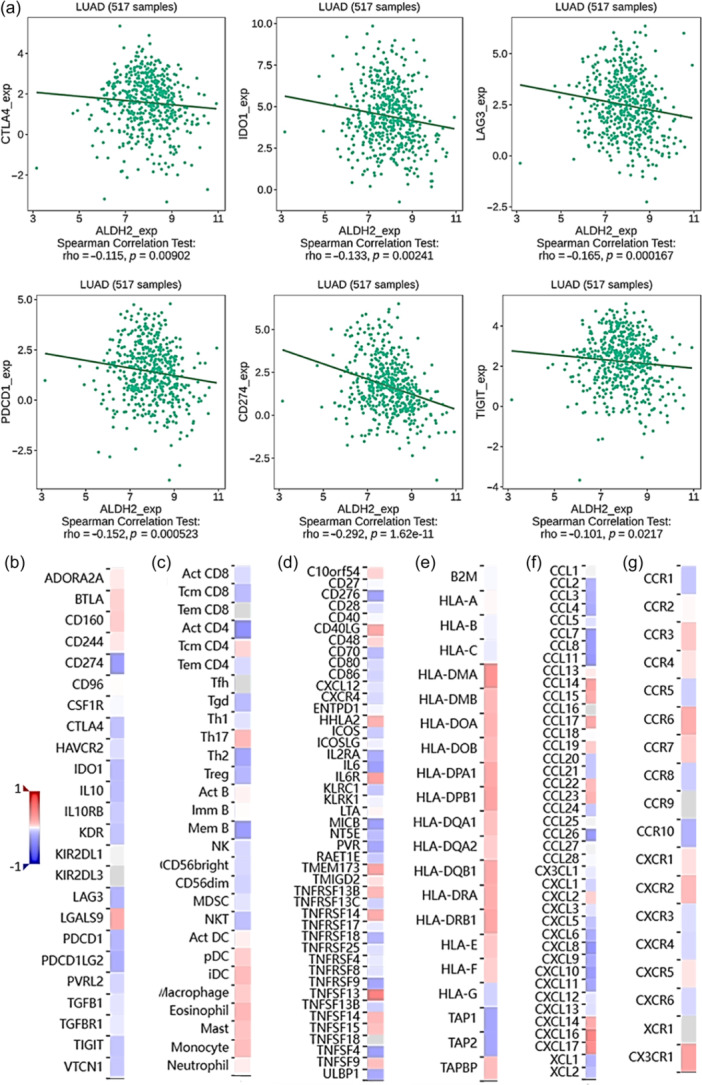
Correlation between ALDH2 expression and immune infiltrates. (a) Correlation analysis between ALDH2 expression and CTLA‐4, IDO1, LAG3, PD‐1, PD‐L1 (CD274), and TIGIT levels. Heatmaps showing relationship between ALDH2 expression and (b) immunoinhibitors, (c) abundance of 28 tumor‐infiltrating lymphocytes (TILs) signature, (d) immunostimulators, (e) MHC molecules, (f) chemokine, and (g) chemokine receptors in LUAD. Analysis was performed using the TISIDB platform. LUAD, lung adenocarcinoma; MHC, major histocompatibility complex.
Collectively, these data suggest that ALDH2 might be involved in the modulation of immune response and the recruitment of immune‐infiltrating cells in LUAD.
4. DISCUSSION
ALDH2 plays a pivotal role in detoxification of aldehydes and redox homeostasis. The potential involvement of ALDH2 in several types of cancers, including digestive system, breast, liver, and lung cancers, and head‐neck squamous cell carcinoma, has been extensively described [31, 34, 56]. In particular, reduction of ALDH2 activity linked to the ADLH2*2 genotype has been associated with upper aerodigestive and digestive and cancers [51, 72, 73, 74, 75, 76, 77]. Depending on the type of cancer, ALDH2 can act as pro‐oncogenic, promoting cell survival of cancer cells, or anti‐oncogenic, reducing the toxic effect of aldehydes [72, 73]. ALDH2 overexpression can, in fact, promote cancer progression and resistance to chemotherapy in clear‐cell renal cell carcinomas and bladder cancer [74, 75], whereas ALDH2 inhibition suppresses tumor growth, increasing the infiltration of CD3+ and CD8+ T lymphocytes in a mouse model of colorectal cancer [76]. Recently, it has been demonstrated that ALDH2 is downregulated in HNSC [55], gastric cancer [77], and melanoma [78] compared with healthy tissues and that, in affected subjects, higher ALDH2 expression is associated with a better prognosis. Notably, reduction of ALDH2 expression observed in tumor tissue results in an increase of acetaldehyde that promotes collagen production in human fibroblasts [79], a hallmark of solid tumors [80], remodeling tumor ECM and affecting immune surveillance. In addition to acetaldehyde, ALDH2 detoxifies other reactive aldehydes, including methylglyoxal, a glucose‐derived precursor of advanced glycation end‐products (AGEs). Methylglyoxal is a potent immunosuppressor and inhibitor of T cell function; therefore, enhancing its detoxification may improve the efficacy of ICI therapy [81]. Since ALDH2 plays an important role in the development of specific cancers, targeting ALDH2 may provide a new putative strategy for cancer therapy [34].
In the present study, we focused our attention on the specific association between ALDH2 expression and LUAD, and, by using publicly available data sets, we observed that ALDH2 expression in LUAD is lower than in normal lung tissue, in line with data recently described for HNSC and LUSC [55]. Based on the demonstration that low ALDH2 expression levels, associated with high XRCC1 expression, are predictive of poor prognosis and low OS in patients with lung and liver cancers [82], we specifically evaluated the association between ALDH2 expression and survival in LUAD patients. In particular, using ToPP, we generated Kaplan–Meier survival plots showing that higher ALDH2 expression was predictive of improved OS, with a higher expression in stage I‐LUAD patients. Searching for specific cancer‐related pathways that could be differently modulated according to ALDH2 expression, we used the GSCA platform, evidencing the inhibitory effect of ALDH2 expression on cancer‐related activity, in particular with those associated with cell cycle, apoptosis, and EMT pathways, thus mainly impacting tumor suppressive pathways in LUAD. We further assessed the role of ALDH2 in LUAD in dependence of the TP53 mutation status, taking advantage of the UALCAN platform. The analysis evidenced that ALDH2 expression was reduced in TP53‐mutant lung cancer compared with nonmutant. As recent studies indicated that TP53 mutations could be associated with improved survival in patients treated with ICI therapy [59], we speculated the potential use of the associated lower ALDH2 expression as a predictive factor to identify LUAD patients who might benefit from ICI treatment. Furthermore, correlation analysis revealed that top genes positively correlated with ALDH2 expression in LUAD act as onco‐suppressor genes, whereas negatively correlating genes are mainly oncogenes. In particular, selenium‐binding protein 1 (SELENBP1), which is a tumor suppressor in NSCLC [64], is the most strongly correlated gene with ALDH2 expression in LUAD. Similarly, high expression of folate receptor alpha (FOLR1) [65] and lactate dehydrogenase D (LDHD) [83] exert a protective effect in LUAD. Conversely, cytoskeleton associated protein 2 like (CKAP2L), the top inversely correlated gene with ALDH2 expression, acts as an oncogene in LUAD [69]; anillin is also overexpressed in LUAD [68] and associates with metastasis [84]. Likewise, the high expression of the discs large homolog associated protein 5 (DLGAP5) indicates poor prognosis and response to immunotherapy in LUAD [67].
Interestingly, single‐cell RNA‐Seq analysis performed for different cancer types highlighted that, within the tumor microenvironment, ALDH2 expression is mostly enriched in macrophages, monocytes, and cancer‐associated fibroblasts [70, 71]. Accordingly, using the HPA, we observed that in healthy lung tissue mainly macrophages express ALDH2, while the TISCH2 platform (in the single‐cell transcriptomic NSCLC_GSE131907 data set) showed that, in LUAD, ALDH2 is strongly expressed in the monocyte/macrophage compartment and to a lesser extent to cancer‐associated cells, alveolar, and endothelial cells. The existence of a direct association between immune infiltration and ALDH2 has been demonstrated in a recent study in HNSC [55], showing that ALDH2 expression correlates with immune marker genes and T cell infiltration. In particular, ALDH2‐mediated aldehyde metabolism promotes tumor immune evasion by activating the NOD/NF‐κB/VISTA axis [85]. On these bases, we interrogated the GSCA platform to assess a possible correlation between ALDH2 and immune cell infiltration in LUAD and observed that ALDH2 expression correlates with mucosal‐associated invariant T cell (MAIT) infiltration. The increased frequency of MAIT cells has recently been implicated in dysfunctional immune response in lung cancer [86] and has been suggested as a predictor of anti‐PD‐1 immunotherapy response [87]. Moreover, ALDH2 expression is correlated with infiltration of Th17 cells, which are an important constituent of the inflammatory milieu of the lung tumor immune microenvironment (TIME) [88]. Conversely, we determined a negative correlation between ALDH2 expression and exhausted T cells and naturally occurring regulatory T cells (nTreg) that play a role in remodeling the immune‐suppressive pulmonary TIME. In particular, in lung cancer, T‐cell exhaustion is associated with decreased cytokine production and cytolytic activity, and increased expression of ICI receptors, leading to the failure of cancer eradication by ICI therapy [89]. Also, infiltration of nTregs, an immunosuppressive subset of CD4+ T cells, has a negative prognostic value for patients with NSCLC and impacts the efficacy of ICI therapy [90, 91].
ICI therapy is an innovative therapeutic option for lung cancer, but only a fraction of patients experience a favorable response to the treatment; therefore, an accurate patient selection is of paramount importance to predict patients who might benefit from ICI therapy. However, patients initially responsive to ICI therapy may develop resistance. ALDHs may represent a target to potentially overcome anticancer therapy resistance [92, 93]. Therefore, unveiling the role of ALDH2 in lung tumor progression and immune infiltration could prove the potential use of ALDH2 as a predicting marker for immunotherapeutic response in lung cancer. A correlation between ALDH2 and immune inhibitors has recently emerged [56], thus suggesting a role for ALDH2 as a prognostic and diagnostic biomarker to predict the sensitivity of HNSC patients to ICI therapy [94], as well as in hepatocellular carcinoma [95], and glioma [71]. Based on multi‐omics data analysis in different cancers, ALDH2 has also been suggested as an accurate biomarker with the best prediction efficacy in evaluating immunotherapeutic response in skin cutaneous melanoma, compared with the most commonly used biomarkers (PD‐1, PD‐L1, CTLA4, CD8, and TMB) [31]. These findings shed new light on the potential role of ALDH2 in more precisely tailoring cancer immunotherapy, predicting patients who might benefit from ICI therapy. Interestingly, in hepatocellular carcinoma, high ALDH2 expression correlates with poor dendritic cells and macrophages immune infiltration and with low PD‐1 and CTLA4 expression [95]. Clinical results also indicate that ALDH2 is among the mitochondrial metabolic proteins significantly reduced in the group of nonresponder melanoma patients undergoing anti‐PD1 immunotherapy [96] and correlates to immune cell infiltration [78]. Accordingly, ALDH2 polymorphism rs671, which reduces the ALDH2 enzymatic activity, has been proposed as an easily detectable predictor of the efficacy of PD‐1/PD‐L1 inhibitor treatment in patients with lung cancer [97]. To examine whether ALDH2 might affect NSCLC immunotherapy, we performed a comprehensive analysis based on publicly available multi‐omic data. We revealed a significant inverse correlation between ALDH2 expression and the levels of some immune inhibitors such as cytotoxic T‐lymphocyte antigen 4 (CTLA‐4), indoleamine 2,3‐dioxygenase 1 (IDO1), lymphocyte‐activation gene 3 (LAG‐3), programmed cell death protein 1 (PD‐1), programmed cell death ligand 1 (PD‐L1), and T cell immunoreceptor with Ig and ITIM domains (TIGIT). Conversely, ALDH2 expression is positively correlated with some immune stimulators such as IL6R (ρ: 0.27), whose low expression predicts poor LUAD prognosis [98], and negatively correlated with CD276 (ρ: −0.25) that is highly expressed and impacts the survival of NSCLC patients [99]. In addition, ALDH2 correlates with the MHC Class II, DM Alpha (HLA‐DMA) (ρ: 0.35), which is a favorable prognostic marker, and inversely correlates with TAP1 (ρ: −0.24), whose expression negatively impacts survival in LUAD patients [100]. Finally, we determined that ALDH2 expression correlates with the CXC chemokine family members CXCL16 (ρ: 0.45) and CXCL17 (ρ: 0.39), which exert anti‐tumors effects [101], and with the C‐C motif chemokine receptor 6 (CCR6) (ρ: 0.20), which is a marker of favorable LUAD prognosis [102].
5. CONCLUSION
Our study, based on the bioinformatics analysis of data available in public databases, supports the use of ALDH2 a potential molecular biomarker for the prognosis and treatment of LUAD. In particular, ALDH2 impacts the immune cell compartment, potentially influencing the efficacy of ICI therapy for pulmonary adenocarcinoma. However, experimental and clinical analyses are needed to verify these results and to identify the molecular mechanisms by which ALDH2 might be instrumental in the selection of the patients who might benefit from immunotherapy.
AUTHOR CONTRIBUTIONS
Silvia Baldari: Conceptualization (equal); data curation (equal); investigation (equal); writing—original draft (equal); writing—review and editing (equal). Annalisa Antonini: Investigation (supporting); methodology (equal). Giuliana Di Rocco: Writing—review and editing (equal). Gabriele Toietta: Conceptualization (equal); data curation (equal); funding acquisition (lead); investigation (equal); writing—original draft (lead); writing—review and editing (lead).
CONFLICT OF INTEREST STATEMENT
The authors declare no conflict of interest.
ETHICS STATEMENT
Not applicable.
INFORMED CONSENT
Not applicable.
Supporting information
Supplementary figures have been supplied as separate files as requested by the author guidelines.
Supplementary figures legends:
Supplementary Table 1 Lists of genes positively (in green) and negatively (in red) correlated with ALDH2 in lung adenocarcinoma (the Cancer Genome Atlas Firehose Legacy dataset) from cBioPortal for Cancer Genomics.
Supplementary Figure 1 Aldehyde dehydrogenase 2 expression in lung adenocarcinoma patients based on their smoking habits. Analysis performed on lung adenocarcinoma (LUAD) gene expression data from The Cancer Genome Atlas (TCGA) using the University of ALabama at Birmingham CANcer data analysis Portal (UALCAN) (https://ualcan.path.uab.edu/).
Supplementary Figure 2 Correlation between ALDH2 and selected biological pathways by correlation‐based Gene Set Enrichment Analysis (corGSEA). Analysis was performed using the Correlation AnalyzeR web tool (https://gccri.bishop-lab.uthscsa.edu/shiny/correlation-analyzer/).
Supplementary Figure 3 Prognostic value of aldehyde dehydrogenase 2 in lung adenocarcinoma. Kaplan‐Meier survival curves for disease‐free interval (DFI), disease‐specific survival (DSS), progression‐free interval (PFI), and relapse‐free survival (RFS) in low‐ and high‐ALDH2 expression groups. Analysis was performed using the Tumor online Prognostic analyses Platform (ToPP) (http://www.biostatistics.online/topp/index.php) on the TCGA.
ACKNOWLEDGMENTS
The authors thank Maria Vincenza Sarcone for administrative support and the members of the Tumor Immunology and Immunotherapy Unit for discussion.
Baldari S, Antonini A, Di Rocco G, Toietta G. Expression pattern and prognostic significance of aldehyde dehydrogenase 2 in lung adenocarcinoma as a potential predictor of immunotherapy efficacy. Cancer Innov. 2025;3:e149. 10.1002/cai2.149
Silvia Baldari and Gabriele Toietta shared the corresponding authorship.
Contributor Information
Silvia Baldari, Email: silvia.baldari@ifo.it.
Gabriele Toietta, Email: gabriele.toietta@ifo.it.
DATA AVAILABILITY STATEMENT
The data that support the findings of this study are available from the corresponding authors upon reasonable request.
REFERENCES
- 1. Rumgay H, Shield K, Charvat H, Ferrari P, Sornpaisarn B, Obot I, et al. Global burden of cancer in 2020 attributable to alcohol consumption: a population‐based study. Lancet Oncol. 2021;22(8):1071–1080. 10.1016/S1470-2045(21)00279-5 [DOI] [PMC free article] [PubMed] [Google Scholar]
- 2. Seitz HK, Stickel F. Molecular mechanisms of alcohol‐mediated carcinogenesis. Nat Rev Cancer. 2007;7(8):599–612. 10.1038/nrc2191 [DOI] [PubMed] [Google Scholar]
- 3. Varela‐Rey M, Woodhoo A, Martinez‐Chantar ML, Mato JM, Lu SC. Alcohol, DNA methylation, and cancer. Alcohol Res Curr Rev. 2013;35(1):25–35. [PMC free article] [PubMed] [Google Scholar]
- 4. Di Rocco G, Baldari S, Pani G, Toietta G. Stem cells under the influence of alcohol: effects of ethanol consumption on stem/progenitor cells. Cell Mol Life Sci. 2019;76(2):231–244. 10.1007/s00018-018-2931-8 [DOI] [PMC free article] [PubMed] [Google Scholar]
- 5. Rumgay H, Murphy N, Ferrari P, Soerjomataram I. Alcohol and cancer: epidemiology and biological mechanisms. Nutrients. 2021;13(9):3173. 10.3390/nu13093173 [DOI] [PMC free article] [PubMed] [Google Scholar]
- 6. Baldari S, Manni I, Di Rocco G, Paolini F, Palermo B, Piaggio G, et al. Reduction of cell proliferation by acute C2H6O exposure. Cancers. 2021;13(19):4999. 10.3390/cancers13194999 [DOI] [PMC free article] [PubMed] [Google Scholar]
- 7. Liu X, Chen J, Li J, Zeng Z, Jiang X, Gao Y, et al. Integrated analysis reveals common DNA methylation patterns of alcohol‐associated cancers: a pan‐cancer analysis. Front Genet. 2023;14:1032683. 10.3389/fgene.2023.1032683 [DOI] [PMC free article] [PubMed] [Google Scholar]
- 8. Seitz HK, Stickel F. Acetaldehyde as an underestimated risk factor for cancer development: role of genetics in ethanol metabolism. Genes Nutr. 2010;5(2):121–128. 10.1007/s12263-009-0154-1 [DOI] [PMC free article] [PubMed] [Google Scholar]
- 9. Balbo S, Brooks PJ. Implications of acetaldehyde‐derived DNA adducts for understanding alcohol‐related carcinogenesis. Adv Exp Med Biol. 2015;815:71–88. 10.1007/978-3-319-09614-8_5 [DOI] [PubMed] [Google Scholar]
- 10. Sinharoy P, McAllister SL, Vasu M, Gross ER. Environmental aldehyde sources and the health implications of exposure. Adv Exp Med Biol. 2019;1193:35–52. 10.1007/978-981-13-6260-6_2 [DOI] [PMC free article] [PubMed] [Google Scholar]
- 11. Sapkota M, Wyatt T. Alcohol, aldehydes, adducts and airways. Biomolecules. 2015;5(4):2987–3008. 10.3390/biom5042987 [DOI] [PMC free article] [PubMed] [Google Scholar]
- 12. Zakhari S. Alcohol metabolism and epigenetics changes. Alcohol Res. 2013;35(1):6–16. 10.1621/nrs.07003 [DOI] [PMC free article] [PubMed] [Google Scholar]
- 13. Xia J, Li S, Liu S, Zhang L. Aldehyde dehydrogenase in solid tumors and other diseases: potential biomarkers and therapeutic targets. MedComm. 2023;4(1):e195. 10.1002/mco2.195 [DOI] [PMC free article] [PubMed] [Google Scholar]
- 14. Xanthis V, Mantso T, Dimtsi A, Pappa A, Fadouloglou VE. Human aldehyde dehydrogenases: a superfamily of similar yet different proteins highly related to cancer. Cancers. 2023;15(17):4419. 10.3390/cancers15174419 [DOI] [PMC free article] [PubMed] [Google Scholar]
- 15. Gao J, Hao Y, Piao X, Gu X. Aldehyde dehydrogenase 2 as a therapeutic target in oxidative stress‐related diseases: post‐translational modifications deserve more attention. Int J Mol Sci. 2022;23(5):2682. 10.3390/ijms23052682 [DOI] [PMC free article] [PubMed] [Google Scholar]
- 16. Izaguirre G, Kikonyogo A, Pietruszko R. Methylglyoxal as substrate and inhibitor of human aldehyde dehydrogenase: comparison of kinetic properties among the three isozymes. Comp Biochem Physiol B Biochem Mol Biol. 1998;119(4):747–754. 10.1016/s0305-0491(98)00051-0 [DOI] [PubMed] [Google Scholar]
- 17. Siegel RL, Giaquinto AN, Jemal A. Cancer statistics, 2024. CA Cancer J Clin. 2024;74(1):12–49. 10.3322/caac.21820 [DOI] [PubMed] [Google Scholar]
- 18. Relli V, Trerotola M, Guerra E, Alberti S. Abandoning the notion of non‐small cell lung cancer. Trends Mol Med. 2019;25(7):585–594. 10.1016/j.molmed.2019.04.012 [DOI] [PubMed] [Google Scholar]
- 19. Brueckl WM, Ficker JH, Zeitler G. Clinically relevant prognostic and predictive markers for immune‐checkpoint‐inhibitor (ICI) therapy in non‐small cell lung cancer (NSCLC). BMC Cancer. 2020;20(1):1185. 10.1186/s12885-020-07690-8 [DOI] [PMC free article] [PubMed] [Google Scholar]
- 20. Ogunwale MA, Li M, Ramakrishnam Raju MV, Chen Y, Nantz MH, Conklin DJ, et al. Aldehyde detection in electronic cigarette aerosols. ACS Omega. 2017;2(3):1207–1214. 10.1021/acsomega.6b00489 [DOI] [PMC free article] [PubMed] [Google Scholar]
- 21. Weng M, Lee HW, Park SH, Hu Y, Wang HT, Chen LC, et al. Aldehydes are the predominant forces inducing DNA damage and inhibiting DNA repair in tobacco smoke carcinogenesis. Proc Natl Acad Sci USA. 2018;115(27):E6152–E6161. 10.1073/pnas.1804869115 [DOI] [PMC free article] [PubMed] [Google Scholar]
- 22. Bagnardi V, Blangiardo M, La Vecchia C, Corrao G. Alcohol consumption and the risk of cancer: a meta‐analysis. Alcohol Res Health. 2001;25(4):263–270. [PMC free article] [PubMed] [Google Scholar]
- 23. Pflaum T, Hausler T, Baumung C, Ackermann S, Kuballa T, Rehm J, et al. Carcinogenic compounds in alcoholic beverages: an update. Arch Toxicol. 2016;90(10):2349–2367. 10.1007/s00204-016-1770-3 [DOI] [PubMed] [Google Scholar]
- 24. Sisson JH. Alcohol and airways function in health and disease. Alcohol. 2007;41(5):293–307. 10.1016/j.alcohol.2007.06.003 [DOI] [PMC free article] [PubMed] [Google Scholar]
- 25. Simet SM, Sisson JH. Alcohol's effects on lung health and immunity. Alcohol Res Curr Rev. 2015;37(2):199–208. [PMC free article] [PubMed] [Google Scholar]
- 26. Phillips M, Hensley P, Baiter RA, Cohan SL. An improved method for collecting breath for the assay of acetaldehyde. Alcohol Clin Exp Res. 1984;8(3):293–296. 10.1111/j.1530-0277.1984.tb05514.x [DOI] [PubMed] [Google Scholar]
- 27. Floss MA, Fink T, Maurer F, Volk T, Kreuer S, Müller‐Wirtz LM, et al. Exhaled aldehydes as biomarkers for lung diseases: a narrative review. Molecules. 2022;27(16):5258. 10.3390/molecules27165258 [DOI] [PMC free article] [PubMed] [Google Scholar]
- 28. Vogtmann E, Hua X, Yu G, Purandare V, Hullings AG, Shao D, et al. The oral microbiome and lung cancer risk: an analysis of 3 prospective cohort studies. J Natl Cancer Inst. 2022;114(11):1501–1510. 10.1093/jnci/djac149 [DOI] [PMC free article] [PubMed] [Google Scholar]
- 29. Neyrinck AM, Rodriguez J, Zhang Z, Nazare JA, Bindels LB, Cani PD, et al. Breath volatile metabolome reveals the impact of dietary fibres on the gut microbiota: proof of concept in healthy volunteers. EBioMedicine. 2022;80:104051. 10.1016/j.ebiom.2022.104051 [DOI] [PMC free article] [PubMed] [Google Scholar]
- 30. Chen CH, Ferreira JCB, Mochly‐Rosen D. ALDH2 and cardiovascular disease. Adv Exp Med Biol. 2019;1193:53–67. 10.1007/978-981-13-6260-6_3 [DOI] [PubMed] [Google Scholar]
- 31. Ma B, Liu Z, Xu H, Liu L, Huang T, Meng L, et al. Molecular characterization and clinical relevance of ALDH2 in human cancers. Front Med (Lausanne). 2022;8:832605. 10.3389/fmed.2021.832605 [DOI] [PMC free article] [PubMed] [Google Scholar]
- 32. Wu Y, Yao Y, Tao L, Wang S, Hu Y, Li L, et al. The role of acetaldehyde dehydrogenase 2 in the pathogenesis of liver diseases. Cell Signal. 2023;102:110550. 10.1016/j.cellsig.2022.110550 [DOI] [PubMed] [Google Scholar]
- 33. Chen CH, Ferreira JCB, Gross ER, Mochly‐Rosen D. Targeting aldehyde dehydrogenase 2: new therapeutic opportunities. Physiol Rev. 2014;94(1):1–34. 10.1152/physrev.00017.2013 [DOI] [PMC free article] [PubMed] [Google Scholar]
- 34. Zhang H, Fu L. The role of ALDH2 in tumorigenesis and tumor progression: targeting ALDH2 as a potential cancer treatment. Acta Pharm Sin B. 2021;11(6):1400–1411. 10.1016/j.apsb.2021.02.008 [DOI] [PMC free article] [PubMed] [Google Scholar]
- 35. Ardlie KG, Deluca DS, Segrè AV, Sullivan TJ, Young TR, Gelfand ET, et al. The Genotype‐Tissue Expression (GTEx) pilot analysis: multitissue gene regulation in humans. Science. 2015;348(6235):648–660. 10.1126/science.1262110 [DOI] [PMC free article] [PubMed] [Google Scholar]
- 36. Perez‐Riverol Y, Bai J, Bandla C, García‐Seisdedos D, Hewapathirana S, Kamatchinathan S, et al. The PRIDE database resources in 2022: a hub for mass spectrometry‐based proteomics evidences. Nucleic Acids Res. 2022;50(D1):D543–D552. 10.1093/nar/gkab1038 [DOI] [PMC free article] [PubMed] [Google Scholar]
- 37. Tang Z, Li C, Kang B, Gao G, Li C, Zhang Z. GEPIA a web server for cancer and normal gene expression profiling and interactive analyses. Nucleic Acids Res. 2017;45(W1):W98–102. 10.1093/nar/gkx247 [DOI] [PMC free article] [PubMed] [Google Scholar]
- 38. Chandrashekar DS, Karthikeyan SK, Korla PK, Patel H, Shovon AR, Athar M, et al. UALCAN: an update to the integrated cancer data analysis platform. Neoplasia. 2022;25:18–27. 10.1016/j.neo.2022.01.001 [DOI] [PMC free article] [PubMed] [Google Scholar]
- 39. Liu CJ, Hu FF, Xie GY, Miao YR, Li XW, Zeng Y, et al. GSCA an integrated platform for gene set cancer analysis at genomic, pharmacogenomic and immunogenomic levels. Brief Bioinform. 2023;24(1):bbac558. 10.1093/bib/bbac558 [DOI] [PubMed] [Google Scholar]
- 40. de Bruijn I, Mazor T, Abeshouse A, Baiceanu D, Carrero S, Garcia Lara E, et al. Abstract 4256: cBioPortal for cancer genomics. Cancer Res. 2023;83(7_Suppl):4256. 10.1158/1538-7445.AM2023-4256 [DOI] [Google Scholar]
- 41. Miller HE, Bishop AJR. Correlation analyzeR: functional predictions from gene co‐expression correlations. BMC Bioinformatics. 2021;22(1):206. 10.1186/s12859-021-04130-7 [DOI] [PMC free article] [PubMed] [Google Scholar]
- 42. Ouyang J, Qin G, Liu Z, Jian X, Shi T, Xie L. ToPP: tumor online prognostic analysis platform for prognostic feature selection and clinical patient subgroup selection. iScience. 2022;25(5):104190. 10.1016/j.isci.2022.104190 [DOI] [PMC free article] [PubMed] [Google Scholar]
- 43. Karlsson M, Zhang C, Méar L, Zhong W, Digre A, Katona B, et al. A single‐cell type transcriptomics map of human tissues. Sci Adv. 2021;7(31):eabh2169. 10.1126/sciadv.abh2169 [DOI] [PMC free article] [PubMed] [Google Scholar]
- 44. Ru B, Wong CN, Tong Y, Zhong JY, Zhong SSW, Wu WC, et al. TISIDB: an integrated repository portal for tumor‐immune system interactions. Bioinformatics. 2019;35(20):4200–4202. 10.1093/bioinformatics/btz210 [DOI] [PubMed] [Google Scholar]
- 45. Charoentong P, Finotello F, Angelova M, Mayer C, Efremova M, Rieder D, et al. Pan‐cancer immunogenomic analyses reveal genotype‐immunophenotype relationships and predictors of response to checkpoint blockade. Cell Rep. 2017;18(1):248–262. 10.1016/j.celrep.2016.12.019 [DOI] [PubMed] [Google Scholar]
- 46. Stewart MJ, Malek K, Crabb DW. Distribution of messenger RNAs for aldehyde dehydrogenase 1, aldehyde dehydrogenase 2, and aldehyde dehydrogenase 5 in human tissues. J Investig Med. 1996;44(2):42–46. [PubMed] [Google Scholar]
- 47. Kuroda A, Hegab AE, Gao J, Yamashita S, Hizawa N, Sakamoto T, et al. Effects of the common polymorphism in the human aldehyde dehydrogenase 2 (ALDH2) gene on the lung. Respir Res. 2017;18(1):69. 10.1186/s12931-017-0554-5 [DOI] [PMC free article] [PubMed] [Google Scholar]
- 48. Patel M, Lu L, Zander DS, Sreerama L, Coco D, Moreb JS. ALDH1A1 and ALDH3A1 expression in lung cancers: correlation with histologic type and potential precursors. Lung Cancer. 2008;59(3):340–349. 10.1016/j.lungcan.2007.08.033 [DOI] [PubMed] [Google Scholar]
- 49. Zou K, Sun P, Huang H, Zhuo H, Qie R, Xie Y, et al. Etiology of lung cancer: evidence from epidemiologic studies. J Natl Cancer Cent. 2022;2(4):216–225. 10.1016/j.jncc.2022.09.004 [DOI] [PMC free article] [PubMed] [Google Scholar]
- 50. Chang JS, Hsiao JR, Chen CH. ALDH2 polymorphism and alcohol‐related cancers in Asians: a public health perspective. J Biomed Sci. 2017;24(1):19. 10.1186/s12929-017-0327-y [DOI] [PMC free article] [PubMed] [Google Scholar]
- 51. Im PK, Yang L, Kartsonaki C, Chen Y, Guo Y, Du H, et al. Alcohol metabolism genes and risks of site‐specific cancers in Chinese adults: an 11‐year prospective study. Int J Cancer. 2022;150(10):1627–1639. 10.1002/ijc.33917 [DOI] [PMC free article] [PubMed] [Google Scholar]
- 52. Park JY, Matsuo K, Suzuki T, Ito H, Hosono S, Kawase T, et al. Impact of smoking on lung cancer risk is stronger in those with the homozygous aldehyde dehydrogenase 2 null allele in a Japanese population. Carcinogenesis. 2010;31(4):660–665. 10.1093/carcin/bgq021 [DOI] [PubMed] [Google Scholar]
- 53. Shimizu M, Ishii Y, Okubo M, Kunitoh H, Kamataki T, Yamazaki H. Effects of ADH1C, ALDH2, and CYP2A6 polymorphisms on individual risk of tobacco‐related lung cancer in male Japanese smokers. J Cancer Ther. 2013;4(8):29–35. 10.4236/jct.2013.48a005 [DOI] [Google Scholar]
- 54. Tran TO, Vo TH, Lam LHT, Le NQK. ALDH2 as a potential stem cell‐related biomarker in lung adenocarcinoma: comprehensive multi‐omics analysis. Comput Struct Biotechnol J. 2023;21:1921–1929. 10.1016/j.csbj.2023.02.045 [DOI] [PMC free article] [PubMed] [Google Scholar]
- 55. Yao S, Yin X, Chen T, Chen W, Zuo H, Bi Z, et al. Exploring ALDH2 expression and immune infiltration in HNSC and its correlation of prognosis with gender or alcohol intake. Sci Rep. 2022;12(1):2504. 10.1038/s41598-022-06244-1 [DOI] [PMC free article] [PubMed] [Google Scholar]
- 56. Shen X, Yan Z, Huang Y, Zhu Q, Zhang G, Ci H, et al. ALDH2 as an immunological and prognostic biomarker: insights from pan‐cancer analysis. Medicine. 2024;103(16):e37820. 10.1097/MD.0000000000037820 [DOI] [PMC free article] [PubMed] [Google Scholar]
- 57. Fan Z, Zhang Q, Feng L, Wang L, Zhou X, Han J, et al. Genomic landscape and prognosis of patients with TP53‐mutated non‐small cell lung cancer. Ann Transl Med. 2022;10(4):188. 10.21037/atm-22-412 [DOI] [PMC free article] [PubMed] [Google Scholar]
- 58. Ahrendt SA, Chow JT, Yang SC, Wu L, Zhang MJ, Jen J, et al. Alcohol consumption and cigarette smoking increase the frequency of p53 mutations in non‐small cell lung cancer. Cancer Res. 2000;60(12):3155–3159. [PubMed] [Google Scholar]
- 59. Lin X, Wang L, Xie X, Qin Y, Xie Z, Ouyang M, et al. Prognostic biomarker TP53 mutations for immune checkpoint blockade therapy and its association with tumor microenvironment of lung adenocarcinoma. Front Mol Biosci. 2020;7:602328. 10.3389/fmolb.2020.602328 [DOI] [PMC free article] [PubMed] [Google Scholar]
- 60. Hoang PH, Landi MT. DNA methylation in lung cancer: mechanisms and associations with histological subtypes, molecular alterations, and major epidemiological factors. Cancers. 2022;14(4):961. 10.3390/cancers14040961 [DOI] [PMC free article] [PubMed] [Google Scholar]
- 61. de Mendoza A, Nguyen TV, Ford E, Poppe D, Buckberry S, Pflueger J, et al. Large‐scale manipulation of promoter DNA methylation reveals context‐specific transcriptional responses and stability. Genome Biol. 2022;23(1):163. 10.1186/s13059-022-02728-5 [DOI] [PMC free article] [PubMed] [Google Scholar]
- 62. Yang M, Wang A, Li C, Sun J, Yi G, Cheng H, et al. Methylation‐induced silencing of ALDH2 facilitates lung adenocarcinoma bone metastasis by activating the MAPK pathway. Front Oncol. 2020;10:1141. 10.3389/fonc.2020.01141 [DOI] [PMC free article] [PubMed] [Google Scholar]
- 63. Balassiano K, Lima S, Jenab M, Overvad K, Tjonneland A, Boutron‐Ruault MC, et al. Aberrant DNA methylation of cancer‐associated genes in gastric cancer in the European prospective investigation into cancer and nutrition (EPIC‐EURGAST). Cancer Lett. 2011;311(1):85–95. 10.1016/j.canlet.2011.06.038 [DOI] [PubMed] [Google Scholar]
- 64. Zhu Y, Pu Q, Zhang Q, Liu Y, Ma Y, Yuan Y, et al. Selenium‐binding protein 1 inhibits malignant progression and induces apoptosis via distinct mechanisms in non‐small cell lung cancer. Cancer Med. 2023;12(16):17149–17170. 10.1002/cam4.6309 [DOI] [PMC free article] [PubMed] [Google Scholar]
- 65. Iwakiri S, Sonobe M, Nagai S, Hirata T, Wada H, Miyahara R. Expression status of folate receptor α is significantly correlated with prognosis in non‐small‐cell lung cancers. Ann Surg Oncol. 2008;15(3):889–899. 10.1245/s10434-007-9755-3 [DOI] [PubMed] [Google Scholar]
- 66. Tang W, Chen Z, Liao Y, Fang Y, Xia M, Zu X, et al. Prognostic value of LDHD and its correlation with immune infiltrates in thyroid cancer. 2022; PREPRINT (Version 1). 10.21203/rs.3.rs-1395483/v1 [DOI]
- 67. Tang X, Zhou H, Liu Y. High expression of DLGAP5 indicates poor prognosis and immunotherapy in lung adenocarcinoma and promotes proliferation through regulation of the cell cycle. Dis Markers. 2023;2023:9292536. 10.1155/2023/9292536 [DOI] [PMC free article] [PubMed] [Google Scholar]
- 68. Long X, Zhou W, Wang Y, Liu S. Prognostic significance of ANLN in lung adenocarcinoma. Oncol Lett. 2018;16(2):1835–1840. 10.3892/ol.2018.8858 [DOI] [PMC free article] [PubMed] [Google Scholar]
- 69. Monteverde T, Sahoo S, La Montagna M, Magee P, Shi L, Lee D, et al. CKAP2L promotes non‐small cell lung cancer progression through regulation of transcription elongation. Cancer Res. 2021;81(7):1719–1731. 10.1158/0008-5472.CAN-20-1968 [DOI] [PubMed] [Google Scholar]
- 70. Guo F, Yang Z, Sehouli J, Kaufmann AM. Blockade of ALDH in cisplatin‐resistant ovarian cancer stem cells in vitro synergistically enhances chemotherapy‐induced cell death. Curr Oncol. 2022;29(4):2808–2822. 10.3390/curroncol29040229 [DOI] [PMC free article] [PubMed] [Google Scholar]
- 71. Wang Z, Mo Y, Tan Y, Wen Z, Dai Z, Zhang H, et al. The ALDH family contributes to immunocyte infiltration, proliferation and epithelial‐mesenchymal transformation in glioma. Front Immunol. 2022;12:756606. 10.3389/fimmu.2021.756606 [DOI] [PMC free article] [PubMed] [Google Scholar]
- 72. Li K, Guo W, Li Z, Wang Y, Sun B, Xu D, et al. ALDH2 repression promotes lung tumor progression via accumulated acetaldehyde and DNA damage. Neoplasia. 2019;21(6):602–614. 10.1016/j.neo.2019.03.008 [DOI] [PMC free article] [PubMed] [Google Scholar]
- 73. Hou G, Chen L, Liu G, Li L, Yang Y, Yan HX, et al. Aldehyde dehydrogenase‐2 (ALDH2) opposes hepatocellular carcinoma progression by regulating AMP‐activated protein kinase signaling in mice. Hepatology. 2017;65(5):1628–1644. 10.1002/hep.29006 [DOI] [PubMed] [Google Scholar]
- 74. Gao YH, Wu ZX, Xie LQ, Li CX, Mao YQ, Duan YT, et al. VHL deficiency augments anthracycline sensitivity of clear cell renal cell carcinomas by down‐regulating ALDH2. Nat Commun. 2017;8:15337. 10.1038/ncomms15337 [DOI] [PMC free article] [PubMed] [Google Scholar]
- 75. Kallifatidis G, Smith DK, Morera DS, Gao J, Hennig MJ, Hoy JJ, et al. β‐arrestins regulate stem cell‐like phenotype and response to chemotherapy in bladder cancer. Mol Cancer Ther. 2019;18(4):801–811. 10.1158/1535-7163.MCT-18-1167 [DOI] [PMC free article] [PubMed] [Google Scholar]
- 76. Zhang H, Xia Y, Wang F, Luo M, Yang K, Liang S, et al. Aldehyde dehydrogenase 2 mediates alcohol‐induced colorectal cancer immune escape through stabilizing PD‐L1 expression. Adv Sci. 2021;8(10):2003404. 10.1002/advs.202003404 [DOI] [PMC free article] [PubMed] [Google Scholar]
- 77. Yao S, Gan C, Wang T, Zhang Q, Zhang M, Cheng H. High ALDH2 expression is associated with better prognosis in patients with gastric cancer. Am J Cancer Res. 2022;12(12):5425–5439. [PMC free article] [PubMed] [Google Scholar]
- 78. Lei H, Liao J, Wang X, Huang R, Ying C, Yang J. ALDH2 is a novel biomarker and exerts an inhibitory effect on melanoma. Sci Rep. 2024;14(1):4183. 10.1038/s41598-024-54084-y [DOI] [PMC free article] [PubMed] [Google Scholar]
- 79. Brenner DA, Chojkier M. Acetaldehyde increases collagen gene transcription in cultured human fibroblasts. J Biol Chem. 1987;262(36):17690–17695. 10.1016/S0021-9258(18)45434-8 [DOI] [PubMed] [Google Scholar]
- 80. Baldari S, Di Modugno F, Nisticò P, Toietta G. Strategies for efficient targeting of tumor collagen for cancer therapy. Cancers. 2022;14(19):4706. 10.3390/cancers14194706 [DOI] [PMC free article] [PubMed] [Google Scholar]
- 81. Baumann T, Dunkel A, Schmid C, Schmitt S, Hiltensperger M, Lohr K, et al. Regulatory myeloid cells paralyze T cells through cell‐cell transfer of the metabolite methylglyoxal. Nature Immunol. 2020;21(5):555–566. 10.1038/s41590-020-0666-9 [DOI] [PubMed] [Google Scholar]
- 82. Chen X, Legrand AJ, Cunniffe S, Hume S, Poletto M, Vaz B, et al. Interplay between base excision repair protein XRCC1 and ALDH2 predicts overall survival in lung and liver cancer patients. Cell Oncol. 2018;41(5):527–539. 10.1007/s13402-018-0390-8 [DOI] [PMC free article] [PubMed] [Google Scholar]
- 83. Shang S, Wang M, Xing Z, He N, Li S. Lactate regulators contribute to tumor microenvironment and predict prognosis in lung adenocarcinoma. Front Immunol. 2022;13:1024925. 10.3389/fimmu.2022.1024925 [DOI] [PMC free article] [PubMed] [Google Scholar]
- 84. Xu J, Zheng H, Yuan S, Zhou B, Zhao W, Pan Y, et al. Overexpression of ANLN in lung adenocarcinoma is associated with metastasis. Thorac Cancer. 2019;10(8):1702–1709. 10.1111/1759-7714.13135 [DOI] [PMC free article] [PubMed] [Google Scholar]
- 85. Chen Y, Sun J, Liu J, Wei Y, Wang X, Fang H, et al. Aldehyde dehydrogenase 2‐mediated aldehyde metabolism promotes tumor immune evasion by regulating the NOD/VISTA axis. J Immunother Cancer. 2023;11(12):e007487. 10.1136/jitc-2023-007487 [DOI] [PMC free article] [PubMed] [Google Scholar]
- 86. Zhang Q, Li P, Zhou W, Fang S, Wang J. Participation of increased circulating MAIT cells in lung cancer: a pilot study. J Cancer. 2022;13(5):1623–1629. 10.7150/jca.69415 [DOI] [PMC free article] [PubMed] [Google Scholar]
- 87. Shi L, Lu J, Zhong D, Song M, Liu J, You W, et al. Clinicopathological and predictive value of MAIT cells in non‐small cell lung cancer for immunotherapy. J Immunother Cancer. 2023;11(1):e005902. 10.1136/jitc-2022-005902 [DOI] [PMC free article] [PubMed] [Google Scholar]
- 88. Marshall EA, Ng KW, Kung SHY, Conway EM, Martinez VD, Halvorsen EC, et al. Emerging roles of T helper 17 and regulatory T cells in lung cancer progression and metastasis. Mol Cancer. 2016;15(1):67. 10.1186/s12943-016-0551-1 [DOI] [PMC free article] [PubMed] [Google Scholar]
- 89. Kim CG, Kim G, Kim KH, Park S, Shin S, Yeo D, et al. Distinct exhaustion features of T lymphocytes shape the tumor‐immune microenvironment with therapeutic implication in patients with non‐small‐cell lung cancer. J Immunother Cancer. 2021;9(12):e002780. 10.1136/jitc-2021-002780 [DOI] [PMC free article] [PubMed] [Google Scholar]
- 90. González‐Navajas JM, Fan DD, Yang S, Yang FM, Lozano‐Ruiz B, Shen L, et al. The impact of tregs on the anticancer immunity and the efficacy of immune checkpoint inhibitor therapies. Front Immunol. 2021;12:625783. 10.3389/fimmu.2021.625783 [DOI] [PMC free article] [PubMed] [Google Scholar]
- 91. Liang J, Bi G, Shan G, Jin X, Bian Y, Wang Q. Tumor‐associated regulatory T cells in non‐small‐cell lung cancer: current advances and future perspectives. J Immunol Res. 2022;2022:4355386. 10.1155/2022/4355386 [DOI] [PMC free article] [PubMed] [Google Scholar]
- 92. Al‐Shamma SA, Zaher DM, Hersi F, Abu Jayab NN, Omar HA. Targeting aldehyde dehydrogenase enzymes in combination with chemotherapy and immunotherapy: an approach to tackle resistance in cancer cells. Life Sci. 2023;320:121541. 10.1016/j.lfs.2023.121541 [DOI] [PubMed] [Google Scholar]
- 93. Zanoni M, Bravaccini S, Fabbri F, Arienti C. Emerging roles of aldehyde dehydrogenase isoforms in anti‐cancer therapy resistance. Front Med. 2022;9:795762. 10.3389/fmed.2022.795762 [DOI] [PMC free article] [PubMed] [Google Scholar]
- 94. Zhang H, Li Z, Zheng Y. Identifying the therapeutic and prognostic role of the CD8+ T cell‐related gene ALDH2 in head and neck squamous cell carcinoma. Cancer Inform. 2022;21:11769351221139252. 10.1177/11769351221139252 [DOI] [PMC free article] [PubMed] [Google Scholar]
- 95. Yao S, Yin X, Chen T, Chen W, Zuo H, Bi Z, et al. ALDH2 is a prognostic biomarker and related with immune infiltrates in HCC. Am J Cancer Res. 2021;11(11):5319–5337. [PMC free article] [PubMed] [Google Scholar]
- 96. Harel M, Ortenberg R, Varanasi SK, Mangalhara KC, Mardamshina M, Markovits E, et al. Proteomics of melanoma response to immunotherapy reveals mitochondrial dependence. Cell. 2019;179(1):236–250.e18. 10.1016/j.cell.2019.08.012 [DOI] [PMC free article] [PubMed] [Google Scholar]
- 97. Matsumoto A, Nakashima C, Kimura S, Sueoka E, Aragane N. ALDH2 polymorphism rs671 is a predictor of PD‐1/PD‐L1 inhibitor efficacy against thoracic malignancies. BMC Cancer. 2021;21(1):584. 10.1186/s12885-021-08329-y [DOI] [PMC free article] [PubMed] [Google Scholar]
- 98. Sun G, Wang T, Shi M, Zhou H, Wang J, Huang Z, et al. Low expression of IL6R predicts poor prognosis for lung adenocarcinoma. Ann Transl Med. 2021;9(13):1057. 10.21037/atm-21-36 [DOI] [PMC free article] [PubMed] [Google Scholar]
- 99. Zhang C, Hao X. Prognostic significance of CD276 in non‐small cell lung cancer. Open Med. 2019;14:805–812. 10.1515/med-2019-0076 [DOI] [PMC free article] [PubMed] [Google Scholar]
- 100. Tabassum A, Samdani MN, Dhali TC, Alam R, Ahammad F, Samad A, et al. Transporter associated with antigen processing 1 (TAP1) expression and prognostic analysis in breast, lung, liver, and ovarian cancer. J Mol Med. 2021;99(9):1293–1309. 10.1007/s00109-021-02088-w [DOI] [PMC free article] [PubMed] [Google Scholar]
- 101. Wang K, Li R, Zhang Y, Qi W, Fang T, Yue W, et al. Prognostic significance and therapeutic target of CXC chemokines in the microenvironment of lung adenocarcinoma. Int J Gen Med. 2022;15:2283–2300. 10.2147/IJGM.S352511 [DOI] [PMC free article] [PubMed] [Google Scholar]
- 102. Minamiya Y, Saito H, Takahashi N, Ito M, Toda H, Ono T, et al. Expression of the chemokine receptor CCR6 correlates with a favorable prognosis in patients with adenocarcinoma of the lung. Tumor Biol. 2011;32(1):197–202. 10.1007/s13277-010-0113-x [DOI] [PubMed] [Google Scholar]
Associated Data
This section collects any data citations, data availability statements, or supplementary materials included in this article.
Supplementary Materials
Supplementary figures have been supplied as separate files as requested by the author guidelines.
Supplementary figures legends:
Supplementary Table 1 Lists of genes positively (in green) and negatively (in red) correlated with ALDH2 in lung adenocarcinoma (the Cancer Genome Atlas Firehose Legacy dataset) from cBioPortal for Cancer Genomics.
Supplementary Figure 1 Aldehyde dehydrogenase 2 expression in lung adenocarcinoma patients based on their smoking habits. Analysis performed on lung adenocarcinoma (LUAD) gene expression data from The Cancer Genome Atlas (TCGA) using the University of ALabama at Birmingham CANcer data analysis Portal (UALCAN) (https://ualcan.path.uab.edu/).
Supplementary Figure 2 Correlation between ALDH2 and selected biological pathways by correlation‐based Gene Set Enrichment Analysis (corGSEA). Analysis was performed using the Correlation AnalyzeR web tool (https://gccri.bishop-lab.uthscsa.edu/shiny/correlation-analyzer/).
Supplementary Figure 3 Prognostic value of aldehyde dehydrogenase 2 in lung adenocarcinoma. Kaplan‐Meier survival curves for disease‐free interval (DFI), disease‐specific survival (DSS), progression‐free interval (PFI), and relapse‐free survival (RFS) in low‐ and high‐ALDH2 expression groups. Analysis was performed using the Tumor online Prognostic analyses Platform (ToPP) (http://www.biostatistics.online/topp/index.php) on the TCGA.
Data Availability Statement
The data that support the findings of this study are available from the corresponding authors upon reasonable request.


