Abstract
There are conflicting data regarding the prognostic effect of microvascular density (MVD) in breast cancer and its molecular subtypes. It is thought that high levels of FOXP3 + T cells in breast cancer are associated with poor prognosis. However, data regarding FOXP3 show significant variability in the literature. In our study, we aim to measure MVD and FOXP3 + T cells in breast cancer cases and investigate their relationship with each other and their effects on breast cancer patients’ clinical and prognostic features. In our study, the results of 207 female breast cancer patients whose excisional tumoral tissue was obtained are presented. The study evaluated the findings under a light microscope using antibodies against CD34 for measuring MVD and FOXP3 for measuring FOXP3-positive T cells. CD34 ≥ 17 was categorized as high MVD, and CD34 < 17 was classified as low MVD. FOXP3 + cell count ≥ 20/mm2 was categorized as high FOXP3 positivity and < 20/mm2 as low FOXP3 positivity. The SPSS program (version 22) was used to evaluate the results statistically, and p < 0.05 was considered significant. The median age was 54.0 (27–86) years, and the median follow-up period was 60.0 (IQR: 42.6–86.5) months. In the high MVD group, a higher progesterone receptor (PR) positivity rate was detected (p = 0.035). High FOXP3 positivity was significantly associated with high nuclear grade (p = 0.003). High FOXP3 positivity was significantly associated with PR negativity and high Ki67 values (p = 0.009, p = 0.012, respectively). No statistically significant correlation was found between MVD elevation and FOXP3 positivity (r = 0.063, p = 0.36). A weakly significant positive correlation was detected between high Ki67 and FOXP3 positivity (r = 0.0146, p = 0.04). A weak inverse correlation was detected between high FOXP3 positivity and PR percentage values (r=-0.182, p = 0.01). While there was no significant difference in disease-free survival in cases with high MVD and high FOXP3 + T cells compared to groups with low levels, the results were not mature enough because the median values in overall survival could not be reached. A significant correlation was found between high FOXP3 positivity and some aggressive tumor features; no effect on survival was detected. In contrast to literature data on luminal A breast cancer, high MVD in the luminal B (HER2-) subgroup was associated with a lower risk of recurrence. Our study is the first in the literature to evaluate the relationship between MVD measured using CD34 and FOXP3 positive T cells in breast cancer. Our study found no correlation between MVD and FOXP3 positivity, while literature data show significant correlations in some other cancers.
Keywords: FOXP3 T cells, Microvascular density, CD34, Breast cancer
Subject terms: Cancer, Oncology
Introduction
Despite advances in primary and adjuvant treatments in early-stage breast cancer (BC), distant metastases still develop in many patients. Especially in the last decade, metastatic breast cancer (MBC) continues to be a disease for which a complete cure cannot be achieved despite the significant advances made in its treatment1,2. Therefore, it can be said that both new treatments and new markers to predict poor prognostic disease are needed. Two topics that have been widely researched for this purpose, especially in the last decades, are intra-tumoral angiogenesis and the characteristics of the intra-tumoral and tumor-adjacent immune microenvironment.
Immunohistochemical (IHC) staining for MVD is usually performed with factor 8 antigen (von Willebrand antigen - vWF), CD31, or CD34. Recent evidence suggests that tumor angiogenesis is associated with patient outcomes in a range of cancers, particularly breast and lung3,4. Although many observational studies (prospective or retrospective) have concluded that MVD is a prognostic factor in invasive breast cancer, different studies have reached opposite conclusions3. In a meta-analysis of fourteen studies, MVD, as a marker of angiogenesis in invasive breast cancer, was shown to be a poor prognostic predictor, especially in node-negative cases5. When examined according to molecular classification, a study found no significant difference in MVD between patients with luminal A (62 patients) and basal-like phenotype (62 patients) BC. Still, it was found for the first time that MVD was a prognostic factor in high-grade luminal A BC, although not in the basal-like group6.
It is generally accepted that MVD is higher in both basal-like and triple-negative BC than in the non-basal-like and non-triple-negative groups7. In a study conducted on non-luminal BC, high MVD was associated with poor survival. The same study showed no difference in MVD between the triple-negative and HER2 + groups8. In this study, high MVD was associated with poor prognosis in five-negative ( defined as epidermal growth factor receptor (EGFR) and cytokeratin 5/6 (CK5/6) negativity in addition to triple-negative breast cancer) and HER2 + breast cancer, but no significant relationship was found in basal-like type. Until this study, no study comparing the prognostic value of MVD in the non-luminal molecular subgroup of breast cancer was known8.
In recent years, new evidence has emerged that the elevation of tumor-infiltrating lymphocytes (TIL) present in breast cancer before treatment has a role in predicting response to treatment and prognosis9,10. Not only the amount of lymphocytic infiltrate but also the phenotype of this infiltrate determines the clinical outcome. Type 1 T cells are associated with a favorable prognosis. CD4 + T-helper 1 (Th1) cells facilitate antigen presentation through cytokine secretion and activation of antigen-presenting cells.
CD8 + cytotoxic T cells (CTL) are essential for tumor destruction11. On the other hand, type 2 CD4 + T-helper cells (Th2), including Forkhead box P3+ (FOXP3) and CD4 + regulatory T-cells (Treg), inhibit CTL function, promote the proliferation of B-lymphocytes, and exert an anti-inflammatory immune effect. As a result, it may increase tumor growth12. It is thought that high levels of FOXP3 + T cells in BC are associated with poor prognosis.
Studies examining the relationship between TILs and MVD are limited. In light of this information, although the relationship of MVD with some clinicopathological features and prognosis in BC and its subtypes has been shown, there are conflicting data, and more data is needed regarding the usability of MVD in clinical practice. Our study aims to measure MVD and FOXP3 + T cells immunohistochemically in BC cases and to investigate their relationship with each other and their effects on BC patients’ clinical and prognostic features.
Materials and methods
Case selection
Cases diagnosed with breast carcinoma histopathologically at Afyonkarahisar Health Sciences University Faculty of Medicine Department of Pathology between January 2012 and December 2022 were included in this study. Three hundred thirty female cases (male patients excluded) with excision material records were identified in the archive. Among these cases, cases that received neoadjuvant chemotherapy (39 cases), cases that did not have sufficient material in the tumor-registered tissue blocks in our archive (20 cases), cases that could not be found in tumor-registered blocks (41 cases) were excluded. Eventually, 230 modified radical mastectomy (MRM) or breast-conserving surgery (BCS) materials were included in the study. Out of two hundred and thirty samples, the resultant value could not be obtained in IHC staining in 23 cases due to spillage during the procedures and other technical reasons. As a result, the IHC staining results of 207 cases were included in the analysis. Demographic data, follow-up, and treatment information for the cases were obtained using the hospital automation system and the medical oncology department file archive. A tumor block was selected for each patient, which had appropriate fixation, did not contain tracking artifacts, had no areas of necrosis, had sufficient tumor area, and was suitable for IHC staining.
Ethical approval
The study received local ethics committee approval from the Afyonkarahisar Health Sciences University Faculty of Medicine Clinical Research Ethics Committee, with a decision dated 13.05.2022 and numbered 2022/6. The study was conducted using the principles of the Declaration of Helsinki. Given the retrospective study design, the need for informed consent was waived by the Afyonkarahisar Health Sciences University Faculty of Medicine Clinical Research Ethics Committee.
Histomorphological evaluation
A histological subtype, histological grade, molecular classification, ER, PR and HER2 status, Ki67 index, tumor diameter, axillary lymph node metastasis, lymphovascular invasion (LVI), perineural invasion (PNI), and pathological stage (according to AJCC 8th Edition) were evaluated, and data were updated in case of discrepancy. Tumor localization; right or left breast, type of operation; MRM and BCS, tumor grade (Modified Bloom Richardson Histological Grading System); grade 1, grade 2, grade 3, tumor diameter; ≤2 cm, 2–5 cm, >5 cm, tumor pathological stage; 1, 2 A, 2B, 3 A, 3B AND 4, tumor molecular classification; It is divided into four categories as HR + HER2-, HR + HER2+, HR- HER2+, HR- HER2- as well as Luminal A, Luminal B (HER2-), Luminal B (HER2+), HER2 overexpressed and basal-like (triple negative) for relapse, and death risk, and survival assessments was analyzed in five groups. Ki67 index: They were categorized as ≥ 15 and < 15 for luminal grouping. In descriptive statistics and comparisons, the Ki67 was evaluated as ≥ 20 and < 20, and ER, PR, HER2 status, LVI, and PNI status were assessed as present or absent.
Immunohistochemical method
Immunohistochemical (IHC) examination was applied to sections from paraffin blocks selected from tissues fixed in a 10% formalin solution. CD34 and FoxP3 were used as primary antibodies. The Bond Polymer Refine Detection (Leica brand, DS9800) kit was used for the primary antibody. Immunohistochemistry for each antibody was performed on all cases using a Leica Bandmax automatic immunohistochemistry device. The primary antibodies used in the IHC study and the applications performed are shown in Table 1. 1–1.5 micron thick sections were taken from the paraffin blocks included in the study on adhesive slides. The staining procedure was performed on a Leica Bandmax brand automatic immunohistochemistry device.
Table 1.
Immunohistochemical application procedure.
| Primary Antibody | Clone | Dilution | Incubation time | Antigen Reveal |
Company |
|---|---|---|---|---|---|
| CD34 | QBEnd710 | 1:400 | 20 min | ER1 | Thero |
| FOXP3 | EP340 | 1:50 | 40 min | ER2 | BioS |
Immunohistochemical evaluation
H&E (Hematoxylin & Eosin) stained preparations were examined under an Olympus BX51 model microscope. ER, PR, HER2, and Ki67 IHC stains in the archives of the cases were re-evaluated. According to the ASCO/CAP guideline, the ER and PR scoring was considered positive in cases with > 1% nuclear staining. According to the HER2 test ASCO/CAP guideline, cases in which no positive staining was observed by IHC method were given score 0; Score 1 is weak brown membranous staining in tumor cells regardless of the staining percentage; Score 2: weak-moderate intensity or complete and irregular brown staining in > 10% of tumor cells or robust, complete and regular membranous staining in < 30% of tumor cells; Strong, complete and regular membranous staining in > 30% of tumor cells was accepted as score 3. The Ki67 evaluation gave the percentage of tumor cells with nuclear staining. These evaluations determined the molecular subtypes of the cases.
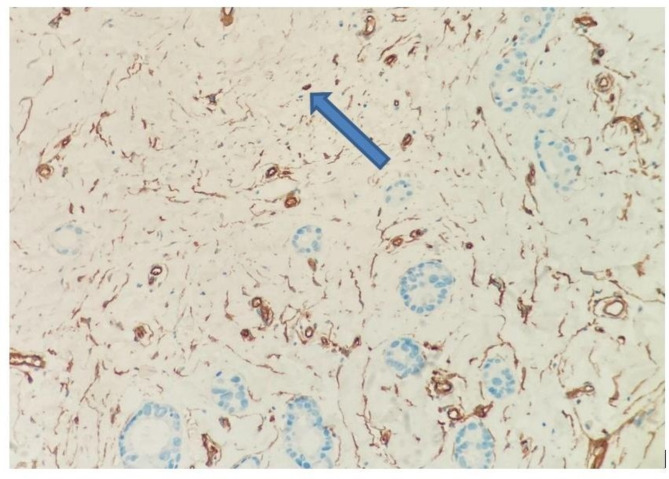
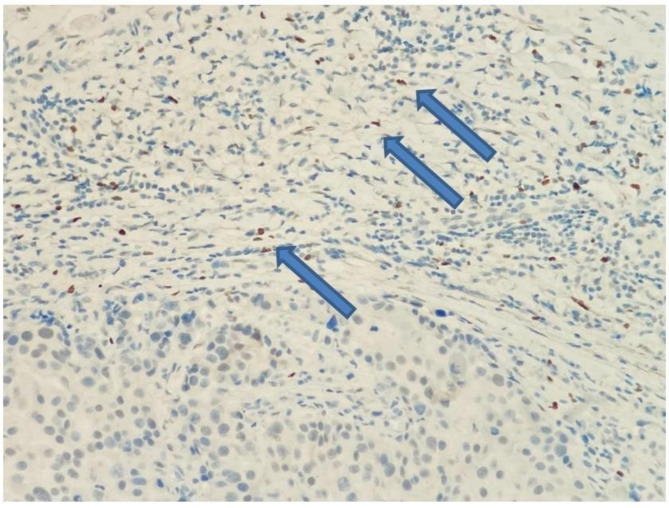
MVD in the tumor was measured with CD34. First, the place with the highest vascular density was selected at low magnification, then at 40 and 100 magnifications. Then, cell populations that did not form a lumen were counted in a 1 mm square area (mm2) at 400 magnification13,14 (Fig. 1). When evaluating FOXP3, the area with the most intense staining at low magnification was determined in the peritumoral region. The amount of cells in a 1 mm2 area was calculated15,16 (Fig. 2). All methods were carried out according to relevant guidelines and regulations.
Fig. 1.
Microvessel structure that does not form a lumen and gives a positive reaction with CD34 antibody staining (x200, blue arrow).
Fig. 2.
In the lymphocytic response against the tumor, T lymphocytes show a nuclear positive reaction with FOXP3 immunohistochemically (x200, blue arrows).
Endpoints and statistical analysis
The primary endpoints were to evaluate the effect of MVD and FOXP3 + TILs on disease-free survival (DFS), overall survival (OS), and the relationship between MVD and FOXP3 + TILs. Secondary endpoints were determined as the relationship of MVD and FOXP3 + TILs with the characteristic features of the patients, such as age, menopause, and other clinicopathological factors such as ER, PR, HER2, Ki67, grade, molecular subtypes, and staging features. DFS is the time from the operation date to the disease recurrence development. OS is defined as the time from the date of diagnosis to death. Since no significant cut-off value for relapse or death was detected in the ROC (receiver operating characteristic) analysis for CD34, the median value was calculated as the cut-off value. CD34 ≥ 17 for high MVD and CD34 < 17 for low MVD (median CD34 was determined as cut-off). Since no significant cut-off value for relapse or death was found in the ROC analysis for FOXP3, the median value was calculated as the cut-off value. It was categorized according to the number of FOXP3 + cells being ≥ 20/mm2 for high FOXP3 positivity and < 20/mm2 for low FOXP3 positivity (median FOXP3 was determined as cut-off).
In the study, descriptive statistics were made by determining the mean, median, and ratios of the variables in the results. Chi-square and Fisher’s exact test were used for categorical variables to compare the rates between groups, the Mann-Whitney-U test was used to compare the medians between two groups, and the Student’s t-test and Mann-Whitney-U test was used to compare the means. Since the data were not normally distributed, the Spearman correlation test was used for correlation analyses, and Kaplan-Meier curves and Log-rank tests were used for survival analyses. In the statistical evaluation of the results, p < 0.05 was considered significant. Cox’s regression analysis was conducted when the log-rank test indicated statistical significance (p < 0.05). For categorical variables with statistical significance and containing more than two subgroups, new p values were calculated using Bonferroni correction. SPSS program version 22 was used for statistical analysis.
Results
The median age of 207 female breast cancer cases was 54.0 (min-max: 27–86), and the median follow-up period was 60.0 (Interquartile range (IQR): 42.6–86.5) months. One hundred twenty-two (58.9%) of the patients were postmenopausal, and the median body mass index was 30.5 (19.4–54.7) (Table 2). The most common histological subtype was invasive ductal carcinoma, with 86% (178 patients). In 87% (180 patients), ER positivity was detected in the cases, and PR positivity was detected in 79.7%. HER2 positivity was present in 32 (15.5%) cases (Table 2). Fifteen (7.2%) cases had triple-negative disease. Half of the cases (104) had stage 2 disease at diagnosis. In histopathological examination, 97 (46.9%) cases had grade 2 tumor features, and 48 (23.2%) cases had grade 3 tumor features. The number of cases with Ki67 ≥ 20% was detected in 110 (55.6%). BCS was performed as primary tumor surgery in 105 (49.8%) cases. There were 108 (52.2%) cases with high FOXP3 (≥ 20) levels and 104 (50.2%) cases with high MVD levels (≥ 17) (Table 2).
Table 2.
General characteristics.
| N = 207 | |
|---|---|
| Age at diagnosis, median (min-max) | 54.0 (27–86) |
| Body mass index (kg/m2), median (min-max) | 30.5 (19.4–54.7) |
|
Menopause status n (%) Premenopausal Postmenopausal |
85 (41.1) 122 (58.9) |
|
Histological type n (%) Invasive ductal carcinoma Invasive lobular carcinoma Mixt* Others ** |
178 (86.0) 13 (6.3) 3 (1.4) 13 (6.3) |
|
Estrogen receptor, n (%) Positive Negative |
180 (87.0) 27 (13.0) |
|
Progesterone receptor, n (%) Positive Negative |
165 (79.7) 42 (20.3) |
|
HER2 receptor, n (%) Positive Negative |
32 (15.5) 175 (84.5) |
|
Molecular subgroups, n(%) HR + Her2-† HR + Her2+ HR- Her2+ HR- Her2 (triple-negative) |
160 (77.3) 22 (10.6) 10 (4.8) 15 (7.2) |
|
Stage at diagnosis, n (%) Stage 1 Stage 2 Stage 3 Stage 4 |
41 (19.8) 104 (50.2) 41 (19.8) 21 (10.1) |
|
Histological grade, n (%) Grade 1 Grade 2 Grade 3 |
55 (26.6) 97 (46.9) 48 (23.2) |
|
Ki67, n (%) <%20 ≥%20 |
88 (44.4) 110 (55.6) |
|
Surgery, n (%) Breast-conserving surgery Radical mastectomy Simple mastectomy |
105 (49.8) 99 (47.1) 3 (3.1) |
|
Secondary malignancy Absent Present |
195 (94.2) 12 (5.8) |
|
FOXP3 positivity (number of cells/mm2) <20 ≥20 |
99 (47.8) 108 (52.2) |
|
MVD (measured by CD34 ) Low (< 17) High (≥ 17) |
103 (49.8) 104 (50.2) |
|
Adjuvant chemotherapy, n (%) Present Absent |
136 (73.9) 48 (26.1) |
|
Adjuvant radiotherapy, n (%) Present Absent |
141 875.4) 46 (24.6) |
|
Adjuvant endocrine treatment, n (%) Present Absent |
153 (85.5) 26 (14.5) |
|
Adjuvant anti-HER2 treatment, n (%) Present Absent |
19 (10.4) 163 (89.6) |
* Mix: tumors that have at least two different histological types.
** Others: subtypes include medullary carcinoma, mucinous carcinoma, metaplastic carcinoma, papillary carcinoma, and tubular carcinoma, †HR: hormone receptor HER2: human epidermal growth factor 2.
A significant relation was found between high MVD and a higher rate of PR positivity (p = 0.035) according to the Chi-square test (Table 3). In the Chi-square test, there was a recurrence in eight patients in the low MVD group and two in the high MVD group for the Luminal B (HER2-) subtype (p = 0.02, Table 3). The chi-square test detected no significant differences in recurrence and death rates in other subtypes according to FOXP3 and MVD categories (Tables 3 and 4). No significant relationship was found between other clinicopathological features and MVD. High FOXP3 positivity was significantly associated with lower PR positivity rate and lower mean PR percentage (p = 0.009 and p = 0.001, respectively) (Table 4). High FOXP3 positivity was significantly associated with high nuclear grade (grade 3) (p = 0.003). High FOXP3 positivity was significantly associated with the patient group with a high Ki67% (≥ 20) (p = 0.012) and high Ki67 mean levels (p = 0.029) (Table 4).
Table 3.
Comparison of clinicopathological characteristics of patients according to MVD status by Chi-square test.
| Low MVD (n = 103) | High MVD (n = 104) | p-value | |
|---|---|---|---|
| Age, mean (SD)* | 54.4 (12.3) | 53.9 (12.6) | 0.6 |
| Body mass index (kg/m2), mean (SD) | 31.1 (6.2) | 30.5 (5.8) | 0.48 |
|
Menopause status n (%) Premenopausal Postmenopausal |
39 (37.9) 64 (62.1) |
46 (44.2) 58 (55.8) |
0.35 |
|
Histological subtype, n (%) Invasive ductal carcinoma Invasive lobular carcinoma Mix** Others† |
88 (85.4) 5 (4.9) 1 (1.0) 9 (8.7) |
90 (86.5) 8 (7.7) 2 (1.9) 4 (3.8) |
0.41 |
|
ER, n (%) Negative Positive |
14 (13.6) 89 (86.4) |
13 (12.5) 91 (87.5) |
0.97 |
| ER percentage, mean (SD) | 67.5 (32.8) | 71.7 (32.8) | 0.14 |
|
PR, n (%) Negative Positive |
27 (26.2) 76 (73.8) |
15 (14.4) 89 (85.6) |
0.035 |
| PR percentage, mean (SD) | 49.6 (39.0) | 55.7 (34.8) | 0.36 |
|
HER2, n (%) Negative Positive |
83 (80.6) 20 (19.4) |
92 (88.5) 12 (11.5) |
0.16 |
|
Triple-negative, n (%) Absent Present |
94 (91.3) 9 (8.7) |
98 (94.2) 6 (5.8) |
0.57 |
|
Molecular subtype, n (%) HR + HER2- HR + HER2+ HR- HER2+ HR- HER2- (triple-negative) |
74 (71.8) 16 (15,5) 4 (3.9) 9 (8.7) |
86 (82.7) 6 (5.8) 6 (5.8) 6 (5.8) |
0.89 |
|
Molecular subtype, n (%) Luminal A Luminal B (HER2-) Luminal B (HER2+) HR- HER2+ HR- HER2- (triple-negative) |
31 (30.1) 43 (41.7) 16 (15.5) 4 (3.9) 9 (8.7) |
37 (35.6) 49 (47.1) 6 (5.8) 6 (5.8) 6 (5.8) |
0.16 |
|
Nuclear grade n (%) Grade1 Grade2 Grade3 |
26 (25.2) 53 (51.5) 24 (23.3) |
29 (29.9) 44 (45.4) 24 (24.7) |
0.66 |
|
Ki67, n (%) <%20 ≥%20 |
43 (43.0) 57 (57.0) |
45 (45.9) 53 (54.1) |
0.67 |
| Ki67 (%), mean (SD) | 26.9 (21.5) | 27.4 (23.1) | 0.99 |
|
Lymphovascular invasion, n (%) Absent Present |
42 (44.2) 53 (55.8) |
51 (56.0) 40 (44.0) |
0.10 |
|
Perineural invasion, n (%) Absent Present |
47 (64.4) 26 (35.6) |
39 (60.0) 26 (40.0) |
0.59 |
|
Pathological T stage, n (%) T1-T2 T3-T4 |
89 (86.4) 14 (13.6) |
93 (93.6) 6 (6.1) |
0.12 |
|
Pathological N stage, n (%) N0 N1 N2 N3 |
. 52 (52.0) 23 (22.5) 17 (16.7) 9 (8.8) |
57 (59.4) 25 (26.0) 7 (7.3) 7 (7.3) |
0.21 |
|
TNM stage, n (%) Stage 1 Stage 2 Stage 3 Stage 4 |
21 (20.4) 46 (46.6) 25 (24.3) 9 (8.7) |
20 (19.2) 56 (53.8) 16 (15.4) 12 (11.5) |
0.38 |
|
Relapse, n (%) Absent Present |
83 (87.4) 12 (12.6) |
86 (94.1) 5 (5.9) |
0.24 |
*SD; standard deviation, **Mix; Tumors that have at least two different histological types, †Others; subtypes include medullary carcinoma, mucinous carcinoma, metaplastic carcinoma, papillary carcinoma, and tubular carcinoma.
Table 4.
Comparison of clinicopathological characteristics of patients according to FOXP3 status by Chi-square test.
| Low FOXP3+ (n = 99) | High FOXP3+ (n = 108) | p-value | |
|---|---|---|---|
| Age, mean (SD)* | 54.8 (13.3) | 53.6 (11.6) | 0.8 |
| Body mass index (kg/m2), mean (SD) | 30.3 (5.7) | 31.2 (6.3) | 0.48 |
|
Menopause status n (%) Premenopausal Postmenopausal |
43 (43.4) 56 (56.6) |
42 (38.9) 66 (61.1) |
0.50 |
|
Histological subtype, n (%) Invasive ductal carcinoma Invasive lobular carcinoma Mix¶ Others † |
80 (80.8) 10 (10.1) 2 (2.0) 7 (7.1) |
98 (90.7) 3 (2.8) 1 (0.9) 6 (5.6) |
0.11 |
|
ER, n (%) Negative Positive |
9 (9.1) 90 (90.7) |
18 (16.7) 90 (83.3) |
0.15 |
| ER percentage, mean (SD) | 75.0 (29.2) | 64.5 (35.2) | 0.03 |
|
PR, n (%) Negative Positive |
12 (12.1) 87 (87.9) |
30 (27.8) 78 (72.2) |
0.009 |
| PR percentage, mean (SD) | 60.5 (35.9) | 45.2 (36.6) | 0.001 |
|
HER2, n (%) Negative Positive |
88 (88.9) 11 (11.1) |
87 (80.6) 21 (19.6) |
0.14 |
|
Triple-negative, n (%) Absent Present |
95 (96.0) 4 (4.0) |
97 (89.8) 11 (10.2) |
0.15 |
|
Molecular subtype, n (%) HR + HER2- HR + HER2+ HR- HER2+ HR- HER2- (triple-negative) |
84 (84.8) 7 (7.1) 4 (4.0) 4 (4.0) |
76 (70.4) 15 (13.9) 6 (5.6) 11 (10.2) |
0.09 |
|
Molecular subtype, n (%) Luminal A Luminal B (HER2-) Luminal B (HER2+) HR- HER2+ HR- HER2- (triple-negative) |
35 (35.4) 49 (49.5) 7 (7.1) 4 (4.0) 4 (4.0) |
33 (30.6) 43 (39.8) 15 (13.9) 6 (5.6) 11 (10.2) |
0.16 |
|
Nuclear grade n (%) Grade1 Grade2 Grade3 |
33 (34.4) 48 (50.0) 15 (15.6) |
22 (21.2) 49 (47.1) 33 (31.7) |
0.014 0.02 0.34 0.003** |
|
Ki67, n (%) <%20 ≥%20 |
51 (53.7) 44 (46.3) |
37 (35.9) 66 (64.1) |
0.012 |
| Ki67 (%), mean (SD) | 22.3 (17.6) | 31.6 (25.1) | 0.029 |
|
Lymphovascular invasion, n (%) Absent Present |
45 (50.0) 45 (50.0) |
48 (50.0) 48 (50.0) |
1.0 |
|
Perineural invasion, n (%) Absent Present |
42 (61.8) 26 (38.2) |
44 (62.9) 26 (37.1) |
0.89 |
|
Pathological T stage, n (%) T1-T2 T3-T4 |
85 (88.5) 11 (11.5) |
97 (91.5) 9 (8.5) |
0.63 |
|
Pathological N stage, n (%) N0 N1 N2 N3 |
47 (50.5) 28 (30.1) 12 (12.9) 6 (6.5) |
63 (60.0) 20 (19.0) 12 (11.4) 10 (9.5) |
0.26 |
|
TNM stage, n (%) Stage 1 Stage 2 Stage 3 Stage 4 |
23 (23.2) 44 (44.4) 21 (21.2) 11 (11.1) |
18 (16.7) 60 (55.6) 20 (18.5) 10 (9.3) |
0.42 |
|
Relapse, n (%) Absent Present |
73 (93.6) 5 (6.4) |
79 (89.8) 9 (10.2) |
0.54 |
*SD; standard deviation, ** The adjusted new p-value is 0.008, ¶ Mix; Tumors that have at least two different histological types, †Others; subtypes include medullary carcinoma, mucinous carcinoma, metaplastic carcinoma, papillary carcinoma, and tubular carcinoma.
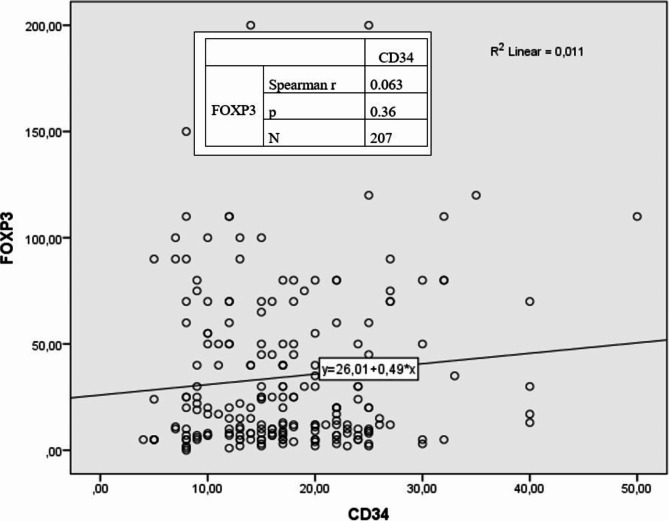
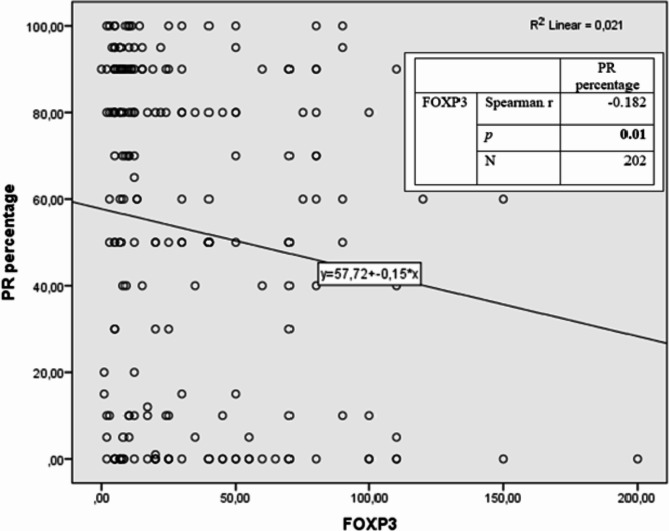
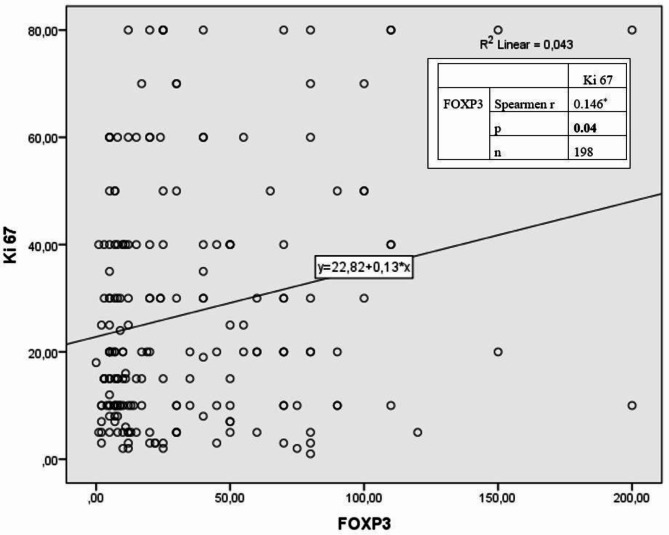
No statistically significant correlation was detected between MVD and FOXP3 positivity (r = 0.063, p = 0.36) (Fig. 3). A weak (r= −0.182) and significant (p = 0.01) inverse correlation was detected between FOXP3 and PR percentage. (Fig. 4). A weak (r = 0.146) and significant (p = 0.04) positive correlation was detected between FOXP3 and Ki67 percentages (Fig. 5).
Fig. 3.
Relationship between CD34 and FOXP3 according to Spearman correlation analysis.
Fig. 4.
Relationship between PR and FOXP3 according to Spearman correlation analysis.
Fig. 5.
Relationship between Ki67 and FOXP3 according to Spearman correlation analysis.
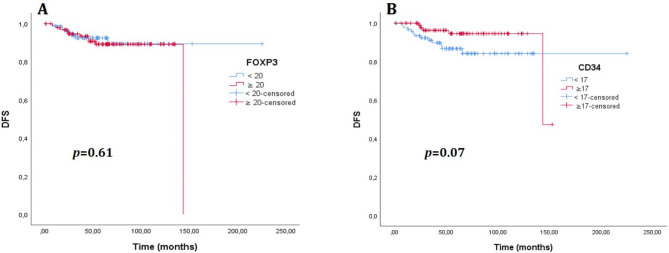
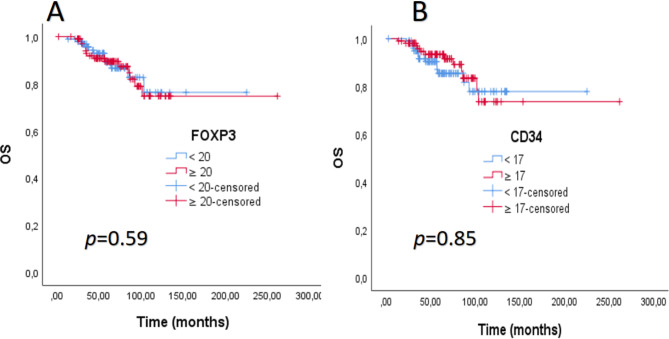
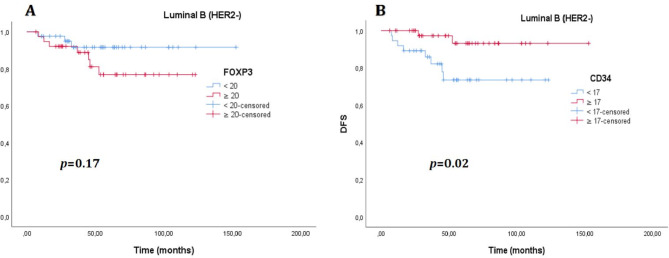
There was no significant difference in DFS between the cases with high MVD and high FOXP3 + T cells and the low MVD and low FOXP3 groups (p = 0.61 and p = 0.07, respectively) (Fig. 6 ). Again, no significant difference was found between the groups in OS (p = 0.59 and p = 0.85, respectively) (Fig. 7). The median OS and DFS times were not estimated for the entire group (Table 5). When analyzed by molecular subtypes, a significant difference was observed only for the luminal B (HER2-) patients regarding MVD in DFS (Table 5). Although the median values were not estimated, the DFS time was observed to be longer in the group with high MVD in the Luminal B (HER2-) subtype (p = 0.02, Fig. 8). No significant difference was detected in DFS and OS in any other subtype, according to MVD and FOXP3 groups (Table 5). According to the low MVD and high MVD categories, the 3, 5, and 7-year cumulative survival rates were 90%, 86%, and 78% for low MVD and 93%, 92%, and 83% for high MVD, respectively. According to the low FOXP3 and high FOXP3 categories, the 3, 5, and 7-year cumulative survival rates were 93%, 87%, and 83% for low FOXP3 and 91%, 90%, and 79% for high FOXP3, respectively.
Fig. 6.
(A). Disease-free survival (DFS) curve according to FOXP3 level, (B). Disease-free survival curve according to CD34 level.
Fig. 7.
(A). Overall survival (OS) curve according to FOXP3 level. (B). Overall survival (OS) curve according to CD34 level.
Table 5.
Number of patients with relapse and death, DFS, and OS times according to molecular subtypes for FOXP3 and MVD categories.
| Molecular subtypes | DFS, n* (median)* | p-value | DFS, n(median) | p-value | ||
|---|---|---|---|---|---|---|
| Low FOXP3 | High FOXP3 | Low MVD | High MVD | |||
| Luminal A | 0/33 (NE)** | 1/32 (NE) | NE | 0/31 (NE) | 1/34 (NE) | NE |
| Luminal B (HER2-) | 3/42 (NE) | 7/39 (NE) | 0.17 | 8/37 (NE) | 2/44 (NE) | 0.02 |
| Luminal B (HER2+) | 2/6 (NE) | 1/13 (NE) | 0.08 | 3/15 (NE) | 0/4 (NE) | 0.36 |
| HR- HER2+ | 1/4 (NE) | 0/3 (NE) | 0.38 | 0/3 (NE) | 1/4 (NE) | 0.39 |
| HR- HER2- | 1/4 (NE) | 1/11 (NE) | 0.43 | 1/9 (NE) | 1/6 (NE) | 0.43 |
| Overall | 7/89 (NE) | 10/98 (143.5) | 0.61 | 12/95 (NE) | 5/92 (NE) | 0.07 |
| Molecular subtypes | OS, n(median) | OS, n(median) | p-value | |||
| Low FOXP3 | High FOXP3 | Low MVD | High MVD | |||
| Luminal A | NE | NE | 0.59 | NE | NE | 0.80 |
| Luminal B (HER2-) | NE | NE | 0.55 | NE | NE | 0.11 |
| Luminal B (HER2+) | NE | NE | 0.49 | NE | NE | 0.54 |
| HR- HER2+ | NE | NE | 0.58 | NE | NE | 0.30 |
| HR- HER2- | NE | NE | 0.48 | NE | NE | 0.15 |
| Overall | NE | NE | 0.59 | NE | NE | 0.85 |
* n is presented as relapse/total number of patients. Median values are presented in months **NE; not estimated.
Fig. 8.
(A). Disease-free survival (DFS) curve according to FOXP3 level in the luminal B (HER2-) molecular group, (B). Disease-free survival curve according to CD34 level in the luminal B (HER2-) molecular group.
In the univariate Cox regression analysis of the Luminal B (HER2-) subtype, high MVD status was found to be associated with a lower hazard ratio (HR) for DFS (HR: 0.19, 95% CI: 0.04–0.92, p = 0.039) (Table 6) and presence of lymphovascular invasion, higher pathological T stage, higher pathological N stage were found to be associated with a higher HR for DFS (p = 0.027, p = 0.002, p = 0.026 respectively, Table 6). In multivariate analysis, no statistical significance was found in any variables (Table 6).
Table 6.
Cox’s proportional hazard model for DFS in Luminal B (HER2-) breast cancer cases.
| Univariate analysis | Multivariate analysis | |||
|---|---|---|---|---|
| p-value | HR (%95 CI) | p-value | HR (%95 CI) | |
| MVD (high/low) | 0.039 | 0.19 (0.04–0.92) | 0.93 | - |
| FOXP3 (high/low) | 0.18 | 2.47 (0.64–9.59) | - | - |
| Lymphovascular invasion (present/absent) | 0.027 | 10.8 (1.31–88.33) | 0.17 | 4.64 (0.49–43.15) |
| Patological T stage (T3-4/T1-2) | 0.002 | 8.55 (2.15–33.97) | 0.20 | 2.72 (0.58–12.58) |
| Patological N stage (N2-3/N0-1) | 0.026 | 4.48 (1.19–16.77) | 0.093 | 3.34 (0.81–13.98) |
| Perineural invasion (PNI) | 0.055 | 8.25 (0.95–71.53) | - | - |
| Ki 67 (≥%20/<%20) | 0.46 | 2.16 (0.27–17.14) | - | - |
Discussion and conclusion
Our study found a significant relationship between the increase in PR level and the height of MVD. Clinico-pathological features significantly associated with high FOXP3 levels were low PR levels, high Ki 67 levels, and grade 3 tumors. No significant difference was found in both DFS and OS in patients with high FOXP3 and high MVD in women with BC compared to patients with low FOXP3 and low MVD.
In a study evaluating more than two hundred BCs, patients with tumors containing more than 15 FOXP3 + T cells found that relapse-free survival (RFS) (p = 0.04, HR 1.58, 95% CI 1.01–2.47) and OS (p= 0.07, HR 1.62 95% CI 0.96–2.74) was found to decrease17. Only higher FOXP3 infiltration among BC subgroups in HR + BC predicts worse survival17,18. In a study of one hundred and forty-eight HR + cases, increased FOXP3 infiltrate was shown to be associated with shorter RFS (p = 0.006, HR 2.20 95% CI 1.26–3.85) and OS times (p= 0.006, HR 2.57 95% CI 1.31–5.60)17. In our study, although no significant difference was detected in DFS and OS in the entire group, there were not sufficient numbers of relapses and deaths for evaluation, and the numbers for their analysis were even less compared to the molecular groups. However, when looked at numerically, recurrence was observed in 8 (11%) patients with high FOXP3 + and only 3 (4%) patients with low FOXP3 + in the HR + Her2- group, which seems compatible with literatüre data. In a study that included 123 patients, higher FOXP3 was significantly associated with better distant metastasis-free survival in the entire group. In molecular subgroups, HER2 + and higher FOXP3 in basal groups were significantly associated with better OS. No difference in OS was detected in either group19. In our study, there were numerically high FOX P3 positivity rates in HER2 + and triple negative cases, but no difference was detected in survival analyses. In the same study, high Ki67 levels, ER, and PR negativity were significantly associated with high FOXP319. Unlike ours, this study had no significant relationship between grade and FOXP3. West et al. found a significant relationship between young age, high grade, and high FOXP316. This study (143 ER-negative patients were included) stated that high FOXP3 levels were significantly associated with better RFS duration in high-grade patients. Similarly, better RFS was obtained in triple-negative and basal-like groups16.
In the study by Bates et al., with 237 patients, high FOXP3 was significantly associated with lymph node metastasis, high grade, ER(-), and HER2 positivity17. In our study, while there was a numerical difference in HER2 positivity, there were significantly higher FOXP3 levels in high-grade and PR(-) cases. Similarly, in Shou et al.‘s meta-analysis, high FOXP3 was significantly associated with HER2 positivity, lymph node metastasis, ER, and PR negativity, while no significant correlation was found with tumor diameter20. In this study, high FOXP3 was significantly associated with worse OS but not RFS.
In a meta-analysis of fourteen studies, MVD was shown to be a poor prognostic predictor, especially in node-negative cases5. In a study conducted by Tas et al. with 120 patients from our country, it was demonstrated that high microvessel density (MVD) was linked to poorer OS in breast cancer21. In the study conducted by Maschio et al. with 60 patients, although a significant relationship was found between metastasis and high CD34 expression, it was not correlated with an increased risk of death in multivariate analysis22.
According to molecular classification, Kraby et al. found no significant difference in MVD between patients with luminal A and basal-like phenotype BC. Still, MVD was found to be a prognostic factor in high-grade luminal A BC, and this was a finding detected for the first time6. In a study conducted on non-luminal BC, high MVD was associated with poor survival. The same study showed no difference in MVD between the triple-negative and HER2 + groups8. In this study, high MVD was associated with poor prognosis in five-negative (30 patients) and HER2 + breast cancer (60 patients), but no significant relationship was found in basal-like type (61 patients). In the study conducted by Maschio et al., significantly lower MVD was detected in triple-negative breast cancer compared to HER2+, but there was no difference in Luminal A and B22. In our study, the numerically high MVD rate was higher in the HR + HER2- groups (also in luminal A and B), and in the molecular subgroup examinations, there were more recurrence cases in those with low MVD in the luminal B (HER2-) BC group, and a significant risk increase was detected in the univariate regression for DFS; it was not reflected in the multivariate analysis. Unlike some studies in the literature, no evidence was found regarding the association of high MVD with poor prognosis in the luminal A group. Unlike our study, Maschio et al.‘s study found a significant relationship between ER + and high CD34 expression, but this relationship was not found for PR22. The study conducted by Şener et al. in our country with 100 invasive ductal carcinoma patients showed no significant relationship between age, ER, PR, HER2 status, and MVD. In this study, there was a significant relationship between tumor diameter, lymph node metastasis, and high MVD23. In our study, there was a substantial relationship only between PR positivity and high MVD. A series of 54 invasive breast carcinomas showed that high microvascular proliferation was significantly associated with ER-negative status and high histological grade24. There was no significant difference in molecular subgroups, similar to our study24. In another study, no difference was found between CD34 level and molecular groups, tumor diameter, lymph node metastasis status, and age, similar to our study, but high CD34 levels were correlated with LVI and high grade13. In another study, while high-grade ER(-) and PR(-) levels were correlated with high CD34 levels, there was no significant relationship between HER2 expression, tumor stage, LVI, and PNI25.
In BC, to our knowledge, only one study examined MVD and FOXP3 + T cells in the same patient group, and no study in the literature examined their relationship. Rico et al. evaluated cancer stem cell markers in thirty-two early-stage breast cancer patients; a substantial relationship between CD34 and FOXP3 elevations and recurrence was not found26. No analysis was made regarding their relationship in this study, and the number of patients was small26. In our study, no significant correlation was found between the two. Yugawa et al. found that high MVD status measured by CD34 was correlated with high CD8 + TIL but negatively correlated with high FOXP3 + TIL in cholangiocellular cancer [39]. In this study involving 100 patients, low MVD was linked to poorer survival rates and more aggressive tumor characteristics. At the same time, a high presence of FOXP3 + TILs also correlated with worse survival outcomes27. Giatromanolaki et al. evaluated angiogenesis and vascular viability ability by CD31 measurement in endometrial cancer (33 patients were included); low angiogenic activity and low vascular viability were accompanied by higher TIL (FOXP3+) accumulation in deep tumor areas28. Our study found no significant correlation between MVD (measured by CD34) and FOXP3 + TIL levels.
It is challenging to make a definitive comment about our study’s survival results due to the low number of relapses and deaths. This may be because the follow-up period is not long enough for this patient group, and the rate of triple-negative and HER2 + cases is relatively low. The low rate of HER2 + and triple-negative cases is thought to be due to the increasing tendency to give neoadjuvant therapy to these patients in light of the guideline information in recent years. The effect of the increase in FOXP3 + cells on the prognosis of BC is also contradictory in recent meta-analyses. The general trend in the results is that although high FOXP3 + rates are lower in HR + tumors, it is associated with a worse prognosis in this group of cases with high values. On the contrary, although there is a higher FOXP3 positivity rate in HER2 + and triple-negative groups, better survival times are observed in cases with high positivity. However, new studies are still needed due to many contradictory results. Although there is a general opinion that higher MVD is associated with a worse prognosis in BC, there is still no consensus on which patient group is more important. Similarly, the data regarding the situations in which it is a clinical guide and its use in clinical practice are insufficient and contradictory.
Our study evaluated the relationship between MVD and FOXP3 + cells for the first time in BC. Although there is evidence that they show an inverse correlation with each other in different tumors, no significant difference was detected in our study. Another important finding is that there is a tendency to have lower MVD in cases with recurrence in the luminal B (HER2-) patient group, which was not found in previous literature data. The survival data in our study are thought to be more mature when analyzed again after a more extended follow-up period. Further studies are needed regarding the role of MVD and FOXP3 + cells in BC and their relationship with each other across all cancers.
Abbreviations
- AJCC
American Joint Committee On Cancer
- ASCO/CAP
American Society of Clinical Oncology/College of American Pathologists
- BC
Breast cancer
- BCS
Breast-conserving surgery
- CD
Cluster of differentiation
- CD34
Cluster of differentiation
- CI
Confidence interval
- CT
Chemotherapy
- CTL
Cytotoxic T lymphocyte
- DFS
Disease-free survival
- ER
Estrogen receptor
- FOXP3
Forkhead box P3
- H&E
Hematoxylin-Eosin
- HER2
Human epidermal growth factor 2
- HR
Hormone receptor
- HR
Hazard ratio
- LPBC
Lymphocyte predominance breast cancer
- LVI
Lymphovascular invasion
- MBC
Metastatic breast cancer
- MRM
Modified radical mastectomy
- MVD
Microvascular density
- N
N stage
- OR
Odd’s ratio
- OS
Overall survival
- PNI
Perineural invasion
- PR
Progesterone receptor
- RFS
Relapse-free survival
- ROC
Receiver operating characteristics
- RT
Radyoterapi
- SD
Standard deviation
- T
Tumor stage
- Th1
T helper 1
- Th2
T helper 2
- TIL
Tumor-infiltrating lymphocyte
- TN
Triple-negative
- TNBC
Triple-negative breast cancer
- WHO
World Health Organization
Author contributions
Study concepts: Y. Culha, M. Baykara, C. Ozdemir, H. DemirStudy design: Y. Culha, M.Baykara, C. Ozdemir, H. DemirQuality control of data and algorithms: Y.Culha, M. Baykara, SE. Davarcı, B. Ünlü, H. DemirStatistical analysis: Y. Culha, SE. Davarcı, MO. Ak, B. ÜnlüIHC assessment and pathological evaluation: C. Ozdemir, MO. AkManuscript preparation: Y. Culha, M.Baykara, C. Ozdemir, H.DemirManuscript review: Y. Culha, M. Baykara, C. Ozdemir, H. Demir, SE Davarcı, MO. Ak, B. ÜnlüManuscript editing: Y.Culha, M. Baykara, H.Demir, C.Ozdemir.
Funding
This study was supported by Afyonkarahisar Health Sciences University Scientific Research Projects Coordination Unit project number 22. GENEL.020.
Data availability
All data generated or analyzed during this study are included in this published article, and datasets generated and analyzed are available from the corresponding author upon reasonable request.
Declarations
Competing interests
The authors declare no competing interests.
Consent for publication
All authors have approved the manuscript and consented to publication.
Footnotes
Publisher’s note
Springer Nature remains neutral with regard to jurisdictional claims in published maps and institutional affiliations.
References
- 1.Guarneri, V. & Conte, P. Metastatic breast cancer: therapeutic options according to molecular subtypes and prior adjuvant therapy. Oncologist14, 645–656 (2009). [DOI] [PubMed] [Google Scholar]
- 2.Güth, U., Elfgen, C., Montagna, G. & Schmid, S. M. Long-term survival and cure in distant metastatic breast cancer. Oncology97 (2), 82–93 (2019). [DOI] [PubMed] [Google Scholar]
- 3.Gasparini, G. Clinical significance of determination of surrogate markers of angiogenesis in breast cancer. Crit. Rev. Oncol. Hematol.37, 97–114 (2001). [DOI] [PubMed] [Google Scholar]
- 4.Meert, A. P. et al. The role of microvessel density on the survival of patients with lung cancer: a systematic review of the literature with meta-analysis. Br. J. Cancer. 87, 694 (2002). – 701. [DOI] [PMC free article] [PubMed] [Google Scholar]
- 5.Uzzan, B., Nicolas, P., Cucherat, M. & Perret, G. Y. Microvessel Density as a prognostic factor in women with breast Cancer: a systematic review of the literature and Meta-analysis. Cancer Res.64, 2941–2955, May 1, 2004. [DOI] [PubMed]
- 6.Kraby, M. R. et al. Microvascular proliferation in luminal A and basal-like breast cancer subtypes. J. Clin. Pathol.0, 1–7 (2015). [DOI] [PubMed] [Google Scholar]
- 7.Ribatti, D. et al. Angiogenesis and Antiangiogenesis in Triple-negative breast Cancer. Translational Oncol.9, 453–457 (2016). [DOI] [PMC free article] [PubMed] [Google Scholar]
- 8.Kraby, M. R. et al. Quantifying tumor vascularity in non-luminal breast cancers. J. Clin. Pathol.0, 1–9 (2017). [DOI] [PubMed] [Google Scholar]
- 9.Denkert, C. et al. Tumor-associated lymphocytes as an independent predictor of response to neoadjuvant chemotherapy in breast cancer. J. Clin. Oncol.28 (1), 105–113 (2010). [DOI] [PubMed] [Google Scholar]
- 10.Loi, S. et al. Prognostic and predictive value of tumor-infiltrating lymphocytes in a phase III randomized adjuvant breast cancer trial in node-positive breast cancer comparing the addition of docetaxel to doxorubicin with doxorubicin based chemotherapy: BIG 02–98. J. Clin. Oncol.31 (7), 860–867 (2013). [DOI] [PubMed] [Google Scholar]
- 11.Zitvogel, L., Galluzzi, L., Kepp, O., Smyth, M. J. & Kroemer, G. Type I interferons in anticancer immunity. Nat. Rev. Immunol.15 (7), 405–414 (2015). [DOI] [PubMed] [Google Scholar]
- 12.Tan, A. H., Goh, S. Y., Wong, S. C. & Lam, K. P. T helper cell-specific regulation of inducible costimulator expression via distinct mechanisms mediated by T-bet and GATA-3. J. Biol. Chem.283 (1), 128–136 (2008). [DOI] [PubMed] [Google Scholar]
- 13.Bates, G. J. et al. Quantification of regulatory T cells enables the identification of high-risk breast cancer patients and those at risk of late relapse. J. Clin. Oncol.24 (34), 5373–5380 (2006). [DOI] [PubMed] [Google Scholar]
- 14.Goyal, A. V., Shukla, S., Acharya, S., Vagha, S. & Jajoo, S. Correlation of microvessel density with histopathological parameters of carcinoma breast. Indian J. Med. Res.158 (4), 417–422 (2023). [DOI] [PMC free article] [PubMed] [Google Scholar]
- 15.Özdemir, Ç. et al. A role for mast cell-mediated antibodies in the formation of Cholesteatoma and Cholesteatoma-Induced Bone Erosion. Diagnostics (Basel). 13 (3), 455 (2023). [DOI] [PMC free article] [PubMed] [Google Scholar]
- 16.West, N. R. et al. Tumour-infiltrating FOXP3(+) lymphocytes are associated with cytotoxic immune responses and good clinical outcome in oestrogen receptor-negative breast cancer. Br. J. Cancer. 108 (1), 155–162 (2013). [DOI] [PMC free article] [PubMed] [Google Scholar]
- 17.Lee, S., Cho, E. Y., Park, Y. H., Ahn, J. S. & Im, Y. H. Prognostic impact of FOXP3 expression in triple-negative breast cancer. Acta Oncol.52 (1), 73–81 (2013). [DOI] [PubMed] [Google Scholar]
- 18.Stanton, S., Adams, S. & Disis, M. Variation in the incidence and magnitude of tumor infiltrating lymphocytes in breast cancer subtypes: A systematic review. JAMA oncology, Oct 1;2(10):1354–1360. (2016). [DOI] [PubMed]
- 19.Li, J. et al. The expression landscape of FOXP3 and its prognostic value in breast cancer. Ann. Transl Med.10 (14), 801 (2022). [DOI] [PMC free article] [PubMed] [Google Scholar]
- 20.Shou, J., Zhang, Z., Lai, Y., Chen, Z. & Huang, J. Worse outcome in breast cancer with higher tumor-infiltrating FOXP3 + tregs: a systematic review and meta-analysis. BMC Cancer. 16 (1), 687. 10.1186/s12885-016-2732-0 (2016). PMID: 27566250; PMCID: PMC5002190. [DOI] [PMC free article] [PubMed] [Google Scholar]
- 21.Tas, F. et al. Angiogenesis and p53 protein expression in breast cancer: prognostic roles and interrelationships. Am. J. Clin. Oncol.23 (6), 546–553 (2000). [DOI] [PubMed] [Google Scholar]
- 22.Maschio, L. B. et al. Immunohistochemical investigation of the angiogenic proteins VEGF, HIF-1α, and CD34 in invasive ductal carcinoma of the breast. Acta Histochem.116 (1), 148–157 (2014). [DOI] [PubMed] [Google Scholar]
- 23.Şener, E., Şipal, S. & Gündoğdu, C. Comparison of Microvessel density with prognostic factors in Invasive Ductal carcinomas of the breast. Turk. Patoloji Derg. 32 (3), 164–170 (2016). [DOI] [PubMed] [Google Scholar]
- 24.Bujor, I. S. et al. Evaluation of Vascular Proliferation in Molecular Subtypes of Breast Cancer. In Vivo. Jan-Feb;32(1):79–83. (2018). [DOI] [PMC free article] [PubMed]
- 25.Abbasi, A., Ghaffarizadeh, F. & Mojdeganlou, H. Prognostic significance of Microvessel Density in Invasive Ductal Carcinoma of breast. Int. J. Hematol. Oncol. Stem Cell. Res.17 (2), 100–105 (2023). [DOI] [PMC free article] [PubMed] [Google Scholar]
- 26.Rico, M. J. et al. Putative biomarkers of response to treatment in breast Cancer patients: a pilot assay. Cancer Invest.35 (6), 377–385 (2017). Epub 2017 Apr 20. [DOI] [PubMed] [Google Scholar]
- 27.Yugawa, K. et al. Prognostic impact of tumor microvessels in intrahepatic cholangiocarcinoma: association with tumor-infiltrating lymphocytes. Mod. Pathol.34 (4), 798–807. 10.1038/s41379-020-00702-9 (2021). Epub 2020 Oct 19. [DOI] [PubMed] [Google Scholar]
- 28.Giatromanolaki, A., Kouroupi, M., Kontomanolis, E. N. & Koukourakis, M. I. Regulatory tumor-infiltrating lymphocytes prevail in endometrial tumors with low vascular survival ability. Immunobiology226 (3), 152078 (2021). [DOI] [PubMed] [Google Scholar]
Associated Data
This section collects any data citations, data availability statements, or supplementary materials included in this article.
Data Availability Statement
All data generated or analyzed during this study are included in this published article, and datasets generated and analyzed are available from the corresponding author upon reasonable request.


