Abstract
Innovation is currently driving enhanced performance and productivity across various fields through process automation. However, identifying intricate details in images can often pose challenges due to morphological variations or specific conditions. Here, artificial intelligence (AI) plays a crucial role by simplifying the segmentation of images. This is achieved by training algorithms to detect specific pixels, thereby recognizing details within images. In this study, an algorithm incorporating modules based on Efficient Sub-Pixel Convolutional Neural Network for image super-resolution, U-Net based Neural baseline for image segmentation, and image binarization for masking was developed. The combination of these modules aimed to identify capillary structures at pixel level. The method was applied on different datasets containing images of eye fundus, citrus leaves, printed circuit boards to test how well it could segment the capillary structures. Notably, the trained model exhibited versatility in recognizing capillary structures across various image types. When tested with the Set 5 and Set 14 datasets, a PSNR of 37.92 and SSIM of 0.9219 was achieved, surpassing significantly other image superresolution methods. The enhancement module processes the image using three different varaiables in the same way, which imposes a complexity of O(n) and takes 308,734 ms to execute; the segmentation module evaluates each pixel against its neighbors to correctly segment regions of interes, generating an
Keywords: Artificial intelligence, Image segmentation, Convolutional neural network, Pixel
Subject terms: Engineering, Mathematics and computing
Introduction
Currently, the rapid advancement of technology and AI has triggered a revolution in the way we deal with the complexity of visual information contained in images. In various fields of application, the identification and understanding of details present in images have become vitally important for analysis and informed decision making. However, detecting regions of interest in images can be a difficult challenge due to the morphological and contextual particularities that characterize each type of image. AI emerges as an essential tool to address this challenge. Pixel-of-interest detection algorithms, powered by Convolutional Neural Networks (CNN), have proven to be a promising avenue to identify these regions of relevance accurately and automatically in images. These algorithms, trained from vast datasets, possess the ability to learn intricate patterns and features that elude the human eye, enabling deep and systematic exploration of the details present in images. From the detection of medical anomalies in diagnostic images to the analysis of botanical structures in leaf images, the applicability of pixel detection algorithms using AI has spread across disciplines. The ability of these algorithms to process visual information at the most elementary pixel level, unraveling subtleties and nuances that are often imperceptible to the naked eye, opens an exciting new horizon for research and exploration of complex visual phenomena.
This paper is part of this growing line of research and presents an innovative approach to the detection of pixels of interest in images. We introduce an algorithm designed to identify and highlight specific structures in images. This algorithm consists of an image super-resolution module based on efficient subpixel CNN (ESPCNN), an image segmentation module, and a image binarization module.
In this context, this research explores the potential and capabilities of pixel-of-interest detection algorithms in relevant feature recognition. Through a systematic analysis of several types of images, we demonstrate the versatility and effectiveness of our approach in identifying details that might otherwise go unnoticed. The results obtained represent a significant step towards improving resolution and accuracy in image interpretation, which can have a profound impact on various scientific and technical applications.
Outline
This research article is structured as follows: It begins with an introduction that provides background information, outlines the research problem, and highlights the significance of the proposed work. The next section reviews related work, detailing existing literature, methods, and technologies relevant to the study while identifying gaps that the current research addresses. Following this, the materials and methods used in the study are presented, including descriptions of the datasets, tools, and methodologies employed, along with justifications for their selection. The results section summarizes the key findings supported by tables and figures, and compares them with existing benchmarks or related work. The discussion then delves into an in-depth analysis of the proposed method, interpreting the results, discussing strengths and limitations, and considering potential applications and future directions. Finally, the conclusions section encapsulates the main contributions of the research, its implications for the field, and recommendations for further investigation.
Related work
In this part, previous work on image super-resolution, image segmentation, and image masking are briefly discussed
Image super-resolution
Kollem and Panlal1 proposed improvements to some images with low contrast using morphological transformations. Image enhancement is done using two methods based on Weber’s law. The first method involves analyzing the background of the image block to obtain data, while the second method applies opening and closing operations for transformation. Which is used to define multiple background grayscale images. However, a disadvantage of the contrast enhancement transforms studied in this paper is that they can only be used satisfactorily on images with low illumination, thus limiting their applicability.
For single image super-resolution, low resolution (LR) input images are upscaled to high resolution (HR) space using a single filter before reconstruction. Shi et al.2 proposed a novel convolutional neural network (CNN) architecture where the feature maps are extracted in the LR space and introduce an efficient sub-pixel convolution layer which learns an array of upscaling filters to upscale the final LR feature maps into the HR output. This method has the capability to generate a high-resolution version of an image by utilizing its low-resolution counterpart, resulting in an improved and clearer representation with peak signal-to-noise ratio + 0.15 dB on Images and + 0.39 dB on Videos.
Shao et al.3 proposed a sub-pixel convolutional neural network (SPCNN) for image Super Resolution (SR) reconstruction. A low resolution image in YCvCr mode was chosen as input to reduce computation. Then, two convolution layers were built to obtain more features, and four non-linear mapping layers were used to achieve different level features. Furthermore, the residual network was introduced to transfer the feature information from the lower layer to the higher layer to avoid the gradient explosion or vanishing gradient phenomenon. Finally, the sub-pixel convolution layer based on up-sampling was designed to reduce the reconstruction time.
Image segmentation
Constante et al.4 present a method for optic nerve detection in digital images of eye fundus. For this, they preprocess images taken from the Messidor and STARE databases and segment the veins and blood vessels of the ocular region of interest (ROI). The processed image is used in an artificial neural network (ANN) in which the pixel deviation between the center of the ROI and the original image is defined. This network has three layers; an input layer with 10,000 neurons that belong to the vectorized and processed image, a hidden layer with 100 neurons and an output layer with 42 neurons. For the training of the ANN, which uses backpropagation, an arrangement of fifteen selected images from the databases was used. The images were scaled to a suitable size so they could fit inside the predefined ROI. To validate the results, two experiments of optic discs detection were conducted, one in known databases and another in unknown databases. The first one yielded an error of 0% and the second one error of 5% during the tracking of optic nerve.
Bukowy et al.5 implemented two serialized classifiers to locate glomeruli within kidney cuts using CNN. The CNN structure was based on Alexnet6, a deep convolutional neural network used to classify millions of high-resolution images. The training and test datasets for the algorithm comprised 74 and 13 whole renal sections, respectively, totaling over 28,000 glomeruli manually localized. It was modified to accept gray-scale images (227
Youness Mansar7 implemented a neural network that segments pictures of ocular blood vessels, trained with the DRIVE (Digital Retinal Images for Vessel Extraction)8 dataset. This dataset consists of 40 images of retinas (20 for training and 20 for testing) where presence (1) or absence (0) of the blood vessels were annotated at any pixel (i,j) of the image. He experimented with three different versions of the model: one trained from scratch with data augmentation, another trained from scratch without augmentation, and a third using a pre-trained encoder with data augmentation. The study concluded that the model trained from scratch with augmented data had the highest Area Under the Curve (AUC) score on the receiver operating characteristic (ROC) curve compared to the other variations.
Jinkai et al.9 propose a deep-convolutional-network-based Region of Interest (ROI) detection performed on the image to obtain a stable ROI based on the high-level feature extraction of the image. Their work uses fine quantization for coding units that belong to ROI, and coarse quantization for non-ROI coding units. In this way, it can be ensured that the compression rate is greatly reduced without affecting the subjective perception of the image. Experiments show that the compression rate of this method can reach about 84%, and the weighted peak signal-to-noise ratio is improved by about 0. 99dB on average compared with JPEG encoding.
Automatic image segmentation is a major step in extracting useful information for further processing. For example, vascular identification in histological tissue images consumes a lot of time and usually is biased by the operator’s experience. Adamo et al.10 proposed an automatic algorithm for the quantitative analysis of blood vessels in immunohistochemical images. This algorithm is based on extracting and analyzing features from low-level images and utilizing spatial filtering techniques. Their approach was used to segment blood vessels from an input image to extract as much information as possible, such as its structure.
Image masking with OpenCV
Ooi et al.11 proposed an interactive blood vessel segmentation from retinal fundus image based on Canny edge detection. The semi-automated segmentation of specific vessels is achieved by simply guiding the cursor over a chosen vessel. In the pre-processing phase, the green color channel is extracted, Contrast Limited Adaptive Histogram Equalization (CLAHE) is applied, and the retinal outline is removed. Next, edge detection methods, utilizing the Canny algorithm, are employed. The vessels are interactively selected through the custom graphical user interface (GUI), which allows the program to outline the vessel edges. These edges are then segmented to emphasize detailed structures or detect abnormalities in the vessel.
Devane et al.12 reviewed an approach for detecting lanes on an unmarked road, followed then by an improved approach. Both the approaches are based on digital image processing techniques and purely work on vision or camera data. The common steps in both approaches are Thresholding, Warping and Region of Interest. Then further processing includes Pixel Summation (Histogram), Gaussian Blur, Image dilation, Canny Edge Detection, and Sliding Window algorithm which are subject to speci?c methods. All these methods are implemented using OpenCV. The main aim was to obtain a real time curve value to assist the driver/autonomous vehicle for taking required turns and not go off the road.
McGarry et al.13 developed a segmentation algorithm that robustly quantifies different image types, developmental stages, organisms, and disease models at a similar accuracy level to a human observer. The tool accurately segments data taken by multiple scientists on varying microscopes, validated on confocal, lightsheet, and two photon microscopy data in a zebrafish model expressing fluorescent protein in the endothelial nuclei. They validate vascular parameters such as vessel density, network length, and diameter, across developmental stages, genetic mutations, and drug treatments, and show a favorable comparison to other freely available software tools. Vessel Metrics reduces the time to analyze experimental results, improves repeatability within and between institutions, and expands the percentage of a given vascular network analyzable in experiments.
Materials and methods
This section briefly describes the methodology of this project and the tools used to develop it. It should be noted that the present study took into account studies focused on the medical field, specifically on blood vessels segmentation. The approach was taken as a reference point since the applied methodology focused on advanced image processing techniques to accurately identify and isolate blood vessels in medical images.
Environment
These modules were programmed in Python 3.9, due to Python’s versatility and the great amount of documentation available regarding image processing. Among the libraries used, Tensorflow, PyTorch, Numpy, and Matplotlib can be highlighted. Given the versatility of Python, an efficient workflow for image processing and data preparation was implemented, while Keras is used to build and train segmentation models that can discern vessels and surrounding tissue with high accuracy. This approach proved to be effective in obtaining detailed and high-quality segmentation of several structures, which has a positive impact on the detection and identification of details of interest in each situation. For this, a 2021 ASUS TUF Gaming A15 laptop was used. This laptop is equipped with AMD Ryzen
Image super-resolution with efficient sub-pixel convolutional neural network
The task of single image super-resolution (SISR) is to estimate a high-resolution (HR) image
For a network composed of L layers, the first L-1 layers can be described as follows:
where
Their proposal also includes an effective way to implement a convolution with stride of
where
The script used in this study is based on the work of Long14, who applied the work of Shi et al.2. First, the images are rescaled to take values in the range [0, 1]. Then, the images are converted from the RGB color space to the YUV colour space. For the low-resolution images, the image is cropped, all channels are retrieved, and resized to fit. For the high-resolution images, the image is just cropped and the channels retrieved. To upscale the image, all the channels are used separately as input to the pre-trained model and then each output is combined to obtain a final RGB image. This step was iterated at most five times; beyond this point, the image starts deforming due to overprocessing. Previous works only considered the luminance (Y) channel in YCbCr colour space because humans are more sensitive to luminance changes. However, since the images are going to be digitally processed, all channels were considered.
Image segmentation
Ronneberger et al.15 propose a U-net network architecture consisting of a contracting path that follows the typical architecture of a convolutional network and an expansive path that follows its opposite. The contracting path consists of the repeated application of two 3 x 3 unpadded convolutions, each followed by a rectified linear unit (ReLU) and a 2 x 2 max pooling operation with stride 2 for downsampling.
For this, an energy function is computed by a pixel-wise soft-max over the final feature map combined with a cross entropy loss function. The soft-max is defined as
where
where
The proposed module is based on the script implemented by Mansar7, which implements the U-net. Here, the script creates a list of tuples containing paths to input images, ground truth, and mask images. For each batch of images, the pre-trained U-Net model predicts the annotation of the presence (1) or absence (0) of blood vessels at each pixel (i, j) and draws it on an image. These images are then resized and compared to the ground truth. The overall goal is to automate the process of testing a U-Net model on a set of images, resizing and saving predictions.
Image masking
This part of the script is designed to analyze the segmented images and determine the health of the optic structure. The script processes images in a specified directory by applying grayscale conversion, distance transformation, morphological operations, and contour detection. It identifies key features like the optic nerve and veins, then classifies the eye’s condition as healthy, diseased, or indeterminate based on specific criteria. The script supports both automated and manual identification of the optic nerve, depending on whether the flag for papilla identification is set. Results, including coordinates and classifications, are saved in a CSV file. The script also normalizes pixel values, applies masks to focus on specific regions, and handles the analysis of multiple images by looping through the contents of the input directory.
Datasets
For this work, different datasets were chosen to test our approach.
Set5
The Set5 dataset is a dataset consisting of 5 images (“baby”, “bird”, “butterfly”, “head”, “woman”) commonly used for testing performance of Image Super-Resolution models. Introduced by Marco Bevilacqua et al.16 in Low-Complexity Single-Image Super-Resolution based on Nonnegative Neighbor Embedding.
Set14
The Set14 dataset is a dataset consisting of 14 images commonly used for testing performance of Image Super-Resolution models. Introduced by Roman Zeyde et al.17 in On Single Image Scale-Up Using Sparse-Representations.
STARE
Hoover et al.18 describe an automated method to locate and outline blood vessels in images of the ocular fundus. Such a tool proved useful to eye care specialists for purposes of patient screening, treatment evaluation, and clinical study. Their method differs from previously known methods in that it uses local and global vessel features cooperatively to segment the vessel network. They evaluate their method using hand-labeled ground truth segmentation of 20 images. A plot of the operating characteristic shows that their method reduces false positives by as much as 15 times over basic thresholding of a matched filter response (MFR), at up to a 75% true positive rate. For a baseline, they also compared the ground truth against a second hand-labeling, yielding a 90% true positive and a 4% false positive detection rate, on average. They made all their images and hand labeling publicly available for interested researchers to use in evaluating related methods. For this study, 16 images of eye fundus were selected.
Citrus leaves
The Citrus Leaves Dataset19 is an online resource publicly available on Kaggle. This dataset includes images of citrus leaves, which can be used for various research purposes such as disease detection, classification tasks, and other applications in the field of agriculture and machine learning. This dataset contains 5 states of the leaves: healthy, Black Spot, Canker, Greening, and Melanose. For this study, 16 images of healthy leaves were selected.
PCB
The Open Lab on Human Robot Interaction of Peking University has released the printed circuit board (PCB) defect dataset20. 6 types of defects are made by Photoshop, a graphics editor published by Adobe Systems. The defects defined in the dataset are: missing hole, mouse bite, open circuit, short, spur, and spurious copper. This is a public synthetic PCB dataset containing 1386 images with 6 kinds of defects (missing hole, mouse bite, open circuit, short, spur, spurious copper) for the use of detection, classification and registration tasks. For this study, 16 images of PCB were selected.
Selected images
The images chosen for this are:
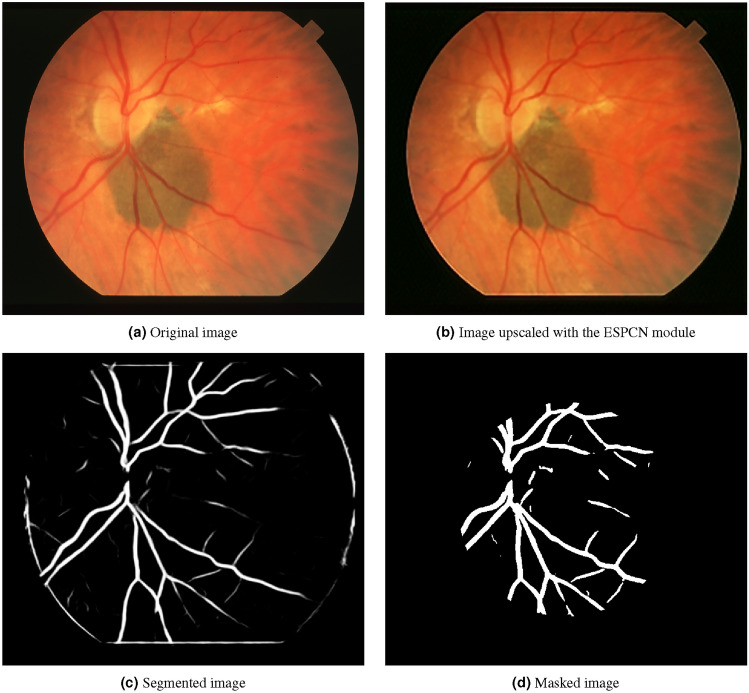
Figure 4 comes from the STARE dataset. It is an image of an eye fundus, where several structures such as optic nerve and blood vessels. It has a resolution of 700 x 605 pixels.
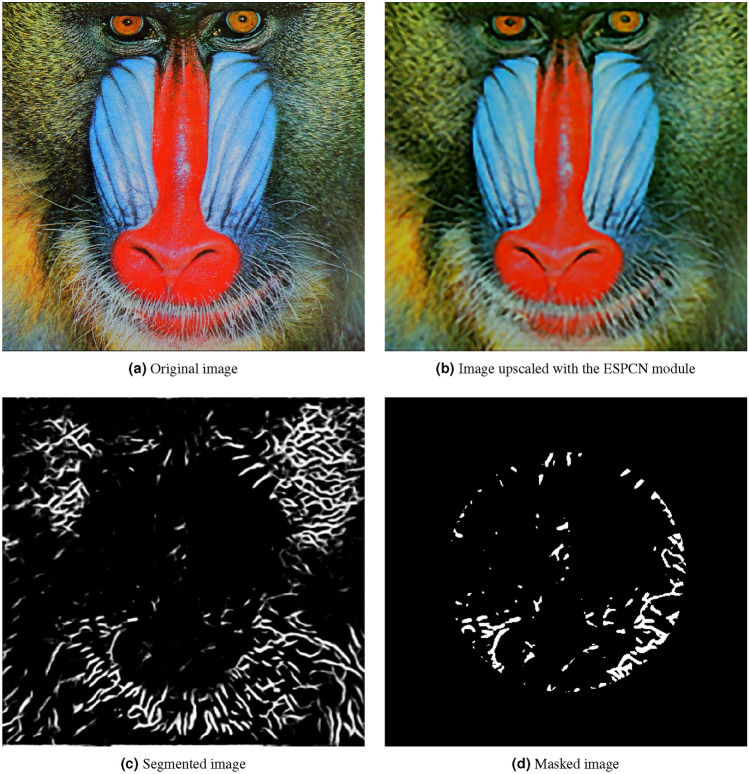
Figure 5 from the Set 14 dataset. It is an image of a baboon. It has a resolution of 498 x 480 pixels.
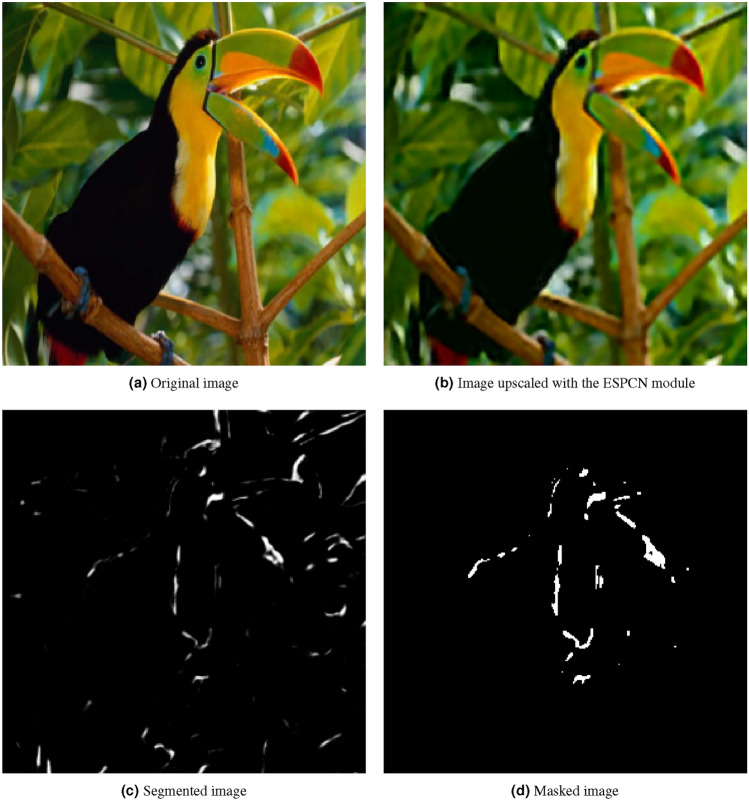
Figure 6 shows an image from the Set 5 dataset. It is an image of a bird. It has a resolution of 510 x 510 pixels.
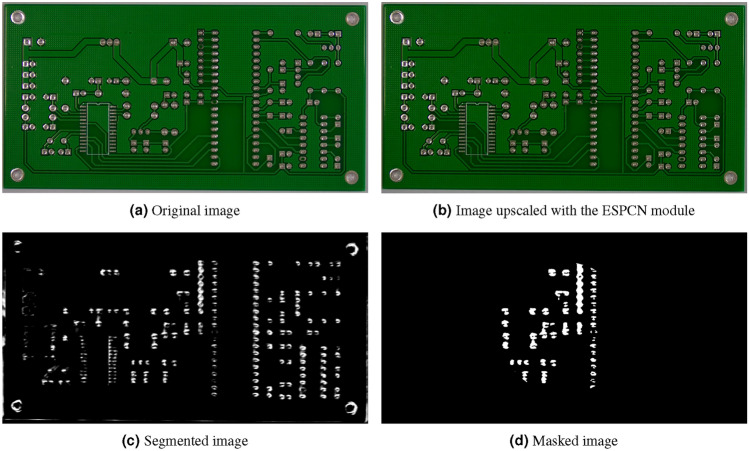
Figure 7 from the PCB dataset. It is an image of a printed circuit board. It has a resolution of 3033 x 1584 pixels.
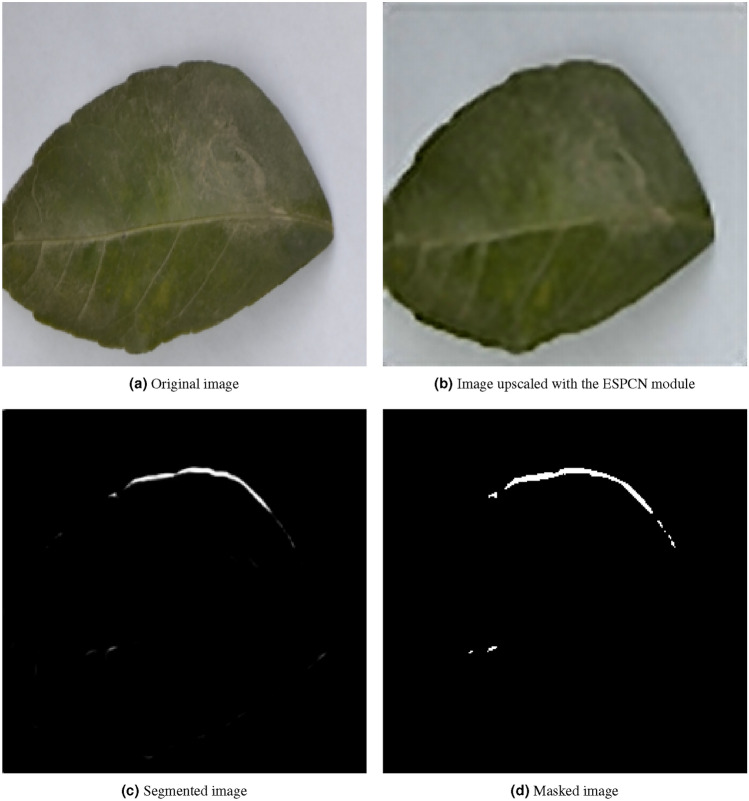
Figure 8 from the citrus leaves dataset. It is an image of a citrus leaf. It has a resolution of 256 x 256 pixels.
Fig. 4.
Sample image from the STARE dataset processed with the method.
Fig. 5.
Sample image from the Set 14 dataset processed with the method.
Fig. 6.
Sample image from the Set 5 dataset processed with the method.
Fig. 7.
Sample image from the PCB dataset processed with the method.
Fig. 8.
Sample image from the STARE dataset processed with the method.
Workflow
For this work, it was clear from the start the importance of implementing a method to obtain the required information without processing unnecessary or redundant data. That is why the input images were processed through several modules where blood vessels were progressively highlighted while background noise was eliminated. Figure 1 shows a flowchart detailing the image improvement process. First, images contained in a directory were listed and iterated over to verify whether the current file has a valid image format for processing. Then, the resolution of images with a valid format was checked. If the resolution was high, the image was resized to a low resolution accordingly; otherwise, the image was left as is. Then, the image was converted to the YCbCr format in order to extract all of its channels. Once extracted and its dimensions expanded, it was put through the prediction model. After this, all the channels are redimensioned accordingly, merged, and the resulting image converted to RGB format. This step was iterated at most five times; beyond this point, the image starts deforming due to overprocessing. In the end, this step was repeated until the last file of the list was assessed, augmented, or passed. This first part of the process was based on the work by Shi et al.2. Next, in Fig. 2, the recently augmented image was put through the blood vessel segmentation method, based on the implementation by Mansar7. Here, the input image is paired with a manual vessel segmentation and a circular mask to predict where the possible blood vessels might be. When put through the previously trained model, a grayscale image highlighting vessel-shaped structures was generated and saved. In Fig. 3 the script processes the input image. First, The image is normalized to binary, so a circular mask can be applied to focus on the region of interest. Then, the script detects the optic nerve or, if not detected, attempts to reconstruct it manually. The script analyzes the zones in the image to determine if the optic nerve is healthy. Finally, the results are saved to a CSV file. Temporary files and directories are removed at the end of the process.
Fig. 1.
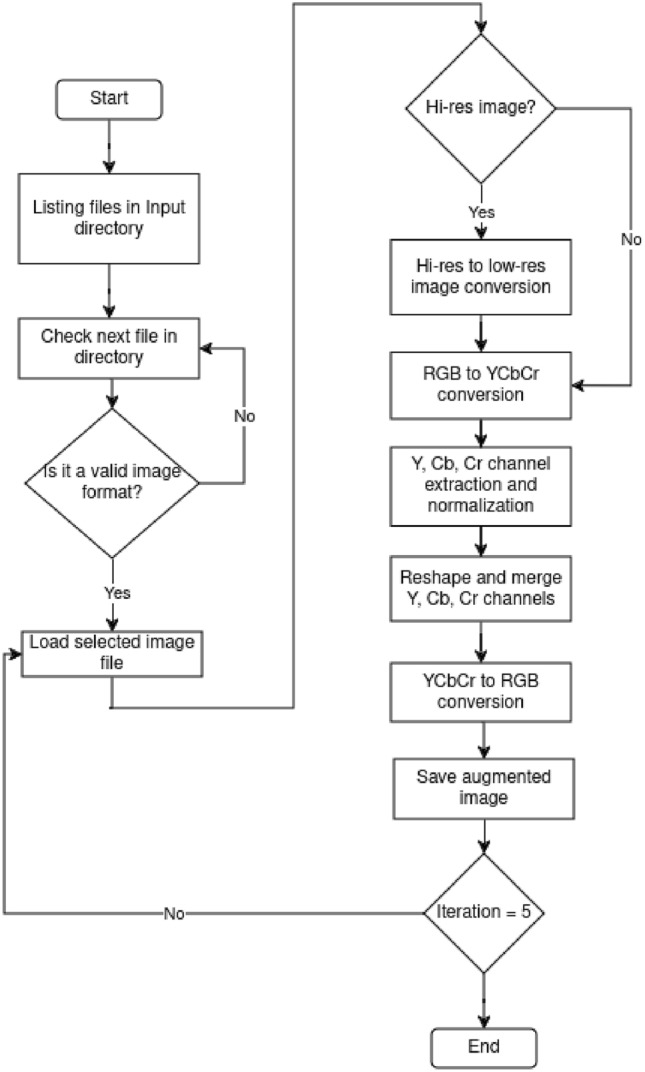
Flowchart of the image super-resolution section.
Fig. 2.
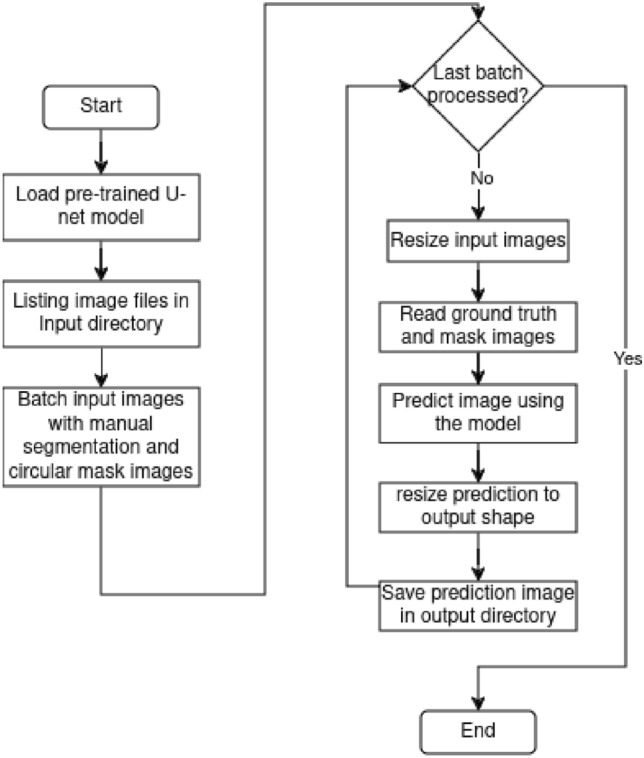
Flowchart of the vessel segmentation section.
Fig. 3.
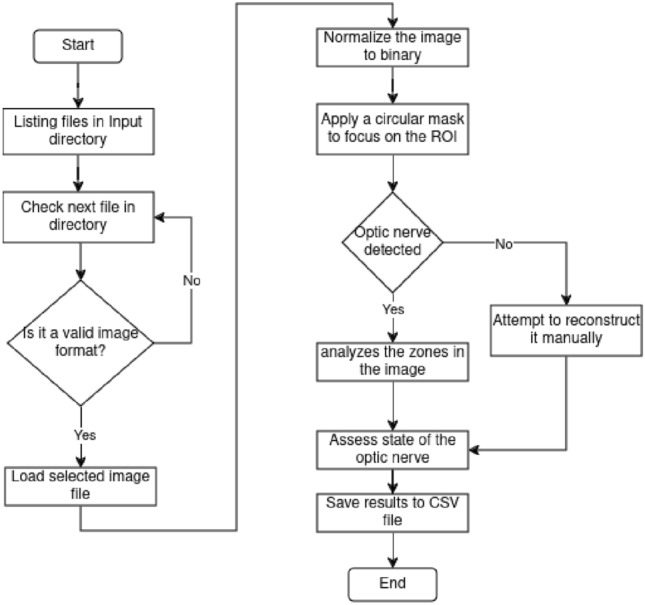
Flowchart of the image masking section.
Evaluation metrics
Sara et al.21 compared different image quality metrics such as Mean Square Error (MSE), Peak Signal to Noise Ratio (PSNR), Structured Similarity Indexing Method (SSIM), and Feature Similarity Indexing Method (FSIM) to give a comprehensive view of authentic image quality evaluation. For this study, we will use PSNR and SSIM to evaluate the images after being put through the ESPCNN module. These metrics are briefly explained as follows:
PSNR is used to calculate the ratio between the maximum possible signal power and the power of the distorting noise which affects the quality of its representation, computed in decibel form. The PSNR is usually calculated as the logarithm term of decibel scale because of the signals having a very wide dynamic range. This dynamic range varies between the largest and the smallest possible values which are changeable by their quality.
Here, peakval (Peak Value) is the maximum value a pixel can take (255 for 8-bit images)22 and the MSE is the average of the squared differences between the brightness of corresponding pixels X and Y, indexed by i,j, in the original frame and the test frame, respectively23.
Structural Similarity Index Method is a perception based model. In this method, image degradation is considered as the change of perception in structural information. SSIM estimates the perceived quality of images and videos. It measures the similarity between two images: the original and the recovered.
Here, l is the luminance used to compare the brightness between two images, c is the contrast used to differ the ranges between the brightest and darkest region of two images and s is the structure used to compare the local luminance pattern between two images to find the similarity and dissimilarity of the images and
Again luminance, contrast and structure of an image can be expressed separately as:
where
As for the other modules, selected images from the datasets will be shown alongside each other to illustrate the process.
Results
Here, we can see the results of detecting the structures of interest in assorted images, taken from the selected datasets, using the different modules. The results obtained in this process are described as follows: each figure shows a selected image from each dataset alongside the resulting image from each module of the proposal.
The segmentation gave way to the identification and highlighting of regions of interest, which promises application in the analysis of specific features of structures within the image. Let us remember that masking is a technique that limits certain image features to highlight specific regions, which in this case was used to further highlight structures. Some of the images were chosen to detect structures resembling capillaries, others to to ensure robustness and generalizability. In the following images we can appreciate the capillary segmentation result, which shows a well-constructed structure with little separation and slight background noise.
Image resolution upscaling with the ESPCN module
Analyzing the findings shown in Figs. 4b, 5b, 6b, 7b, 8b, leveraging “sub-pixel convolution” layers using all the channels yields a significantly improved feature observation of structures of interest, when compared to the original image. Structures that were hard to distinguish due to image noise and similarity to nearby structures, became more detailed and defined. Also, the resolution of said structures was notably increased, which led to a more precise identification of certain details. Using the technique proved to be efficient for improved structure identification in assorted images. This improvement can be seen in the image quality, which can impact overall performance and research with a more precise assessment of structures through an image. However, it is important to consider the challenges in segmentation and quantitative analysis of processed images.
Image segmentation of the structure of interest
As seen on Figs. 4c, 5c, 6c, 7c, 8c, the closer the pixels were to the structure of interest, the higher the illumination levels were. This progressive illumination pattern along the periphery of the “vessel” allowed for a sharper visualization of the contours in the processed images. However, it is important to mention that the presence of false positives at the edges of the structures could initially be mistaken for additional segments of interest.
This finding highlights the need for a careful approach in interpreting images processed with this technique. Now, while it is true that leveraging “sub-pixel convolution” layers using all the channels improved the overall visualization of the structures and provided higher resolution in the images, the presence of false positives at the edges must be considered when performing a more detailed analysis. Therefore, it is essential to develop strategies to distinguish between true structural features and false amplified signals in the peripheral regions of the structures. The identification of false positives at the edges of images is essential to avoid misinterpretation; likewise, the development of such algorithms as this proposal is important because they help reduce the presence of these false positives, as well as in the integration of the technique into existing workflows to maximize its benefits without compromising accuracy.
Masking the image
As seen on Figs. 4d, 5d, 6d, 7d, 8d, we proceeded to analyze the processed images with their respective masks applied. This method consisted of a series of steps that allowed masking the image, highlighting specific regions and applying morphological transformations to achieve improved visualization of the structures of interest. First, the image masking technique was applied to limit certain characteristics and highlight specific layers of the image, which in turn allows a selective focus on the regions of interest without affecting other areas of the image. Secondly, image binarization was performed by assigning values of zero and one to the pixels depending on whether their value exceeded a predetermined threshold of grayscale value of 100. Lastly, morphological transformations such as erosion and dilation were performed as part of the process; in this way, erosion implied the gradual reduction of the regions of interest, which helped to separate adjacent structures from nearby noise. Dilation, on the other hand, was based on the expansion of neighboring pixels in regions of interest to connect or fill gaps in detected structures. These morphological transformations were used to improve the reconstruction and connectivity of the blood vessels in this case.
Results evaluation
Here we compare our results to several other of previous studies. It is good to remember that this is for the super-resolution module only. We considered the 3x enhancement as this was the scale we used in our training. The following studies were selected for comparison, which results are shown alongside ours in Table 1 for the Set5 dataset and Table 2 for the Set14 dataset:
Bicubic Bicubic interpolation
ScSR Yang et al.25 present a new approach to single-image superresolution, based on sparse signal representation. They seek a sparse representation for each patch of the low-resolution input, and then use the coefficients of this representation to generate the high-resolution output.
Kim Kim and Kwom26 proposes a framework for single-image super-resolution to learn a map from input low-resolution images to target high-resolution images based on example pairs of input and output images using Kernel ridge regression (KRR).
Glasner Glasner et al.27 propose a unified framework for combining classical multi-image super-resolution (combining images obtained at subpixel misalignments), and (ii) Example-Based super-resolution (learning correspondence between low and high resolution image patches from a database).
SRCNN Dong et al.28 propose a deep learning method for single image super-resolution (SR) that directly learns an end-to-end mapping between the low/high-resolution images.
Huang Huang et al.29 develop a self-similarity based super-resolution (SR) algorithm that expands the internal patch search space by allowing geometric variations. They do so by explicitly localizing planes in the scene and using the detected perspective geometry to guide the patch search process.
Table 1.
Results on Set 5.
| Scale | Bicubic | ScSR | Kim | Glasner | SRCNN | Huang | Ours |
|---|---|---|---|---|---|---|---|
| 3x-PSNR | 30.39 | 31.34 | 32.30 | 31.10 | 32.37 | 32.62 | 37.92 |
| 3x-SSIM | 0.8678 | 0.8869 | 0.9041 | 0.8811 | 0.9025 | 0.9094 | 0.9219 |
Table 2.
Results on Set 14.
| Scale | Bicubic | ScSR | Kim | Glasner | SRCNN | Huang | Ours |
|---|---|---|---|---|---|---|---|
| 3x-PSNR | 27.53 | 28.19 | 28.96 | 28.21 | 28.90 | 29.16 | 37.46 |
| 3x-SSIM | 0.7737 | 0.7977 | 0.8140 | 0.7926 | 0.8124 | 0.8197 | 0.9525 |
Discussion
The first module focuses on image enhancement using scaling and prediction techniques based on convolutional neural networks. A linear complexity was determined for the module by depending entirely on the size of the image and then separating it into 3 different variables that are always processed in the same way. When working with full resolution images, its only variable is the image itself, which imposes a complexity of O(n). The module takes 308,734 ms to execute. The second module focuses on image segmentation using a trained neural network to identify structures. In this process, the neural network applies predictions on the image and compares the results with a reference mask, which involves traversing the image pixels and the prediction multiple times. This double loop generates an
Improving image quality at pixel level is a fundamental pillar in detecting details in images of interest, exerting a decisive influence on the identification of the structures or edges of an image. In this context, the precision and accuracy of the visual data acquire a significant relevance, since it is these data that constitute the foundation on which a correct interpretation of the case under study is built. The incessant search for greater clarity and detail finds in pixel-level optimization a valuable ally in the detection processes, even in the minor improvements that take on an unequaled transcendence by providing a clarity that transcends the previously established limits. In this way, an image that unfolds with outstanding sharpness has the power to reveal subtle anomalies or minute transformations that might otherwise go unnoticed. For this reason, the minutia of a high-quality image allows the capture of transcendental details that could exert a decisive influence on the process of detecting and identifying those details of interest in the image.
At pixel level, even minute enhancements can significantly boost the overall clarity of the image. For diagnostic procedures, a clearer image can reveal subtle abnormalities or changes that could otherwise be overlooked. Plus, a high-quality image captures delicate details which can be pivotal for diagnosis. With this, noise and artifacts can be minimized to reduce misleading distortions, causing professionals to misinterpret the data. Especially in a medical context, if an image is of inferior quality, it might necessitate a re-scan or a repeated test. This not only adds to the costs and time but also can be an additional burden or risk to the patient, particularly if they are exposed to radiation or other invasive procedures. By refining image quality, ambiguities are reduced, leading to more confident and accurate diagnoses.
In this sense, the contribution to image quality improvement goes beyond any context since a poor-quality image may require a repeat scan or retesting. This contingency implies an increase in associated costs and generates an additional burden on processes. In addition, the convergence between image quality improvement and technological advancement is a valuable combination, considering that artificial intelligence and machine learning are currently being enthusiastically adopted as strategic allies in predictive analytics and supporting detection of details of interest. However, these sophisticated algorithms crave top quality data to unfold their full potential and it is precisely there where the elevation of image quality at the pixel level emerges, in this sense, as a condition for these technological tools to discover patterns and deliver results of unparalleled accuracy.
Conclusion
The study presents a multi-module model to detect capillary-shaped structures. Firstly, the adjustment of image super-resolution can better enhance details in images that might present a low resolution to start with. Next, the neural baseline is used to segment relevant information related to target structures. Finally, the image masking cleans the image and leaves only the intended pixels. The experimental results show that the PSNR of the super-resolution module is on average 37.69 dB. In addition, the average SSIM of said module is 0.9372. Compared to the relevant research on each module separately, this paper may have a specific gap in terms of the final performance index as a whole. However, it is important to highlight that this paper focuses on the segmentation and masking of blood-vessel-like structures in super-resolution, which is a valuable contribution. It is clear that we focused on a specific anatomical structure, which may limit our proposal’s applicability. Also, it should be remembered that the modularity of our approach allows us to train the models with other structures, thus increasing the scope for analyzing other structures other than blood vessels. This can be reflected in the additional tests we performed. Currently, there are still some challenges to address. Due to the scarcity of similar studies integrating this kind of methods, the part of the test set is relatively small. While this may not be sufficient to validate the model’s generalization performance, it has demonstrated the feasibility of segmenting capillary-like structures in super-resolution images. By continuously working on this kind of integration, it will be possible to design a more specialized method. Reviewing the rapid development of computer vision in recent years, the availability of datasets plays an important role. For general purposes, we limited the method to be applied to a single image at a time. The next logical step for the application is to apply it on video files.
Acknowledgements
The authors acknowledge the Universidad Simón Bolívar through the Center for Research, Technological Development and Innovation in Artificial Intelligence and Robotics AudacIA for allowing the development of this research, which arose from a project focused on the segmentation of images for the identification of features imperceptible to the naked eye.
Author contributions
R.V., N.G. and L.P. conceptualized the project; S.C.S., S.A. and S.C. curated the data; R.V., J.P. and R.P. investigated the topic; R.V., S.C.S., S.C. and J.P. came up with the methodology; P.A administrated the project; S.C. and R.P. worked on the software; C.A. and P.A. supervised the project; N.G and L.P. validated the project; S.C.S., Y.V.S and S.C. wrote the original draft; R.V. Y.V.S and S.C. wrote and edited; All authors reviewed the manuscript.
Data availability
Image data was extracted from the DRIVE (Digital Retinal Images for Vessel Extraction) dataset available at https://drive.grand-challenge.org and implemented based on Mansar7. Vessel segmentation with python and keras available at https://github.com/CVxTz/medical_image_segmentation#problem-setting-. Test images data were extracted from the Set5 and Set14 datasets available via download at https://github.com/jbhuang0604/SelfExSR?tab=readme-ov-file, from the citrus leaves dataset available at https://www.kaggle.com/datasets/sourabh2001/citrus-leaves-dataset, from the PCB dataset available at https://www.kaggle.com/datasets/akhatova/pcb-defects, from the STARE dataset available at https://cecas.clemson.edu/~ahoover/stare/
Declarations
Competing interests
The authors declare no competing interests.
Footnotes
Publisher’s note
Springer Nature remains neutral with regard to jurisdictional claims in published maps and institutional affiliations.
These authors contributed equally: Reynaldo Villarreal, Sindy Chamorro-Solano, Steffen Cantillo, Roberto Pestana-Nobles, Sair Arquez, Yolanda Vega-Sampayo, Leonardo Pacheco-Londoño, Jheifer Paez, Nataly Galan-Freyle, Cristian Ayala and Paola Amar.
References
- 1.Kollem, S. R. & Panlal, B. Enhancement of images using morphological transformations. Int. J. Comput. Sci. Inf. Technol.4, 10.5121/ijcsit.2012.4103 (2012).
- 2.Shi, W. et al. Real-time single image and video super-resolution using an efficient sub-pixel convolutional neural network (2016). arXiv:1609.05158.
- 3.Shao, G. et al. Sub-pixel convolutional neural network for image super-resolution reconstruction. Electronics12, 3572. 10.3390/electronics12173572 (2023). [Google Scholar]
- 4.Constante, P., Gordon, A., Chang, O., Pruna, E. & Escobar, I. Neural networks for optic nerve detection in digital optic fundus images. In 2016 IEEE International Conference on Automatica (ICA-ACCA), 1–5, 10.1109/ICA-ACCA.2016.7778415 (2016).
- 5.Bukowy, J. D. et al. Region-based convolutional neural nets for localization of glomeruli in trichrome-stained whole kidney sections. J. Am. Soc. Nephrol.29, 2081–2088 (2018). [DOI] [PMC free article] [PubMed] [Google Scholar]
- 6.Krizhevsky, A., Sutskever, I. & Hinton, G. E. Imagenet classification with deep convolutional neural networks. In Proceedings of the 25th International Conference on Neural Information Processing Systems-Volume 1, NIPS’12, 1097–1105 (Curran Associates Inc., Red Hook, NY, USA, 2012).
- 7.Mansar, Y. Vessel segmentation with python and keras (2019).
- 8.Drive: Digital retinal images for vessel extraction (n.d.).
- 9.Jinkai, Y., Guozhong, W. & Liangqi, Z. Region of interest coding based on convolutional neural network. J. Phys. Conf. Ser.1907, 012028. 10.1088/1742-6596/1907/1/012028 (2021). [Google Scholar]
- 10.Adamo, A. et al. Blood vessel detection algorithm for tissue engineering and quantitative histology. Ann. Biomed. Eng.50, 387–400 (2022). [DOI] [PMC free article] [PubMed] [Google Scholar]
- 11.Ooi, A. Z. H. et al. Interactive blood vessel segmentation from retinal fundus image based on canny edge detector. Sensors21, 6380. 10.3390/s21196380 (2021). [DOI] [PMC free article] [PubMed] [Google Scholar]
- 12.Devane, V., Sahane, G., Khairmode, H. & Datkhile, G. Lane detection techniques using image processing. ITM Web of Conferences, vol. 40, 03011. 10.1051/itmconf/20214003011 (2021).
- 13.McGarry, S. D. et al. Vessel metrics: A software tool for automated analysis of vascular structure in confocal imaging. Microvasc. Res.151, 104610. 10.1016/j.mvr.2023.104610 (2024). [DOI] [PubMed] [Google Scholar]
- 14.Long, X. Deep learning tutorial for kaggle ultrasound nerve segmentation competition, using keras. https://github.com/keras-team/keras-io/blob/master/examples/vision/super_resolution_sub_pixel.py (2020).
- 15.Ronneberger, O., Fischer, P. & Brox, T. U-net: Convolutional networks for biomedical image segmentation. In Medical Image Computing and Computer-Assisted Intervention (MICCAI), vol. 9351 of LNCS, 234–241 (Springer, 2015). (available on arXiv:1505.04597 [cs.CV]).
- 16.Bevilacqua, M., Roumy, A., Guillemot, C. M. & Alberi-Morel, M.-L. Low-complexity single-image super-resolution based on nonnegative neighbor embedding. In British Machine Vision Conference (2012).
- 17.Zeyde, R., Elad, M. & Protter, M. On single image scale-up using sparse-representations. In Curves and Surfaces (eds Boissonnat, J.-D. et al.) 711–730 (Springer, 2012). [Google Scholar]
- 18.Hoover, A., Kouznetsova, V. & Goldbaum, M. Locating blood vessels in retinal images by piecewise threshold probing of a matched filter response. IEEE Trans. Med. Imaging19, 203–10. 10.1109/42.845178 (2000). [DOI] [PubMed] [Google Scholar]
- 19.Citrus leaves dataset (n.d.).
- 20.Huang, W. & Wei, P. A PCB dataset for defects detection and classification (2019). arXiv:1901.08204.
- 21.Sara, U., Akter, M. & Uddin, M. Image quality assessment through FSIM, SSIM, MSE and PSNR-a comparative study. J. Comput. Commun.7, 8–18. 10.4236/jcc.2019.73002 (2019). [Google Scholar]
- 22.Deshpande, R. G., Ragha, L. L. & Sharma, S. K. Video quality assessment through PSNR estimation for different compression standards. Indones. J. Electr. Eng. Comput. Sci.11, 918 (2018). [Google Scholar]
- 23.Søgaard, J. et al. Applicability of existing objective metrics of perceptual quality for adaptive video streaming. Electron. Imaging28, 1–7. 10.2352/ISSN.2470-1173.2016.13.IQSP-206 (2016). [Google Scholar]
- 24.Kumar, R. & Moyal, V. Visual image quality assessment technique using FSIM. Int. J. Comput. Appl. Technol. Res.2, 250–254. 10.7753/IJCATR0203.1008 (2013). [Google Scholar]
- 25.Yang, W., Liu, J., Yang, S. & Quo, Z. Image super-resolution via nonlocal similarity and group structured sparse representation. In 2015 Visual Communications and Image Processing (VCIP) (IEEE, 2015).
- 26.Kim, K. I. & Kwon, Y. Single-image super-resolution using sparse regression and natural image prior. IEEE Trans. Pattern Anal. Mach. Intell.32, 1127–1133 (2010). [DOI] [PubMed] [Google Scholar]
- 27.Glasner, D., Bagon, S. & Irani, M. Super-resolution from a single image. In 2009 IEEE 12th International Conference on Computer Vision (IEEE, 2009).
- 28.Dong, C., Loy, C. C., He, K. & Tang, X. Learning a deep convolutional network for image super-resolution. In Computer Vision–ECCV 2014, Lecture Notes in Computer Science, 184–199 (Springer International Publishing, Cham, 2014).
- 29.Huang, J.-B., Singh, A. & Ahuja, N. Single image super-resolution from transformed self-exemplars. In Proceedings of the IEEE Conference on Computer Vision and Pattern Recognition, 5197–5206 (2015).
Associated Data
This section collects any data citations, data availability statements, or supplementary materials included in this article.
Data Availability Statement
Image data was extracted from the DRIVE (Digital Retinal Images for Vessel Extraction) dataset available at https://drive.grand-challenge.org and implemented based on Mansar7. Vessel segmentation with python and keras available at https://github.com/CVxTz/medical_image_segmentation#problem-setting-. Test images data were extracted from the Set5 and Set14 datasets available via download at https://github.com/jbhuang0604/SelfExSR?tab=readme-ov-file, from the citrus leaves dataset available at https://www.kaggle.com/datasets/sourabh2001/citrus-leaves-dataset, from the PCB dataset available at https://www.kaggle.com/datasets/akhatova/pcb-defects, from the STARE dataset available at https://cecas.clemson.edu/~ahoover/stare/


