

Abstract
Efgartigimod is a human IgG1 antibody Fc-fragment that lowers IgG levels through blockade of the neonatal Fc receptor (FcRn) and is being evaluated for the treatment of patients with severe autoimmune diseases mediated by pathogenic IgG autoantibodies. Engineered for increased FcRn affinity at both acidic and physiological pH, efgartigimod can outcompete endogenous IgG binding, preventing FcRn-mediated recycling of IgGs and resulting in increased lysosomal degradation. A population pharmacokinetic-pharmacodynamic (PKPD) model including FcRn binding was developed based on data from two healthy volunteer studies after single and repeated administration of efgartigimod. This model was able to simultaneously describe the serum efgartigimod and total IgG profiles across dose groups, using drug-induced FcRn receptor occupancy as driver of total IgG suppression. The model was expanded to describe the PKPD of efgartigimod in cynomolgus monkeys, rabbits, rats and mice. Most species differences were explainable by including the species-specific in vitro affinity for FcRn binding at pH 7.4 and by allometric scaling of the physiological parameters. In vitro-in vivo scaling proved crucial for translation success: the drug effect was over/underpredicted in rabbits/mice when ignoring the lower/higher binding affinity of efgartigimod for these species versus human, respectively. Given the successful model prediction of the PK and total IgG dynamics across species, it was concluded that the PKPD of efgartigimod can be characterized by target binding. From the model, it is suggested that the initial fast decrease of measurable unbound efgartigimod following dosing is the result of combined clearance of free drug and high affinity target binding, while the relatively slow terminal PK phase reflects release of bound drug from the receptor. High affinity target binding protects the drug from elimination and results in a sustained PD effect characterized by an increase in the IgG degradation rate constant with increasing target receptor occupancy.
Supplementary Information
The online version contains supplementary material available at 10.1007/s10928-024-09952-5.
Keywords: Efgartigimod, Population PKPD modelling, Interspecies translation, FcRn
Introduction
Efgartigimod (ARGX-113) is a 54 kDa human IgG1 antibody Fc fragment, a natural ligand of the neonatal Fc receptor (FcRn). Efgartigimod degrades circulating disease-causing pathogenic antibodies by blocking FcRn, a major histocompatibility complex class I molecule that binds to, transports, and recycles IgG and albumin [1–4]. By introducing ABDEG mutations, affinity for FcRn is significantly increased at both neutral and acidic pH [5, 6]. Efgartigimod has been approved in various regions for the treatment of patients with generalized myasthenia gravis (gMG) [7–11], and is also being investigated in various other IgG autoantibody-mediated diseases [10].
FcRn is widely expressed throughout the body, including but not limited to the liver, spleen, lungs, kidney and intestines [12]. IgG and albumin enter cells through aspecific pinocytosis where the pH gradually decreases from pH 7.4 to pH 6 within the endosomes [13]. At this acidic pH, these proteins bind to FcRn [14] while FcRn binding at pH 7.4 is negligible. Through endosomal FcRn binding, IgGs and albumin are protected from lysosomal catabolism, resulting in a lower clearance compared with non-FcRn binding proteins of similar size. This process is referred to as FcRn recycling [15]. In addition, FcRn binding facilitates IgG and albumin distribution, through FcRn mediated transcytosis. For example, maternal IgG is delivered to the neonatal through FcRn mediated transplacental transport [16]. As FcRn recycling is not fully efficient, IgGs are eventually catabolized in cells throughout the body via the lysosomal or ubiquitin protein degradation pathways [17]. Since their size of 150 kDa exceeds the sieving capacity of the glomerulus, renal filtration is negligible for these molecules. For proteins smaller than approximately 70 kDa, such as efgartigimod, renal filtration and subsequent clearance may contribute significantly to the total clearance, depending on the hydrodynamic radius, size and shape of the molecule [18, 19]. For example, antigen binding IgG fragments (i.e. Fab’s; ± 50 kDa) were found to filter significantly and to alter the disposition of their ligands [20]. Below 10 kDa, compounds are expected to be freely filtered [17]. Following filtration, the majority of protein is taken up into proximal tubular cells, and subsequently catabolized [20].
Population modelling is a powerful tool to summarize the pharmacokinetic (PK) and pharmacodynamics (PD) data of a compound in a quantitative fashion by integrating all available data across dose, route of administration, time and species. A population model consists of a structural component describing the typical PKPD profile, and a stochastic component whereby unexplained variability between subjects and measurement error is quantified. These models range from being descriptive, i.e. describing the data without physiological meaning, to mechanistic whereby the model consists of a series of interconnected compartments each representing a homogenous entity of the body, such as a specific organ. Many physiological parameters have been found to scale with body weight across species, referred to as allometric scaling. For example, physiological volumes increase proportionally with body weight [21]. Consequently, the volume of distribution for monoclonal antibodies (mAbs), typically estimated as approximately 2-fold the plasma volume, is predictable across species according to this relationship [22]. Physiological flows, such as the glomerular filtration rate, scale less than proportionally with body weight with a power coefficient of 0.75 [23]. For mAbs, this coefficient is estimated to range between 0.8 and 0.9, in the absence of target-mediated clearance [24]. Using these relationships, the PK parameters of therapeutic proteins can often be well-predicted across species.
When target binding influences the disposition of the compound, this should be accounted for to recognize the true PKPD relationship, which can be achieved by implementing the full target mediated disposition model (TMDD) [25, 26]. Often, approximations to this model are necessary due to data limitations [27], such as the quasi-equilibrium model whereby rapid binding of drug to its target is assumed [28]. Mechanistic PK models have been developed to predict the PK of mAbs [29], as a function of in vitro FcRn binding affinity [30], and for the anti-FcRn mAb rozanolixizumab [31, 32]. In addition, alternative semi-mechanistic FcRn binding PK models have been proposed, to capture key rate limiting processes with less complexity to limit assumptions that are often difficult to validate [33].
In the present analysis, a semi-mechanistic FcRn target binding population model was developed to simultaneously describe the PKPD of efgartigimod after single and repeated intravenous (iv) and subcutaneous (sc) administration in healthy volunteers, cynomolgus monkeys, rabbits, rats and mice. Here, the PK of this antibody fragment is influenced by its ability to bind FcRn at neutral pH and the favourable IgG lowering effect of the compound is driven by target receptor occupancy using a similar PKPD relationship across species.
Methods
In vitro binding affinity
The binding affinity of efgartigimod was measured using a surface plasmon resonance based assay: analyses were performed on a Biacore T200 device (GE Healthcare) where FcRn from various species was immobilized to the sensor chip after which various concentrations of efgartigimod were injected over the flow cell. The dissociation constants (KD) were calculated using a 1:1 Langmuir binding model.
In vivo studies
PK, PD (total IgG) and anti-drug antibody (ADA) data were collected from two clinical studies in healthy volunteers (ClinicalTrials.gov NCT03457649 and NCT03334084), six studies in cynomolgus monkeys, three studies in New Zealand White rabbits, four studies in Sprague Dawley rats (CD®) and one study in both Wistar rats and C57BL/6 mice. The clinical studies were conducted in compliance with GCP guidelines and were approved by local ethics committees. All animal studies were performed under approval of ethics and animal welfare committees following rules of the respective animal facilities and in accordance to relevant animal welfare laws and directives. PK information was available for all studies. PD information was not available for two monkey, one rabbit and three rat studies. ADA information was not available for three monkeys, two rabbits, and four rat studies. PKPD sampling was rich for the clinical studies, and sparse to rich depending on the study for the non-clinical studies. Data from placebo subjects or animals receiving vehicle were not considered in the analysis.
The following clinical efgartigimod studies were included:
Clinical study NCT03457649 (ClinicalTrials.gov identifier): a phase 1, randomized, double-blind, placebo-controlled, single and multiple ascending intravenous (iv) dose study to assess the safety, tolerability, pharmacokinetics, pharmacodynamics and immunogenicity of efgartigimod in healthy subjects, evaluating the following doses: single dose (sd) 0.2 (n = 4), 2 (n = 4), 10 (n = 5), 25 (n = 5) and 50 (n = 4) mg/kg and repeated dose (rd) 10 mg/kg every 4 and 7 days (q4d, n = 5; and q7d, n = 6) and 25 mg/kg q7d (n = 11).
Clinical study NCT03334084: a randomized, open-label, parallel group study to compare the pharmacokinetics, pharmacodynamics and safety and tolerability of a subcutaneous (sc) formulation with an iv formulation of efgartigimod in healthy male subjects, evaluating the following doses: sd 10 mg/kg iv (n = 16) and sc (n = 8), and iv (2 × 20 mg/kg) administered on day 1 and 4, followed by 8 weekly (q1w) 300 mg sc (n = 16).
The following non-clinical efgartigimod studies were included:
Monkey studies
An exploratory PKPD study after sd iv infusion of 0, 0.2, 2, 20 and 200 mg/kg, and 4 × 20 mg/kg q1d and 4 × 20 mg/kg q4d dosing (n = 2/arm).
A PK study after sd iv infusion (n = 6) and sc administration of 20 mg/kg (n = 3).
A sd toxicity study after iv infusion of 0, 10, 30, 50 and 100 mg/kg (n = 10/arm).
A 26-week toxicity study after q1w iv infusion of 0, 10, 30 and 100 mg/kg (n = 12/arm).
A 12-week sc study after q1w sc administration of 100 mg/kg (n = 10).
A 5-week PK and safety pharmacology study after q1w 0.5 h iv infusion of 0, 10, 30 and 100 mg/kg (n = 4/arm).
Rabbit studies
A PKPD study after sd iv infusion of 0, 2, 20, and 100 mg/kg (n = 3/arm).
A dose range finding for an embryo-fetal development study in pregnant rabbits after q1d iv infusion of 0, 10, 30, and 100 mg/kg (n = 3/arm).
A study of embryo-fetal development in pregnant rabbits after q1d iv administration of 0, 30 and 100 mg/kg (n = 3/arm).
Sprague Dawley rat studies
A 4-week subchronic toxicity study after q1d iv administration of 0, 10, 30 and 100 mg/kg with sparse PK sampling performed for a satellite group (n = 9/sex/dose).
An examination of the influence of efgartigimod on the fertility and early embryonic development to implantation following q1d iv administration of 0, 30 and 100 mg/kg (n = 9/sex/dose).
An embryo-fetal development study in pregnant rats after q1d iv administration of 0, 30, 100 mg/kg (n = 9/arm).
An examination for effects on the pre- and postnatal development after q1d iv administration of 0, 30, 100 mg/kg to pregnant rats of the F0 generation (n = 9/arm).
Wistar rat and C57BL/6 mouse study
A PKPD in Wistar rats and C57BL/6 mice after sd iv administration of 2, 20 and 100 mg/kg (n = 4/arm).
Analytical methods for in vivo studies
For the clinical data, efgartigimod and total IgG concentrations and ADA outcome were determined using validated enzyme-linked immunosorbent assays. For the non-clinical data, validated enzyme-linked immunosorbent assays were used for studies where available, or alternatively, research assays were used. The lower limit of quantification (LLOQ) for the PK assays was 0.3 and 0.6 µg/mL in clinical studies NCT03457649 and NCT03334084, respectively, and ranged between 0.0125 and 0.2 µg/mL for monkey studies, 0.1–0.16 µg/mL for rabbit studies and 0.078–0.25 µg/mL for rodent studies. The precision of the different validated PK assays was at least ≤ 17% coefficient of variation, while the accuracy was between − 25 and 20%. Data in mouse were generated using assays that were fit for purpose and less characterised.
Computation
Non-linear mixed-effects modelling was performed using NONMEM (version 7.4.3, Icon Development Solutions), in combination with PsN (version 5.0.0). GFortran version 9.3.0 was used as compiler. Graphical analysis and post-processing of NONMEM output was performed using R (version 4.0.3) and RStudio (version 1.3.1093).
Clinical model development
Model development was performed in two main steps, whereby a clinical PKPD model was developed first, followed by translational PKPD model development including data from the non-clinical studies. Clinical model development was initiated using a TMDD model including FcRn target binding at pH 7.4 to describe the PKPD data of efgartigimod simultaneously. FcRn target binding at pH 7.4 was considered only: it was assumed that the PKPD of efgartigimod could be described via FcRn target binding at pH 7.4, without specifically including target binding at pH 6.0 or endosome dynamics in the model. Model building was performed via a stepwise process whereby models were evaluated according to parameter interpretation, precision and correlation, graphical analysis and likelihood ratio testing at p < 0.01 significance (the addition of 1 or 2 parameters was considered significant for nested models, if the drop in objective function value exceeded 6.63 or 9.21, respectively, assuming that the difference in objective function value between models is Chi2 distributed).
A quasi-equilibrium binding model was implemented as detailed in Mager and Krzyzanski, 2005 [28], since initial attempts to implement a full TMDD model were unsuccessful. Initially, the KD in this model was fixed to the binding affinity for human FcRn, determined in vitro. During clinical model development, it was evaluated whether the data supported a different KD in vivo, by estimating a factor on this in vitro value. However, this factor was not allowed to change during translational model development, to keep the in vitro affinity ranking between species intact. Next to a one compartmental binding model, a two compartmental model with or without peripheral target binding, and a three compartmental model with target binding in one of the peripheral compartments, was explored. The baseline FcRn concentration (R0) was estimated and assumed equal for the compartments where target binding was included. Only unbound drug was allowed to distribute between compartments. Different sc absorption models were evaluated, including first order, zero order, sequential zero to first order and parallel zero and first order absorption. The bioavailability after sc administration (F) was estimated. Total IgG (tIgG) concentrations (i.e. the sum of the IgG1, IgG2, IgG3 and IgG4 subtypes) were modeled using a turnover model (Eq. 1). The drug effect was implemented as an increase of the IgG degradation rate constant. The pH 7.4 receptor occupancy (RO; fraction of complex over total target) was implemented as the driver of this increase (Eq. 1). It was evaluated which driver (total RO from multiple compartments or a compartment specific RO) resulted in the best fit.
 |
1 |
where kin is the total IgG synthesis rate, kout is the tIgG degradation rate constant in the absence of efgartigimod, and the Emax and γ are the estimated drug effect parameters implemented as an additive increase in tIgG degradation in function of pH 7.4 RO. The Emax determines the maximum tIgG degradation rate due to efgartigimod, while the γ parameter determines the shape between receptor occupancy and drug effect.
Inter-individual variability (IIV) was included on the model parameters using an exponential function, where supported by the data. Efgartigimod and tIgG serum concentrations were log-transformed and modelled with an additive error. Baseline body weight was included as a structural covariate with fixed allometric coefficients (Eq. 2).
 |
2 |
where the individual model parameter (Pari) is a function of the typical population value (Partypical) and the individual baseline body weight (BWi; in kg), normalized for a 78 kg subject (median of the healthy volunteers) and with an allometric scaling factor (SF) of 0.75 for clearance and flows, 1 for volumes and − 0.25 for degradation rate constants.
Translation model development
The predictive translational performance of the clinical model was assessed, using a stepwise modeling approach by introducing PKPD data from the non-clinical studies. The clinical model parameters were fixed, while the KD value was replaced with the species-specific binding affinity determined in vitro. The translational model was optimized guided by individual random effect plots, successful minimization, parameter interpretation and likelihood ratio testing based on the following principles:
PK parameters were allowed to be species-specific when a strong prediction bias was observed.
It was assessed whether the allometric coefficients could be estimated, i.e. whether these deviated significantly from the assumed allometric coefficients.
Separate sc parameters were allowed between humans and cynomolgus monkeys.
Drug effect parameters were not allowed to be species-specific.
Model evaluation
Models were evaluated graphically based on standard goodness-of-fit, individual fit, individual random effect and residual plots. The individual fit plots were panelled per treatment group, rather than per individual, to summarize the fit evaluation. Thus, each panel shows the observed data (symbols) for all individuals within a given group, and shows the individual (dashed) and population (blue) prediction lines for these individuals within a single panel. Rather than to assess the fit per individual, these plots were mainly used to assess whether the model could capture the structural behaviour observed in the data per coherent treatment group (blue line profile trends corresponding with observed profile trends). Numerical predictive checks (NPCs) were performed using Monte Carlo simulations with 1000 replicates per individual as described by Nguyen et al., 2017 [34]. NPCs were considered a good evaluation tool, to avoid the need for extensive stratifications and binning, given the relatively few subjects per coherent group. NPCs were not performed for the translational model, since the individual random effect parameters (and many of the structural parameters) were not re-estimated, but fixed to the estimates from the clinical model. Normalized prediction distribution errors (NPDEs) were obtained from the NONMEM output based on a 1000 random samples as described by Bauer 2019 [35]. PK samples below the quantification limit (BQL) were ignored in the analysis. To assess whether the structural model was adequate in predicting the concentration for these BQL samples, the clinical model was evaluated including BQL samples using the M3 method as described by Bauer 2019 [35], without parameter re-estimation and with empirical bayes estimate adjustment allowed.
Model simulation
Based on the final model, typical healthy volunteer (78 kg subject) simulations were performed following four weekly iv (one hour infusion) doses of 0.1 and 10 mg/kg. To illustrate the model behaviour, the corresponding model predicted time profiles of bound and unbound efgartigimod concentrations were evaluated.
Results
FcRn binding model for efgartigimod based on clinical PKPD data
The clinical PKPD model was developed based on 1710 serum efgartigimod and 1635 serum tIgG concentrations from a total of 84 healthy volunteers in studies NCT03457649 and NCT03334084. This included all available PKPD data from these studies, except for five PK samples that were considered outliers during initial exploratory analysis. 264 PK samples were BQL, and not included in the analysis. Based on initial PKPD modeling analysis, an impact of ADA on the clinical PKPD profiles was not apparent, and these data were included in the analysis.
Following an iterative model development process, a clinical PKPD model characterized by FcRn binding was developed with a structure as depicted in Fig. 1 and with parameter estimates and precision presented in Table 1. The NONMEM model code is presented in the Supplementary Material. Efgartigimod entered the central compartment after iv or sc administration. For the latter, a sequential zero order (described by duration D) and first order (described by rate constant ka) process was implemented with an estimated sc bioavailability (F) of 47%. Unbound drug was cleared from the central compartment with a linear clearance CL. Unbound drug distributed to a first and second peripheral compartment with intercompartmental flows Q and Q2 and volumes VP and VP2, respectively. Target binding occurred in the central and first peripheral compartments, with estimated FcRn concentration R0. Target binding was not implemented in the second peripheral compartment. This structure was the result of a data driven approach whereby the fit was worse for alternative models including a two compartmental model with or without peripheral target binding, and a three compartmental model with target binding in both peripheral compartments with different estimated FcRn concentrations. Binding was assumed at steady state with dissociation constant KD, with an estimated in vivo scaling factor: the in vivo KD was 2.1 fold larger than the fixed in vitro KD. The FcRn and complex degradation rate constants, assumed to be equal via a single shared estimate, tended to zero and could not be estimated. Consequently, these parameters were fixed to 0. Therefore, FcRn receptor turnover and efgartigimod elimination via the complex, were not included in the model. The underlying assumption following from this implementation was that interaction with efgartigimod did not alter the dynamics or the capacity of the target. Total IgG was described using a turnover model with estimated synthesis rate kin and degradation rate constant in absence of drug kout. The predicted total RO (central and peripheral compartment combined) at pH 7.4 drove the increase in the tIgG degradation, with estimated parameters Emax and γ according to Eq. 1. This structure was the result of a data driven approach whereby the fit was worse for alternative models including models where only the RO for either the central or the peripheral compartment was driving the effect. IIV was included on ka, D, F, CL (and covariance with VP/VP2), VP/VP2, VC, R0, kin and Emax. A single variance was estimated for the IIV on VP and VP2, since the data supported IIV on those parameters but the model was over-parameterized when separate variances were included.
Fig. 1.

Schematic overview of the efgartigimod translation PKPD FcRn binding model
Table 1.
Parameter table for the efgartigimod translation PKPD FcRn binding model
| Parameter (unit) [Modelc] | Estimate | Standard error | RSE (%) | 95% CIa |
|---|---|---|---|---|
| F human [C] | 0.472 | 0.0627 | 13.3 | (0.349, 0.595) |
| D human (h) [C] | 5.10 | 0.377 | 7.40 | (4.36, 5.84) |
| ka human (/h) [C] | 0.0174 | 0.00236 | 13.5 | (0.0128, 0.0221) |
| CL human (L/h) [C] | 0.143 | 0.00331 | 2.31 | (0.137, 0.150) |
| VC human (L) [C] | 3.81 | 0.0893 | 2.35 | (3.63, 3.98) |
| Q human (L/h) [C] | 0.0944 | 0.0112 | 11.9 | (0.0724, 0.116) |
| VP human (L) [C] | 4.86 | 0.317 | 6.53 | (4.24, 5.48) |
| Q2 human (L/h) [C] | 0.245 | 0.0123 | 5.03 | (0.221, 0.269) |
| VP2 human (L) [C] | 2.44 | 0.384 | 15.8 | (1.68, 3.19) |
| R0 human (nM) [C] | 53.6 | 7.25 | 13.5 | (39.4, 67.9) |
| kin IgG human (µM/h) [C] | 0.124 | 0.00540 | 4.34 | (0.114, 0.135) |
| kout IgG human (/h) [C] | 0.00194 | 0.0000394 | 2.03 | (0.00186, 0.00202) |
| Emax IgG human (/h) [C] | 0.00603 | 0.000185 | 3.07 | (0.00566, 0.00639) |
| In vivo KD (factor) [C] | 2.10 | 0.117 | 5.57 | (1.87, 2.33) |
| γ receptor occupancy [C] | 7.39 | 0.324 | 4.39 | (6.76, 8.03) |
| Human in vitro KD pH 7.4 (nM) | 8.56 | Fixed | - | - |
| Monkey in vitro KD pH 7.4 (nM) | 14.5 | Fixed | - | - |
| Rabbit in vitro KD pH 7.4 (nM) | 310 | Fixed | - | - |
| Rat in vitro KD pH 7.4 (nM) | 1.89 | Fixed | - | - |
| Mouse in vitro KD pH 7.4 (nM) | 0.64 | Fixed | - | - |
| BW scaling CL/Q/Q2 | 0.75 | Assumed allometry | - | - |
| BW scaling VC/VP/VP2 | 1 | Assumed allometry | - | - |
| BW scaling R0 | 0.25 | Assumed allometry | - | - |
| BW scaling kout/Emax IgG | -0.25 | Assumed allometry | - | - |
| kin IgG Monkey (factor) | 5.44 | Fixed to observed | - | - |
| kin IgG Rabbit (factor) | 1.48 | Fixed to observed | - | - |
| kin IgG Rat (factor) | 0.702 | Fixed to observed | - | - |
| kin IgG Mouse (factor) | 0.0365 | Fixed to observed | - | - |
| ka Monkey (factor) [T] | 1.78 | 0.210 | 11.8 | (1.37, 2.20) |
| F Monkey (factor) [T] | 1.72 | 0.182 | 10.6 | (1.36, 2.07) |
| R0 Monkey (factor) [T] | 7.85 | 1.13 | 14.4 | (5.62, 10.1) |
| CL Rabbit (factor) [T] | 0.677 | 0.0287 | 4.23 | (0.621, 0.733) |
| CL Rat and Mouse (factor) [T] | 2.11 | 0.0570 | 2.70 | (2.00, 2.22) |
| VP/VP2 Rat (factor) [T] | 0.310 | 0.0161 | 5.17 | (0.279, 0.342) |
| VP/VP2 Mouse (factor) [T] | 0.150 | 0.00653 | 4.35 | (0.137, 0.163) |
| slope for tIgG f(time) for 4w tox. rat [T] | -0.000695 | 0.0000162 | 2.33 | (-0.000727, -0.000664) |
| σ2 log(PK), additive, human [C] | 0.0326 | 0.00107 | 3.29 | (0.0305, 0.0347) |
| PK preclinical error (factor) [T] | 6.09 | 0.141 | 2.32 | (5.82, 6.37) |
| σ2 log(IgG), additive, human [C] | 0.0138 | 0.000517 | 3.75 | (0.0128, 0.0148) |
| IgG preclinical error (factor) [T] | 3.23 | 0.128 | 3.97 | (2.98, 3.48) |
| Inter individual variability | Estimate | Standard error | RSE (%) | %CV / Corr. b |
| ω2 ka [C] | 0.115 | 0.0423 | 36.7 | 35.0 |
| ω2 D [C] | 3.03 | 1.12 | 37.0 | 444 |
| ω2 F [C] | 0.0877 | 0.0308 | 35.1 | 30.3 |
| ω2 CL [C] | 0.0323 | 0.00609 | 18.8 | 18.1 |
| ω CL x ω VP/VP2 [C] | 0.0282 | 0.00780 | 27.6 | 0.66 |
| ω2 VP/VP2 [C] | 0.0542 | 0.0138 | 25.6 | 23.6 |
| ω2 VC [C] | 0.0257 | 0.00733 | 28.5 | 16.1 |
| ω2 R0 [C] | 0.470 | 0.148 | 31.4 | 77.5 |
| ω2 kin tIgG [C] | 0.129 | 0.0203 | 15.7 | 37.1 |
| ω2 Emax [C] | 0.0366 | 0.00805 | 22.0 | 19.3 |
a Confidence interval is calculated as Estimate +/- 1.96*Standard error
b For variance: coefficient of variation (%CV), calculated as sqrt(exp(ω2)-1)*100; For covariance: correlation coefficient (Corr.), calculated as (ωx, y / (sqrt(exp(ω2x)-1) * sqrt(exp(ω2y)-1)))
c Estimated during clinical [C] or translation [T] PKPD model development
The fixed allometric scaling factors (Eq. 2; Table 1) were included in the model as a preparation step for subsequent translational PKPD predictions. These relationships were assumed to hold and were not evaluated based on the clinical PKPD data. The FcRn concentration was scaled with a scaling coefficient of 0.25, to mimic anticipated FcRn degradation scaling with coefficient − 0.25 with a body weight independent synthesis rate. During translational model development, this implementation was evaluated.
PK (Figure S1) and PD (Fig. 2) goodness-of-fit plots show that the model was able to adequately describe the clinical PKPD data simultaneously for efgartigimod. All parameters were estimated with good precision (Table 1). The strongest parameter correlation was − 0.95 between VP2 and Q, and the eta shrinkage was larger than 30% only for the IIV on the FcRn concentration (i.e. 37%). Total IgG concentrations were modelled and were, during post-postprocessing, also calculated as a percentage relative to pre-dose for interpretation purposes. From the individual fit plots for PK (Fig. 3; left panel), relative tIgG (Fig. 3; right panel) and tIgG (Figure S2; left panel), it was clear that the model was able to capture the observed PK and PD profiles for all dose groups. NPC evaluation showed that the model was predictive for both the PK and PD since the observed percentiles of the NPCs lied within the 95% confidence intervals of the predicted percentiles (Figure S3). At the later time-points in the individual PK fit plots (Fig. 3; left panel) and for the lower concentrations in the residuals versus prediction plots (Figure S1; bottom right panel), a seeming model under-prediction was noted. This was not considered a bias, but rather the result of data censoring below the limit of quantification. To visualize this process, serum efgartigimod predictions and corresponding NPDEs were obtained for all (and BQL and non BQL) PK samples using the M3 method [35], based on a MAXEVAL = 0 (no parameter re-estimation, with empirical bayes estimate adjustment allowed) model run. Based on this analysis, it is clear that the seeming PK bias was strictly due to data censoring, since this was no longer observed when including the BQL samples (Fig. 4). Parameter re-estimation including the BQL samples led to model instability and was not pursued further.
Fig. 2.

Goodness-of-fit of the total IgG serum concentration for the clinical PKPD model. Red line: Loess smooth through data; Dashed line: line of identity (A and B) or line indicating 0 (C and D)
Fig. 3.

Individual PKPD fit plots panelled by treatment group for the clinical PKPD model. DV: observations; PRED: population predictions; IPRED: individual predictions. For interpretation purposes, relative change from pre-dose is shown up to a maximum of 150%, excluding three outlying values from the plot. All data points are included in the individual tIgG fit plots (Figure S2; left panel)
Fig. 4.
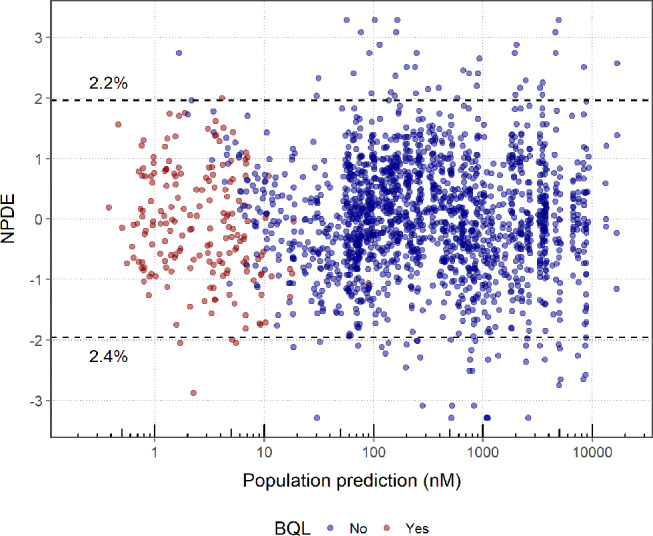
NPDE versus population prediction for the efgartigimod serum concentration for the clinical PKPD model including the prediction for BQL PK samples. Normalized prediction distribution errors (NPDEs) follow a standard normal distribution: it is anticipated that 2.5% of the data should fall above and below the dashed lines at +/- 1.96. The percentages listed in the plot indicate the actual percentages of NPDEs outside these ranges
Translational FcRn binding model for efgartigimod
The translational PKPD model was developed based on 1597 / 194 / 889 / 35 PK samples and 809 / 151 / 492 / 59 PD samples in monkeys / rabbits / rats / mice, respectively. These samples were obtained from 116 cynomolgus monkeys, 23 rabbits, 192 rats and 12 mice. 477 non-clinical PK samples were BQL, and not included in the analysis. PKPD samples were ignored from the time of ADA detection onward within an animal, as an influence of ADA on the PKPD of efgartigimod was apparent for non-clinical data during initial exploratory analysis, and quantification of this influence was outside the scope of the present analysis.
As the overall variability in the non-clinical data was larger than in the clinical data, this was accounted for in the models through the implementation of an estimated factor on the residual error for both the PK and total IgG. In the final translational model, the non-clinical residual variance for PK and tIgG was 6 and 3-fold higher, respectively, than the clinical residual variance.
For monkeys, data after sc administration were available. These data were well described when implementing a first order (without zero order rate) absorption which was 78% faster than for healthy volunteers. The sc bioavailability was estimated to be 81% for monkeys.
In the clinical model, the following parameters were implemented to be body weight dependent: CL, Q, Q2, VC, VP, VP2, R0, kout and Emax. Therefore, this model could be applied directly to predict the PKPD data in the non-clinical species, with only estimating the monkey sc parameters, without re-estimating other parameters. During this step, the in vitro KD for FcRn binding at pH 7.4 was implemented to be species-specific, based on in vitro measurements (Table 1), with fixed in vivo scaling factor (value of 2.1) estimated from the clinical model, thus keeping the in vitro affinity ranking between species intact. The results of initial prediction of non-clinical data based on the scaled clinical model were difficult to interpret, given the large differences in observed baseline tIgG values between species: the observed tIgG values were highest in monkeys (156 µM), followed by humans (63 µM), rabbits (46 µM), rats (11 µM) and mice (0.3 µM), excluding the option to account for these differences purely by allometric scaling. Attempts to estimate a species-specific synthesis rate to account for these differences often resulted in numerical instability, especially due to the very low total IgG levels in mice, versus other species. Therefore, it was decided to fix these synthesis rates for the non-clinical species to result in a predicted baseline corresponding with the median observed baseline total IgG per species. Based on the observed median baseline and the median body weight per species (3.2 kg, 4.14 kg, 0.274 kg and an assumed 0.02 kg, for monkeys, rabbits, rats and mice, respectively), the factor difference versus the human synthesis rate, needed to match these median baselines after accounting for allometric scaling of the IgG degradation rate, were derived and fixed in the model (Table 1). If the scaling assumptions would hold perfectly, this would mean that these factors would all be equal to one. These assumptions appeared to hold between humans (factor of one by definition), rabbits (50% relatively higher kin versus humans) and rats (30% relatively lower kin versus humans). However, for monkeys, the IgG synthesis rate was more than five fold larger than in humans, after accounting for allometric scaling, while for mice, this rate was relatively more than 30 fold lower than in humans. Given that IIV is implemented on the IgG synthesis rate, the model allowed the flexibility for each animal to deviate from the fixed population synthesis rate.
After accounting for unexplained baseline tIgG differences, the prediction of the non-clinical PKPD data was re-evaluated: parameter estimates from the clinical PKPD model were kept fixed (except for sc absorption), and the non-clinical data were predicted via allometric scaling of body weight dependent parameters and by accounting for species-specific in vitro target binding affinity. During this step, some bias was still observed and during subsequent translational model development, species-specific effects on the (non-drug effect) model parameters were allowed in the model where needed to resolve the remaining bias, guided by individual random effect plots. As a result, only a few parameters were species-specific which mainly described unexplained PK differences, while the majority of parameters were shared across species, including the parameters which describe the total IgG lowering effect of efgartigimod. The corresponding added effects were:
± 30% lower relative (after accounting for allometric scaling) clearance for rabbits versus monkeys and humans.
± 2 fold higher relative clearance for rats and mice (shared estimate) versus monkeys and humans.
± 3 and ± 7 fold lower VP/VP2 for rats and mice, respectively, versus other species.
± 8 fold higher relative FcRn concentration for monkeys versus other species.
Given the limited rodent PK data, especially in mice, it is difficult to judge whether distribution is truly different in these species, or whether the lower volumes serve as a surrogate to capture other unexplained species differences. In addition, estimating the allometric scaling factors did not significantly improve the fit.
In contrast to all other studies, it was apparent that the tIgG levels increased during the course of the 4-week subchronic toxicity study in rats, which led to a strong bias in the PD profiles for this study following initial prediction. Investigation into the mechanistic reasons, including possible developmental/immunological changes for these rats during the study, was considered beyond the scope of the present analysis. One descriptive study effect was allowed in the model to account for this behaviour, which led to the adequate prediction of the PKPD data within this study, using the translational model. Initially, the translational model was developed without this study. In a final step, data from this study were included and the rodent parameters were re-estimated while all non rodent parameters were fixed. In this model, the slope was estimated, which allowed the tIgG degradation to decrease in function of time for rats in the 4-week subchronic toxicity study according to Eq. 3.
 |
3 |
which is a modification of Eq. 2, where the tIgG degradation changes as a function of time t with estimated slope parameter.
After accounting for these differences, and without including descriptive species-specific drug effect differences, the PK and tIgG dynamics were well-described by the translational model. No large remaining differences between species were apparent for the PK (Fig. 5; left panel) and PD residuals (Fig. 5; right panel), and for the individual random effects (Figure S4). The goodness-of-fit plots showed an overall adequate fit of the PK (Figure S5) and PD (Figure S6) for the complete dataset. Based on the individual PK (Fig. 6; left panel), relative tIgG (Fig. 6; right panel) and tIgG (Figure S2; right panel) fit plots for monkeys after single dose (shown specifically because rich PKPD profiles were available for these studies), it was clear that the translational model was able to capture the observed PK and PD profiles for these dose groups. The parameters added during the translational step were estimated with good precision (Table 1) and no relevant parameter correlations were noted.
Fig. 5.

Boxplots of the serum efgartigimod (left) and tIgG (right) residuals by species for the translational PKPD model. Box plots show the median (black line at center of box) and its approximate 95% confidence interval (grey area), the inter-quartile range (box), the 1.5x inter-quartile range (whiskers) and outliers (stars) defined as values outside the 1.5x inter-quartile range
Fig. 6.

Individual PKPD fit plots for sd data in cynomolgus monkeys panelled by treatment group for the translational PKPD model. DV: observations; PRED: population predictions; IPRED: individual predictions
Discussion
The pH 7.4 binding model adequately describes the PKPD of efgartigimod over a broad range of doses and in different species
The serum efgartigimod and tIgG concentrations were well-characterized after single and repeated iv and sc administration in healthy volunteers, monkeys, rabbits, rats and mice, using a semi-mechanistic approach by incorporating FcRn binding in the PKPD model (Fig. 1). In a stepwise process, the model was built initially on healthy volunteer data only. Subsequently, all clinical structural and random effect parameters were fixed, and used to predict non-clinical data. In the translation step, differences in in vitro binding affinity between species were taken into account, as well as allometric scaling of the parameters related to efgartigimod disposition, (intrinsic and drug related) tIgG degradation and FcRn concentration using well-accepted scaling coefficients [23]. Although mAbs have often been scaled successfully between species using a coefficient for clearance of 0.8–0.9 [24], a CL scaling factor of 0.75 was predictive for efgartigimod. When estimating this scaling factor, values close to 0.75 were obtained, and this parameter was subsequently fixed to 0.75 in the model. Possibly, given that glomerular filtration rate scales well with a factor of 0.75 [23], this is due to the anticipated contribution of renal filtration (and subsequent catabolism in kidney cells) to the total elimination of this 54 kDa antibody fragment. Body weight was not predictive for the species differences in baseline tIgG concentrations. Therefore, a species-specific population IgG synthesis rate was fixed in the model based on the observed baseline tIgG levels and the allometric scaled tIgG degradation rate. As efgartigimod does not influence the production rate of IgG, it was considered justifiably to fix these rates, since in itself, prediction of the individual baseline total IgG value is not of importance, but rather the prediction of the subsequent PD dynamics following efgartigimod administration. During translational model development, PK parameters were allowed to be species-specific where needed to obtain good individual PK predictions in animals. However, the drug effect parameters, such as the in vivo KD factor and the parameter determining the shape between receptor occupancy and drug effect, were not allowed to be different between species. In addition, the maximal increase in the tIgG degradation rate was allowed to scale with body weight in the same way as the drug-independent IgG degradation rate, without including any species-specific parameters. The translation step was deemed successful, since after accounting for unexplained baseline tIgG differences and minimal unexplained PK differences, the PKPD model was able to well-predict the drug effect of efgartigimod in the different species.
The proposed fate of efgartigimod in the body based on insights from the PKPD binding model
The efgartigimod PKPD binding model was a three compartmental model with target binding in the central and first peripheral compartment. The FcRn concentration was assumed to be similar between the central and peripheral compartments and was estimated at 53.6 nM for a typical 78 kg healthy volunteer. This value corresponded well with reported FcRn tissue expression data, where average FcRn concentrations were found to range between 3.3 and 230.7 pmol per gram of tissue (or 3.3 to 230.7 nM) across 14 human tissues [12]. During model building, FcRn turnover was removed to improve stability. It was assumed that this process was not quantifiable, due to the absence of information in the data. However, it is anticipated that FcRn up- or downregulation would have a minor impact on the PKPD data given that the FcRn capacity is quite large. Unbound drug was cleared from the central compartment with an estimated clearance for a typical 78 kg healthy volunteer of 0.143 L/h. This parameter was more than 10-fold higher than reported for a typical mAb (0.15 mL/h/kg [22], or 0.012 L/h/78kg). In contrast to a mAb, efgartigimod is potentially small enough (54 kDa) to allow significant renal filtration [18–20]. This hypothesis is supported by a relatively high exposure of efgartigimod in kidney observed in murine biodistribution experiments for efgartigimod (data not shown), while this is not apparent for mAbs [36]. If this occurs, it would be expected that efgartigimod is mainly catabolized in the proximal tubular endothelial cells once filtered [20], depending on the efficiency of potential FcRn recycling from kidney cells back to the blood. Therefore, mechanistic models predicting the PK of mAbs and incorporating FcRn binding [30–32], are not expected to be applicable for efgartigimod. Even though renal filtration could be important for efgartigimod, this does not necessarily mean that a significant amount is excreted and thus measurable in the urine, given that efgartigimod might be catabolized substantially in kidney cells and thus would not reach urine in an intact form. In this analysis, urine PK data was not included. The volume of distribution at steady state for efgartigimod was 142 mL/kg and 111 mL/kg, based on all compartments and on compartments where target binding (and thus tIgG interaction) occurs in the model, respectively. Interestingly, the total steady state volume of efgartigimod was larger than a typical mAb, while the combined distribution volume of the two binding compartments was similar to a typical mAb [22]. This observation suggests that efgartigimod might have a larger distribution volume than a typical IgG, and that absence of FcRn binding (and consequently absence of drug effect) from the second peripheral compartment is a reflection of this.
Even though the clearance of efgartigimod is relatively high, reported terminal half-lives based on non-compartmental analysis were reported to range between 3.5 and 4.3 days in healthy volunteers from NCT03457649 after single iv administration of 2–50 mg/kg [5]. No drug accumulation was reported upon repeated dosing of 10 and 25 mg/kg q7d dosing for 22 days and 10 mg/kg q4d dosing for 21 days. Interestingly, for the lowest dose group, 0.2 mg/kg, a longer terminal half-life was reported (5.8 days) and the average Cmax appeared to increase more than dose proportionally: 9.05, 17.4, 20.9, 21.8 and 23.5 µg/mL/mg/kg after single dose of 0.2, 2, 10, 20 and 50 mg/kg, respectively. These observations are consistent with the hypothesis that target binding influences the PK of efgartigimod:
Unbound drug is cleared rapidly as evident from the rapid reduction in serum concentrations following dosing,
The dose-dependent Cmax results from saturable rapid target-drug complex formation, while only unbound drug can be measured: as the dose is increased, saturation of the target results in a higher fraction of unbound drug.
The terminal PK phase is influenced by target binding with dissociation of the complex as the rate limiting step.
The resulting observed PK profile of efgartigimod is characterized by an initial steep decline, followed by a gradual decrease in slope over time in the form of a multi phasic profile (Fig. 3 left panel) until the terminal phase is reached at low concentrations.
These observed PK trends were captured by the efgartigimod target binding model. The behaviour of this model is illustrated via a typical healthy volunteer simulation following four weekly iv doses of 0.1 and 10 mg/kg (Fig. 7). The unbound (measurable in the assay) drug predictions showed a two-fold lower Cmax at the end of the first 1 h infusion, consistent with the reported observed dose-dependent trend [5]. For the 10 mg/kg dose group, the target is approximately saturated during the 4-week dosing period, as the bound drug predictions approximate the estimated target concentration of 53.6 nM (Table 1). Consequently, unbound drug concentrations exceed the bound drug concentrations when target is saturated. In contrast, target saturation is not reached for the 0.1 mg/kg dose and unbound drug concentrations remain below the predicted bound concentrations. After the last 10 mg/kg dose, drug concentrations decrease with a gradual decline in slope up to 6 days after last dose when the terminal phase is reached. At concentrations below 2 nM, the terminal phase is reached and drug concentrations decline in parallel for the two dose groups.
Fig. 7.
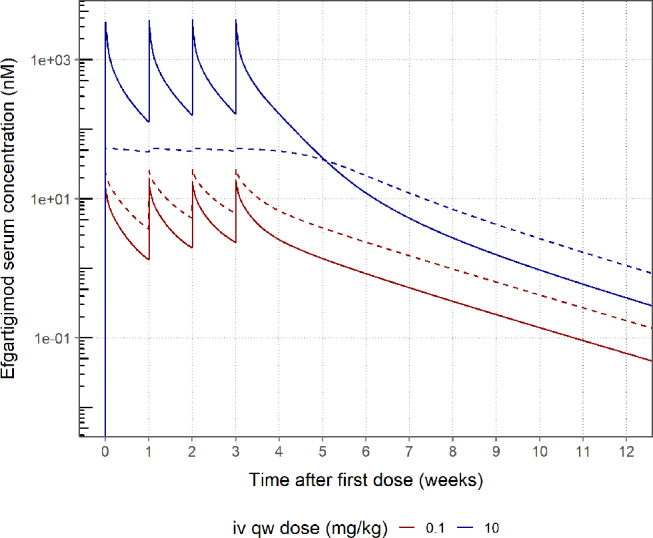
Typical healthy volunteer simulation of the bound and unbound efgartigimod concentration after 4 weekly iv doses of 0.1 and 10 mg/kg. Predicted unbound (solid line) and target-bound (dashed line) serum efgartigimod concentration
During model building, it was hypothesized that target binding affinity at neutral pH might be a good predictor of the PK of efgartigimod, since efgartigimod bound to cell-surface-FcRn might offer protection from renal elimination. The KD of efgartigimod for target binding at neutral pH determined in vitro was 8.56, 14.5, 310, 1.89 and 0.63 nM for humans, monkeys, rabbits, rats and mice, respectively. Interestingly, the observed PK profiles differed greatly between species (Fig. 8). The PK profile of efgartigimod appeared biphasic without steep decline in rabbits, suggesting a smaller influence of target binding consistent with the poor binding affinity. For monkeys, the profiles were multiphasic similar as in humans, consistent with a similar FcRn affinity (at neutral pH) between these species. For mice and rats, the profile was characterized by a strong initial decline suggesting strong target binding, consistent with the low in vitro KDs for these species. To test the importance of target binding affinity as a driver of efgartigimod PKPD, the clinical model was challenged with non-clinical data. In this approach, the in vitro specific-specific binding affinity was incorporated in the model and multiplied by the same in vivo KD factor for all species, which was estimated using the clinical data. By incorporating the specific-specific binding information, the large PK species differences were captured by the model (Fig. 8). When the translational model was re-fitted assuming the same (human) in vivo KD across species, the drug effect was over -and underpredicted for rabbits and mice, respectively (Fig. 9 and S7). Thus, to successfully describe the PKPD of efgartigimod, the poor and strong binding affinity for rabbits and mice FcRn, respectively, should not be ignored. Of note, even when accounting for the species-specific in vitro affinity, some bias remained in the tIgG profiles (left panels for Fig. 9 and S7). This was considered acceptable, since the translational assessment was mainly a prediction based on the scaled clinical model without full flexibility per non-clinical species, with more variable mice, rat and rabbit data.
Fig. 8.

Individual PK fit plots for 2-20-100 mg/kg sd data in rabbits, cynomolgus monkeys, rats and mice. Monkey data shown only up to 14 days for clarity
Fig. 9.

Individual fit plots of the IgG relative to pre-dose for rabbits panelled by group for the translational PKPD model (left) and a variant of this model where the in vitro KD is assumed equal between humans and rabbits (right). DV: observations; PRED: population predictions; IPRED: individual predictions
The sustained tIgG lowering effect of efgartigimod is driven by target receptor occupancy and is consistent between species based on in vitro – in vivo affinity scaling
Total IgG was described via a turnover model with estimated synthesis rate and degradation rate constant. tIgG degradation increased with efgartigimod-driven receptor occupancy. The model predicts that the elimination half-life of tIgG is approximately 15 days in the absence of efgartigimod, and 3.6 days at maximal receptor occupancy. These values are plausible, since tIgG is a mixture of the four IgG subtypes with half-lives ranging between 7 and 21 days [37], and since large proteins that do not benefit from FcRn recycling such as IgA, IgD and IgM have an approximate half-life of 3–6 days [20], in line with the predicted 3.6 days in the model. The link between exposure and drug effect is mediated by the FcRn receptor occupancy at pH 7.4, predicted in the central and first peripheral compartment as visualized in Fig. 10. In the absence of drug, FcRn is not occupied (drug effect is 0%), while at 100% receptor occupancy, the effect on the degradation rate constant is maximal. The model predicts that an FcRn receptor occupancy at pH 7.4 of more than 50% is required to observe a meaningful drug effect, while between 75 and 100% receptor occupancy, a steep increase in effect is expected. This relationship is identical between species, while the in vivo KD was species-specific according to in vitro binding differences.
Fig. 10.

Visualization of the predicted relationship between the FcRn receptor occupancy at pH 7.4 and corresponding drug effect as determined by the estimated γ parameter
Translational population PKPD analysis using in vitro – in vivo binding affinity and allometric scaling was successful in describing the PKPD of efgartigimod. By integrating all available data, the rich clinical and single dose monkey data were leveraged to predict the sparse rodent and repeated dose non-clinical PKPD data. By leveraging the inherent species differences, integrated non-clinical data could be used to support the understanding of the PKPD of efgartigimod across non-clinical species. The use of the translational model now allows simulations in desired model species to support of non-clinical study designs. Finally, the predictions via the translational population PKPD model were validated with clinical results.
Electronic supplementary material
Below is the link to the electronic supplementary material
Acknowledgements
We thank Gwenda Pynaert and many members of the Bioanalytical team for providing the bioanalytical data.
Author contributions
Sven Hoefman performed the analysis. Judith Baumeister, Tamara van Steeg and Ingrid Ottevaere provided input to the analysis. Judith Baumeister and Sven Hoefman defined the objectives and assumptions for the analysis. Stefaan Rossenu contributed to writing of the manuscript and critically reviewed the data and supported interpretation. All authors contributed to writing the manuscript.
Funding
This study was supported by argenx.
Data availability
No datasets were generated or analysed during the current study.
Declarations
Competing interests
Sven Hoefman and Tamara van Steeg are consultants at LAP&P. Judith Baumeister and Stefaan Rossenu are employees of argenx. Ingrid Ottevaere was an employee of argenx at the time of the study. This study was supported by argenx.
Footnotes
Publisher’s note
Springer Nature remains neutral with regard to jurisdictional claims in published maps and institutional affiliations.
References
- 1.Akilesh S, Christianson GJ, Roopenian DC, Shaw AS (2007) Neonatal FcR expression in bone marrow-derived cells functions to protect serum IgG from catabolism. J Immunol 179:4580–4588. 10.4049/jimmunol.179.7.4580 [DOI] [PubMed] [Google Scholar]
- 2.Latvala S, Jacobsen B, Otteneder MB et al (2017) Distribution of FcRn Across Species and tissues. J Histochem Cytochem 65:321–333. 10.1369/0022155417705095 [DOI] [PMC free article] [PubMed] [Google Scholar]
- 3.Roopenian DC, Akilesh S (2007) FcRn: the neonatal fc receptor comes of age. Nat Rev Immunol 7:715–725. 10.1038/nri2155 [DOI] [PubMed] [Google Scholar]
- 4.Ward ES (2003) Evidence to support the cellular mechanism involved in serum IgG homeostasis in humans. Int Immunol 15:187–195. 10.1093/intimm/dxg018 [DOI] [PubMed] [Google Scholar]
- 5.Ulrichts P, Guglietta A, Dreier T et al (2018) Neonatal fc receptor antagonist efgartigimod safely and sustainably reduces IgGs in humans. J Clin Invest 128:4372–4386. 10.1172/JCI97911 [DOI] [PMC free article] [PubMed] [Google Scholar]
- 6.Guptill JT, Sleasman JW, Steeland S et al (2022) Effect of FcRn antagonism on protective antibodies and to vaccines in IgG-mediated autoimmune diseases pemphigus and generalised myasthenia gravis. Autoimmunity 55:620–631. 10.1080/08916934.2022.2104261 [DOI] [PubMed] [Google Scholar]
- 7.Argenx (2022) VYVGART. Prescribing information. https://www.argenx.com/product/vyvgart-prescribing-information.pdf
- 8.Argenx (2023) VYVGART HYTRULO. Prescribing information. https://www.argenx.com/product/vyvgart-hytrulo-prescribing-information.pdf
- 9.Suzuki S, Uzawa A, Murai H (2022) Efgartigimod for generalized myasthenia gravis with or without anti-acetylcholine receptor antibodies: a worldwide and Japanese perspective. Expert Rev Clin Immunol 18:1207–1215. 10.1080/1744666X.2022.2136167 [DOI] [PubMed] [Google Scholar]
- 10.Heo Y-A (2022) Efgartigimod: first approval. Drugs 82:341–348. 10.1007/s40265-022-01678-3 [DOI] [PMC free article] [PubMed] [Google Scholar]
- 11.Argenx (2023) VYVGART Product Monograph
- 12.Fan YY, Farrokhi V, Caiazzo T et al (2019) Human FCRN tissue expression profile and half-life in PBMCS. Biomolecules 9:1–10. 10.3390/biom9080373 [DOI] [PMC free article] [PubMed] [Google Scholar]
- 13.Andersen JT, Sandlie I (2009) The versatile MHC class I-related FcRn protects IgG and albumin from degradation: implications for development of new diagnostics and therapeutics. Drug Metab Pharmacokinet 24:318–332. 10.2133/dmpk.24.318 [DOI] [PubMed] [Google Scholar]
- 14.Knudsen Sand KM, Bern M, Nilsen J et al (2015) Unraveling the interaction between FcRn and albumin: opportunities for design of albumin-based therapeutics. Front Immunol 6:1–21. 10.3389/fimmu.2014.00682 [DOI] [PMC free article] [PubMed] [Google Scholar]
- 15.Junghans RP, Anderson CL (1996) The protection receptor for IgG catabolism is the β2-microglobulin-containing neonatal intestinal transport receptor. Proc Natl Acad Sci U S A 93:5512–5516. 10.1073/pnas.93.11.5512 [DOI] [PMC free article] [PubMed] [Google Scholar]
- 16.Simister NE, Mostov KE (1989) An fc receptor structurally related to MHC class I antigens. Nature. 10.1038/337184a0 [DOI] [PubMed] [Google Scholar]
- 17.Lin J (2009) Pharmacokinetics of Biotech drugs: peptides, proteins and monoclonal antibodies. Curr Drug Metab 10:661–691. 10.2174/138920009789895499 [DOI] [PubMed] [Google Scholar]
- 18.Venkatachalam MA, Rennke HG (1978) The structural and molecular basis of glomerular filtration. Circ Res 43:337–347. 10.1161/01.RES.43.3.337 [DOI] [PubMed] [Google Scholar]
- 19.Deen WM, Lazzara MJ, Myers BD (2001) Structural determinants of glomerular permeability. Am J Physiol - Ren Physiol. 10.1152/ajprenal.2001.281.4.f579. 281: [DOI] [PubMed] [Google Scholar]
- 20.Lobo ED, Hansen RJ, Balthasar JP (2004) Antibody pharmacokinetics and pharmacodynamics. J Pharm Sci 93:2645–2668. 10.1002/jps.20178 [DOI] [PubMed] [Google Scholar]
- 21.Davies B, Morris T (1993) Physiological parameters in laboratory animals and humans. Pharm Res 10:1093–1095 [DOI] [PubMed] [Google Scholar]
- 22.Betts A, Keunecke A, van Steeg TJ et al (2018) Linear pharmacokinetic parameters for monoclonal antibodies are similar within a species and across different pharmacological targets: a comparison between human, cynomolgus monkey and hFcRn Tg32 transgenic mouse using a population-modeling approach. MAbs 10:751–764. 10.1080/19420862.2018.1462429 [DOI] [PMC free article] [PubMed] [Google Scholar]
- 23.Rowland M, Tozer TN (2011) Clinical pharmacokinetics and pharmacodynamics: concepts and applications, 4th edn. Lippincott Williams & Wilkins
- 24.Han C, Zhou H (2011) Monoclonal antibodies: interspecies scaling with minimal preclinical information. Ther Deliv 2:359–368. 10.4155/tde.11.1 [DOI] [PubMed] [Google Scholar]
- 25.Levy G (1994) Pharmacologic target-mediated drug disposition. Clin. Pharmacol. Ther [DOI] [PubMed]
- 26.Peletier LA, Gabrielsson J (2012) Dynamics of target-mediated drug disposition: characteristic profiles and parameter identification. J Pharmacokinet Pharmacodyn 39:429–451. 10.1007/s10928-012-9260-6 [DOI] [PMC free article] [PubMed] [Google Scholar]
- 27.Gibiansky L, Gibiansky E, Kakkar T, Ma P (2008) Approximations of the target-mediated drug disposition model and identifiability of model parameters. J Pharmacokinet Pharmacodyn 35:573–591. 10.1007/s10928-008-9102-8 [DOI] [PubMed] [Google Scholar]
- 28.Mager DE, Krzyzanski W (2005) Quasi-equilibrium pharmacokinetic model for drugs exhibiting target-mediated drug disposition. Pharm Res. 10.1007/s11095-005-6650-0 [DOI] [PubMed] [Google Scholar]
- 29.Shah DK, Betts AM (2012) Towards a platform PBPK model to characterize the plasma and tissue disposition of monoclonal antibodies in preclinical species and human. J Pharmacokinet Pharmacodyn 39:67–86. 10.1007/s10928-011-9232-2 [DOI] [PubMed] [Google Scholar]
- 30.Jones HM, Zhang Z, Jasper P et al (2019) A physiologically-based pharmacokinetic model for the prediction of monoclonal antibody pharmacokinetics from in Vitro Data. CPT Pharmacometrics Syst Pharmacol 8:738–747. 10.1002/psp4.12461 [DOI] [PMC free article] [PubMed] [Google Scholar]
- 31.Li T, Balthasar JP (2019) Development and evaluation of a physiologically based Pharmacokinetic Model for Predicting the effects of Anti-FcRn Therapy on the Disposition of endogenous IgG in humans. J Pharm Sci 108:714–724. 10.1016/j.xphs.2018.10.067 [DOI] [PubMed] [Google Scholar]
- 32.Li T, Balthasar JP (2019) Application of physiologically based pharmacokinetic modeling to predict the effects of FcRn inhibitors in mice, rats, and monkeys. J Pharm Sci 108:701–713. 10.1016/j.xphs.2018.10.065 [DOI] [PubMed] [Google Scholar]
- 33.Xiao JJ (2012) Pharmacokinetic models for FcRn-mediated IgG disposition. J Biomed Biotechnol 2012:. 10.1155/2012/282989 [DOI] [PMC free article] [PubMed]
- 34.Nguyen THT, Mouksassi MS, Holford N et al (2017) Model evaluation of continuous data pharmacometric models: Metrics and graphics. CPT Pharmacometrics Syst Pharmacol. 10.1002/psp4.12161 [DOI] [PMC free article] [PubMed] [Google Scholar]
- 35.Bauer RJ (2019) NONMEM Tutorial Part II: Estimation Methods and Advanced Examples. CPT Pharmacometrics Syst Pharmacol. 10.1002/psp4.12422 [DOI] [PMC free article] [PubMed]
- 36.Yip V, Palma E, Tesar DB et al (2014) Quantitative cumulative biodistribution of antibodies in mice: Effect of modulating binding affinity to the neonatal fc receptor. MAbs 6:689–696. 10.4161/mabs.28254 [DOI] [PMC free article] [PubMed] [Google Scholar]
- 37.Morell A, Terry WD, Waldmann TA (1970) Metabolic properties of IgG subclasses in man. J Clin Invest 49:673–680. 10.1172/JCI106279 [DOI] [PMC free article] [PubMed] [Google Scholar]
Associated Data
This section collects any data citations, data availability statements, or supplementary materials included in this article.
Supplementary Materials
Data Availability Statement
No datasets were generated or analysed during the current study.